Embed Size (px)
Citation preview

The Chartered Institute of BuildingThe Chartered Institute of Building (CIOB) represents for the public benefit the most diverse set of professionals in the construction industry.
Crime in the construction industry

Table of contentsExecutive summary 3
Introduction 4
Background information 4
Common crimes in construction 5
Organised crime and construction 5
Methodology 6
The sample 6
Results 7
Discussion 33
Crime in the construction industry 33
The cost of crime in the industry 33
Crime against property 34
Serious crime 34
Off-site crime 34
Prevention 35
Recommendations 35
2 3

2 3
Executive summaryIt is not surprising that the most common forms of crime in the construction industry are theft, vandalism and health and safety neglect. These crimes contribute to the UK industry suffering millions of pounds worth of losses every year. These costs relate to not only the crimes themselves but also the resulting financial penalties, such as increased insurance premiums and project delays.
This research examines the scale and impact of crime on the construction industry and highlights the key areas of concern for senior level construction workers. Theft is the most common crime; 21% of respondents state that they experience theft each week and, overall, 92% are affected weekly, monthly or yearly. This indicates that the industry needs to seriously consider the prevention of theft and ensure that construction workers know how to deal with it appropriately.
The results also show that most respondents (90%) are aware of health and safety neglect occurring. 60% state that it happens at least monthly, which is particularly worrying considering the possible consequences of such neglect. The safety of employees should be of the highest priority in the construction industry; the survey reveals a clear need to investigate this issue further.
The construction industry is also susceptible to attack from organised crime, which can have a very severe effect on those targeted. It is often difficult to ignore or refuse these criminal demands, whether they involve forcing security services on a project or finding alternative ways to make money from the industry. This issue has affected some areas more than others: Scotland, Northern Ireland and the north west of England have been particularly hard hit. However, there is evidence to suggest that the problem is not confined to these areas and the survey responses imply that these crimes are somewhat underreported.
The impact of crime varies considerably. Some respondents indicate that they have been very lucky in encountering hardly any crime throughout their construction careers. However, there are some cases where crime has resulted in financial damages and loss of life. Thankfully, these most serious occurrences are rare but that does not mean that their importance should be underplayed.
By Laura Warne, Research Officer

4 5
Introduction Background informationThe Chartered Institute of Building (CIOB) is the leading professional body for managers in the global construction industry. Established in 1834, the CIOB continues to lead the way in establishing, promoting and maintaining standards of excellence in the sector.
The CIOB draws its members from a wide range of professional disciplines, from across the building and construction supply chains. These include clients, consultants and contractors, as well as specialists in regulation, research and education.
The purpose of this research is to investigate the scale and impact of crime in the construction industry. Through the perception of construction professionals, it examines which crimes are most prevalent and what effect they have on the industry. The research also examines the industry’s response to crime and considers the effectiveness of crime prevention methods.
This research will attempt to identify which crimes have the biggest effect on the industry, in terms of cost and working environment, and how construction workers should address crime when it occurs.
The construction industry is very susceptible to crime. Factors such as the constant turnover of staff, the mobility of the workforce and the temporary nature of project work make the industry an easy target for both opportunistic petty criminals and serious organised crime.
Crime in the industry is varied and often reflects the location of the project. Comments throughout the survey indicate that construction sites tend to be more often targeted in cities and heavily populated areas, where an array of criminal acts occur – from theft to security racketeering.
The nature of the construction workforce is also a factor that needs to be considered when examining crime in the industry. There are many temporary workers onsite, contracted for specific elements on a project. These numbers are constantly changing from day to day and it is difficult to enforce a strict site-access policy. The survey indicates that conflicts often arise with subcontracted staff and that it is these temporary elements of the workforce who are frequently involved in theft on site and incidents of intimidation/assault. The results show that directly employed staff are less likely to commit criminal acts, which could reflect the perception that a higher level of corporate responsibility exists amongst this group.
The survey looks at a variety of crimes that have an impact on construction and identifies three areas that particularly affect the industry: theft, vandalism, and health and safety neglect.

4 5
Common crimes in construction
Theft and vandalism
It is estimated that the construction industry suffers a loss of more than £400 million a year due to vandalism and theft1, although it is hard to get an accurate figure as many of these crimes go unreported.
The theft of plant poses a particular problem to the industry; the replacement of expensive equipment could lead to a project incurring substantial and unforeseen costs. In the current economic climate, police forces have warned companies to protect their equipment and prevention methods have proved successful.
The recovery rate for plant that has been stolen has improved in recent years. This is thanks to initiatives developed by membership organisation Construction Industry Theft Solutions (CITS), plus continuing collaboration with the police on crime prevention and the recovery of stolen goods. CITS recommends that site-owners perform risk assessments and register all plant and equipment with the Construction Equipment Security and Registration scheme (CESAR)2. This uses identification technology linked to a database to help track plant and equipment.
Taking such precautions will significantly reduce the risk of theft onsite and increase the chances of recovering any stolen equipment. This would ensure that companies waste no time and money on the selection and replacement of equipment, while also helping to minimise insurance premiums.
Health and safety neglect
In the survey, 90% of respondents indicate that they have witnessed health and safety neglect. Of those 90%, 20% say it occurs every week and 42% say it happens on a monthly basis. Health and safety compliance should be a top priority in the construction industry, which has been plagued by avoidable accidents occurring as a result of neglect.
There were 72 fatal injuries in the construction industry in the 2007/08 period, with similar statistics for each of the past five years3. Of course, this figure does not include the total number of accidents and illnesses caused by health and safety neglect in the same period. The industry needs to do more to comply with all health and safety regulations, to carry out risk assessments before work begins and to ensure accidents are prevented. This will help reduce the number of incidents and minimise the fines and possible prison sentences.
Organised crime and construction
Instances of organised crime in the industry appear to be rare, if not entirely unknown. Criminal organisations have acted as security guard companies, waste disposal organisations and gang masters providing forced, cheap labour. Paying for services offered by these organisations feeds into serious crime - you should always alert the police if you think such a criminal group has approached your site.
Rogue security
This research looks at rogue security companies and the effect they have on the construction industry.
Security in the industry is a prime target for organised criminals. In recent years, there have been a number of instances – particularly in Glasgow, Northern Ireland and Merseyside. Typically, these organisations force their services on to construction sites, which have little choice but to accept the security on offer. Damage to the site and threats of violence against staff have occurred when site managers tried to refuse these security services.
In an attempt to prevent rogue security guard companies from operating, there has been a crackdown by the police and Security Industry Association. Anyone not registered with the SIA faces possible imprisonment and a £5000 fine, to avoid such measure the SIA blue badges must be worn by all security. In the Merseyside area, Operation SEAHOG ran checks on security guards on site to send a clear message to the industry and security companies that guards must be registered with the SIA.
1 D. Edwards, Plant and equipment theft: a practical guide, 2007.2 Construction Industry Theft Solutions, Code of Practice.3 Health and Safety Executive, Fatal Injury Statistics, 2007/2008.

6 7
The survey was conducted using a web-based questionnaire, which respondents could access through the CIOB website (www.ciob.org.uk).
Respondents were asked general demographic questions regarding their age, gender, job level, sector, and the number of employees in their organisation.
An email was sent to 26,901 CIOB members, informing them that the survey was online. The survey was also available to the wider industry through the CIOB website.
There were both quantitative and qualitative questions in the survey, to allow respondents the opportunity to openly express their opinions.
The sample
The sample consisted of 1100 construction industry professionals, the majority (65%) of whom described themselves as management.
94% of respondents were male; 6% were female.
84% of respondents were located in the UK and 16% in the rest of the world.
38% of respondents work for an organisation that employs more than 500 people.
Methodology

1. Membership level
2. Location
There were respondents from all over the world; one fifth of respondents were located in Hong Kong. 6 7
ResultsSc
otla
nd
Irela
nd
Wal
es
Nor
th E
ast
Engl
and
Nor
th W
est
Engl
and
York
shire
East
Mid
land
s
Wes
t M
idla
nds
East
ern
Engl
and
Lond
on
Sout
h Ea
st
Sout
h W
est
Rest
of t
he w
orld
20%
15%
10%
5%
0%
6.5%
9.4%
3.5%
2.7%
8.5%
3.5%
5.5%
5.5%
5.5%
16.1%
8.6%
14.7%
9.9%
8.3%
Fellow
Member
Incorporated
Associate
Student
Non-member 37.4%
16.7%
10.6% 0.8%
26.2%

8 9
3. Age 4. GenderC
onsu
ltant
Dire
ctor
/sen
ior
man
agem
ent
Educ
atio
nalis
t
Mid
dle/
juni
or
man
agem
ent
Oth
er p
rofe
ssio
nal
Stud
ent
Supe
rviso
r
Trai
nee
Retir
ed
Oth
er
40%
30%
20%
10%
0%
11.1%
33.0%
1.5%
31.6%
9.8%
4.9%
1.5% 2.2%
0.6%
3.6%
5. Job level
0.9%
20 or under
21-30
31-40
41-50
51-60
60 and over
17.4%
31.6%
17.7%
6.7%
25.6%
93.6%
Male
Female
6.4%

8 9
Arc
hite
ctur
e &
Des
ign
Build
ing
Con
trol
& S
tand
ards
Hou
sing
Engi
neer
ing
Con
sulta
ncy
Gov
ernm
ent/
Loca
l Gov
ernm
ent
Educ
atio
n &
Tra
inin
g
Faci
litie
s m
anag
emen
t
Hea
lth &
Saf
ety
Plan
ning
Proc
urem
ent
Proj
ect
man
agem
ent
Site
man
agem
ent
Surv
eyin
g
Oth
er
30%
20%
10%
0%
4.5%
3.0%
8.7%
2.7% 4.8
%
4.2%
2.3% 3.3
%
1.6%
10.6%12
.4%13.4%
25.1%
1.6%
1.7%
Less
tha
n 20
21-5
0
51-1
00
101-
200
201-
500
Mor
e th
an 5
01
40%
30%
20%
10%
0%
20.5%
9.8%
9.2%
8.2%
14.6%
37.7%
6. Job Sector
7. How many people are employed in your organisation?

8.1 Arson
8.3 Bribery
10 11
8. In your experience, how common are the following crimes in your business or a project you have worked on?
8.2 Assault
8.4 Data loss/theft
0.8%
Very common (weekly)
Common (monthly)
Not very common (yearly)
Never
Don’t know
Other
12.3%
19.5%
11.0% 0.6%
55.8%
0.7%
Very common (weekly)
Common (monthly)
Not very common (yearly)
Never
Don’t know
Other
6.6%
24.1%
13.7%0.9%
53.9%
3.9%
Very common (weekly)
Common (monthly)
Not very common (yearly)
Never
Don’t know
Other
22.1%
18.5%
15.4%0.5%
39.7%
4.5%
Very common (weekly)
Common (monthly)
Not very common (yearly)
Never
Don’t know
Other
18.2%
19.0%
22.1%
0.6%
35.6%

10 11
8.5 Forced labour
8.7 Handling stolen goods
8.6 Fraud
8.8 Health and safety neglect
1.1%
Very common (weekly)
Common (monthly)
Not very common (yearly)
Never
Don’t know
Other
6.5%
40.5%
29.0%
0.2%
22.6%
3.2%
Very common (weekly)
Common (monthly)
Not very common (yearly)
Never
Don’t know
Other
17.6%
17.2%
19.5%
0.3%
42.3%
3.8%
Very common (weekly)
Common (monthly)
Not very common (yearly)
Never
Don’t know
Other
20.0%
19.5%
21.2%
0.5%
35.0%
19.6%
Very common (weekly)
Common (monthly)
Not very common (yearly)
Never
Don’t know
Other
41.6%
7.0%2.7% 0.2%
28.8%

12 13
8.9 Identity theft
8.11 Illegal waste disposal
8.10 Illegal drug dealing or use
8.12 Illegal working
1.3%
Very common (weekly)
Common (monthly)
Not very common (yearly)
Never
Don’t know
Other
7.5%
30.4%
33.1%
0.3%
27.5%
3.4%
Very common (weekly)
Common (monthly)
Not very common (yearly)
Never
Don’t know
Other
15.1%
22.5%
24.5%
0.6%
33.8%
7.2%
Very common (weekly)
Common (monthly)
Not very common (yearly)
Never
Don’t know
Other
27.5%
15.5%
12.8%0.5%
36.5%
7.7%
Very common (weekly)
Common (monthly)
Not very common (yearly)
Never
Don’t know
Other
22.1%
20.5%
18.4%
0.6%
30.6%

12 13
8.13 Intimidation
8.15 Money laundering
8.14 Kidnap/extortion
8.16 Racketeering
5.4%
Very common (weekly)
Common (monthly)
Not very common (yearly)
Never
Don’t know
Other
20.6%
18.8%
17.8%0.3%
37.1%
0.3%
Very common (weekly)
Common (monthly)
Not very common (yearly)
Never
Don’t know
Other
0.8%
55.4%
32.2%
0.7%10.6%
0.5%
Very common (weekly)
Common (monthly)
Not very common (yearly)
Never
Don’t know
Other
5.5%
40.2%
36.8%
0.7%
16.3%
0.9%
Very common (weekly)
Common (monthly)
Not very common (yearly)
Never
Don’t know
Other
4.1%
39.4%
36.7%
1.2%
17.7%

14 15
8.17 Theft 8.18 Vandalism
When comparing these results, it was shown that the majority of respondents have experienced theft (92%), vandalism (91%) and health and safety neglect (90%). Far fewer, although still a significant number, have experienced kidnap (11%) and money laundering or racketeering (22%).
20.5%
Very common (weekly)
Common (monthly)
Not very common (yearly)
Never
Don’t know
Other
42.7%
3.2% 4.5% 0.5%
28.7%18.8%
Very common (weekly)
Common (monthly)
Not very common (yearly)
Never
Don’t know
Other
42.8%
4.7% 3.6% 0.2%
29.8%

14 15
9. In general, what do you think has happened to the amount of crime in the construction industry in the last 12 months?
On further analysis: Of the respondents who think crime is increasing in the industry, comments show that the majority feel this is because of the economic climate, with more people needing to turn to illegitimate means to afford to live.
10. How much would you estimate in total that crime costs your company/site each year?
£0 -
£10
0
£101
- £
1,00
0
£1,0
01 -
£5,
000
£5,0
01 -
10,
000
£10,
001
- £5
0,00
0
£50,
001
- £1
00,0
00
Mor
e th
an £
100,
000
Don
’t kn
ow
30%
20%
10%
0%
4.7% 5.4
%
12.8% 13
.5%
20.3%
9.0%
8.9%
25.5%
31.1%
Increased
Decreased
About the same
Don’t know
8.4%
8.8%
51.7%
16 17
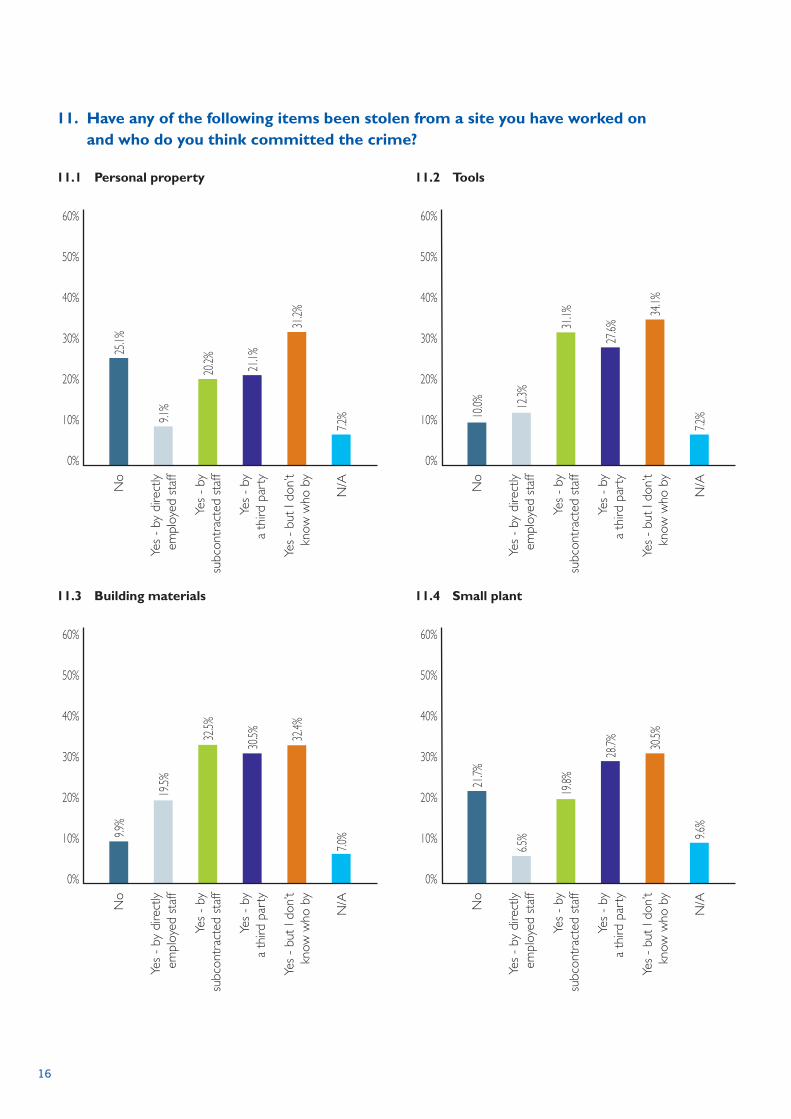
11.3 Building materials 11.4 Small plant
11. Have any of the following items been stolen from a site you have worked on and who do you think committed the crime?
11.1 Personal property 11.2 Tools
No
Yes
- by
dire
ctly
em
ploy
ed s
taff
Yes
- by
su
bcon
trac
ted
staf
f
Yes
- by
a
third
par
ty
Yes
- bu
t I d
on’t
know
who
by
N/A
60%
50%
40%
30%
20%
10%
0%
9.9%
19.5%
32.5%
30.5% 32
.4%
7.0%
No
Yes
- by
dire
ctly
em
ploy
ed s
taff
Yes
- by
su
bcon
trac
ted
staf
f
Yes
- by
a
third
par
ty
Yes
- bu
t I d
on’t
know
who
by
N/A
60%
50%
40%
30%
20%
10%
0%
25.1%
9.1%
20.2% 21.1%
31.2%
7.2%
No
Yes
- by
dire
ctly
em
ploy
ed s
taff
Yes
- by
su
bcon
trac
ted
staf
f
Yes
- by
a
third
par
ty
Yes
- bu
t I d
on’t
know
who
by
N/A
60%
50%
40%
30%
20%
10%
0%10
.0% 12.3%
31.1%
27.6%
34.1%
7.2%
No
Yes
- by
dire
ctly
em
ploy
ed s
taff
Yes
- by
su
bcon
trac
ted
staf
f
Yes
- by
a
third
par
ty
Yes
- bu
t I d
on’t
know
who
by
N/A
60%
50%
40%
30%
20%
10%
0%
21.7%
6.5%
19.8%
28.7% 30
.5%
9.6%

16 17
11.7 Handling equipment 11.8 Existing fixtures and fittings i.e. old fireplaces, lead piping, etc
Comparing the results regarding who committed theft, it was found that directly employed staff were not involved in the majority of cases. Building materials were the most common items stolen, closely followed by tools; only 10% say they have not experienced these items being stolen.
11.5 Heavy plant 11.6 Scrap materials
No
Yes
- by
dire
ctly
em
ploy
ed s
taff
Yes
- by
su
bcon
trac
ted
staf
f
Yes
- by
a
third
par
ty
Yes
- bu
t I d
on’t
know
who
by
N/A
60%
50%
40%
30%
20%
10%
0%
52.9%
0.6% 2.4
%
15.0%
13.5%
18.3%
No
Yes
- by
dire
ctly
em
ploy
ed s
taff
Yes
- by
su
bcon
trac
ted
staf
f
Yes
- by
a
third
par
ty
Yes
- bu
t I d
on’t
know
who
by
N/A
60%
50%
40%
30%
20%
10%
0%16
.5%
15.8%
24.4%
29.2%
27.6%
11.0%
No
Yes
- by
dire
ctly
em
ploy
ed s
taff
Yes
- by
su
bcon
trac
ted
staf
f
Yes
- by
a
third
par
ty
Yes
- bu
t I d
on’t
know
who
by
N/A
60%
50%
40%
30%
20%
10%
0%
22.4%
10.9%
17.9%
25.7% 27
.7%
14.4%
No
Yes
- by
dire
ctly
em
ploy
ed s
taff
Yes
- by
su
bcon
trac
ted
staf
f
Yes
- by
a
third
par
ty
Yes
- bu
t I d
on’t
know
who
by
N/A
60%
50%
40%
30%
20%
10%
0%
46.5%
3.4%
9.0% 12
.7%
18.1%
18.6%

18 19
12.3 Damage to materials 12.4 Damage to construction/building
12. Have any of the following forms of vandalism been committed on a project you have worked on and who do you think committed the crime?
12.1 Graffiti 12.2 Damage to site
No
Yes
- by
dire
ctly
em
ploy
ed s
taff
Yes
- by
su
bcon
trac
ted
staf
f
Yes
- by
a
third
par
ty
Yes
- bu
t I d
on’t
know
who
by
N/A
40%
30%
20%
10%
0%
20.8%
6.6%
16.2%
33.5%
31.9%
4.9%
No
Yes
- by
dire
ctly
em
ploy
ed s
taff
Yes
- by
su
bcon
trac
ted
staf
f
Yes
- by
a
third
par
ty
Yes
- bu
t I d
on’t
know
who
by
N/A
40%
30%
20%
10%
0%19
.1%
3.2%
15.5%
35.6%
32.3%
4.6%
No
Yes
- by
dire
ctly
em
ploy
ed s
taff
Yes
- by
su
bcon
trac
ted
staf
f
Yes
- by
a
third
par
ty
Yes
- bu
t I d
on’t
know
who
by
N/A
40%
30%
20%
10%
0%
24.8%
5.5%
19.7%
28.5% 30
.0%
5.7%
No
Yes
- by
dire
ctly
em
ploy
ed s
taff
Yes
- by
su
bcon
trac
ted
staf
f
Yes
- by
a
third
par
ty
Yes
- bu
t I d
on’t
know
who
by
N/A
40%
30%
20%
10%
0%
27.0%
4.5%
15.3%
29.8%
28.4%
7.2%

18 19
12.5 Damage to equipment/plant
13. Have the following acts of arson been committed on a project you have worked on and who do you think committed the crime?
13.1 Minor fires with low impact 13.2 Major fires deliberately started to damage the site
No
Yes
- by
dire
ctly
em
ploy
ed s
taff
Yes
- by
su
bcon
trac
ted
staf
f
Yes
- by
a
third
par
ty
Yes
- bu
t I d
on’t
know
who
by
N/A
40%
30%
20%
10%
0%
29.2%
5.9%
13.4%
26.9% 28
.1%
8.6%
No
Yes
- by
dire
ctly
em
ploy
ed s
taff
Yes
- by
su
bcon
trac
ted
staf
f
Yes
- by
a
third
par
ty
Yes
- bu
t I d
on’t
know
who
by
N/A
80%
70%
60%
50%
40%
30%
20%
10%
0%
70.1%
0.6%
1.6% 7.5
%
6.4%
14.6%
No
Yes
- by
dire
ctly
em
ploy
ed s
taff
Yes
- by
su
bcon
trac
ted
staf
f
Yes
- by
a
third
par
ty
Yes
- bu
t I d
on’t
know
who
by
N/A
80%
70%
60%
50%
40%
30%
20%
10%
0%
61.6%
1.3% 3.2
%
10.3% 13
.9%
11.5%

20 21
14.2 Who committed the act of intimidation or assault that you witnessed?
14.3 Did the last act of intimidation or assault you witnessed occur in the last twelve months?
14. Have you witnessed or experienced any form of intimidation or assault occurring on a project you have worked on?
Respondents witnessing intimidation or assault indicate that it is usually a result of an onsite disagreement. In some cases, it involved managers asserting their power over staff.
14.1 Who was the victim of the intimidation or assault that you witnessed?
Third
par
ty
Dire
ctly
em
ploy
ed s
taff
Subc
ontr
acte
d st
aff
Mig
rant
wor
ker
Secu
rity
staf
f
Oth
er,
plea
se s
peci
fy
Don
’t kn
ow
60%
50%
40%
30%
20%
10%
0%
26.2%
26.7%
57.4%
6.7%
4.0% 6.7
%
1.4%
Mys
elf
Dire
ctly
em
ploy
ed s
taff
Subc
ontr
acte
d st
aff
Mig
rant
wor
ker
Secu
rity
staf
f
Oth
er,
plea
se s
peci
fy
Don
’t kn
ow
60%
50%
40%
30%
20%
10%
0%
33.6%
44.8%
44.5%
13.6% 16
.0%
2.4%
1.2%
38.2%
Yes
No
61.8%
40.5%
Yes
No
59.5%

20 21
15. Are you aware of any incidents involving firearms, knives or other weapons occurring on a project you have worked on?
On further analysis: 43% of the incidents involving firearms occur abroad, although London, the south east and north west of England each accounts for an additional 10% of firearm incidents. The remaining 27% incidents occurred in various parts of the UK.
In the UK, London and the south east of England had the highest percentage of respondents experiencing knife crime in the industry (13% in each region).
15.1 Who had possession of the firearm, knife or other weapon?
15.2 Have any of the incidents you witnessed involving these weapons occurred in the last 12 months?
Third
par
ty
Dire
ctly
em
ploy
ed s
taff
Subc
ontr
acte
d st
aff
Mig
rant
wor
ker
Secu
rity
staf
f
Oth
er,
plea
se s
peci
fy
Don
’t kn
ow
60%
50%
40%
30%
20%
10%
0%
36.2%
13.5%
42.3%
17.2%
5.5% 7.4
%
4.9%
Yes
- Fi
rear
ms
Yes
- Kn
ives
Yes
- O
ther
wea
pons No
90%
80%
70%
60%
50%
40%
30%
20%
10%
0%
4.6% 7.7
%
6.6%
85.4%
34.4%
Yes
No
65.6%
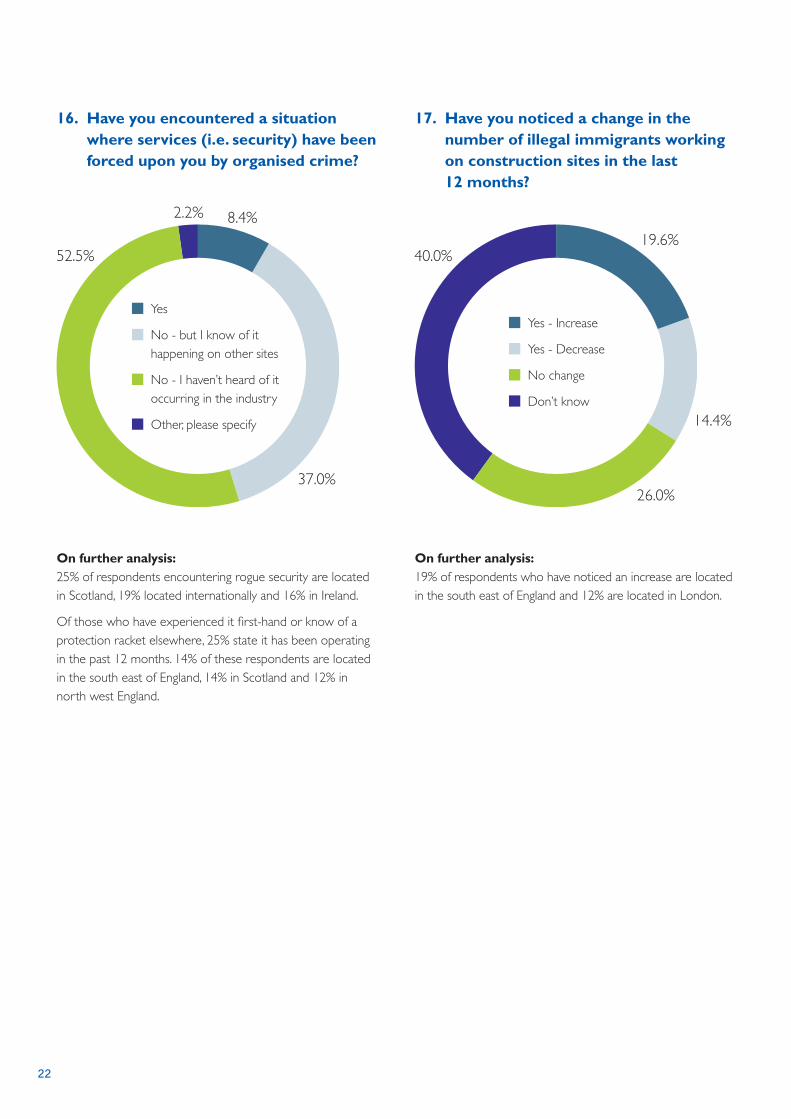
16. Have you encountered a situation where services (i.e. security) have been forced upon you by organised crime?
On further analysis: 25% of respondents encountering rogue security are located in Scotland, 19% located internationally and 16% in Ireland.
Of those who have experienced it first-hand or know of a protection racket elsewhere, 25% state it has been operating in the past 12 months. 14% of these respondents are located in the south east of England, 14% in Scotland and 12% in north west England.
17. Have you noticed a change in the number of illegal immigrants working on construction sites in the last 12 months?
On further analysis: 19% of respondents who have noticed an increase are located in the south east of England and 12% are located in London.
8.4%
Yes
No - but I know of it happening on other sites
No - I haven’t heard of it occurring in the industry
Other, please specify
37.0%
2.2%
52.5%19.6%
Yes - Increase
Yes - Decrease
No change
Don’t know
14.4%
40.0%
26.0%
22 23

18. In general, why do you think illegal immigrants are employed on construction projects?
To r
educ
e la
bour
cos
ts
Beca
use
they
hav
e fa
ke q
ualifi
catio
ns
They
hav
e a
fake
pas
spor
t/vi
sa
They
are
impe
rson
atin
g a
EU c
itize
n or
a
pers
on w
ith in
defin
ite r
ight
to
rem
ain
Lack
of h
uman
res
ourc
e ex
pert
ise in
the
com
pany
Oth
er, p
leas
e sp
ecify
Don
’t kn
ow
90%
80%
70%
60%
50%
40%
30%
20%
10%
0%
81.8%
7.5% 10
.0%
8.7%
20.6%
7.9%
8.0%
22 23

19. How frequently have you experienced the following types of crime in your business or projects?
19.1 Theft/interference of I.T systems i.e. computers, client databases etc.
19.2 Theft/interference with security systems i.e. alarms/CCTV
19.3 Fraud against insurers
1.0%
Very frequently
Frequently
Not very frequently
Never
Don’t know
9.5%
35.2%
10.5%
43.8%
0.5%
Very frequently
Frequently
Not very frequently
Never
Don’t know
4.5%
45.5%
12.3%
37.2%
0.3%
Very frequently
Frequently
Not very frequently
Never
Don’t know
6.0%
44.3%
19.3%30.2%
24 25

19.4 Fraud against suppliers 19.5 Fraud against clients/customers
19.6 Illegal waste disposal/pollution
2.7%
Very frequently
Frequently
Not very frequently
Never
Don’t know
14.5%
27.8%
14.5%
40.5%
0.4%
Very frequently
Frequently
Not very frequently
Never
Don’t know
5.5%
45.1%
20.8%28.3%
1.2%
Very frequently
Frequently
Not very frequently
Never
Don’t know
8.0%
41.6%
19.8%
29.4%
24 25

22. What kinds of criminal activity would you report to the police?
Respondents indicate they would be more likely to report health and safety neglect to the Health and Safety Executive than to the police.
20. At what level do you think fraud most frequently occurs?
21. How likely do you think it would be for crime to be reported to the police in the construction industry?
Thef
t
Vand
alism
Ars
on
Frau
d
Brib
ery
Intim
idat
ion
Ass
ault
Rack
etee
ring
Illeg
al d
rug
deal
ing
or u
se
Hea
lth &
saf
ety
negl
ect
Forc
ed la
bour
Illeg
al w
orki
ng
Kidn
ap
Illeg
al w
aste
disp
osal
Iden
tity
thef
t
Dat
a lo
ss/t
heft
Han
dlin
g st
olen
goo
ds
Non
e
Oth
er, p
leas
e sp
ecify
Don
’t kn
ow
100%
90%
80%
70%
60%
50%
40%
30%
20%
10%
0%
88.4%
67.4%
87.6%
70.2%
56.4%
53.6%
84.1%
62.8%
73.1%
1.8%
2.7%
1.6%
68.6%
56.8%
70.3%
51.6%
79.6%
60.5%
57.5%
26.2%
Seni
or m
anag
ers
Mid
dle
man
ager
s
Fina
nce
staf
f
IT s
taff
1st
line
supe
rviso
rs
Con
trac
t st
aff
Trad
e st
aff
Oth
er, p
leas
e sp
ecify
Don
’t kn
ow
40%
30%
20%
10%
0%
21.9% 22.7%
11.9%
1.9%
22.0%
30.7%
29.8%
29.9%
3.7%
19.3%
Very likely
It depends how serious the crime is
It depends how costly the crime is
Not very likely
Don’t know40.7%
13.3%1.3%
25.5%
26 27

Wou
ld p
refe
r to
man
age
crim
inal
act
ivity
inte
rnal
ly t
o pr
otec
t th
e bu
sines
s re
puta
tion
Uns
ure
of w
hom
to
repo
rt t
he c
rime
to
Hav
e re
port
ed c
rimin
al a
ctiv
ity
befo
re b
ut n
othi
ng w
as d
one
Pref
er t
o in
volv
e co
mm
erci
al
third
par
ty in
vest
igat
ors
Crim
inal
act
ivity
is a
ccep
ted
as a
risk
to
the
busin
ess
Not
wor
th t
he t
ime/
pape
r w
ork
Not
a p
riorit
y fo
r th
e po
lice
Incr
ease
d in
sura
nce
prem
ium
s
Lack
of c
erta
inty
aro
und
proc
edur
e/in
vest
igat
ion
Pers
onal
/man
ager
ial c
ulpa
bilit
y
Oth
er, p
leas
e sp
ecify
Don
’t kn
ow
50%
40%
30%
20%
10%
0%
27.9%
11.2%
28.9%
5.1% 6.6
%
25.3%
44.0%
13.7% 16
.3%
6.0%
9.8%
15.3%
23. Why would you not report a crime to the police?
24. Why would you report a crime to the police?
All
crim
es s
houl
d be
re
port
ed t
o th
e po
lice
To m
ake
an in
sura
nce
clai
m
To e
nsur
e ju
stic
e
To r
ecov
er s
tole
n go
ods/
fund
s
Beca
use
the
crim
e w
as v
ery
serio
us
Beca
use
the
crim
e w
as v
ery
cost
ly
To g
et p
rope
r ad
vice
Oth
er, p
leas
e sp
ecify
Don
’t kn
ow
70%
60%
50%
40%
30%
20%
10%
0%
47.6%
53.7%
43.9%
50.9%
59.8%
47.9%
24.1%
1.8%
2.1%
26 27

25.1 Security guards 25.2 Security dogs
25.3 CCTV 25.4 Enhanced lighting
25. How effective are the following crime deterrents for your business/sites?
11.2%
Very effective
Effective
Not very effective
Not at all effective
We don’t use these measures
50.5%
3.4%
12.2%
22.8%
10.8%
Very effective
Effective
Not very effective
Not at all effective
We don’t use these measures
33.0%
2.9%
39.9%
13.4%
15.4%
Very effective
Effective
Not very effective
Not at all effective
We don’t use these measures
48.5%
2.0%
12.0%
22.1%
11.0%
Very effective
Effective
Not very effective
Not at all effective
We don’t use these measures
58.0%
2.4%6.8%
21.8%
28 29

25.5 Heavy-duty barriers/gates 25.6 Locking points for immobilisation of plant
25.7 Secure storage for high value equipment/supplies
25.8 Plant & vehicles are fitted with tracking systems or unique identification
The results show that secure storage for equipment is the most effective security measure; overall, 85% of respondents indicate that this method is effective.
11.5%
Very effective
Effective
Not very effective
Not at all effective
We don’t use these measures
55.8%
2.5%6.8%
23.4%
24.3%
Very effective
Effective
Not very effective
Not at all effective
We don’t use these measures
60.5%
1.2%6.9%
7.2%
28 29
14.0%
Very effective
Effective
Not very effective
Not at all effective
We don’t use these measures
54.8%
1.5%
16.8%
12.8%
20.7%
Very effective
Effective
Not very effective
Not at all effective
We don’t use these measures
44.5%
1.2%
23.4%
10.2%

26.1 Criminal record checks (all staff) 26.2 Qualifications checked (all staff)
26.3 Immigration visa permit checks 26.4 Reference check with previous employer
26. With regards to employees, how effective are the following security measures?
11.0%
Very effective
Effective
Not very effective
Not at all effective
We don’t use these measures
47.7%
5.2%
10.5%
25.6%
11.5%
Very effective
Effective
Not very effective
Not at all effective
We don’t use these measures
45.4%
6.0%6.5%
30.5%
30 31
11.0%
Very effective
Effective
Not very effective
Not at all effective
We don’t use these measures
43.6%
2.2%
25.6%
17.5%
12.5%
Very effective
Effective
Not very effective
Not at all effective
We don’t use these measures
41.4%
4.5%
25.2%
16.4%

26.5 Identity checks e.g. passports 26.6 Regular drug checks
26.7 CSCS card scheme 26.8 Biometrics
The results are quite similar for each category, but respondents indicate that identity checks are most effective; overall, 58% say they are effective in their company.
8.4%
Very effective
Effective
Not very effective
Not at all effective
We don’t use these measures
27.0%
3.7%
43.5%
17.5%
5.9%
Very effective
Effective
Not very effective
Not at all effective
We don’t use these measures
19.9%
3.8%
55.9%
14.5%
30 31
10.1%
Very effective
Effective
Not very effective
Not at all effective
We don’t use these measures
47.8%
4.0%
21.1%
17.0%
11.4%
Very effective
Effective
Not very effective
Not at all effective
We don’t use these measures
38.8%
9.9%
15.3%
24.6%

27. Is your company scaling down or scaling up its investment in security?
28. Does your company have an anonymous crime reporting (whistle-blowing) system?
On further analysis: Respondents who have experience of whistle blowing systems reveal mixed feelings. The majority feel it can be effective, with the proviso that the information is used carefully (as misreporting is common).
34.8% Yes
No - but there should be
No - we don’t need one
Don’t know
22.6%
20.1%
22.5%
18.1%
Scaling up
Scaling down
Neither
Don’t know
4.6%
23.3%
54.0%
32 33
DiscussionCrime in the construction industry
The occurrence of crime in the construction industry varies considerably. While some respondents say they have encountered only a small amount of petty crime throughout their careers, others have come across more substantial levels of crime on several occasions. These range from petty thefts to being targeted by criminal organisations. It is clear from the survey that everyone in the industry has a different experience of crime, which cannot be represented by statistics. However, the general picture shows that the majority has only suffered a limited amount of crime such as petty theft and vandalism.
The location of the project greatly affects both the amount and type of crime that occurs. Crime tends to increase when working in or around cities and big towns, and the nature of crime tends to vary in different regions. Certain areas in the north west of England, plus Scotland and Ireland have all experienced more organised crime than other regions.
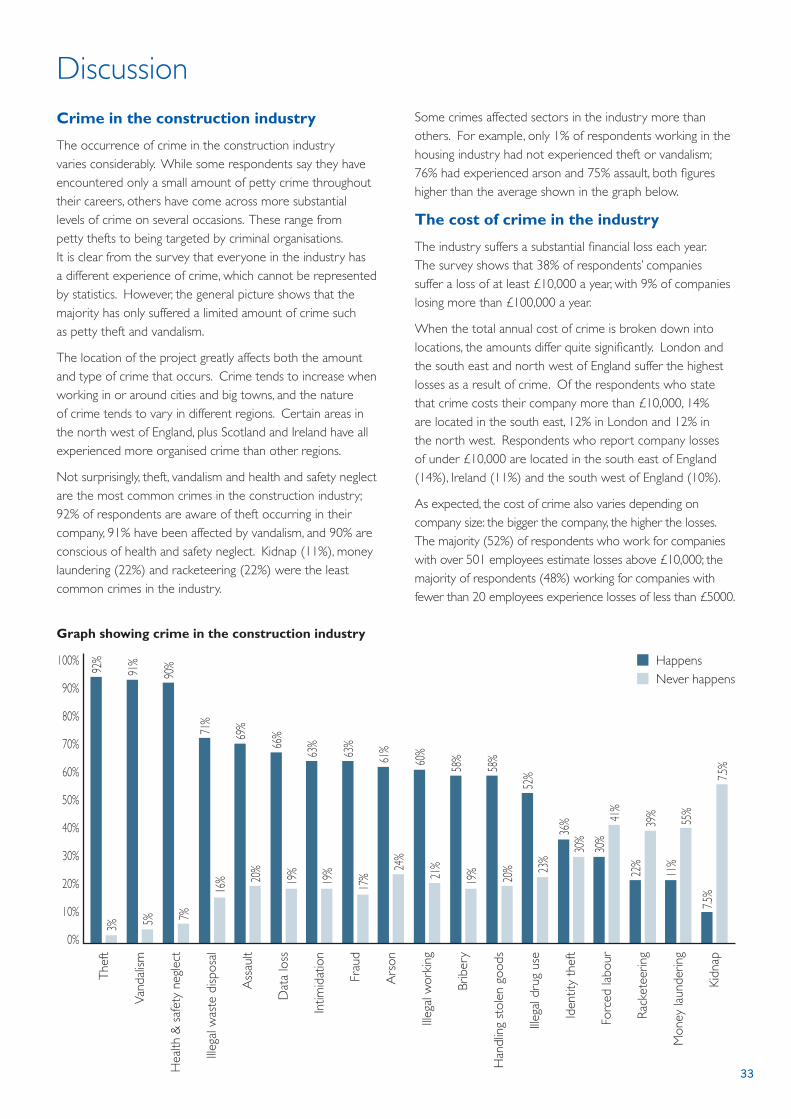
Not surprisingly, theft, vandalism and health and safety neglect are the most common crimes in the construction industry; 92% of respondents are aware of theft occurring in their company, 91% have been affected by vandalism, and 90% are conscious of health and safety neglect. Kidnap (11%), money laundering (22%) and racketeering (22%) were the least common crimes in the industry.
Some crimes affected sectors in the industry more than others. For example, only 1% of respondents working in the housing industry had not experienced theft or vandalism; 76% had experienced arson and 75% assault, both figures higher than the average shown in the graph below.
The cost of crime in the industry
The industry suffers a substantial financial loss each year. The survey shows that 38% of respondents’ companies suffer a loss of at least £10,000 a year, with 9% of companies losing more than £100,000 a year.
When the total annual cost of crime is broken down into locations, the amounts differ quite significantly. London and the south east and north west of England suffer the highest losses as a result of crime. Of the respondents who state that crime costs their company more than £10,000, 14% are located in the south east, 12% in London and 12% in the north west. Respondents who report company losses of under £10,000 are located in the south east of England (14%), Ireland (11%) and the south west of England (10%).
As expected, the cost of crime also varies depending on company size: the bigger the company, the higher the losses. The majority (52%) of respondents who work for companies with over 501 employees estimate losses above £10,000; the majority of respondents (48%) working for companies with fewer than 20 employees experience losses of less than £5000.
Thef
t
Vand
alism
Hea
lth &
saf
ety
negl
ect
Illeg
al w
aste
disp
osal
Ass
ault
Dat
a lo
ss
Intim
idat
ion
Frau
d
Ars
on
Illeg
al w
orki
ng
Brib
ery
Han
dlin
g st
olen
goo
ds
Illeg
al d
rug
use
Iden
tity
thef
t
Forc
ed la
bour
Rack
etee
ring
Mon
ey la
unde
ring
Kidn
ap
100%
90%
80%
70%
60%
50%
40%
30%
20%
10%
0%
3%92
%
5%91
%
7%90
%
16%
71%
20%
69%
19%
66%
19%
63%
17%
63%
24%
61%
21%
60%
19%
58%
20%
58%
23%
52%
30%36
% 41%
30%
39%
22%
55%
11%
7.5%
7.5%
Happens Never happens
Graph showing crime in the construction industry
32 33

34 35
Crime against property
Crime against property includes instances of theft, vandalism and arson. Very few respondents have no experience of theft or vandalism in their construction careers, and similar results are shown across all sectors of the industry. A number of reasons might contribute to the high rate of such crimes, including site location and security, the nature of the construction workforce (with many different workers onsite everyday), and the illegal market that exists for construction equipment.
Tools and building materials are most susceptible to theft, with 83% of respondents experiencing theft of these items on a site where they had worked. The majority of respondents believe that sub-contracted staff are the perpetrators or that they do not know who has committed the theft.
The survey indicates that the theft of plant is not as common as the theft of other equipment, and only 29% of respondents are aware of plant being stolen from a site where they had worked. Third parties are most often identified for committing plant theft; comments suggest that it is mainly opportunist criminals stealing plant that has been left unattended.
Vandalism levels reported in the survey are high, the majority having experienced every kind of vandalism explored in the survey. Graffiti and site damage are particular problems, with three quarters of respondents having experienced these forms of vandalism. Respondents either do not know the culprits or implicate third parties for committing most acts of vandalism. Further comments suggest that youths are mainly responsible for causing this damage and that it would be worse in cities and big towns.
Incidents of arson in the industry appear to be quite rare. 27% respondents had experienced a minor fire on a site where they had worked and 15% a major fire that was intended to damage the site. The majority of respondents who have experienced arson state that a third party was responsible for the fire.
Serious crime
The industry is susceptible to criminal organisations that exploit aspects of construction practices. In this survey, we focused on the issue of rogue security and found that instances are low. However, those who did experience this aspect of organised crime had some very interesting stories to share. Overall, only 8% of respondents have direct experience of rogue security; the regions particularly affected are Scotland (25%), Ireland (16%) and the north west of England (13%). This crime is also a factor internationally (13%). 25% of those aware of this criminal activity occurring state that it has happened in the last twelve months.
Those affected by these organisations were asked about the event that occurred, and many had similar experiences. A security guard company would approach the site and offer to provide security; intimidation, thefts and vandalism would occur if this was refused and would continue until the security was accepted.
Some respondents cite instances where the security company used physical threats and, in some cases, actually harmed site workers. Many comments indicate that equipment and plant would be stolen but then suddenly reappear once the security guards were employed. There were also examples of territorial disputes between rogue security guard companies, with construction sites caught in the middle. Interestingly, other comments indicate that despite the security company being illegitimate, it was still the best firm to use (and, in some cases, recommend) since it would guarantee other criminals not targeting the site.
Offsite crime
The survey also explored issues such as the employment of illegal immigrants, fraud, and the interference with and theft of IT systems.
Respondents were asked if they had noticed a change over the past year in the number of illegal immigrants working in the construction industry. 20% state there has been an increase and 26% report no change. Only 14% have noticed a decrease in the last twelve months, despite recent reports stating many migrants, both legal and illegal, are leaving the UK.
Respondents who did report a decrease are mainly located in Ireland (20%), London (10%) and the south east of England (10%). However, these are also the top three regions where respondents report an increase or no change.
82% of respondents indicate that illegal workers are taken on because it reduces labour costs, which suggests they are hired knowingly rather than because of an error in human resources. Businesses need to be aware of the Civil Penalties which may be imposed by UKBA for employing Illegal workers (up to £10 000 per employee in 2009).
Illegal waste disposal and the theft of (or interference with) IT systems are the most common forms of crime under this category. 58% of respondents have experienced illegal waste disposal and 54% have known of the IT system being targeted. However, these crimes are not very frequent and, apart from illegal waste disposal, not very big issues in the industry.
In all cases explored, about a third of respondents have experienced fraud in their business and it has not been a frequent occurrence. It is interesting that when respondents were asked who they thought was most likely to commit fraud, managers, finance personnel and IT staff were not the top responses – contract staff (30%) and trade staff (30%) were.
34 35
Prevention
Respondents were asked about the effectiveness of security measures to help protect the construction site and equipment, as well as those designed to ensure the workforce can work onsite.
In terms of site security, the majority have used each of the methods explored. The most popular security measures are enhanced lighting and secure storage, which are both used by 93% of respondents. These methods are also identified as the most effective, with 85% stating secure storage is effective and 69% stating enhanced lighting is effective (although the comments highlight the need to ensure lights are connected to CCTV). Using locking points to immobilise plant is also considered effective by 68% of respondents and heavy-duty barriers/gates by 67%.
No security measure stands out as being particularly effective for monitoring staff onsite. The most common measures are reference checks (94%), qualification checks (90%) and the CSCS card scheme (85%). Despite these high figures, generally only around half of the respondents consider these measures to be effective. The CSCS card scheme has the highest number of respondents who feel the measure is not at all effective, commenting that this is because of frequent forgeries.
1. Site and project managers must know how to deal with crime Training needs to incorporate elements of preventing crime on the construction site and knowing how best to deal with crime that occurs. Considering the possibility of crime at the beginning of the project can save time and money.
2. IT systems should be utilised to monitor access to sites and equipment registers An IT system should be in place that keeps an up-to-date employee database. Using electronic entrance systems connected to the database will prevent illegitimate access. Electronic equipment registers are also useful in keeping a record of who last used the equipment and when; this will allow equipment to be tracked if it goes missing. IT systems can greatly benefit the security of the site.
3. Security guards must be registered with the Security Industry Authority To ensure the legitimacy of security-guard companies used for onsite security they must be registered with the SIA. When working onsite security staff must wear a current SIA issued Blue Badge. Hiring companies that are not registered could result in funding organised crime.
4. All crime should be reported There is clear underreporting of crime in the construction industry. Although evidence has suggested many feel that reporting crime will not have a successful result, it could help to prevent it from reoccurring. As crime trends are recognised the opportunities for target hardening and detection of organised crime increase.
5. All employees should have identity and reference checks There are various tools available to ensure employees have sufficient qualifications, status and experience to work in the industry. All employees should have pre-employment reference checks, qualification checks and identity checks, this includes both directly employed and sub-contracted staff. Those that are not properly qualified could be a health and safety risk.
6. Plant and equipment should be kept securely to prevent theft Results have shown that the most effective theft deterrents are secure storage and enhanced lighting. All plant and equipment should be stored securely and registered. Taking such measures would reduce the possibility of theft and ensure successful recovery if it did occur.
Recommendations

Our Mission: To contribute to the creation of a modern, progressive, and responsible construction industry; able to meet the economic, environmental and social challenges faced in the 21st century.
Our 7 Guiding Principles: n Creating extraordinary people through professional
learning and continuous personal development.
n Promoting the built environment as central to the quality of life for everyone everywhere.
n Achieving a sustainable future, worldwide.
n Advocating exemplary ethical practice and behaviour, integrity and transparency.
n Pursuing excellence in management practice, and technological innovation rooted in evidence based science.
n Being socially responsible and working responsibly.
n Enabling our members to find an emotional resonance with the Institute; their success is our success.
The Chartered Institute of Building Englemere, Kings Ride, Ascot Berkshire SL5 7TB, United Kingdome: [email protected] w: www.ciob.org.uk t: +44 (0)1344 630 700 f: +44 (0)1344 630 777 Registered Charity 280795
The Chartered Institute of BuildingThe Chartered Institute of Building (CIOB) represents for the public benefit the most diverse set of professionals in the construction industry.
We have over 40,000 members around the world and are considered to be the international voice of the building professional, representing an unequalled body of knowledge concerning the management of the total building process. Chartered Member status is recognised internationally as the mark of a true, skilled professional in the construction industry and CIOB members have a common commitment to achieving and maintaining the highest possible standards within the built environment.
The Chartered Building Company and Consultancy Schemes (CBCs) are a vital part of the CIOB, providing the Institute’s members with a further business perspective.
To find out more about the benefits of either individual CIOB membership or CBC schemes go to our website www.ciob.org.uk or call us on +44 (0)1344 630 700 today.