Embed Size (px)
Citation preview

THE CHEMICAL INDUSTRY IN THE NEXT
INDUSTRIAL REVOLUTION, THE “SUSTAINABLE ONE”
MR. RAFAEL CAYUELA TWITTER @CAYUELARAFAEL
AUTHOR
“THE CHEMICAL INDUSTRY BY 2050”
7th October 2015
All rights reserved to WILEY - VCH
Energy Exchange Series Breakfast

Disclaimer
• The information in this presentation is based on information extracted from the book on “The Future of the Chemical Industry by 2050” edited by Mr. Rafael Cayuela and published by WILEY-VCH. WILEY does not warrant the accuracy, reliability, completeness or timeliness of the information and undertakes no obligation to revise or update this presentation.
• Mr. Rafael Cayuela act as an individual and author and non as an DOW Chief Economist or Employee. Dow Chemical (including its directors, officers, employees, agents and subcontractors) hereby waives any and all liability for damages of whatever kind and nature which may occur or be suffered as a result of the use of this presentation or reliance on the information therein.
• This presentation contains forward-looking information within the meaning of any applicable securities laws ("Forward-Looking Information"). The purpose of the Forward-Looking Information is to provide audience expectations and a logical framework about future developments on the industry, trends, business prospects and opportunities and may not be appropriate for other purposes and must not be relied on.
• All rights reserved (including those of translation into other languages). No part of this presentation and book may be reproduced in any form, not transmitted or translated into a machine language without written permission from the publisher. Registered names, trademarks, etc.. used in this presentation even when not specifically marked as such, are not to be considered un protected by law.
2 All rights reserved to WILEY - VCH

Strategy vs. Tactics
Q 1 : What was the world population in 1970?
A) 2, 5 B) 3,5 C) 4,5 2010 : 7 billion
Q 2 : What was the world life expectancy in 1970?
A) 35 B) 45 C) 55 2010 : 65 years
Q 3 : What was the World $US GDP in 1970?
A) 15 B) 25 C) 35 2010 : $US73 trillion
Q 4 : What was the world oil demand in 1970?
A) 28 B) 45 C) 65 2010 : 88 million barrel
3 All rights reserved to WILEY - VCH
TIME TO REFLECT

Strategy vs. Tactics
Q 1 : What was the world population in 1970?
A) 2, 5 B) 3,6 C) 4,5 2010 : 7 billion
Q 2 : What was the world life expectancy in 1970?
A) 35 B) 45 C) 55 2010 : 65 years
Q 3 : What was the World $US GDP in 1970?
A) 15 B) 25 C) 35 2010 : $US73 trillion
Q 4 : What was the world oil demand in 1970?
A) 28 B) 44 C) 65 2010 : 88 million barrel
4 All rights reserved to WILEY - VCH
100%
44%
387%
100%
TIME TO REFLECT – TIME FOR STRATEGY
During the next decades and on light of all the upcoming challenges our world need to face, strategy will play a much bigger role industry will need to move from “quantitative growth” into “quantitative & qualitative” growth. In other words the focus will shift from “operations” and incremental improvements into pure innovation.

GLOBAL MEGATRENDS
SOCIAL
“A WORLD WITH MORE THAN 9 BILLION PEOPLE, HIGHER QUALITY OF LIFE AND LIFE EXPECTANCY,
MOVING INTO CITIES”
5 All rights reserved to WILEY - VCH

Social Megatrends – Population
9 to 10 billion people by 2050, with the REST adding 1.8 billion and India
440 million. Japan, Russia, China & EU will face shrinking & older populations
Source : United Nations - World Population Prospect – 2007 Revision
Mill
ion
peo
ple
World Population Scenarios World Population per Area - Base World Population per Area in %
Lower case Base scenario High scenario
6 All rights reserved to WILEY - VCH
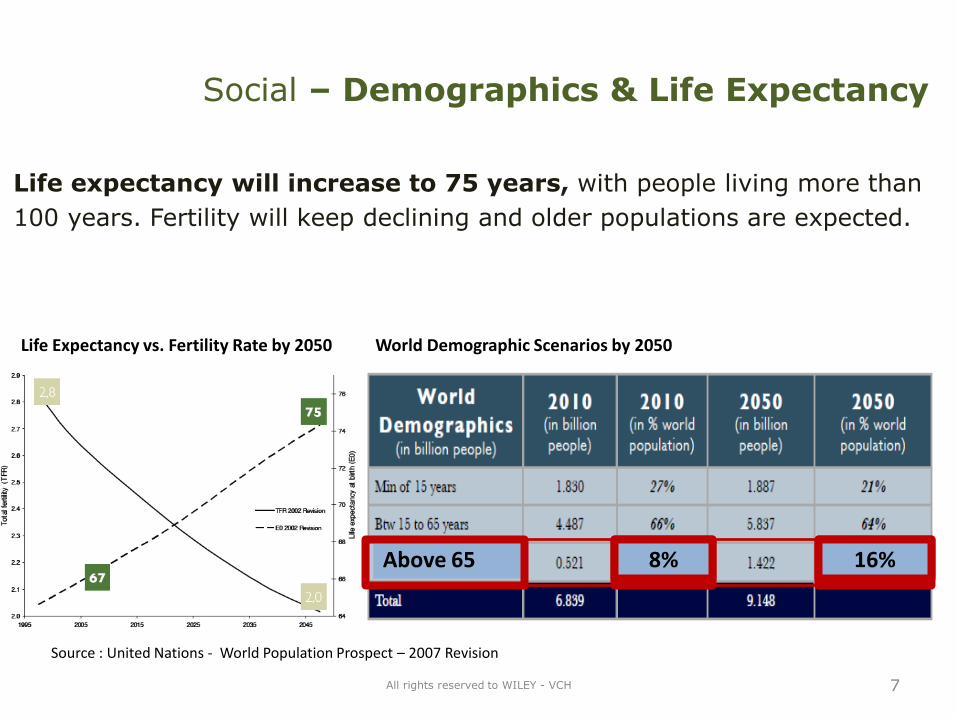
Life expectancy will increase to 75 years, with people living more than
100 years. Fertility will keep declining and older populations are expected.
Life Expectancy vs. Fertility Rate by 2050 World Demographic Scenarios by 2050
Source : United Nations - World Population Prospect – 2007 Revision
7 All rights reserved to WILEY - VCH
Above 65 8% 16%
Social – Demographics & Life Expectancy
GLOBAL MEGATRENDS
ECONOMY
“THE LARGEST MIDDLE CLASS IN HUMAN HISTORY”
8 All rights reserved to WILEY - VCH

Economic Megatrends - GDP
World GDP expected to quadruple to $US281 trillion by 2050; BRIC
will double their market share & Advanced Economies their size
Source : IMF and PWC and PriceWaterHouseCoopers for long term economic projections
9 All rights reserved to WILEY - VCH

Economic Megatrends - GDP
Source : IMF and PWC and PriceWaterHouseCoopers for long term economic projections
China & India might become the largest economies in the world,
while China, India & USA alone could host 50% of the world GDP.
50%
50%
$US 20 to 25 trillion gap
10 All rights reserved to WILEY - VCH

GLOBAL MEGATRENDS
CLIMATE CHANGE
“A WORLD IN A DIET OF 4,000 GRAMS OF CO2 PER CAPITA AND DAY, REPRESENTS A ENORMOUS TECHNOLOGICAL / POLITICAL CHALLENGE,
BUT ALSO AN HUGE BUSINESS OPPORTUNITY
“CLIMATE CHANGE IS THE “WAR” OF THE 21ST CENTURY”
11 All rights reserved to WILEY - VCH

Climate Change – Fundamentals
Scientific evidences correlate Greenhouse Emissions with higher
temperatures, eventually triggering “climate change”.
12 All rights reserved to WILEY - VCH
Historical C02 Emissions Historical World Temperature Variations Emissions vs. Temperature Fluctuations
2nd
May 2
01
3

Climate Change – Root causes
13 All rights reserved to WILEY - VCH
World Green House Emissions
72% = C02 19% Methane 9% Nitrous Oxide
World CO2 Emissions reached
33 Gigaton in 2010
72% C02 related.
29% Power stations
20% Ind. Processes
19% Transportation
12% residential
18% Methane
40% Agricultural
9% Nitrous Oxide
60% agricultural
14 All rights reserved to WILEY - VCH
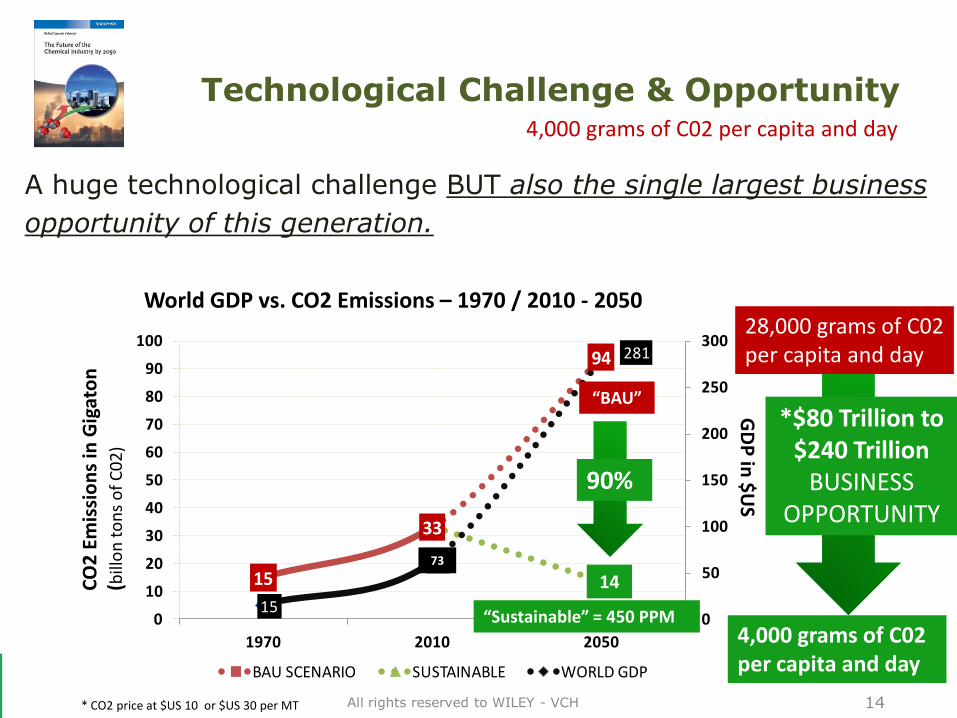
A huge technological challenge BUT also the single largest business
opportunity of this generation. G
DP
in $
US
15
33
94
1415
63
281
0
50
100
150
200
250
300
0
10
20
30
40
50
60
70
80
90
100
1970 2010 2050
BAU SCENARIO SUSTAINABLE WORLD GDP
90%
CO
2 E
mis
sio
ns
in G
igat
on
(b
illo
n t
on
s o
f C
02
)
“BAU”
“Sustainable” = 450 PPM
14
World GDP vs. CO2 Emissions – 1970 / 2010 - 2050
73
4,000 grams of C02 per capita and day
*$80 Trillion to $240 Trillion
BUSINESS OPPORTUNITY
4,000 grams of C02 per capita and day
28,000 grams of C02 per capita and day
* CO2 price at $US 10 or $US 30 per MT
Technological Challenge & Opportunity

Living with 4,000 grams of C02 per capita & day
BRAZIL, 16035
CHINA, 4,978
USA, 54,475
USA, 5,320
EU, 22,605
CHINA, 17058
INDIA, 3995
BRAZIL, 6,519
JAPAN, 28126
CANADA, 48751
RUSSIA, 32861
EU, 3788JAPAN, 3941
CANADA, 4,231 INDIA, 4,235 BRAZIL, 4942 RUSSIA, 4905
USA, 43034
CANADA, 32,829
EU, 16605
JAPAN, 20305
CHINA, 40111
INDIA, 49095
RUSSIA, 72236
CHEMICAL INDUSTRY, 545INDUSTRY, 982
INDUSTRY, 142-4,000
0
4,000
8,000
12,000
16,000
20,000
24,000
28,000
32,000
36,000
40,000
44,000
48,000
52,000
56,000
60,000
64,000
68,000
72,000
76,000
80,000
$(5,000) $5,000 $15,000 $25,000 $35,000 $45,000 $55,000 $65,000 $75,000 $85,000 $95,000 $105,000
CO
2 EM
ISSI
ON
S -
GR
AM
S P
ER C
AP
ITA
& D
AY
GDP PER CAPITA IN $ US
Sustainable Scenario 2050 - CO2 Emissions - 4,000 Grams Per Capita & Day
Daily Emissions per Capita in Grams of C02
11 times
14 times
8 times
8 times
8 times
3 times 4 times
5 times
7 times
ISSUE 2 – Economic / Wealth Challenge
All rights reserved to WILEY - VCH

GLOBAL LONG TERM MEGATRENDS
ENERGY MEGATRENDS
“IN A ENVIRONMENT OF MASSIVE ENERGY GROWTH, ENERGY TRANSITIONS OCCUR EVEN WHEN THE INCUMBENT ENERGY IT IS STILL AVAILABLE, AND THE NEW ONE IS MORE EFFICIENT, CHEAPER AND SUSTAINABLE” “CRUDE OIL PRICES MIGHT HAVE PEAKED FOREVER IN 2011 – PRICE SHOCKS ARE GOOD INDICATORS OF ENERGY TRANSITIONS”
16 All rights reserved to WILEY - VCH

Energy Transitions – Price “Shocks”
Price Shocks are tremendous “source” of information.
17
2010
Nominal Crude Oil Prices
Real Crude Oil Prices
HISTORICAL CRUDE OIL PRICES 1860 - 2010
All rights reserved to WILEY - VCH
Energy – “BAU” Scenario
18 All rights reserved to WILEY - VCH
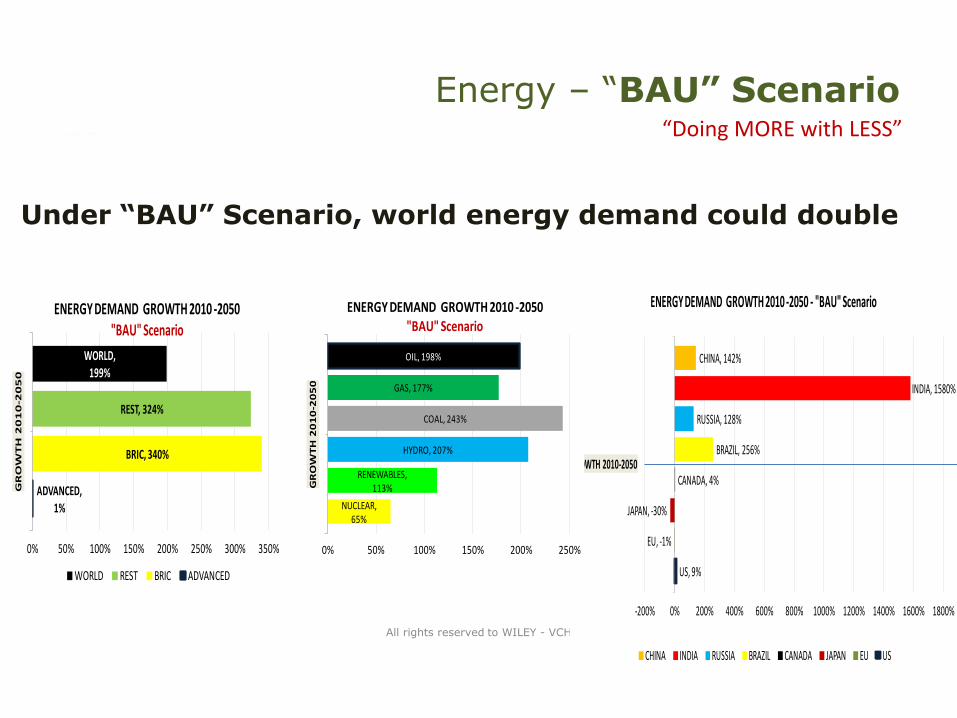
US, 9%
EU, -1%
JAPAN, -30%
CANADA, 4%
BRAZIL, 256%
RUSSIA, 128%
INDIA, 1580%
CHINA, 142%
-200% 0% 200% 400% 600% 800% 1000% 1200% 1400% 1600% 1800%
GROWTH 2010-2050
ENERGY DEMAND GROWTH 2010 -2050 - "BAU" Scenario
CHINA INDIA RUSSIA BRAZIL CANADA JAPAN EU US
ADVANCED, 1%
BRIC, 340%
REST, 324%
WORLD, 199%
0% 50% 100% 150% 200% 250% 300% 350%
GR
OW
TH
20
10
-20
50
ENERGY DEMAND GROWTH 2010 -2050 "BAU" Scenario
WORLD REST BRIC ADVANCED
NUCLEAR, 65%
RENEWABLES, 113%
HYDRO, 207%
COAL, 243%
GAS, 177%
OIL, 198%
0% 50% 100% 150% 200% 250%
GR
OW
TH
20
10
-20
50
ENERGY DEMAND GROWTH 2010 -2050 "BAU" Scenario
Under “BAU” Scenario, world energy demand could double
“Doing MORE with LESS”
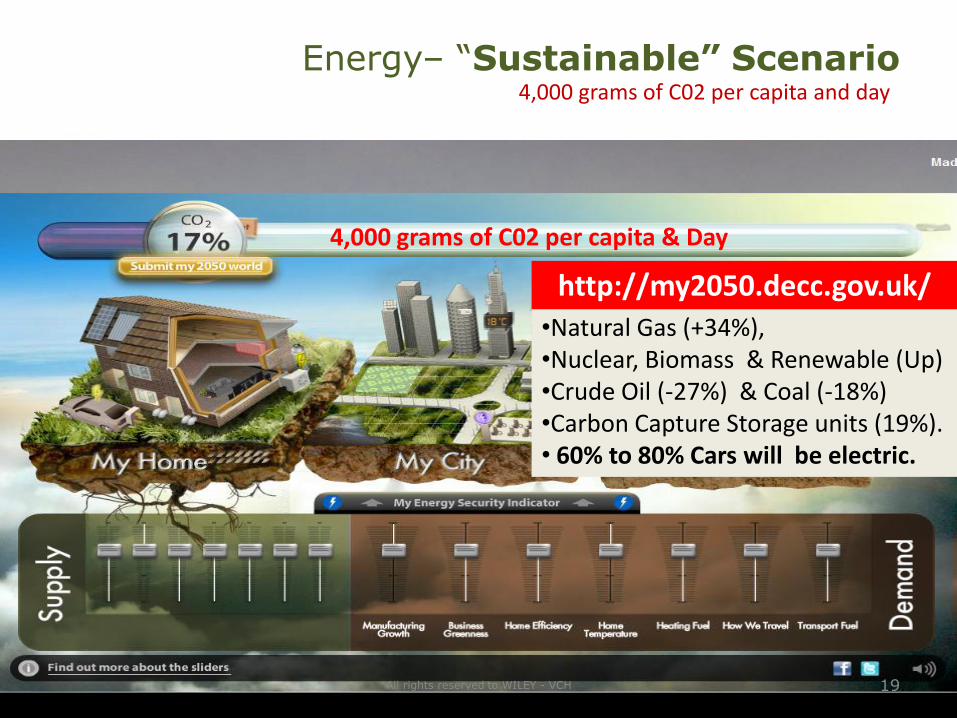
Energy– “Sustainable” Scenario
19 All rights reserved to WILEY - VCH
4,000 grams of C02 per capita and day
4,000 grams of C02 per capita & Day
•Natural Gas (+34%), •Nuclear, Biomass & Renewable (Up) •Crude Oil (-27%) & Coal (-18%) •Carbon Capture Storage units (19%). • 60% to 80% Cars will be electric.
http://my2050.decc.gov.uk/

GLOBAL LONG TERM MEGATRENDS
SINGULARITY
“INFORMATION TECHNOLOGY & COMPUTATIONAL PROGRESS WILL ACCELERATE AND CHANGE ALL ASPECTS OF OUR LIFE, THE WAY WE WORK, LIVE, AND COMMUNICATE”
20 All rights reserved to WILEY - VCH

All rights reserved to WILEY - VCH
Singularity
21
Computational Progress and Tech. Convergence accelerate Human Progress Exponentially
Digital Revolution

Singularity
22
Digital Revolution
All rights reserved to WILEY - VCH
Digitized – more information is becoming digitized, opening the door for a layer of analytics (e.g. machine learning) to be placed on top of it
Deceptive – early stages of exponential growth processes may be deceptively linear
Disruptive – once exponential growth reaches the inflection point, or “knee of the
curve,” they become truly disruptive
Dematerialized – no longer do you have to buy a flashlight or digital camera, you can
simply purchase an app on your phone to accomplish these tasks
Demonetized – as manufacturing techniques improve, technologies are becoming
less expensive at an alarming pace
Democratized –3 billion more people on the Internet by 2020
Exponential Growth – 6 Ds

THE CHEMICAL INDUSTRY LONG TERM DINAMICS
BY 2050
“THE CHEMICAL INDUSTRY / SCIENCE / ENGINEERING WOULD BE AT THE CORE OF THE NEXT INDUSTRIAL REVOLUTION – THE SUSTAINABLE & DIGITAL ONE”
23 All rights reserved to WILEY - VCH

Structure – Growth & Markets
China and India will become the largest chemical markets with 50% share.
24 All rights reserved to WILEY - VCH
BAU SCENARIO
27%
47%
1

Structure – Growth & Markets
India will be the fastest growing chemical market in world.
25 All rights reserved to WILEY - VCH
BAU SCENARIO
GROWTH RANKING in % - 2010 - 2050
ADJUSTED "BAU" SCENARIO - 2050
RANK COUNTRY INDUSTRY % GROWTH
TOP 1 INDIA CHEMICAL 3816%
TOP 2 INDIA PHARMA 3409%
TOP 3 CHINA PHARMA 1905%
TOP 4 CHINA CHEMICAL 431%
TOP 5 RUSSIA PHARMA 609%
TOP 6 BRAZIL PHARMA 527%
TOP 7 RUSSIA CHEMICAL 401%
TOP 8 BRAZIL CHEMICAL 372%
TOP 9 USA PHARMA 189%
TOP 10 USA CHEMICAL 164%
TOP 11 CANADA PHARMA 140%
TOP 12 EUROPE 27 PHARMA 132%
TOP 13 CANADA CHEMICAL 111%
TOP 14 EUROPE 27 CHEMICAL 105%
TOP 15 JAPAN PHARMA 61%
TOP 16 JAPAN CHEMICAL 38%
LARGEST WORLD MARKETS
CHEMICALS
CHINA CHINA 4,048$
EUROPE INDIA 2,903$
USA USA 1,385$
JAPAN EUROPE 1,332$
BRAZIL BRAZIL 474$
INDIA JAPAN 281$
CANADA RUSSIA 211$
RUSSIA CANADA 93$
PHARMA
USA USA 925$
EUROPE CHINA 752$
JAPAN EUROPE 566$
CHINA INDIA 456$
CANADA BRAZIL 128$
BRAZIL JAPAN 114$
RUSSIA RUSSIA 96$
INDIA CANADA 56$
763$
651$
524$
203$
100$
74$
44$
42$
2050
2,010 2050
320$
244$
71$
37$
2,010
24$
20$
14$
13$
1
2nd
4th

Feedstock Lighter, Renewable & Bio
Lighter, renewable and bio but still dependent in Naphtha.
All rights reserved to WILEY - VCH
BAU SCENARIO
2
51%
56%
55%
31%
36%
35%
30%
48%
14%
9%
15%
20%
0% 20% 40% 60% 80% 100%
WORLD
REST
BRIC
ADV
NAPHTHA & OIL ETHANE PROPANE / BUTANE / REST
BAU – Petrochemical Feedstock 2010 BAU – Petrochemical Feedstock 2050
56%
44%
75%
44%
30%
47%
10%
38%
13%
9%
15%
19%
0% 20% 40% 60% 80% 100%
WORLD
REST
BRIC
ADV
NAPHTHA & OIL ETHANE PROPANE / BUTANE / REST

Industry need for cheaper energy, feedstock and lower emissions will
accelerate the transition into lighter feedstock
All rights reserved to WILEY - VCH
BAU SCENARIO
30% less CO2 emissions
Feedstock Lighter, Renewable & Bio 2

Industry– Climate Change
The Chemical Industry remains a great contributor to emissions reductions.
In 2005, the industry released 3 Gigaton of C02e while “abating” 6 Gigaton
All rights reserved to WILEY - VCH
EMISSIONS vs. ABATEMENT = 1 to 2
X 2 times Abatement
3

Regulation – Global & Stringer
More global and stringent regulation, with higher C02 prices.
All rights reserved to WILEY - VCH
4,000 grams of C02 per capita & day
EMISSION TRADING SCHEMES
•2005 Europe Mandatory •2005 Japan Voluntary •2008 Canada Voluntary •2008 N. Zealand Voluntary •2010 UK Mandatory •2010 US States* Mandatory •2012 Australia* Mandatory •2015 China Mandatory •2015 Korea Mandatory
•Note“: WCI Western Climate Initiative
4

Regulation – Global, Stringer, Unbearable
“Under the new perspective many companies and industries will peril”
All rights reserved to WILEY - VCH
4,000 grams of C02 per capita & day
4
Exxon Mobile uses $60 tonne
as internal carbon price for C02
Expected EBITDA
annual lost of
$US 8 Billion!!
Sustainable?

INNOVATION – Technology
31
THE 3rd INDUSTRIAL REVOLUTION 5
1850 1900 1950 2000 2050 2100
INNOVATION Level 2
OPERATIONAL EFFICIENCY
NEXT INDUSTRIAL REVOLUTION “The Sustainable / Digital One”
4,000 grams per capita & day
2nd INDUSTRIAL REVOLUTION Enormous Growth - Fossil Fuel
1,2 1,7 2,5 6.0 9,0 12 Billion people
Technological CONVERGENCE
Business COLLABORATION
INNOVATION Level 3
R&D in Chemical Industry in 2010 - 25% new chemistry - 75% in incremental innovation -Source: McKinsey

INNOVATION – Technology
• Circular Economy, Technological Convergence and Collaboration will be at the core of the next industrial revolution.
• This require new biz models, new skills (employees/leaders), regulatory systems (IP protection, patents, antitrust) and technological frameworks.
32
THE 3rd INDUSTRIAL REVOLUTION
5
• Companies will be valued by the innovation pipeline of its value chain;
not only by their own innovation, financials or R&D pipeline.
• Innovation will become disruptive and exponential rather than incremental (Singularity)
Energy Chemical
Pharmaceutical
Consumer
Bank
SHELL DOW DOW
BMW
Information
Natural
MICHELIN
EXXON
PFIZER GOOGLE
APPLE NIKE APPLE
MICROSOFT
Natural SHANGAI
Health Mobility Industry
JPMORGAN AIRBUS UBS
All rights reserved to WILEY - VCH

Conclusions
• We are leaving historical and strategic times. During this transition the world is poised to witness another period of massive transformation. A world with 9 billion people and $US 280 trillion GDP; the world will have the potential to host “the largest, wealthiest and healthiest societies in human history”.
• China, USA & India will become the largest world economies but also the largest chemical and pharmaceutical markets. World avg. life expectancy will to 75 by 2050, with millions of people living more than 100 and up to 130 years.
• During this transition world GDP per capita will triple to US$ 30,675; creating a massive middle class and pulling millions of people our of poverty.
• Singularity and the Digital Revolution will accelerate and change most of the aspects of our life, the way we work, live, and communicate.
• However our world will not be sustainable. A world poised to live with just 4,000 grams of CO2 per capita an day it is not only a moral obligation and technological and political challenge, but also a large business opportunity.
34 All rights reserved to WILEY - VCH
UNDER THE 3rd INDUSTRIAL REVOLUTION
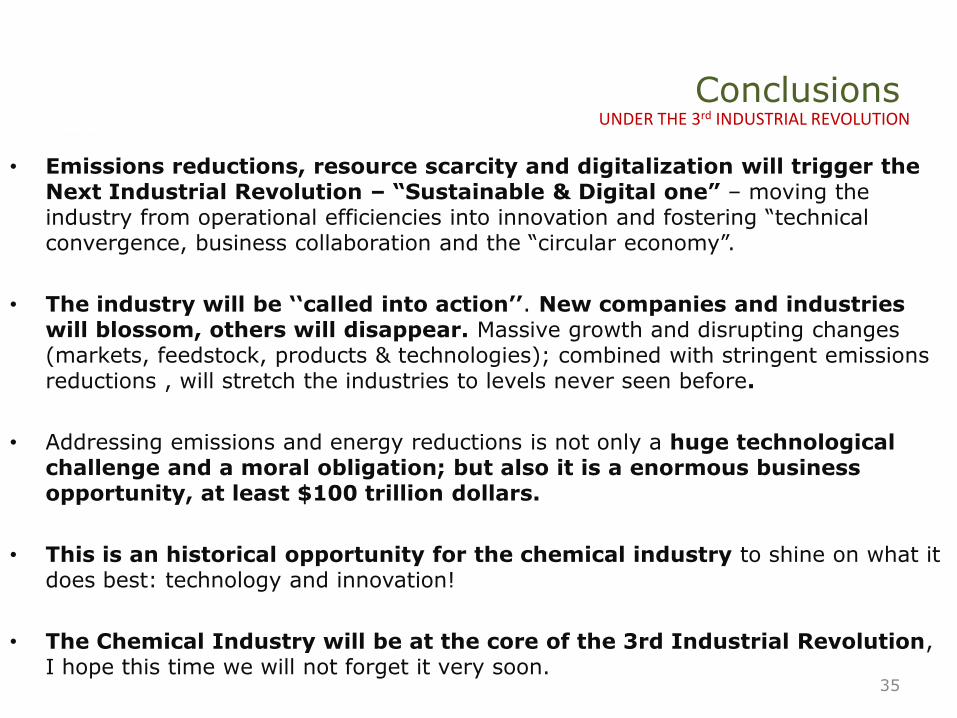
Conclusions
• Emissions reductions, resource scarcity and digitalization will trigger the Next Industrial Revolution – “Sustainable & Digital one” – moving the industry from operational efficiencies into innovation and fostering “technical convergence, business collaboration and the “circular economy”.
• The industry will be ‘‘called into action’’. New companies and industries will blossom, others will disappear. Massive growth and disrupting changes (markets, feedstock, products & technologies); combined with stringent emissions reductions , will stretch the industries to levels never seen before.
• Addressing emissions and energy reductions is not only a huge technological challenge and a moral obligation; but also it is a enormous business opportunity, at least $100 trillion dollars.
• This is an historical opportunity for the chemical industry to shine on what it does best: technology and innovation!
• The Chemical Industry will be at the core of the 3rd Industrial Revolution, I hope this time we will not forget it very soon.
35
UNDER THE 3rd INDUSTRIAL REVOLUTION
THANKS
“Welcome to a much larger and sustainable world thanks to chemistry”
All rights reserved to WILEY - VCH


![Title Advancing small-molecule-based chemical …...1 Advancing Small-Molecule-Based Chemical Biology With Next-Generation Sequencing Technologies Chandran Anandhakumar,[a] Seiichiro](https://img.pdfslide.net/doc/110x75/5fc86aa017ed2d10ca7bca2c/title-advancing-small-molecule-based-chemical-1-advancing-small-molecule-based.jpg)