Embed Size (px)
Citation preview

The Chicago Guide to Writing about Multivariate Analysis, 2nd Edition.
Comparing overall goodness of fit across models
Jane E. Miller, PhD
The Chicago Guide to Writing about Multivariate Analysis, 2nd Edition.
The Chicago Guide to Writing about Multivariate Analysis, 2nd Edition.
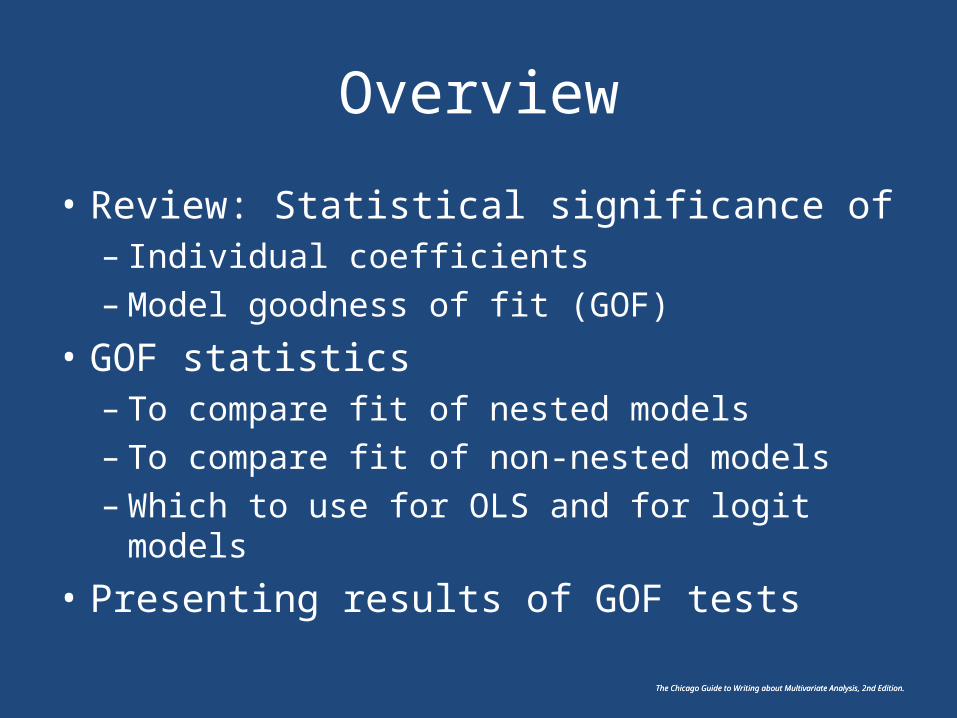
Overview
• Review: Statistical significance of – Individual coefficients – Model goodness of fit (GOF)
• GOF statistics – To compare fit of nested models– To compare fit of non-nested models– Which to use for OLS and for logit models
• Presenting results of GOF tests
The Chicago Guide to Writing about Multivariate Analysis, 2nd Edition.
The Chicago Guide to Writing about Multivariate Analysis, 2nd Edition.
Review: Statistical significance of individual coefficients
• Inferential statistics for individual coefficients (βs) in a multivariate regression model provide the information to test whether that β is statistically significantly different from zero
• Assesses the contribution of that independent variable to explaining variation in the dependent variable, taking into account the other independent variables in the model
The Chicago Guide to Writing about Multivariate Analysis, 2nd Edition.
The Chicago Guide to Writing about Multivariate Analysis, 2nd Edition.
Goodness-of-fit (GOF) statistics• F-statistic• – 2 log likelihood statistic• Akaike Information Criterion (AIC)• Bayesian Information Criterion (BIC)– Also known as Schwarz Criterion (SC) or Schwarz Bayesian
Information Criterion (SBIC)
• Most GOF statistics are part of standard output from a multivariate regression model
• Others GOF statistics can be – Requested as an option to the regression command – Manually calculated from standard output
The Chicago Guide to Writing about Multivariate Analysis, 2nd Edition.
Review: Model Goodness of Fit
• To test whether the model with a particular set of independent variables (IVs) in a multivariate specification fits better than the null model (with intercept only, no IVs)– Compare GOF statistic for that model against critical value
for • Pertinent number of degrees of freedom• Type of test statistic
• E.g., evaluate how well that set of IVs collectively explain variation in the dependent variable (DV)
The Chicago Guide to Writing about Multivariate Analysis, 2nd Edition.
Difference in goodness of fit across models
• To test whether additional or different variables yield a statistically significant improvement in model fit
• Estimate series of models using a consistent sample• Calculate– Difference in GOF statistic across models– Difference in number of degrees of freedom for those
models
• Compare to critical value for the test statistic with pertinent number of degrees of freedom
The Chicago Guide to Writing about Multivariate Analysis, 2nd Edition.
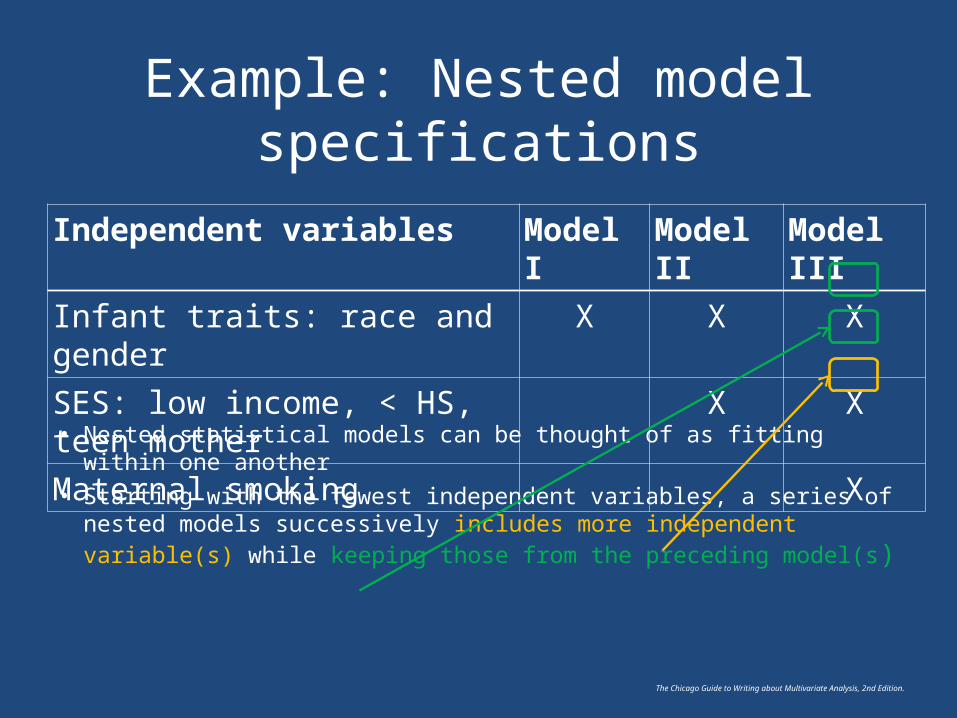
Example: Nested model specifications
Independent variables Model I Model II Model IIIInfant traits: race and gender X X XSES: low income, < HS, teen mother X XMaternal smoking X
• Nested statistical models can be thought of as fitting within one another• Starting with the fewest independent variables, a series of nested
models successively includes more independent variable(s) while keeping those from the preceding model(s)
The Chicago Guide to Writing about Multivariate Analysis, 2nd Edition.
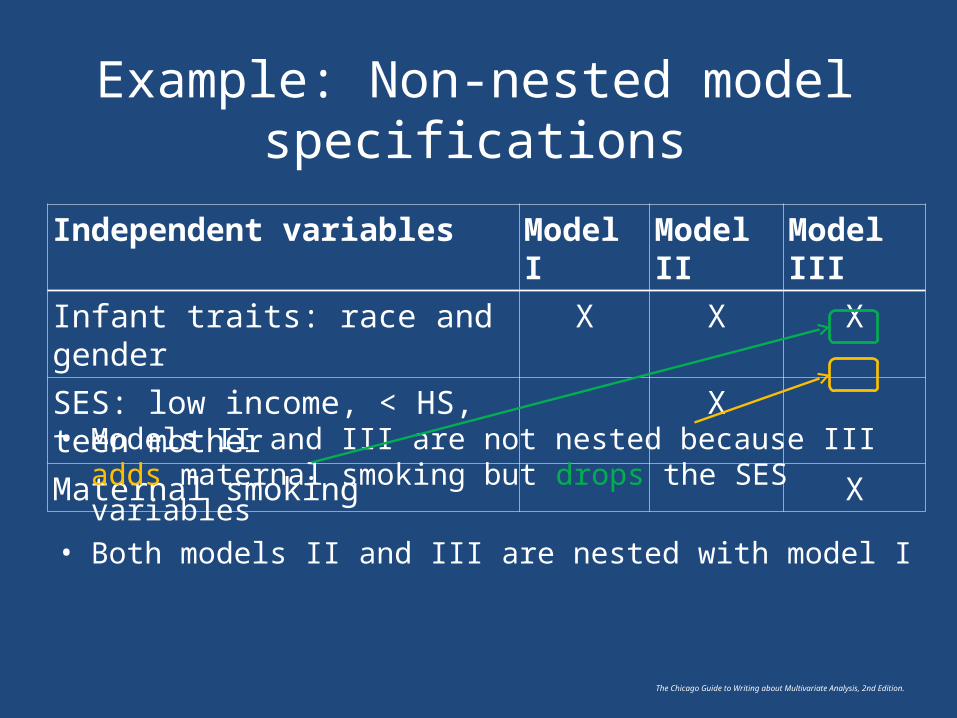
Example: Non-nested model specifications
Independent variables Model I Model II Model IIIInfant traits: race and gender X X XSES: low income, < HS, teen mother XMaternal smoking X
• Models II and III are not nested because III adds maternal smoking but drops the SES variables
• Both models II and III are nested with model I

The Chicago Guide to Writing about Multivariate Analysis, 2nd Edition.
Other examples of non-nested model specifications
• Alternative baseline hazards specifications, e.g.,– Exponential– Weibull– Gompertz
• Different HLM specifications, e.g.,– Unconditional means– Fixed effects– Random effects
• Different interaction specifications
The Chicago Guide to Writing about Multivariate Analysis, 2nd Edition.
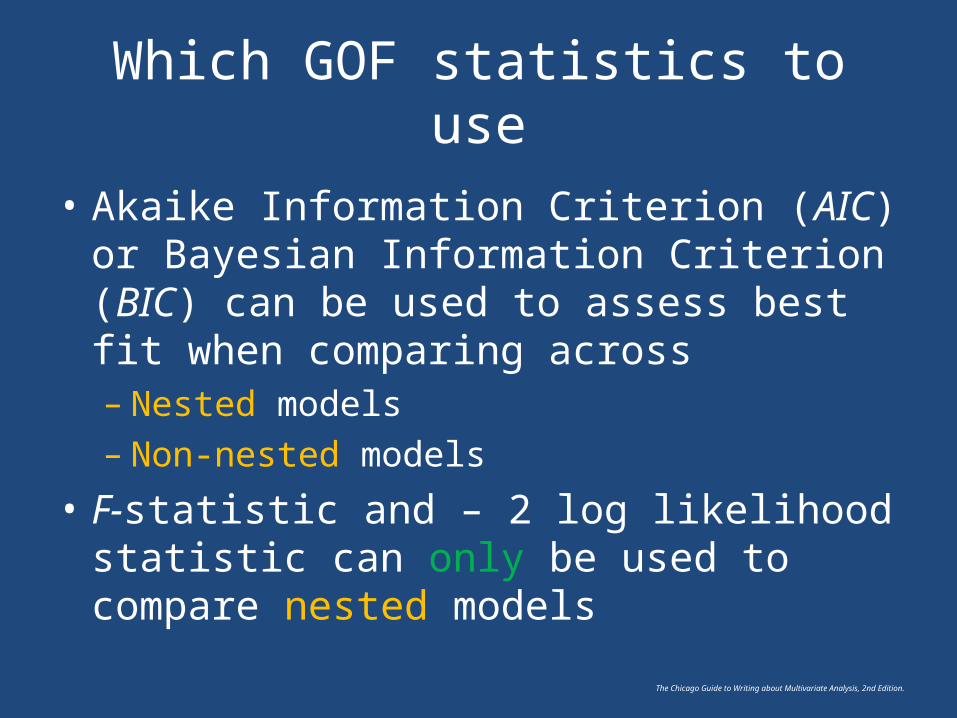
Which GOF statistics to use
• Akaike Information Criterion (AIC) or Bayesian Information Criterion (BIC) can be used to assess best fit when comparing across– Nested models– Non-nested models
• F-statistic and – 2 log likelihood statistic can only be used to compare nested models
The Chicago Guide to Writing about Multivariate Analysis, 2nd Edition.
F-statistic and –2 log likelihood statistic
The Chicago Guide to Writing about Multivariate Analysis, 2nd Edition.
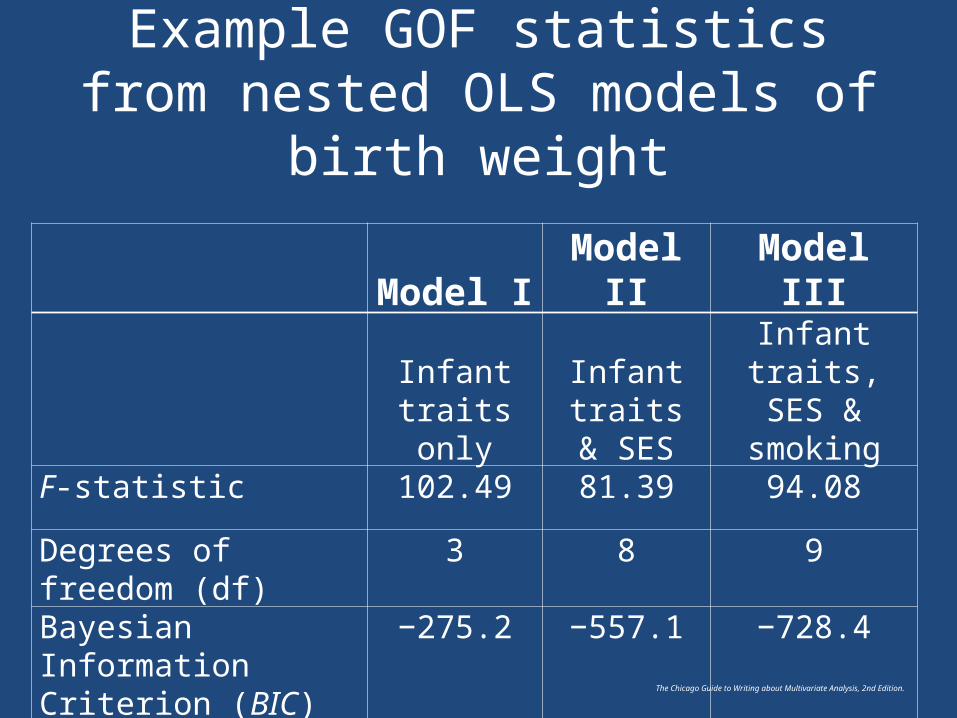
Example GOF statistics from nested OLS models of birth weight
Model I Model II Model IIIInfant traits
onlyInfant traits
& SESInfant traits,
SES & smokingF-statistic 102.49 81.39 94.08
Degrees of freedom (df) 3 8 9
Bayesian Information Criterion (BIC)
−275.2 −557.1 −728.4
The Chicago Guide to Writing about Multivariate Analysis, 2nd Edition.
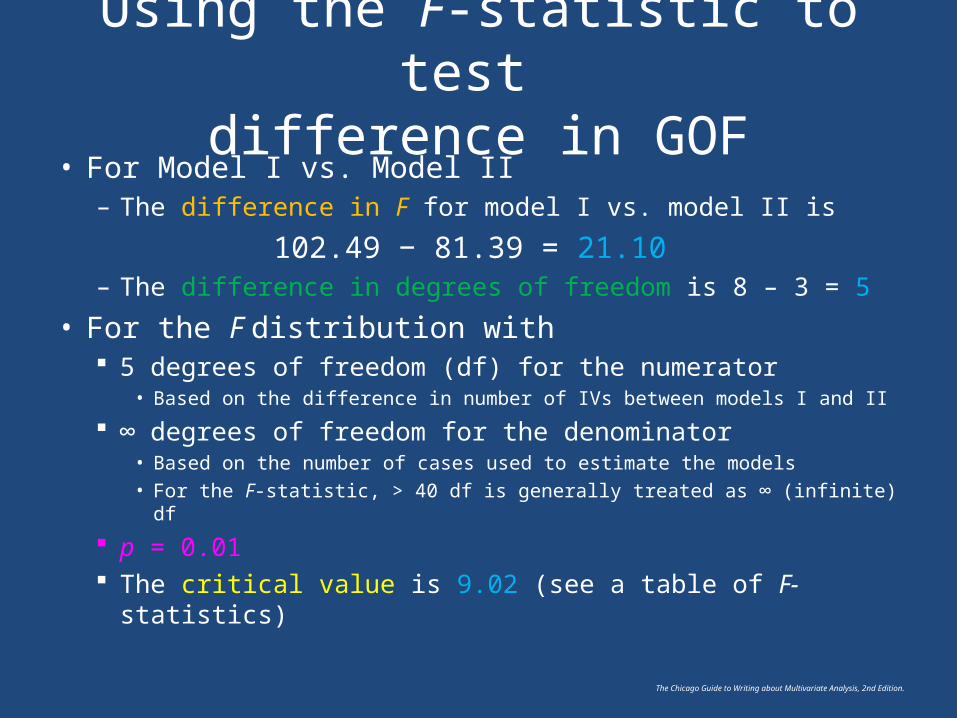
Using the F-statistic to test difference in GOF
• For Model I vs. Model II– The difference in F for model I vs. model II is
102.49 − 81.39 = 21.10 – The difference in degrees of freedom is 8 – 3 = 5
• For the F distribution with 5 degrees of freedom (df) for the numerator
• Based on the difference in number of IVs between models I and II
∞ degrees of freedom for the denominator • Based on the number of cases used to estimate the models• For the F-statistic, > 40 df is generally treated as ∞ (infinite) df
p = 0.01 The critical value is 9.02 (see a table of F-statistics)
The Chicago Guide to Writing about Multivariate Analysis, 2nd Edition.
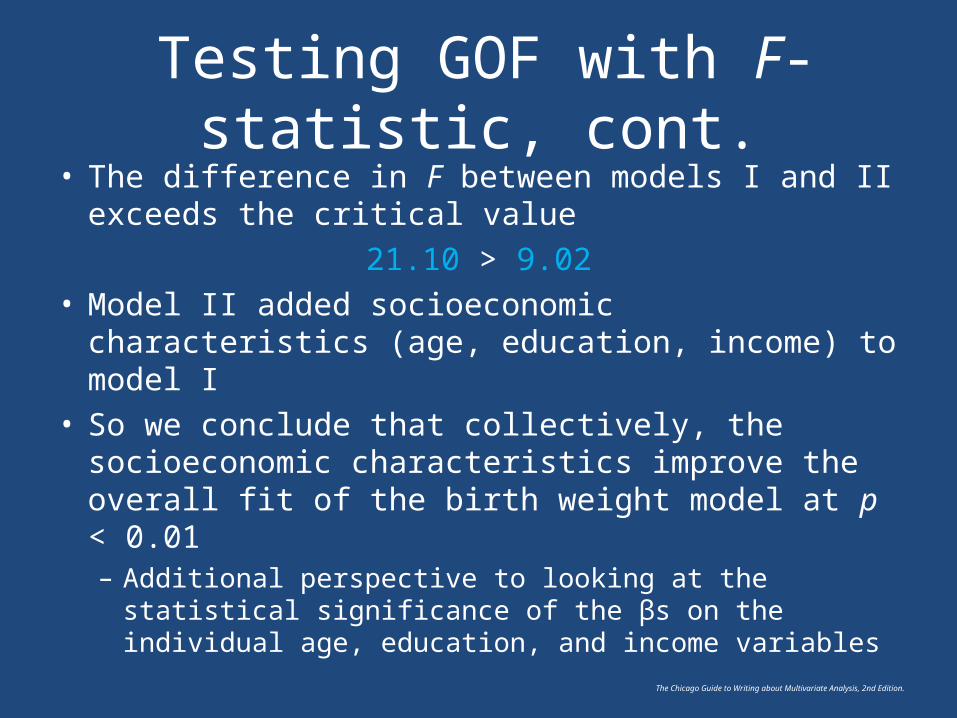
Testing GOF with F-statistic, cont.• The difference in F between models I and II exceeds
the critical value 21.10 > 9.02
• Model II added socioeconomic characteristics (age, education, income) to model I
• So we conclude that collectively, the socioeconomic characteristics improve the overall fit of the birth weight model at p < 0.01– Additional perspective to looking at the statistical
significance of the βs on the individual age, education, and income variables
The Chicago Guide to Writing about Multivariate Analysis, 2nd Edition.
Testing GOF for logit models
• To compare fit across a series of nested logistic models use the −2 Log likelihood statistics
• Logic is analogous to that for F-statistic: Calculate– Difference in model GOF– Difference in number of degrees of freedom (df)– Compare to critical value with pertinent number of
degrees of freedom

The Chicago Guide to Writing about Multivariate Analysis, 2nd Edition.
Akaike Information Criterion (AIC) and Bayesian Information Criterion (BIC)
The Chicago Guide to Writing about Multivariate Analysis, 2nd Edition.
AIC and BIC correct for the number of IVs in the model
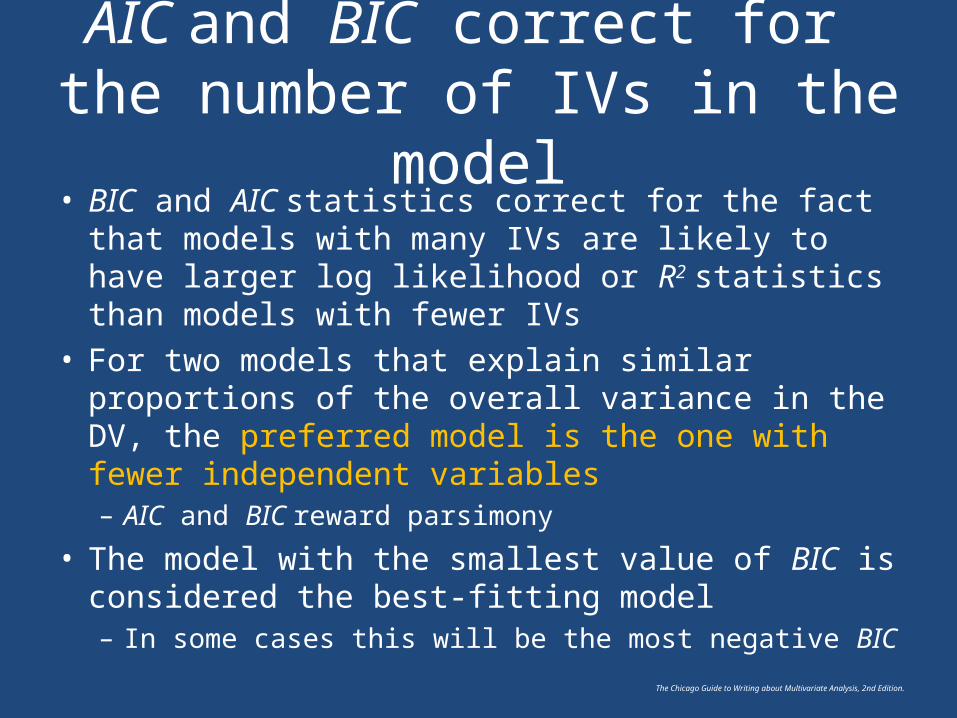
• BIC and AIC statistics correct for the fact that models with many IVs are likely to have larger log likelihood or R2 statistics than models with fewer IVs
• For two models that explain similar proportions of the overall variance in the DV, the preferred model is the one with fewer independent variables – AIC and BIC reward parsimony
• The model with the smallest value of BIC is considered the best-fitting model– In some cases this will be the most negative BIC

The Chicago Guide to Writing about Multivariate Analysis, 2nd Edition.
Formula for Akaike Information Criterion (AIC)
• For OLS models AICk = N × ln(SSEk/N) + 2(pk + 1)
SSE = error sum of squares pk = # of independent variables in model k N = sample size
• For logit modelsAICk = –2 log likelihoodk + 2pk
• Can be requested as an option to the regression command, or manually calculated from standard regression output
The Chicago Guide to Writing about Multivariate Analysis, 2nd Edition.
Example: Using AIC to assess GOF for a logit model
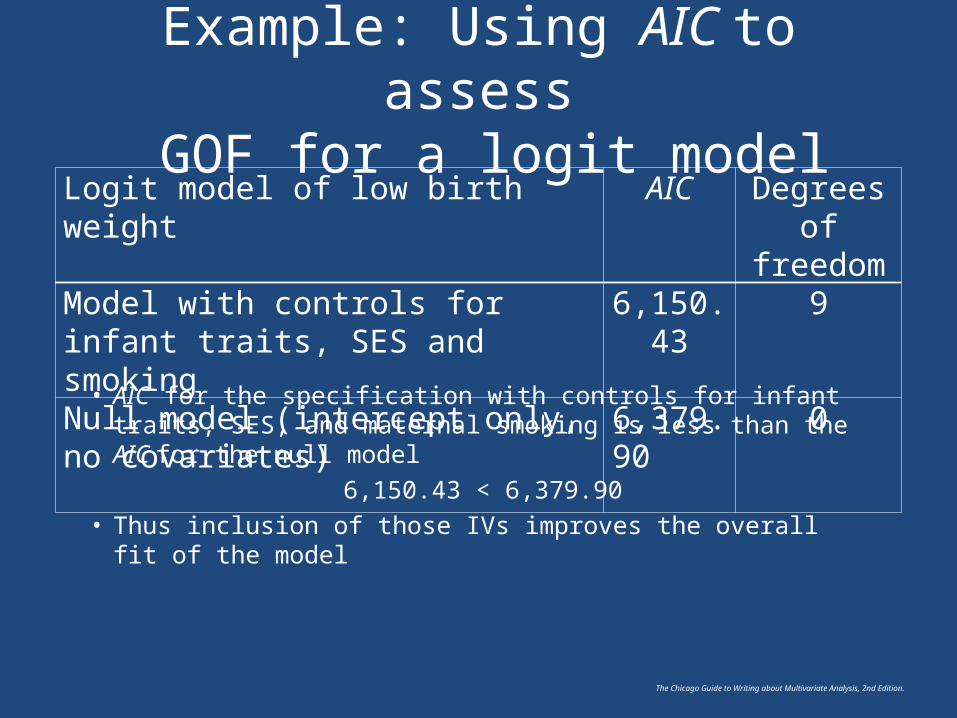
• AIC for the specification with controls for infant traits, SES, and maternal smoking is less than the AIC for the null model
6,150.43 < 6,379.90• Thus inclusion of those IVs improves the overall fit of the
model
Logit model of low birth weight AIC Degrees of freedom
Model with controls for infant traits, SES and smoking
6,150.43 9
Null model (intercept only, no covariates)
6,379.90
0
The Chicago Guide to Writing about Multivariate Analysis, 2nd Edition.
Formula for Bayesian Information Criterion (BIC)
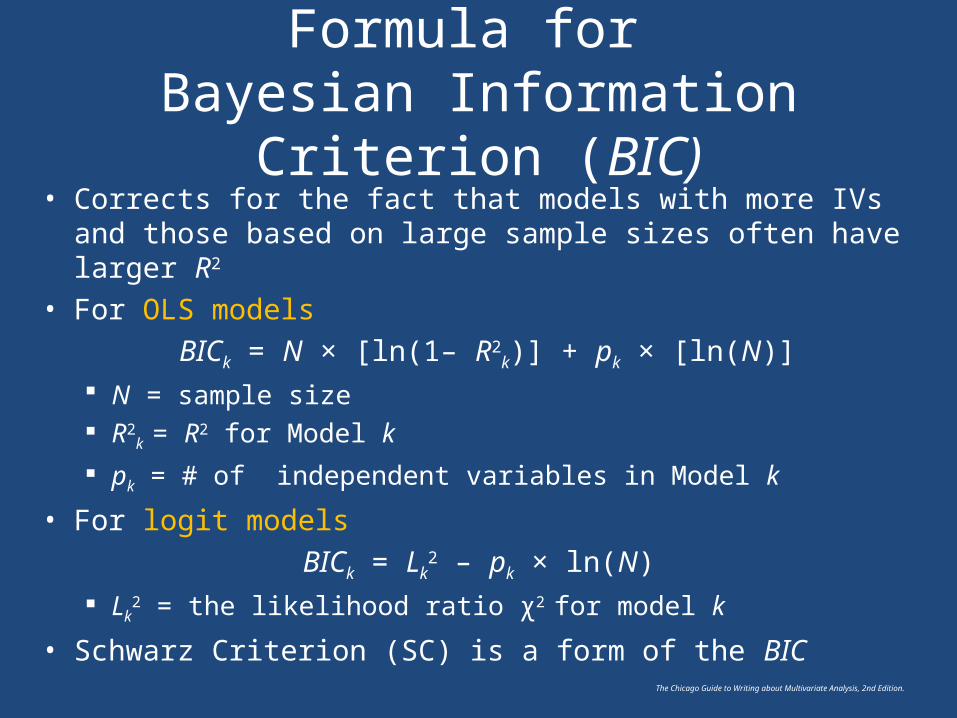
• Corrects for the fact that models with more IVs and those based on large sample sizes often have larger R2
• For OLS models BICk = N × [ln(1– R2
k)] + pk × [ln(N)] N = sample size R2
k = R2 for Model k
pk = # of independent variables in Model k
• For logit modelsBICk = Lk
2 – pk × ln(N) Lk
2 = the likelihood ratio χ2 for model k
• Schwarz Criterion (SC) is a form of the BIC
The Chicago Guide to Writing about Multivariate Analysis, 2nd Edition.
Example: Using BIC to test difference in GOF
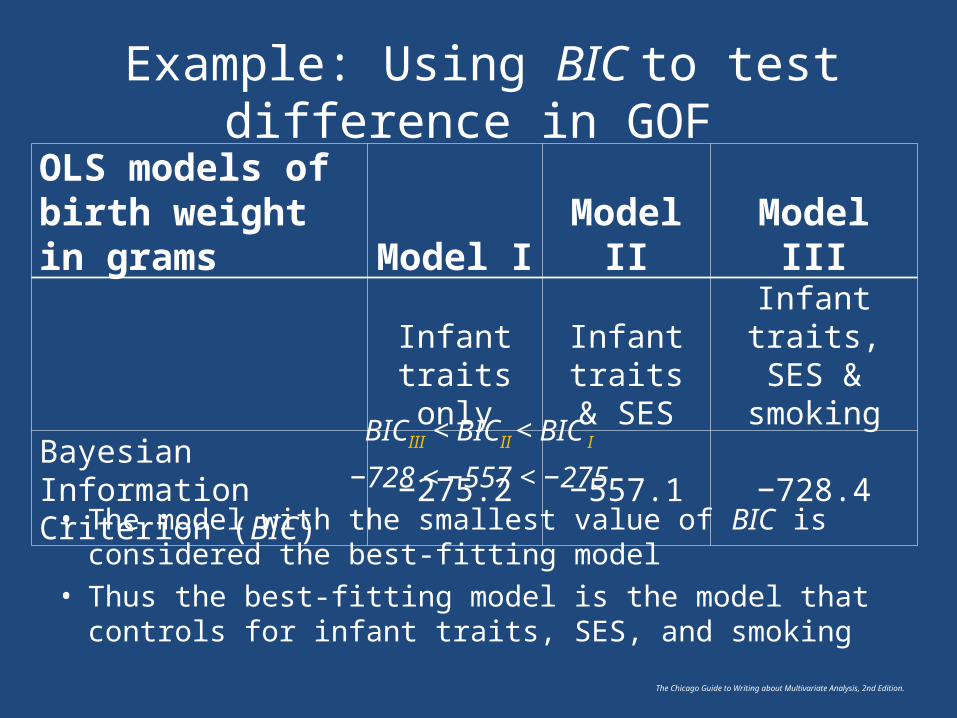
BICIII < BICII < BIC I
−728 < −557 < −275• The model with the smallest value of BIC is considered the
best-fitting model• Thus the best-fitting model is the model that controls for
infant traits, SES, and smoking
OLS models of birth weight in grams Model I Model II Model III
Infant traits only
Infant traits & SES
Infant traits, SES & smoking
Bayesian Information Criterion (BIC) −275.2 −557.1 −728.4
The Chicago Guide to Writing about Multivariate Analysis, 2nd Edition.
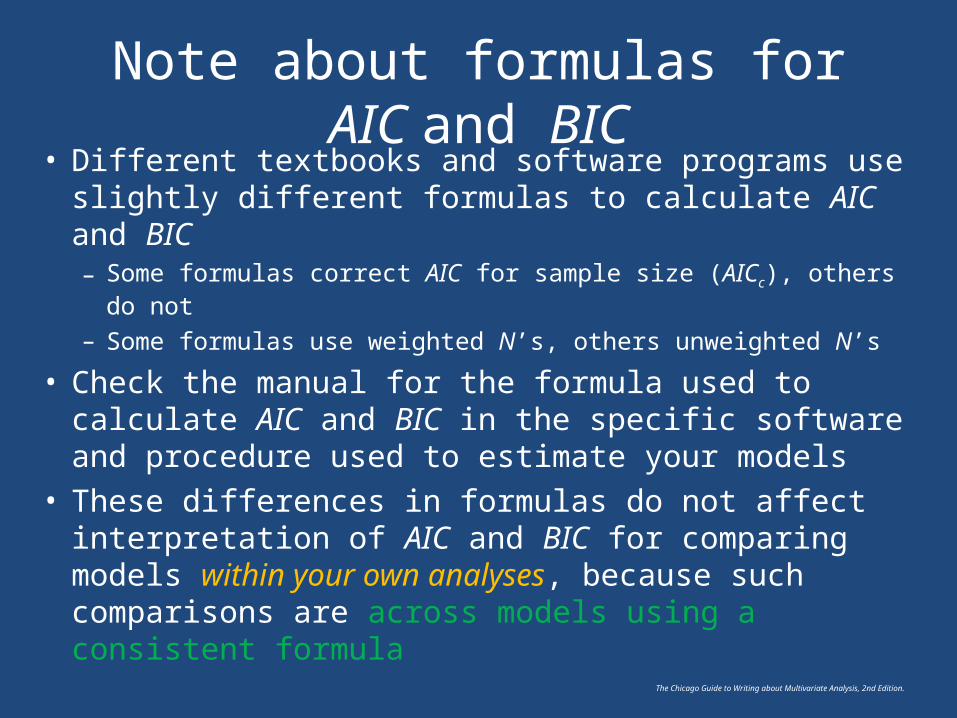
Note about formulas for AIC and BIC• Different textbooks and software programs use slightly
different formulas to calculate AIC and BIC– Some formulas correct AIC for sample size (AICc), others do not
– Some formulas use weighted N’s, others unweighted N’s
• Check the manual for the formula used to calculate AIC and BIC in the specific software and procedure used to estimate your models
• These differences in formulas do not affect interpretation of AIC and BIC for comparing models within your own analyses, because such comparisons are across models using a consistent formula
The Chicago Guide to Writing about Multivariate Analysis, 2nd Edition.
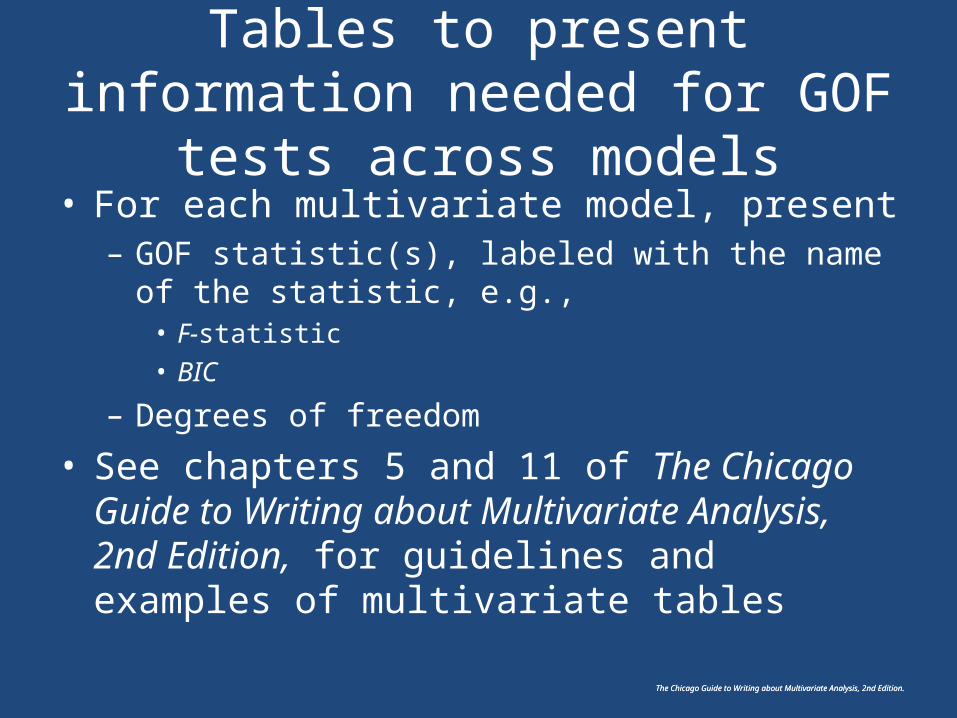
Tables to present information needed for GOF tests across models
• For each multivariate model, present– GOF statistic(s), labeled with the name of the statistic, e.g.,
• F-statistic• BIC
– Degrees of freedom
• See chapters 5 and 11 of The Chicago Guide to Writing about Multivariate Analysis, 2nd Edition, for guidelines and examples of multivariate tables
The Chicago Guide to Writing about Multivariate Analysis, 2nd Edition.
The Chicago Guide to Writing about Multivariate Analysis, 2nd Edition.
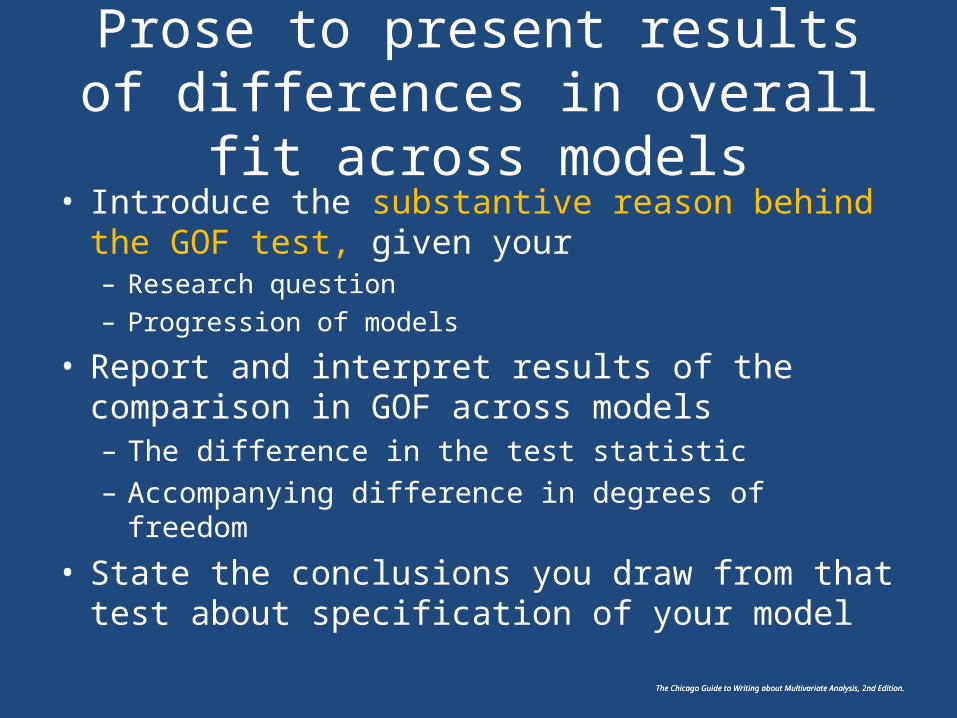
Prose to present results of differences in overall fit across models
• Introduce the substantive reason behind the GOF test, given your – Research question – Progression of models
• Report and interpret results of the comparison in GOF across models – The difference in the test statistic – Accompanying difference in degrees of freedom
• State the conclusions you draw from that test about specification of your model
The Chicago Guide to Writing about Multivariate Analysis, 2nd Edition.
The Chicago Guide to Writing about Multivariate Analysis, 2nd Edition.
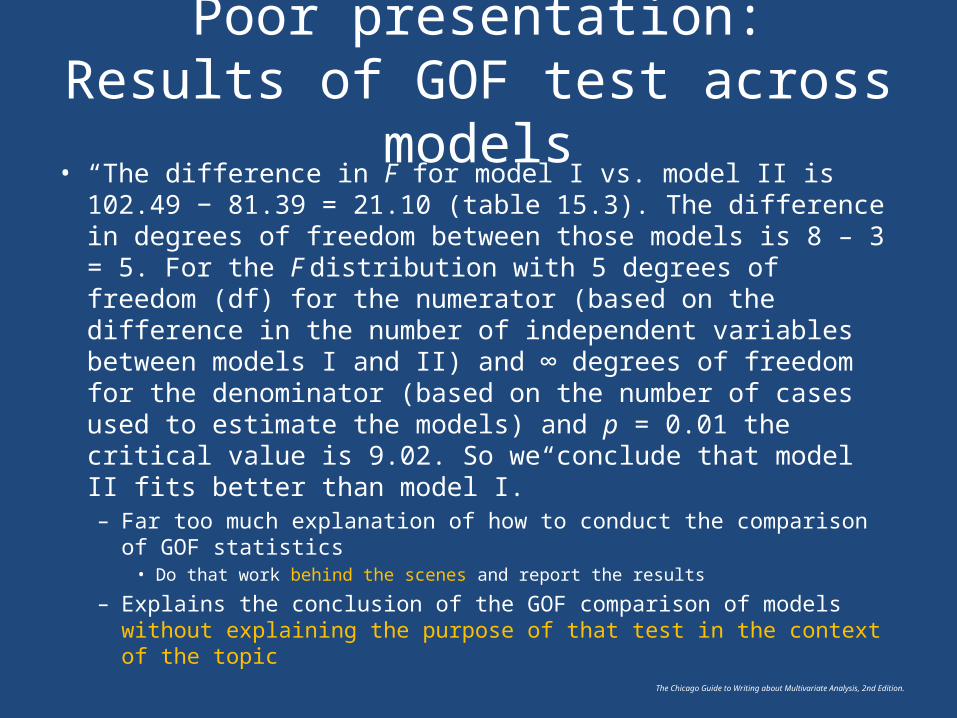
Poor presentation:Results of GOF test across models
• “The difference in F for model I vs. model II is 102.49 − 81.39 = 21.10 (table 15.3). The difference in degrees of freedom between those models is 8 – 3 = 5. For the F distribution with 5 degrees of freedom (df) for the numerator (based on the difference in the number of independent variables between models I and II) and ∞ degrees of freedom for the denominator (based on the number of cases used to estimate the models) and p = 0.01 the critical value is 9.02. So we conclude that model II fits better than model I.”– Far too much explanation of how to conduct the comparison of GOF
statistics• Do that work behind the scenes and report the results
– Explains the conclusion of the GOF comparison of models without explaining the purpose of that test in the context of the topic
The Chicago Guide to Writing about Multivariate Analysis, 2nd Edition.
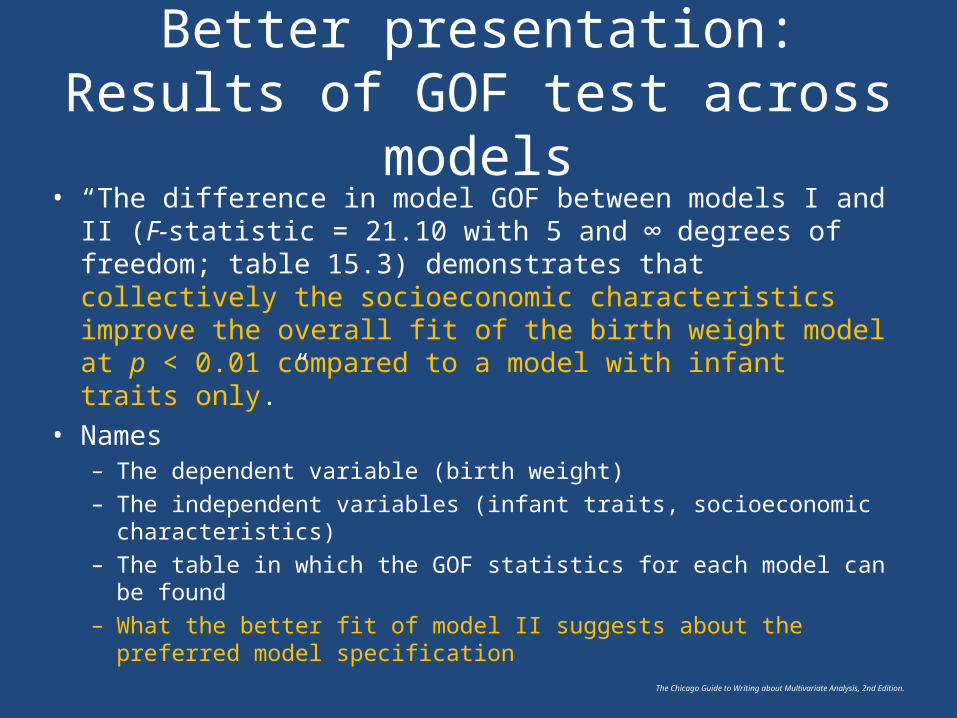
Better presentation:Results of GOF test across models
• “The difference in model GOF between models I and II (F-statistic = 21.10 with 5 and ∞ degrees of freedom; table 15.3) demonstrates that collectively the socioeconomic characteristics improve the overall fit of the birth weight model at p < 0.01 compared to a model with infant traits only.”
• Names– The dependent variable (birth weight)– The independent variables (infant traits, socioeconomic characteristics)– The table in which the GOF statistics for each model can be found– What the better fit of model II suggests about the preferred model
specification
The Chicago Guide to Writing about Multivariate Analysis, 2nd Edition.
Summary• Difference in model goodness of fit (GOF) statistics can
test whether additional or different variables yield a statistically significant improvement in overall model fit
• F- statistics and –2 log likelihood statistics can only be used to compare nested models
• AIC and BIC can be used to compare either nested or non-nested models
• Present results of GOF comparison – Use a combination of tables and prose– Describe conclusions, not process– Relate to topic at hand
The Chicago Guide to Writing about Multivariate Analysis, 2nd Edition.
The Chicago Guide to Writing about Multivariate Analysis, 2nd Edition.
Suggested resources
• Cohen, Jacob, Patricia Cohen, Stephen G. West, and Leona S. Aiken. 2003. Applied Multiple Regression/Correlation Analysis for the Behavioral Sciences, 3rd Edition. Florence, KY: Routledge.
• Miller, J. E. 2013. The Chicago Guide to Writing about Multivariate Analysis, 2nd Edition. University of Chicago Press, chapters 5 and 15.
• Treiman, Donald J. 2009. Quantitative Data Analysis: Doing Social Research to Test Ideas. San Francisco: Jossey-Bass.
The Chicago Guide to Writing about Multivariate Analysis, 2nd Edition.
The Chicago Guide to Writing about Multivariate Analysis, 2nd Edition.
Suggested online resources
• Podcast on testing whether a multivariate specification can be simplified
The Chicago Guide to Writing about Multivariate Analysis, 2nd Edition.
Suggested practice exercises
• Study guide to The Chicago Guide to Writing about Multivariate Analysis, 2nd Edition.– Question #8 in the problem set for chapter 15– Suggested course extensions for chapter 15• “Reviewing” exercise #2• “Applying statistics and writing” exercises #1, 2, and 5• “Revising” exercise #2
– Suggested course extensions for chapter 16• “Reviewing” exercise #2
The Chicago Guide to Writing about Multivariate Analysis, 2nd Edition.

The Chicago Guide to Writing about Multivariate Analysis, 2nd Edition.
Contact information
Jane E. Miller, [email protected]
Online materials available athttp://press.uchicago.edu/books/miller/multivariate/index.html
The Chicago Guide to Writing about Multivariate Analysis, 2nd Edition.