Embed Size (px)
Citation preview

The Chicken or the Egg
Gail Mora, CQA, CMQOE
Sr. Quality Administrator
University of NM Health System
1

An excellent use of time and money.
2

This was my assigned topic:
3
Quality Principles for Effectively
Using Data and Information as
the Bridge between Operational
Processes and Performance.

Table Roles and Responsibilities
1. Expediter – Keeps the discussion moving
and participatory.
2. Articulator – Articulates the table’s main
discussion point(s) in <1 minutes.
3. Disciplinarian – Ensures table compliance.
4. Brainiac – Those who know the knowns
and the unknowns.
4

“In God we trust; all others bring data.”
― W. Edwards Deming
5

6

What is Data and Information?Data: Facts or information used usually to calculate, analyze, or
plan something. Information that is produced or stored by a
computer. (MW)
Measures and Indicators: Numerical information (unit or standard of
measure) that quantifies the input, output and performance
dimensions of processes, programs, projects, services and the
overall organization outcomes. (Baldrige)
Metrics: Often used interchangeable with the term Measures. Can
be qualitative or quantitative.
Goal: Future conditions or performance levels that your
organization intends or desired to attain. (Baldrige)

How is data used?
Baldrige Category 4 Measurement, Analysis and Knowledge Management
4.1 How do you measure, analyze, and
then improve organizational performance?Note: Data and information from performance measurement should be used to support
fact-based decisions that set and align organizational directions and resource use at
the work unit, key process, department, and organization levels.
4.2 How do you manage your
organizational assets, information, and
information technology infrastructure?4.2 a.(2) How do you use your knowledge and resources to embed learning in the way
your organization operates?
8

Which came first; data or performance?
9
Data and Performance are
Mutually Dependent.
In Quality they are
mutually dependent.
You can’t have one
without the other.
10
It doesn’t matter.
Principle 1:

An effective QMS must have both.
An effective leadership system must have both.
An effective strategic deployment must have both
An effective business plan must have both.
An effective improvement project must have both.
An effective audit program must have both.
An effective personal growth program must have both.
11

Table Question…
How often does data and
information shape your life?
• Daily/ Hourly/ Minute to Minute
• Weather/ Travel/ Coats
• Budget/ Income
• Time/ Time zones
• $Food costs/ #Calories/ %Nutrients
12

Data can’t make things better,
but data helps us decide what
needs to be better.
13
14

Principle 2
Expect data to change.
Metrics are the most volatile category of
a QMS.
WHY?
15

Table Question:
What changes have you seen in data
and information in the last 3 -5 years?
16

As the unknowns become known,
we must adjust the data.
17
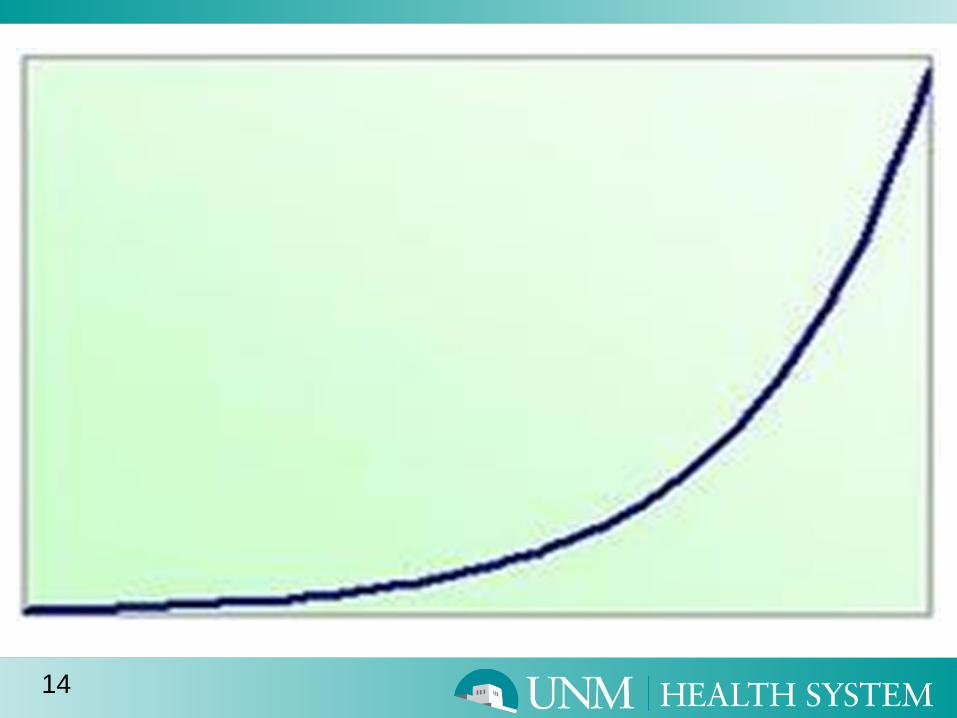
Table Question…
What brand spanking
new data requirement/
request has presented
itself in the last 30
days in your
organization?
And what was the
time frame given to
meet that
requirement?
18
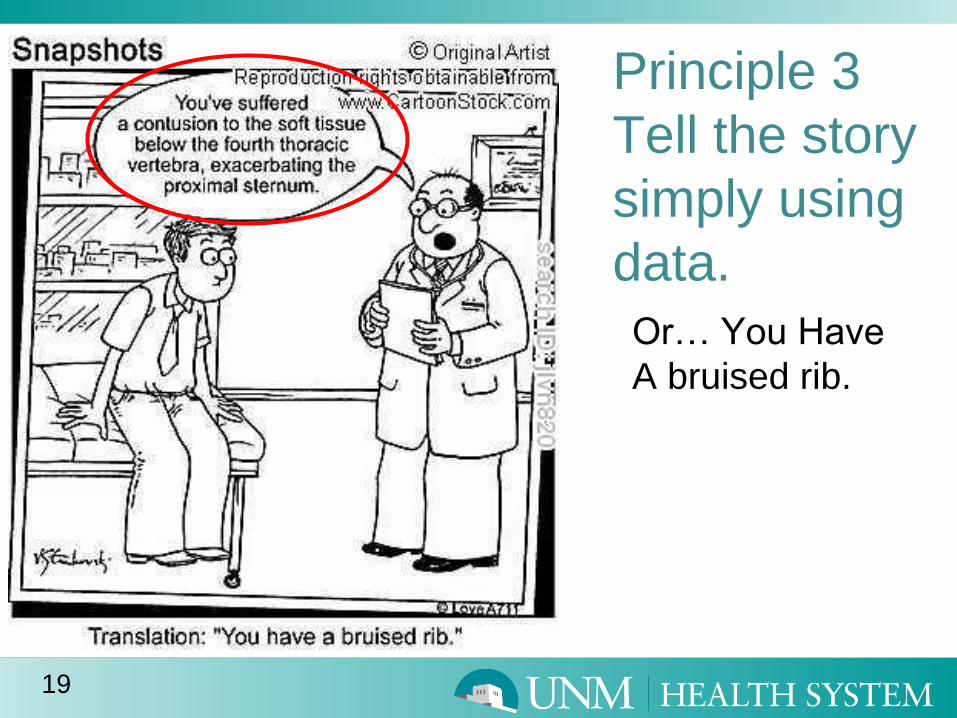
Principle 3
Tell the story
simply using
data.
Or… You Have
A bruised rib.
19
Story..
1. Here’s the undesired situation.
2. Here’s how we know the undesired situation
exists.
3. We need to change from an undesired situation to
a desired outcome.
4. Here’s what the desired outcome should look like.
5. Here’s how we will know we have achieved the
desired outcome.
20

Which tells the story simply?
This one? Or this one?
21

How about here…
This one? Or this one?
22

What about here?
Being told you have a
broken leg?
or seeing a picture of your
broken leg?
23

Visuals are key to simplifying and
sharing the story.
Without visualizing your story,
the project may be unsupported,
ineffective and you might miss
the boat altogether.
24

Principle 4
Identify your starting point.
25
35.113281, and 106.621216
Latitude/Longitude

Options available to help.
• Research and study the data, if data
exists.
• Engage in a first, second or third part
audit to gain understanding.
• Solicit input, feedback from those
impacted.
26

Starting points must be based
in fact. Find out.
Starting points can be
intimidating, shocking,
depressing, surprising,
disappointing etc.…but
the message is KNOW
your starting point.
Without knowledge,
and as human
beings… we tend to
think that ourselves,
our children, our
department, our
organization, etc. as
performing better than
it actually is.
27
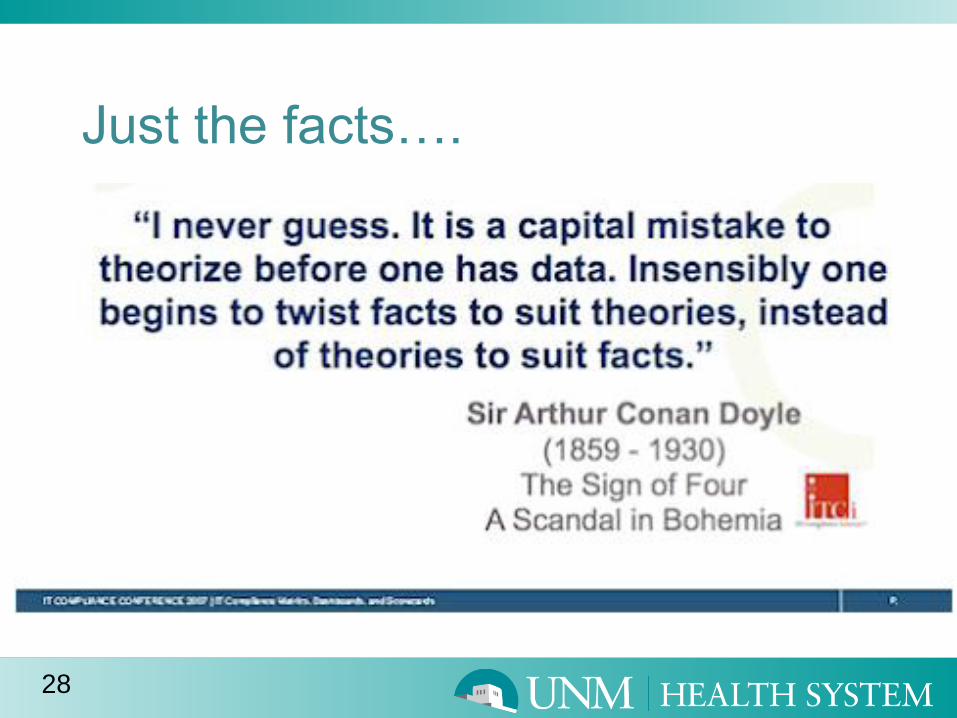
Just the facts….
28

29
Olympics
Phelps Wins 7th Gold With 0.01 to SpareB
Michael Phelps, in lane five, takes his last breath as he hits
the wall for his 7th gold medal in Beijing. Credit Doug Mills/The New York Times By KAREN CROUSEAUG. 15, 2008

Principle 5. Define what success
looks like.
• What is the desired outcome?
• Is it gaining a better understanding?
• It is a change in behavior?
• Is it a change in thinking?
• Less risk?
• Better efficiency?
• Lower numbers? Higher numbers?
30

Table Question
Is your organization…
a) better at identifying the starting point or
b) better at identifying what success looks
like
Provide table ratio
31

Keep in mind…1. What you stop doing is just as important as
what you start doing.
2. Identify the process(es) that impact the
defined desired outcome.
3. Identify the data needed to understand if
changes you make to the process(es) are
leading to the desired outcome.
4. To change the outcome, you must change
the process.
32

Principle 6: Choose data carefully.
33
P.S. You don’t need to know everything.

Who said…What gets measured
gets managed…?Compliance, Process, Workload…etc.
34

Let’s use an common example…
I want to lose 10 pounds and keep it off.. Using our fact-based story.
1. Undesired situation: I’m gaining weight.
2. Here’s how I know: 5 out of 5 pants in my closet are too
tight when I put them on and the scale says I’m 10 pounds
more than I was last year.
3. Transformation: I need to stop gaining weight and lose
10 pounds.
4. Desired outcome: Weight loss and pants fit nicely.
5. How will I know I’m successful? I will try on 5 out of 5
pants for fit and weigh myself on the scale for weight loss
from identified starting point. If I’ve lost 10 pounds and
pants fit nicely then I have been successful.
35

Next, choose data carefully.
Is losing 10 pounds and getting pants to fit about the process or the
outcome?
THE PROCESS
And yet, many people measure weight loss by looking at the scale.
And what does the scale offer?
THE OUTCOME
This is the difference between Correction and Corrective Action.
This is why so many improvement plans fail or fail to be sustained.
The data focuses on correction - the outcome… rather than on the
process and hardwiring in the change which is Corrective Action.
The common mistake made, is singularly using Outcome Data
when one should be focusing on Process Effectiveness Data first.
36

Use Process Effectiveness Data
Instead… the data measured must be based in the
process.
• For example: I will consume no sugar between noon
and midnight everyday and I will walk 2 miles 3
times/wk between today and Dec. 1st. If I accomplish
these actions - I have succeeded.
• Sure, I will know I have lost 10 pounds by what the
scale says on Dec 1, but it cannot be sustained
unless the process is altered.
This is the difference between correction and corrective
action.
37

Benchmarking:
Becoming the best.
Comparative data - Must have to be top performing.
Top Box- Strongly Agree is really what you are looking for!
When you Agree your meal was satisfactory, what are you really
saying? NOTHING
What table tells you more?
38

39
Link data to the desired behaviors.
• Decide what processes are needed to
support the desired outcome.
• Make this an open inclusive process. ASK
• How will behaviors and actions be
consistently measured?
• What processes must be performed
precisely?
• Document what was decided.
40
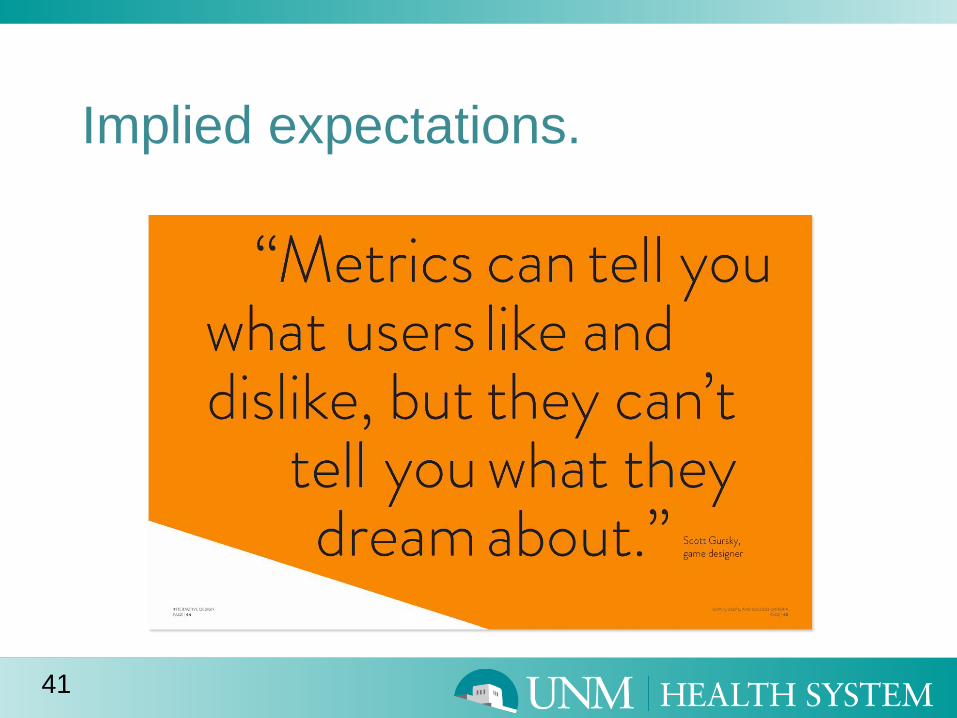
Implied expectations.
41

and measure the right thing!
42

43
Principle 7
No Chasing Metrics
Many metrics reflect process outcomes.
Better processes, better training, better
compliance may be metrics.
But remember….Change the
process to change the outcome.

Table Question
What is the
best way you
have found to
avoid chasing
metrics?
44

Quality is the antonym of Inertia, Why?
45

Principle 8 LEARN!
What does it mean to learn?
46
Secret to it all…
Only when deliberate, disciplined and
consistent use of data and quality
principles/ concepts/ tools are used to
learn, make decisions and improve;
will one attain the highest level of
performance, affectionately known as
excellence.
47

Resources
spent on
Data
48
Resources
spent on
Improving

What % of the data
your organization
gathers, tracks and
reports on… are used
in your organization’s
learning and
improvement loops?
49
Table Question…

50

In 2017
How will you
approach data
differently?
51

The 8 Chicken and Egg Principles
1. Data and Performance are mutually dependent.
2. Expect data to change.
3. Tell the story simply using data.
4. Identify your starting point.
5. Define what success looks like (end point).
6. Choose data carefully.
7. Avoid chasing metrics.
8. LEARN!
52

Remember!
Stop doing
what’s
inefficient.
Once
unknowns
become
known, move
on.
53

Use the 8 Principles…don’t forget
to use your support system…and
Go for Excellence!
54