Embed Size (px)
Citation preview

The Child Measurement Programme for Wales 2016/17

2 The Child Measurement Programme for Wales 2016/17
Production team
Linda Bailey – Consultant in Public Health / Health Intelligence
Ciarán Humphreys – Director of Health Intelligence
Leon May – Senior Public Health Intelligence Analyst
Rhys Powell – Senior Public Health Intelligence Analyst
Hugo Cosh – Principal Public Health Intelligence Analyst
Zoe Strawbridge – Public Health Intelligence Analyst
James Allen – Public Health Intelligence Analyst
Lloyd Evans – Advanced Public Health Intelligence Analyst
Megan Luker – Public Health Information Officer
Lance Webster – Ridler Webster Ltd
Rhian Huws – Canna Translation
Data extraction
Gareth John (NHS Wales Informatics Service)
Acknowledgements
Many thanks to the families and children who participated in the programme and to all the staff in Health Boards who have supported the programme across Wales.
Publication detailsTitle: Child Measurement Programme for Wales 2016/17
Publisher: Public Health Wales NHS Trust
Date: 19th April 2018
ISBN 978-1-910768-46-4
For further information please contact: childmeasurementprogramme @wales.nhs.uk
Website: www.publichealthwales.org/childmeasurement
© 2018 Public Health Wales NHS Trust.
Material contained in this document may be reproduced under the terms of the Open Government Licence (OGL)
www.nationalarchives.gov.uk/doc/open-government-licence/version/3/ provided it is done so accurately and is not used in a misleading context.
Acknowledgement to Public Health Wales NHS Trust to be stated. Copyright in the typographical arrangement, design and layout belongs to Public Health Wales NHS Trust.
The Child Measurement Programme for Wales 2016/17 3
ContentsCharts, tables and maps 4
Introduction 5
Summary 5
Results 6
Healthy weight 6
Healthy weight or underweight 6
Obesity 7
Deprivation 8
Ethnicity 9
Urban / rural analysis 10
Comparison 11
Participation 12
Abbreviations 13

4 The Child Measurement Programme for Wales 2016/17
Charts, tables and maps Page
Figure 1 – Percentage of children aged 4 to 5 years who are underweight, healthy weight, overweight or obese 2012/13 – 2016/17 in Wales 5
Figure 2 – Percentage of children aged 4 to 5 who are obese, health boards and local authorities, 2016/17 7
Figure 3 – Percentage of children aged 4 to 5 years who are obese, most and least deprived fifth in Wales, 2016/17 9
Figure 4 – Percentage of children aged 4 to 5 years who are obese by ethnic group 2012/13 - 2016/17 10
Figure 5 – Percentage of children aged 4 to 5 years who are overweight or obese, rural and urban areas in Wales 2016/17 10
Figure 6 – Percentage of children aged 4 to 5 years who are overweight or obese, Wales, England and the English regions, Child Measurement Programme for Wales and the National Child Measurement Programme (England) 2016/17 11
Table 1 – Participation in the Child Measurement Programme for Wales since 2012/13 12
The Child Measurement Programme for Wales 2016/17 5
Introduction
This report contains key findings of the Child Measurement Programme for Wales (CMP). The full analysis, including data tables, graphs and maps are presented on the Child Measurement Programme website at: www.publichealthwales.org/childmeasurement
Information about the history of the programme and how information is collected and analysed is also available on the website. The downloadable document “The Child Measurement Programme for Wales: history, legislative framework and technical aspects” gives information on measurement of body mass index, prevalence categories used in Wales and how statistical significance is assessed.
This is the 6th year the programme has run, however the first year’s results are no longer included in analysis and discussion, as not all the CMP standards
and guidance were in place when the first year measurements were taken. The programme in Wales relates to measurements of children aged 4 to 5, who are both attending reception class in Wales, and have a residential postcode in Wales.
Summary
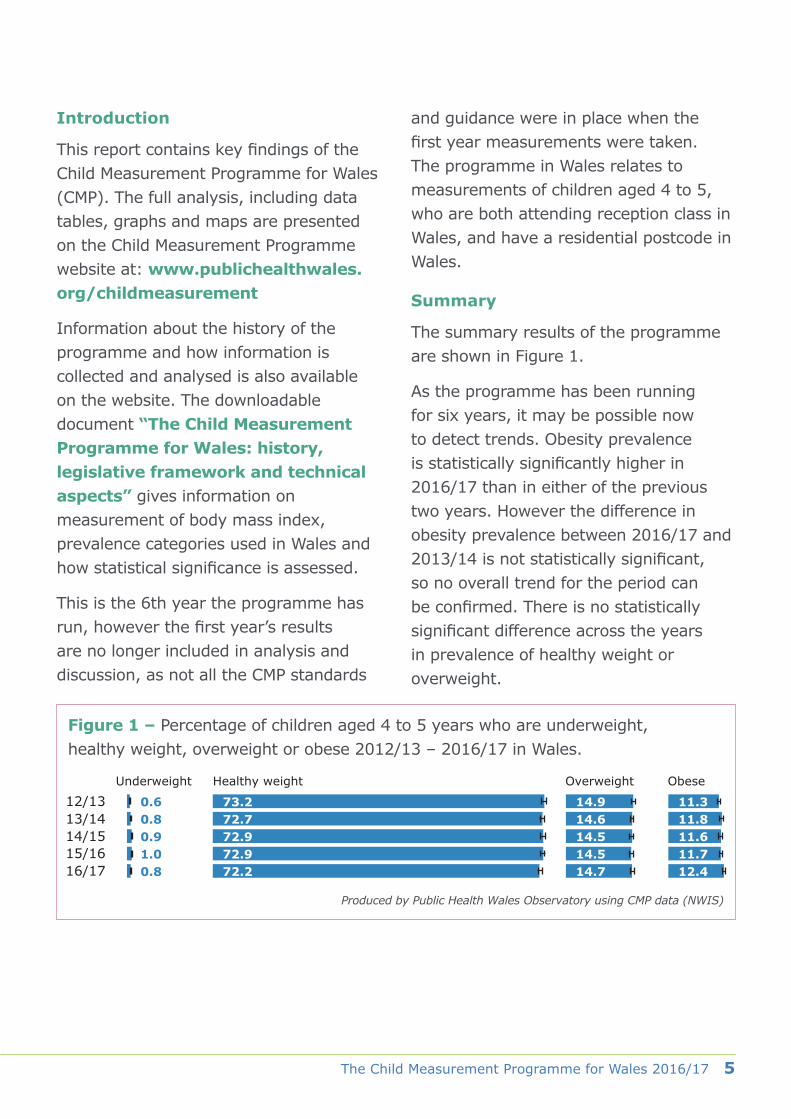
The summary results of the programme are shown in Figure 1.
As the programme has been running for six years, it may be possible now to detect trends. Obesity prevalence is statistically significantly higher in 2016/17 than in either of the previous two years. However the difference in obesity prevalence between 2016/17 and 2013/14 is not statistically significant, so no overall trend for the period can be confirmed. There is no statistically significant difference across the years in prevalence of healthy weight or overweight.
Figure 1 – Percentage of children aged 4 to 5 years who are underweight, healthy weight, overweight or obese 2012/13 – 2016/17 in Wales.
Produced by Public Health Wales Observatory using CMP data (NWIS)
73.272.772.972.972.2
14.914.614.514.514.7
11.311.811.611.712.4
0.60.80.91.00.8
12/13Underweight Healthy weight Overweight Obese
13/1414/1515/1616/17
6 The Child Measurement Programme for Wales 2016/17
ResultsHealthy weight
72.2% of children measured in Wales are of a healthy weight. The prevalence of healthy weight in girls (72.5%) is higher than in boys (71.9%) but the difference is not statistically significant at national level, nor it is significant at any local level.
Healthy weight or underweight
A very small percentage (0.8%) of children in Wales are categorised as underweight. Because of the risk of identification of individuals where small numbers are involved, the categories of underweight and healthy weight
are combined for some of the health boards and local authorities. At national level, 72.9% of children were either a healthy weight or underweight, There is significant variation at a more local level – 83% of children in the Vale of Glamorgan were in this category, while only 67.3% of children measured in Merthyr Tydfil were categorised as healthy weight or underweight.

The Child Measurement Programme for Wales 2016/17 7
Obesity
In 2016/17 obesity prevalence in this age group is higher than the Welsh average of 12.4% in two local authorities: Merthyr Tydfil (17.5%) and Blaenau Gwent (15.1%), and the difference is statistically significant. Cardiff (10.7%), the Vale of Glamorgan (7.8%) and Monmouthshire (8.0%) are three local authority areas where obesity prevalence
is statistically significantly lower than the Welsh average. Information on obesity prevalence at a lower level than local authority is available on the Child Measurement Programme website, where it is mapped at Middle Super Output Area (MSOA) level. The average population per MSOA is 7,000 people of all ages.
Figure 2 – Percentage of children aged 4 to 5 who are obese, health boards and local authorities, 2016/17
Produced by Public Health Wales Observatory using CMP data (NWIS)
12.711.313.313.110.0
Betsi Cadwaladr UHB
95% confidence interval Wales = 12.4
Powys THBHywel Dda UHB
ABM UHBCardiff and Vale UHB
14.4Cwm Taf UHB11.8Aneurin Bevan UHB
14.213.014.412.110.9
Isle of AngleseyGwynedd
ConwyDenbighshire
Flintshire12.8Wrexham10.9Ceredigion13.414.013.511.813.5
PembrokeshireCarmarthenshire
SwanseaNeath Port Talbot
Bridgend7.8Vale of Glamorgan10.7Cardiff13.617.513.615.111.4
Rhondda Cynon TafMerthyr Tydfyl
CaerphillyBlaenau Gwent
Torfaen8.0Monmouthshire10.8Newport

8 The Child Measurement Programme for Wales 2016/17
However when obesity prevalence is aggregated for the last five years – 2012/13 to 2016/17, obesity prevalence is statistically significantly higher than the Welsh average of 11.8% (combined for the same years) in seven local authorities:-
● Gwynedd – 12.9%
● Pembrokeshire – 12.8%
● Carmarthenshire – 12.8%
● Rhondda Cynon Taf – 13.3%
● Merthyr Tydfil – 16.6%
● Caerphilly – 12.8%
● Blaenau Gwent – 13.9%
Deprivation
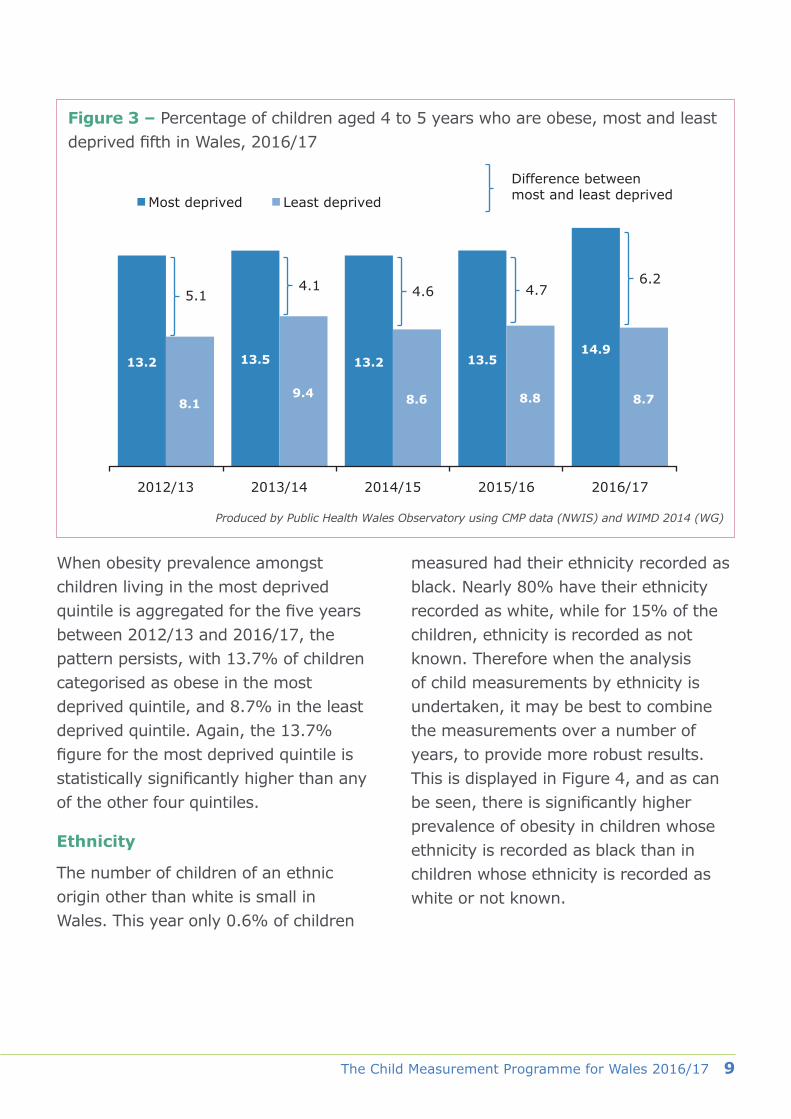
Every year the child measurements are analysed by deprivation. There are 1,909 Lower Super Output Areas (LSOA) in Wales, with a deprivation rank assigned to each LSOA. These scores are then assigned to quintiles (fifths). The children’s postcode of residence are assigned to an LSOA. The gap between obesity prevalence in the most and least deprived quintiles is shown in Figure 3. This year the gap between obesity prevalence in the most and least deprived quintiles has increased from 4.7% last year to 6.2% this year. 14.9% of children living in the most deprived quintile are obese, and this is statistically significantly higher than obesity prevalence in any of the other four quintiles.
However it is important to remember that not all individuals living in an area classified as deprived, are themselves living in deprived circumstances. Deprivation is more concentrated in some areas of Wales such as Merthyr Tydfil, but there are pockets throughout the country. In Monmouthshire there are no LSOA areas ranked within the most deprived quintile.
The Child Measurement Programme for Wales 2016/17 9
Figure 3 – Percentage of children aged 4 to 5 years who are obese, most and least deprived fifth in Wales, 2016/17
Produced by Public Health Wales Observatory using CMP data (NWIS) and WIMD 2014 (WG)
When obesity prevalence amongst children living in the most deprived quintile is aggregated for the five years between 2012/13 and 2016/17, the pattern persists, with 13.7% of children categorised as obese in the most deprived quintile, and 8.7% in the least deprived quintile. Again, the 13.7% figure for the most deprived quintile is statistically significantly higher than any of the other four quintiles.
Ethnicity
The number of children of an ethnic origin other than white is small in Wales. This year only 0.6% of children
measured had their ethnicity recorded as black. Nearly 80% have their ethnicity recorded as white, while for 15% of the children, ethnicity is recorded as not known. Therefore when the analysis of child measurements by ethnicity is undertaken, it may be best to combine the measurements over a number of years, to provide more robust results. This is displayed in Figure 4, and as can be seen, there is significantly higher prevalence of obesity in children whose ethnicity is recorded as black than in children whose ethnicity is recorded as white or not known.
13.2
8.1
2012/13 2013/14 2014/15 2015/16 2016/17
5.1
13.5
9.4
4.1
13.2
8.6
4.6
13.5
8.8
4.7
Difference between most and least deprivedMost deprived
14.9
8.7
6.2
Least deprived

10 The Child Measurement Programme for Wales 2016/17
Figure 4 – Percentage of children aged 4 to 5 years who are obese by ethnic group 2012/13 - 2016/17
Produced by Public Health Wales Observatory using CMP data (NWIS)
Urban / rural analysis
Three years ago, child measurements were analysed according to whether children were living in urban, rural or very rural areas of the country. At that time it was observed that there was very little difference between prevalence of the weight categories. The analysis was repeated this year, looking across two
categories, urban and rural. Again very little difference was observed (Figure 5). While prevalence of overweight and obesity combined appears slightly higher in rural areas, prevalence of obesity alone appears slightly higher in urban areas. However the differences in both categories are not statistically significant.
Figure 5 – Percentage of children aged 4 to 5 years who are overweight or obese, rural and urban areas in Wales 2016/17
Produced by Public Health Wales Observatory using CMP data (NWIS)
12.012.415.511.813.1
White
95% confidence interval Wales = 11.8
AsianBlackMixed
Chinese or other10.2Not known
26.926.2
2012/13 - 2016/17 2016/17
0.7
27.426.9
0.5
Difference between Rural and Urban areasRural Urban
The Child Measurement Programme for Wales 2016/17 11
Comparison
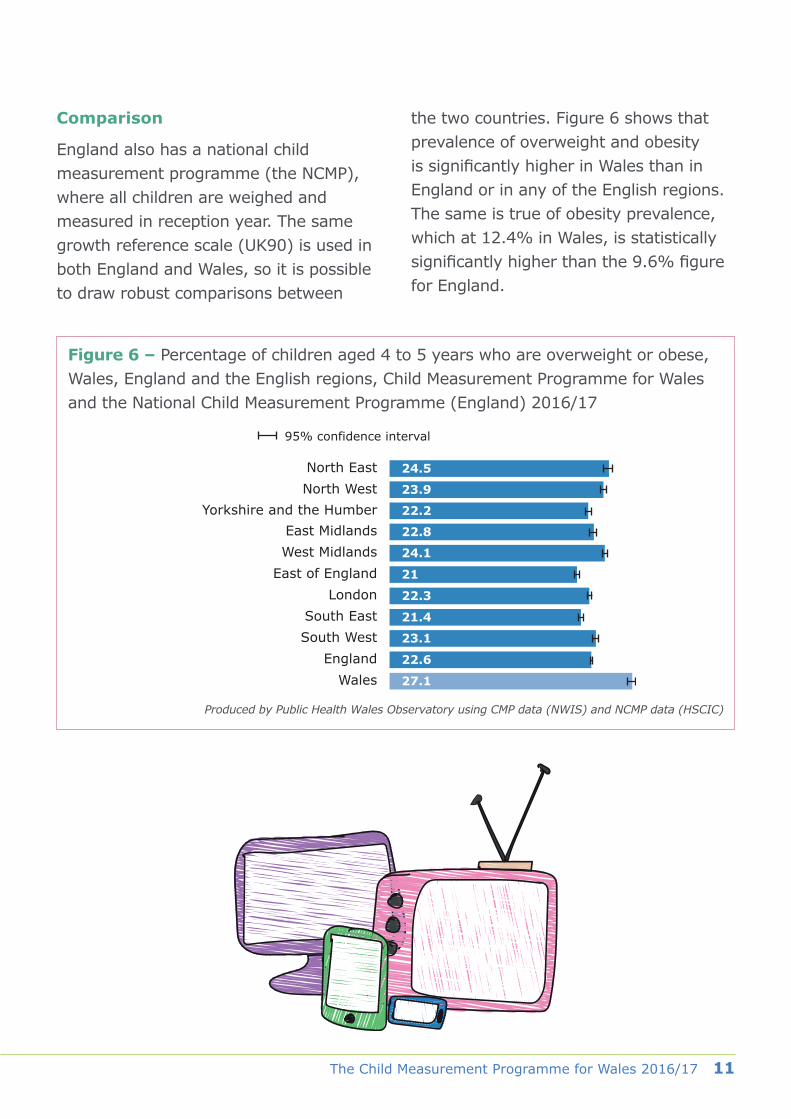
England also has a national child measurement programme (the NCMP), where all children are weighed and measured in reception year. The same growth reference scale (UK90) is used in both England and Wales, so it is possible to draw robust comparisons between
the two countries. Figure 6 shows that prevalence of overweight and obesity is significantly higher in Wales than in England or in any of the English regions. The same is true of obesity prevalence, which at 12.4% in Wales, is statistically significantly higher than the 9.6% figure for England.
Figure 6 – Percentage of children aged 4 to 5 years who are overweight or obese, Wales, England and the English regions, Child Measurement Programme for Wales and the National Child Measurement Programme (England) 2016/17
Produced by Public Health Wales Observatory using CMP data (NWIS) and NCMP data (HSCIC)
24.5
23.9
22.2
22.8
24.1
North East
95% confidence interval
North WestYorkshire and the Humber
East MidlandsWest Midlands
21East of England
22.3London
21.4
23.1
South EastSouth West
22.6England
27.1Wales

12 The Child Measurement Programme for Wales 2016/17
Participation94.1% of children in Wales who were eligible to participate in the programme were measured and their measurements included in the analysis. This is a slight increase on participation last year. 94.6% of girls and 93.7% of boys participated. There is very little variation in participation rates by deprivation quintile.
The Health Board with the highest participation rate was Betsi Cadwaladr University Health Board (UHB) with a participation rate of 96.6%, while the health board with the lowest participation was Powys Teaching Health Board (THB) with a participation rate of 89.2%. Because of the rurality of Powys and distances involved, school health staff may not be able to visit a school a second time to carry out ‘catch-up’ measurements. By local authority, Wrexham had the highest participation rate at 98.6%, and Merthyr Tydfil had the lowest at 84.0%
Each year a census is taken of all the schools in Wales. In 2016/17, 35,592 children were recorded as attending reception class. There is a small difference (295) between the census figures and the CMP eligibility figures, which might be explained by inclusion of children resident in England but attending schools in Wales in the census; movements in and out of schools; or the timing of the census which is taken on one day in January, while the child measurements are carried out throughout the school year. However when the number included in the measurement programme is compared to the number of children counted in the school census, it appears that coverage of the CMP is very good. 129 children were opted out of the programme by their parents
Table 1 – Participation in the Child Measurement Programme for Wales since 2012/13
Elligible Measured % Participation
2012/13 34,679 29,238 84.3%
2013/14 33,794 30,669 90.8%
2014/15 34,815 32,889 94.5%
2015/16 35,721 33,327 93.3%
2016/17 35,297 33,226 94.1%
Produced by Public Health Wales Observatory using CMP data (NWIS)
The Child Measurement Programme for Wales 2016/17 13
More informationThis report provides a brief summary of the analysis of the child measurements taken for the Child Measurement Programme. More comprehensive information displayed as charts, tables and maps, can be found on our website at www.publichealthwales.org/childmeasurement
For more information about tackling childhood obesity please go to the Public Health Wales Health Improvement website at: www.everychildwales.co.uk and follow the link to the “10 steps to a healthy weight” information.
Abbreviations
BME Black and minority ethnic
BMI Body mass index
CMP Child Measurement Programme for Wales
LSOA Lower super output area
MSOA Middle Super output area
NCCHD National Community Child Health Database
NCMP National Child Measurement Programme (England)
NHS National Health Service
NWIS NHS Wales Informatics Service
THB Teaching Health Board
UHB University Health Board
UK90 Growth reference system used in the CMP
WHO World Health Organisation
WIMD Welsh index of multiple deprivation

The Child Measurement Programme for Wales 2016/17
www.publichealthwales.org/childmeasurement