Embed Size (px)
Citation preview

United States Office of Ground Water EPA/816-R-99-014jEnvironmental and Drinking Water (4601) September 1999Protection Agency
The Class V Underground InjectionControl Study
Volume 10
Mining, Sand, or Other Backfill Wells
September 30, 1999
Table of ContentsPage
1. Summary . . . . . . . . . . . . . . . . . . . . . . . . . . . . . . . . . . . . . . . . . . . . . . . . . . . . . . . . . . . . . . . 1
2. Introduction . . . . . . . . . . . . . . . . . . . . . . . . . . . . . . . . . . . . . . . . . . . . . . . . . . . . . . . . . . . . . 2
3. Prevalence of Wells . . . . . . . . . . . . . . . . . . . . . . . . . . . . . . . . . . . . . . . . . . . . . . . . . . . . . . . 3
4. Backfill Characteristics And Injection Practices . . . . . . . . . . . . . . . . . . . . . . . . . . . . . . . . . . . 34.1 Injectate Characteristics . . . . . . . . . . . . . . . . . . . . . . . . . . . . . . . . . . . . . . . . . . . . . . 3
4.1.1 Mill Tailings . . . . . . . . . . . . . . . . . . . . . . . . . . . . . . . . . . . . . . . . . . . . . . . . . 64.1.2 Coal Combustion Ash . . . . . . . . . . . . . . . . . . . . . . . . . . . . . . . . . . . . . . . . 104.1.3 Flue Gas Desulfurization Sludge . . . . . . . . . . . . . . . . . . . . . . . . . . . . . . . . . 194.1.4 Coal Cleaning Waste . . . . . . . . . . . . . . . . . . . . . . . . . . . . . . . . . . . . . . . . . 194.1.5 Mine Drainage Precipitate Waste . . . . . . . . . . . . . . . . . . . . . . . . . . . . . . . . 24
4.2 Well Characteristics . . . . . . . . . . . . . . . . . . . . . . . . . . . . . . . . . . . . . . . . . . . . . . . . 244.3 Operational Practices . . . . . . . . . . . . . . . . . . . . . . . . . . . . . . . . . . . . . . . . . . . . . . . 26
4.3.1 Placement Methods . . . . . . . . . . . . . . . . . . . . . . . . . . . . . . . . . . . . . . . . . . 264.3.2 Integrated Mining and Backfilling . . . . . . . . . . . . . . . . . . . . . . . . . . . . . . . . 314.3.3 Retroactive Backfilling . . . . . . . . . . . . . . . . . . . . . . . . . . . . . . . . . . . . . . . . 334.3.4 Well Maintenance and Closure . . . . . . . . . . . . . . . . . . . . . . . . . . . . . . . . . . 33
5. Potential And Documented Damage to USDWs . . . . . . . . . . . . . . . . . . . . . . . . . . . . . . . . . 335.1 Injectate Constituent Properties . . . . . . . . . . . . . . . . . . . . . . . . . . . . . . . . . . . . . . . 335.2 Observed Impacts . . . . . . . . . . . . . . . . . . . . . . . . . . . . . . . . . . . . . . . . . . . . . . . . . 35
5.2.1 Metal Mines . . . . . . . . . . . . . . . . . . . . . . . . . . . . . . . . . . . . . . . . . . . . . . . . 355.2.2 Coal Mines . . . . . . . . . . . . . . . . . . . . . . . . . . . . . . . . . . . . . . . . . . . . . . . . 37
6. Alternative And Best Management Practices . . . . . . . . . . . . . . . . . . . . . . . . . . . . . . . . . . . . 416.1 Injectate Characteristics . . . . . . . . . . . . . . . . . . . . . . . . . . . . . . . . . . . . . . . . . . . . . 416.2 System Design and Construction . . . . . . . . . . . . . . . . . . . . . . . . . . . . . . . . . . . . . . . 416.3 Well Operation . . . . . . . . . . . . . . . . . . . . . . . . . . . . . . . . . . . . . . . . . . . . . . . . . . . . 426.4 Well Closure . . . . . . . . . . . . . . . . . . . . . . . . . . . . . . . . . . . . . . . . . . . . . . . . . . . . . 43
7. Current Regulatory Requirements . . . . . . . . . . . . . . . . . . . . . . . . . . . . . . . . . . . . . . . . . . . . 457.1 Federal Programs . . . . . . . . . . . . . . . . . . . . . . . . . . . . . . . . . . . . . . . . . . . . . . . . . . 45
7.1.1 SDWA . . . . . . . . . . . . . . . . . . . . . . . . . . . . . . . . . . . . . . . . . . . . . . . . . . . . 457.1.2 SMCRA . . . . . . . . . . . . . . . . . . . . . . . . . . . . . . . . . . . . . . . . . . . . . . . . . . 46
7.2 State and Local Programs . . . . . . . . . . . . . . . . . . . . . . . . . . . . . . . . . . . . . . . . . . . 48
Attachment A: State and Local Program Descriptions . . . . . . . . . . . . . . . . . . . . . . . . . . . . . . . . . . 50
References . . . . . . . . . . . . . . . . . . . . . . . . . . . . . . . . . . . . . . . . . . . . . . . . . . . . . . . . . . . . . . . . . . . 68

September 30, 1999 1
MINING, SAND, OR OTHER BACKFILL WELLS
The U.S. Environmental Protection Agency (USEPA) conducted a study of Class Vunderground injection wells to develop background information the Agency can use to evaluate the riskthat these wells pose to underground sources of drinking water (USDWs) and to determine whetheradditional federal regulation is warranted. The final report for this study, which is called the Class VUnderground Injection Control (UIC) Study, consists of 23 volumes and five supporting appendices. Volume 1 provides an overview of the study methods, the USEPA UIC Program, and general findings. Volumes 2 through 23 present information summaries for each of the 23 categories of wells that werestudied (Volume 21 covers 2 well categories). This volume, which is Volume 10, covers Class Vmining, sand, or other backfill wells.
1. SUMMARY
Mine backfill wells are used in many mining regions throughout the country to inject a mixture ofwater and sand, mill tailings, or other materials (e.g., coal combustion ash, coal cleaning wastes, acidmine drainage (AMD) treatment sludge, flue gas desulfurization sludge) into mined out portions ofunderground mines. On occasion, injection (in low porosity grout form) also occurs into the rubbledisposal areas at surface mining sites. Mine shafts and pipelines in an underground mine, as well asmore “conventional” drilled wells, used to place slurries and solids in underground mines are consideredmine backfill. Such wells may be used to provide subsidence control (the most common purpose),enhanced ventilation control, fire control, reduced surface disposal of mine waste, enhanced recoveryof minerals, mitigation of AMD, and improved safety.
The physical characteristics and chemical composition of the materials that are injected intobackfill wells vary widely depending on the source of the backfill material, the method of injection, andany additives (e.g., cement) that may be included. Data from leaching tests (e.g., USEPA Method1311 Toxicity Characteristic Leaching Procedure (TCLP)) of backfill materials indicate thatconcentrations of antimony, arsenic, barium, beryllium, boron, cadmium, chromium, lead, mercury,molybdenum, nickel, selenium, thallium, sulfate, and zinc frequently exceed primary maximumcontaminant levels (MCLs) or health advisory levels (HALs). Concentrations of aluminum, copper,iron, manganese, total dissolved solids (TDS), and sulfate, as well as the pH, frequently exceedsecondary MCLs.
At sites where water is present in the injection zone (the previously mined ore body), the minewater may already exceed MCLs or HALs prior to injection either as a result of mining activity ornatural conditions. At such sites, one objective of injection often is to improve the already poor qualityof the mine water by reducing the availability of oxygen in the mine workings and/or neutralizing AMD. In other areas, water from coal beds may be used to supply domestic wells.
No incidents of contamination of a USDW have been identified that are directly attributable toinjection into mine backfill wells. Although ground water contamination is not uncommon at mining
September 30, 1999 2
sites, it is generally difficult to identify the specific causes. The chance that backfill injection willcontribute to ground water contamination is highly dependent onsite conditions, including minemineralogy, site hydrogeology, backfill characteristics, and injection practices. Some studies of theeffects of backfill injection on mine water quality show that concentrations of some cations and anionscan increase in mine water following injection, whereas concentrations of trace metals generally arerelatively unaffected or decline over time. Other studies (at other sites) show an increase in selectedmetal concentrations.
The vulnerability of mine backfill wells to receiving spills or illicit discharges also depends onsite-specific conditions and practices. For example, if coal ash is hauled to a mine site, slurried withwater, and then injected, the likelihood of contamination of the injected material resulting from a spill orillicit discharge is relatively low. On the other hand, if mill tailings are collected in a tailings pond alongwith site runoff and other facility wastes prior to injection, then the likelihood of contamination of thebackfill material by spills would be higher.
According to the state and USEPA Regional survey conducted for this study, there areapproximately 5,000 documented mine backfill wells and more than 7,800 wells estimated to exist inthe United States A total of 17 states report having mine backfill wells. More than 90 percent of thedocumented wells reported are in four states: Ohio (3,570), Idaho (575); West Virginia (401), andNorth Dakota (200). In truth, there may be more due to the broad scope of this well type and the factthat some state inventories may count these wells as subsidence control wells while others did not. Also, the number of active wells at any given time varies widely due to their generally short life span,most often a few days or less. The number of mine backfill wells has the potential to grow in the futuredue to the growing movement to decrease surface disposal and control ground subsidence.
State regulations pertaining to mine backfill wells vary significantly in their scope and stringency. Some states impose few restrictions while others require permitting, or impose requirements by contractrather than regulation. Some of these approaches include permit by rule (e.g., West Virginia, Idaho,North Dakota), general or area permits (e.g., Wyoming), and individual permits (e.g., Ohio). Inaddition, federal requirements for planning and approval of mining activities include mine backfillactivities. These requirements apply in states that have not obtained primacy under the Surface MiningControl and Reclamation Act and to activities on federal and Native American tribal lands.
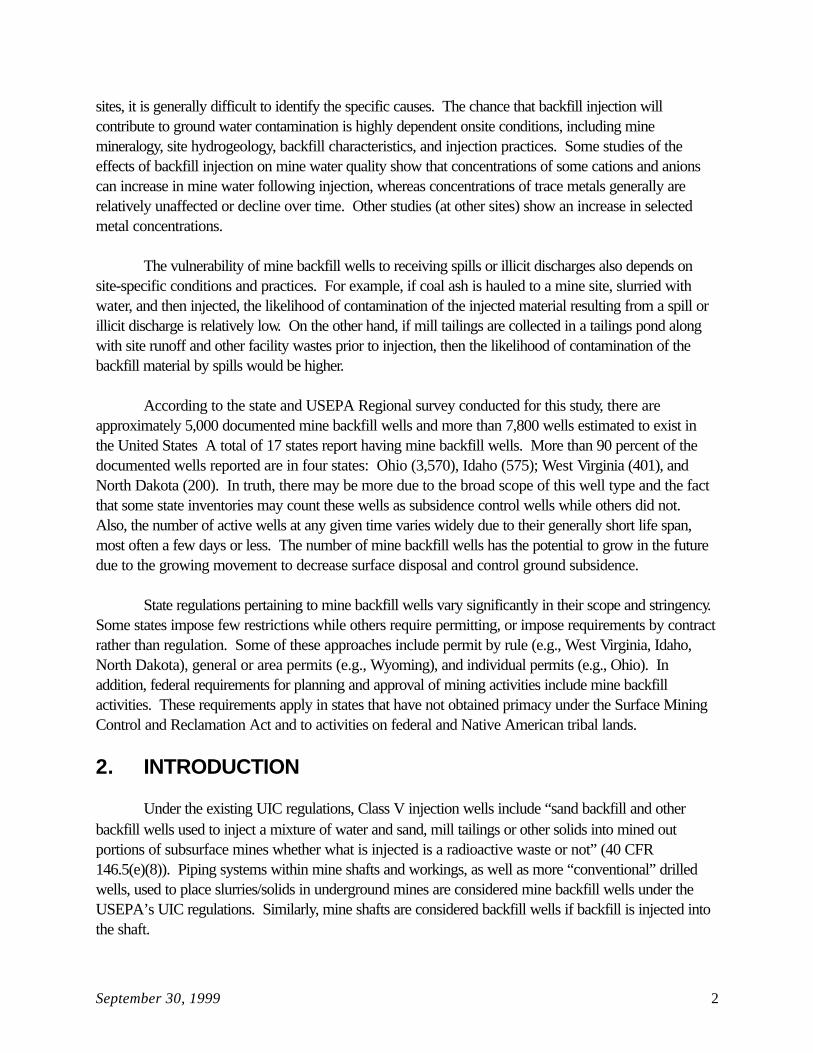
2. INTRODUCTION
Under the existing UIC regulations, Class V injection wells include “sand backfill and otherbackfill wells used to inject a mixture of water and sand, mill tailings or other solids into mined outportions of subsurface mines whether what is injected is a radioactive waste or not” (40 CFR146.5(e)(8)). Piping systems within mine shafts and workings, as well as more “conventional” drilledwells, used to place slurries/solids in underground mines are considered mine backfill wells under theUSEPA’s UIC regulations. Similarly, mine shafts are considered backfill wells if backfill is injected intothe shaft.
September 30, 1999 3
Backfill injection is extremely diverse. Although subsidence control is a common objective ofbackfilling, injection can be performed for a wide range of reasons, as noted above. The types ofmaterials that are injected are similarly diverse, and include materials (and various mixtures of materials)resulting from coal mining and combustion, primary and precious metal mining, uranium mining, andnon-metal mining. The environmental settings in which the mines are located and injection occurs aresimilarly diverse. This volume only provides an overview and a general categorization of minebackfilling activities.
3. PREVALENCE OF WELLS
For this study, data on the number of Class V mining, sand, or other backfill wells werecollected through a survey of state and USEPA Regional UIC Programs. The survey methods aresummarized in Section 4 of Volume 1 of the Class V Study. Table 1 lists the numbers of Class Vmining, sand, or other backfill wells in each state, as determined from this survey. The table includesthe documented number and estimated number of wells in each state, along with the source and basisfor any estimate, when noted by the survey respondents. If a state is not listed in Table 1, it means thatthe UIC Program responsible for that state indicated in its survey response that it did not have anyClass V mining, sand, or other backfill wells.
In 1998, a total of approximately 5,000 mine backfill wells were reported nationwide, all ofwhich are reported to be in 17 states. As indicated in Table 1, several states estimated that the actualnumber of mine backfill wells is greater than the number reflected in their documented inventory. Inaddition, some states did not provide inventory information, although it is likely that wells exist in someof these states. Thus, the actual number of operating mine backfill wells in 1998 is estimated to be atleast 7,800. The fact that they often exist for a relatively short operating time (in some cases, a fewdays or less) complicates development of a precise count of mine backfill wells in use during a givenyear, as exemplified by the information provided by Pennsylvania, Texas, Illinois, and West Virginia andsummarized in Table 1.
4. BACKFILL CHARACTERISTICS AND INJECTIONPRACTICES
4.1 Injectate Characteristics
A wide assortment of materials are used for backfilling of underground mines. These materialsmay include waste rock, mining and ore beneficiation wastes (e.g., mill tailings, coal cleaning wastes),coal combustion ash and flue gas desulfurization (FGD) sludge resulting from coal combustion, orsludge from AMD treatment operations. Mill tailings have been reported to be the most commonlyused mine backfill materials, because they are inexpensive and abundant (Underground InjectionCouncil Research Foundation, 1988).

September 30, 1999 4
Table 1. Inventory of Mine Backfill Wells in the U.S.*
StateDocumented
Number of Wells
Estimated Number of Wells
Number Source of Estimate and Methodology1
USEPA Region 1 -- None
USEPA Region 2 -- None
USEPA Region 3
MD 6 6 N/A
PA NR NR Injection for subsidence control is common, but no wells werereported to be active at the time of the survey. A total of 1,123wells are planned as part of four projects awaiting approval. PA only includes wells used for subsidence control in the“backfill injection” category.
VA NR NR USEPA Region reports that backfill wells exist in VA, but thenumber of wells is not documented by the Region and was notavailable from the state.
WV 401 <401 Best professional judgement. Most backfill wells are used forfire control and are closed when the fire is extinguished, so statestaff believe that most of these wells have been closed. Backfillwells used for subsidence control (73) are also included in theinventory.
USEPA Region 4
AL 22 22 N/A
KY NR NR State staff report that backfill wells exist in KY, but none aredocumented.
TN 2 2 N/A
USEPA Region 5
IL 19 17 2 of the 19 wells may not have commenced operations. UICinventory shows 34 wells, but state personnel believe manyhave been closed and abandoned.
IN 98 (UIC)83 (Region)
2 (DNR)
NR Combination of state and regional information: state does notroutinely distinguish mine backfill wells from some othercategories of Class V wells. The 1997 UIC inventory is acompilation from the region and an 1988 EEI study. DNRbelieves that at least 2 wells are not included in the region’sinventory.
OH 3,570 6,400Best professional judgement, based on knowledge of areascontaining mines and installation frequency of backfilling wells.
USEPA Region 6
TX 61 61 Although 61 wells are in the UIC inventory, all of these wellsmay be closed.

Table 1. Inventory of Mine Backfill Wells in the U.S. (continued)
StateDocumented
Number of Wells
Estimated Number of Wells
Number Source of Estimate and Methodology1
September 30, 1999 5
USEPA Region 7
KS 48 48 N/A
MO 15 15 N/A
USEPA Region 8
CO 2 NR N/A
MT NR NRUSEPA Region 8 Montana Operations Office staff believe thatbackfill wells may exist in MT. However, neither the USEPARegion nor the state has inventory data on such wells.
ND 200 200 N/A
SD 1 1 N/A
UT0 2 State database shows that 2 wells are under construction, but
have never been completed due to economic factors.
WY 20 >20 Best professional judgement. The documented 20 wells do notinclude subsidence prevention wells. No information wasavailable for subsidence prevention wells.
USEPA Region 9
CA 17 17 State personnel did not provide estimate but indicated that theysuspect that more than the documented number of wells exist.
USEPA Region 10
AK 1 >1 N/A
ID 575 575 N/A
All USEPA Regions
All States5,060 >7,890 Total estimated number counts the documented number when
the estimate is NR.
1 Unless otherwise noted, the best professional judgement is that of the state or USEPA Regional staff completing the surveyquestionnaire.
N/A Not available.
NR Although regional, state and/or territorial personnel reported the presence of the well type, the number of wells was notreported, or the questionnaire was not returned.
* Backfill wells regulated by states primarily under other UIC categories are not included. For example, Kansas applies Class IIIrequirements (in addition to Class V requirements) to wells used to backfill solution-mined salt caverns.
1 The particle size of mill tailings depends primarily on the beneficiation and processing techniquesemployed.
2 These terms may also be used to refer to materials other than mill tailings, such as materials used inbackfilling of underground coal mines.
3 Material that reacts at ambient temperature with moisture to form a slow-hardening cement.
September 30, 1999 6
Backfill materials may also contain cementing agents and other additives, such as cement. These agents normally are added to increase the suitability of the material for providing structuralsupport. The use of a particular backfill material depends on its availability, cost, and properties afterplacement (Karfakis, 1996). Backfill material needs to be physically, hydrologically, chemically, andmineralogically stable, especially when subsidence control is one of the objectives of backfilling. Toprovide long-term stability, fill material must resist infiltration and conductance of ground water, becausewater migration can weaken backfills by promoting chemical reactions. Further, low permeabilityreduces the potential for contaminants to leach into ground water (Jude, 1995).
The characteristics of the backfill materials most commonly injected into underground mines arediscussed below. The information presented is not an exhaustive compilation given the wide range ofmaterials and practices. Examples of site-specific operations are provided in Section 4.3.
4.1.1 Mill Tailings
Mill tailings typically consist of a finely ground mixture of processed ore, disaggregated hostrock, and traces of the solutions used (if any) in ore beneficiation operations.1 In some backfillapplications, mill tailings (with or without size classification) are slurried with water and injected intounderground mines in what is often referred to as a “hydraulic sandfill” or “sand backfill” operation (seeSection 4.3) (Levens, 1993; Sutter Gold Mining Company, 1998; Scheetz Mining Company, 1999).2 In other applications, mill tailings are mixed with cement or other pozzolanic material3 to form apumpable material with relative low (10 to 25 percent) moisture content this is often referred to aspaste backfill. When mixed with cement or a similar additive, the resulting backfill may also be referredto as cemented sandfill. The fine solid particles may consist of naturally occurring metamorphic andigneous clay-sized to sand-sized material and metamorphic rock fragments (Brackebusch, 1994).
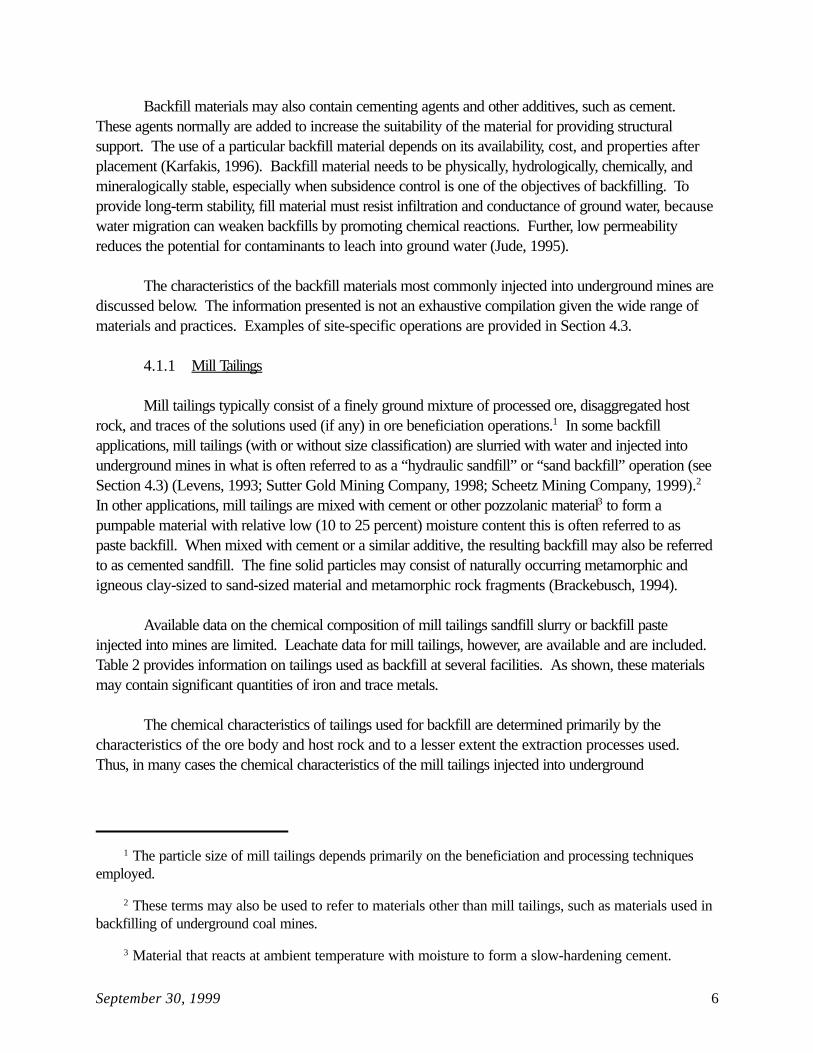
Available data on the chemical composition of mill tailings sandfill slurry or backfill pasteinjected into mines are limited. Leachate data for mill tailings, however, are available and are included. Table 2 provides information on tailings used as backfill at several facilities. As shown, these materialsmay contain significant quantities of iron and trace metals.
The chemical characteristics of tailings used for backfill are determined primarily by thecharacteristics of the ore body and host rock and to a lesser extent the extraction processes used. Thus, in many cases the chemical characteristics of the mill tailings injected into underground
September 30, 1999 7
Table 2. Chemical Characteristics of Selected Metal Mine Tailings Backfill
Constituent
Pb-Zn Mine Tailings (ppm)* Zn Mine (ppm)**
(1) (2) (3) (4) (5)
Aluminum 19,000 15,000 14,000
Arsenic <300 500 1,500
Barium 200 80 44
Cadmium 16 8 13 6.00 <0.006
Calcium 2,300 3,300 3,700
Chromium 90 80 100
Cobalt 10 20 30
Copper 210 250 620 33.0 <0.05
Iron 53,000 57,000 54,000
Lead 1,800 1,500 1,500 9.96 <0.04
Manganese 5,600 5,000 1,600
Magnesium 1,900 2,400 1,400
Mercury <0.05 <0.0002
Molybdenum <50 <50 <50
Nickel 200 330 240
Potassium 5,500 5,800 5,100
Silicon 334,000 348,000 358,000
Sodium 400 600 500
Zinc 4,300 2,500 5,800 1,100 0.654
(1) Cemented tailings backfill collected from a test stope. (2) Uncemented tailings backfill collected from a stope about 10 years after placement. (3) Uncemented tailings backfill collected from new tailings. (4) Sample of solids from tailings impoundment. (5) Sample of water from tailings impoundment. * Source: Levens, 1996 ** Source: ASARCO, 1998
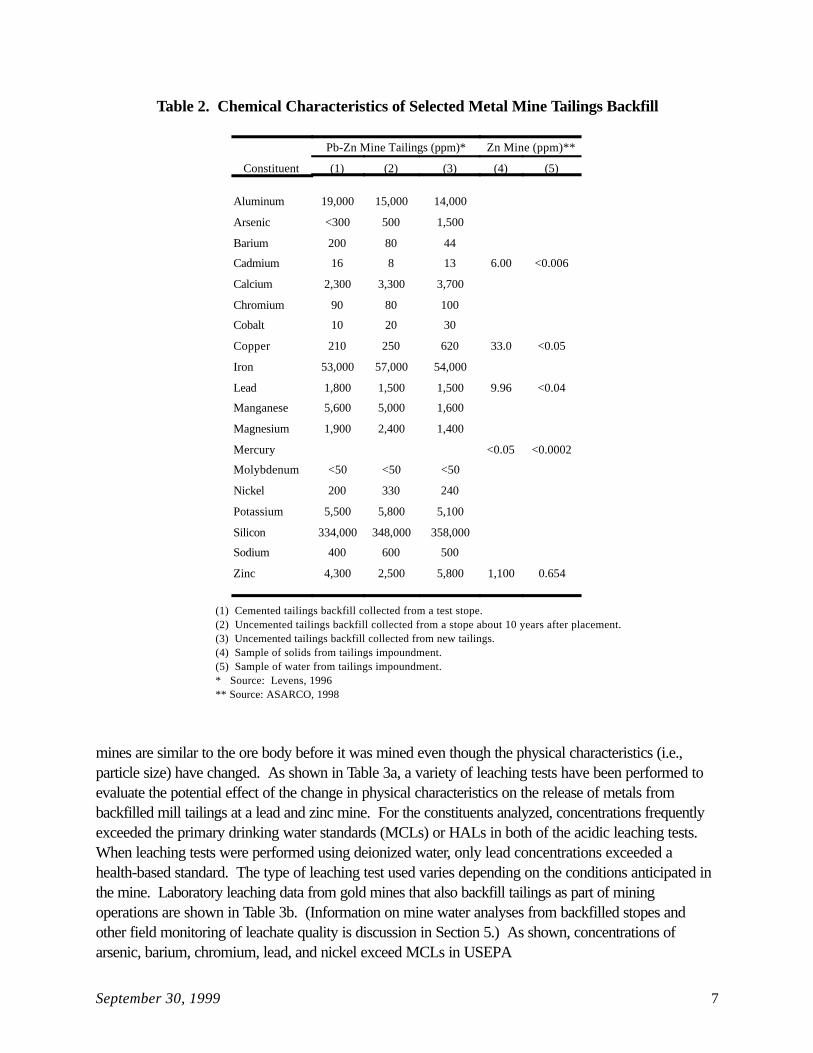
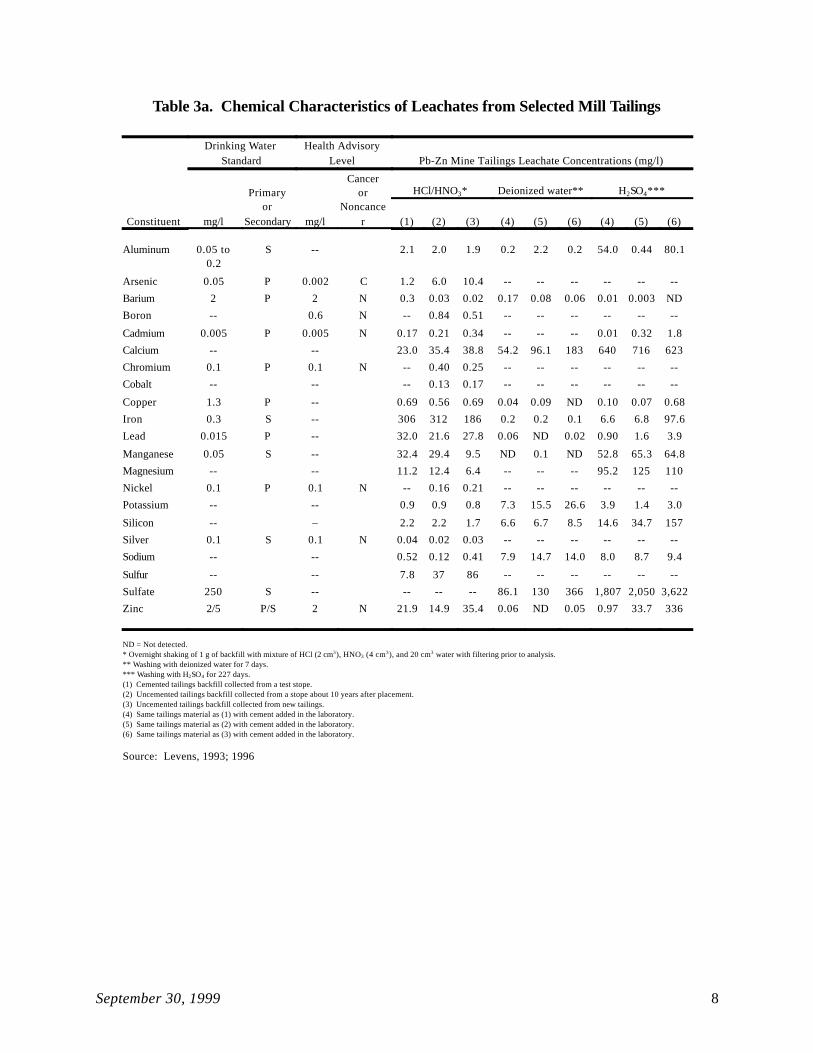
mines are similar to the ore body before it was mined even though the physical characteristics (i.e.,particle size) have changed. As shown in Table 3a, a variety of leaching tests have been performed toevaluate the potential effect of the change in physical characteristics on the release of metals frombackfilled mill tailings at a lead and zinc mine. For the constituents analyzed, concentrations frequentlyexceeded the primary drinking water standards (MCLs) or HALs in both of the acidic leaching tests. When leaching tests were performed using deionized water, only lead concentrations exceeded ahealth-based standard. The type of leaching test used varies depending on the conditions anticipated inthe mine. Laboratory leaching data from gold mines that also backfill tailings as part of miningoperations are shown in Table 3b. (Information on mine water analyses from backfilled stopes andother field monitoring of leachate quality is discussion in Section 5.) As shown, concentrations ofarsenic, barium, chromium, lead, and nickel exceed MCLs in USEPA
September 30, 1999 8
Table 3a. Chemical Characteristics of Leachates from Selected Mill Tailings
Constituent
Drinking WaterStandard
Health AdvisoryLevel Pb-Zn Mine Tailings Leachate Concentrations (mg/l)
mg/l
Primaryor
Secondary mg/l
Canceror
Noncancer
HCl/HNO3* Deionized water** H2SO4***
(1) (2) (3) (4) (5) (6) (4) (5) (6)
Aluminum 0.05 to0.2
S -- 2.1 2.0 1.9 0.2 2.2 0.2 54.0 0.44 80.1
Arsenic 0.05 P 0.002 C 1.2 6.0 10.4 -- -- -- -- -- --
Barium 2 P 2 N 0.3 0.03 0.02 0.17 0.08 0.06 0.01 0.003 ND
Boron -- 0.6 N -- 0.84 0.51 -- -- -- -- -- --
Cadmium 0.005 P 0.005 N 0.17 0.21 0.34 -- -- -- 0.01 0.32 1.8
Calcium -- -- 23.0 35.4 38.8 54.2 96.1 183 640 716 623
Chromium 0.1 P 0.1 N -- 0.40 0.25 -- -- -- -- -- --
Cobalt -- -- -- 0.13 0.17 -- -- -- -- -- --
Copper 1.3 P -- 0.69 0.56 0.69 0.04 0.09 ND 0.10 0.07 0.68
Iron 0.3 S -- 306 312 186 0.2 0.2 0.1 6.6 6.8 97.6
Lead 0.015 P -- 32.0 21.6 27.8 0.06 ND 0.02 0.90 1.6 3.9
Manganese 0.05 S -- 32.4 29.4 9.5 ND 0.1 ND 52.8 65.3 64.8
Magnesium -- -- 11.2 12.4 6.4 -- -- -- 95.2 125 110
Nickel 0.1 P 0.1 N -- 0.16 0.21 -- -- -- -- -- --
Potassium -- -- 0.9 0.9 0.8 7.3 15.5 26.6 3.9 1.4 3.0
Silicon -- – 2.2 2.2 1.7 6.6 6.7 8.5 14.6 34.7 157
Silver 0.1 S 0.1 N 0.04 0.02 0.03 -- -- -- -- -- --
Sodium -- -- 0.52 0.12 0.41 7.9 14.7 14.0 8.0 8.7 9.4
Sulfur -- -- 7.8 37 86 -- -- -- -- -- --
Sulfate 250 S -- -- -- -- 86.1 130 366 1,807 2,050 3,622
Zinc 2/5 P/S 2 N 21.9 14.9 35.4 0.06 ND 0.05 0.97 33.7 336
ND = Not detected.* Overnight shaking of 1 g of backfill with mixture of HCl (2 cm3), HNO3 (4 cm3), and 20 cm3 water with filtering prior to analysis.** Washing with deionized water for 7 days.*** Washing with H2SO4 for 227 days.(1) Cemented tailings backfill collected from a test stope.(2) Uncemented tailings backfill collected from a stope about 10 years after placement.(3) Uncemented tailings backfill collected from new tailings.(4) Same tailings material as (1) with cement added in the laboratory.(5) Same tailings material as (2) with cement added in the laboratory.(6) Same tailings material as (3) with cement added in the laboratory.
Source: Levens, 1993; 1996
September 30, 1999 9
Table 3b. Chemical Characteristics of Laboratory Leachates from Tailings Backfillin Underground Gold Mines (concentrations in mg/l)
Constituent Units Drinking WaterStandards
Health Advisory Levels (1) (2) (3) (4)
Aluminum mg/l 0.05-0.2 S -- -- -- -- --Antimony mg/l 0.006 P 0.003 N -- -- -- <0.00976Arsenic mg/l 0.05 P 0.002 C 0.030 0.025 0.06 0.0244Barium mg/l 2 P 2 N 0.623 1.15 8.2 0.0415Beryllium mg/l 0.004 P 0.0008 C -- -- -- <0.0021Cadmium mg/l 0.005 P 0.005 N <0.001 0.0012 0.0011 <0.00275Chromium mg/l 0.1 P 0.1 N 0.004 0.30 0.25 <0.0033Cobalt mg/l – – -- -- -- <0.0025Copper mg/l 1.3 P -- -- -- -- <0.0030Gold mg/l -- -- -- -- --Iron mg/l 0.3 S -- -- -- --Lead mg/l 0.015 P -- 0.001 0.030 0.007 <0.00505Mercury mg/l 0.002 P 0.002 N 0.0009 0.0003 0.0002 <0.00004Molybdenum mg/l – 0.04 N -- -- -- <0.0043Nickel mg/l 0.1 P 0.1 N -- 0.25 0.10 <0.00415Selenium mg/l 0.05 P -- <0.005 0.002 0.002 <0.0108Silver mg/l 0.1 S 0.1 N <0.001 0.0021 0.0022 <0.0030Thallium mg/l 0.002 P 0.0005 N -- -- -- <0.0118Vanadium mg/l -- -- -- -- -- <0.0052Zinc mg/l 5 S 2 N -- 0.030 0.33 <0.00525
(1) TCLP extraction analysis of sand backfill from Homestake Mine(2) EP extraction analysis of backfill tailings from Homestake Mine open cut and fill stope 20 years after backfill(3) EP extraction analysis of backfill tailings from Homestake Mine stope 2 years after backfill(4) Underground fill material from Sutter Gold Mine
Source: Scheetz, 1999; Righettini, 1999
Method 1310 Extraction Procedure (EP) leachate from sand backfill but not in TCLP leachate(USEPA Method 1311).
Backfilling of tailings also occurs in association with non-metal mining activities. For example,backfilling of tailings occurs at a soda ash and caustic production facility in Wyoming. Available dataon chemical characteristics of the injected tailings slurry indicate that pH and presumably the dissolvedsolids content exceed secondary MCLs of 6.5 to 8.5 for pH and 500 mg/l for total dissolved solids, asshown below (Tg Soda Ash, 1997).

September 30, 1999 10
ParameterNo. of
Samples Minimum Maximum Average Mean
pH 207 9.84 12.49 10.51 10.48
% Solids 207 0.00 29.58 14.66 15.16
4.1.2 Coal Combustion Ash
Coal combustion ash and cement (when needed) are mixed (mass ratio on the order of 9:1) andslurried with water to produce a high-volume, low-strength fluid material that is used to fill mined-outsections of underground mines. Gradual hardening of the slurry after injection will occur withoutbleeding (Vlasak, 1993). In addition, this material can be used in related mine applications such asconstruction of packwalls and filling of abandoned entries (Jude, 1995).
Coal combustion ash characteristics depend primarily on the characteristics of the coal burnedand the type of combustion technology utilized. For example, fly ash from conventional pulverized coalcombustion (PCFA) is a powder-like substance typically collected from flue gas exhaust ducts usingelectrostatic precipitators or fabric filter units. PCFA derived from burning subbituminous coal andlignite produced in the Western U.S. typically has a calcium oxide content greater than 10 percent (on aweight basis), making it a self-hardening and pozzolanic material when in the presence of water. PCFAderived from bituminous or anthracite coal produced in the Eastern U.S., on the other hand, generallyhas a much lower calcium oxide content and, thus, requires the addition of either cement or lime andwater to achieve hardening properties (Jude, 1995).
Another type of fly ash results from fluidized bed combustion (FBC). This type of fly ash isderived from crushed coal and limestone burned in a “bed” of ash particles suspended upward byblowing air in the combustion chamber. FBC ash is made up of larger particles composed mainly ofcoal mineral matter, calcium sulfate and unreacted lime that result from the sulfation and calcination ofthe limestone (Jude, 1995).
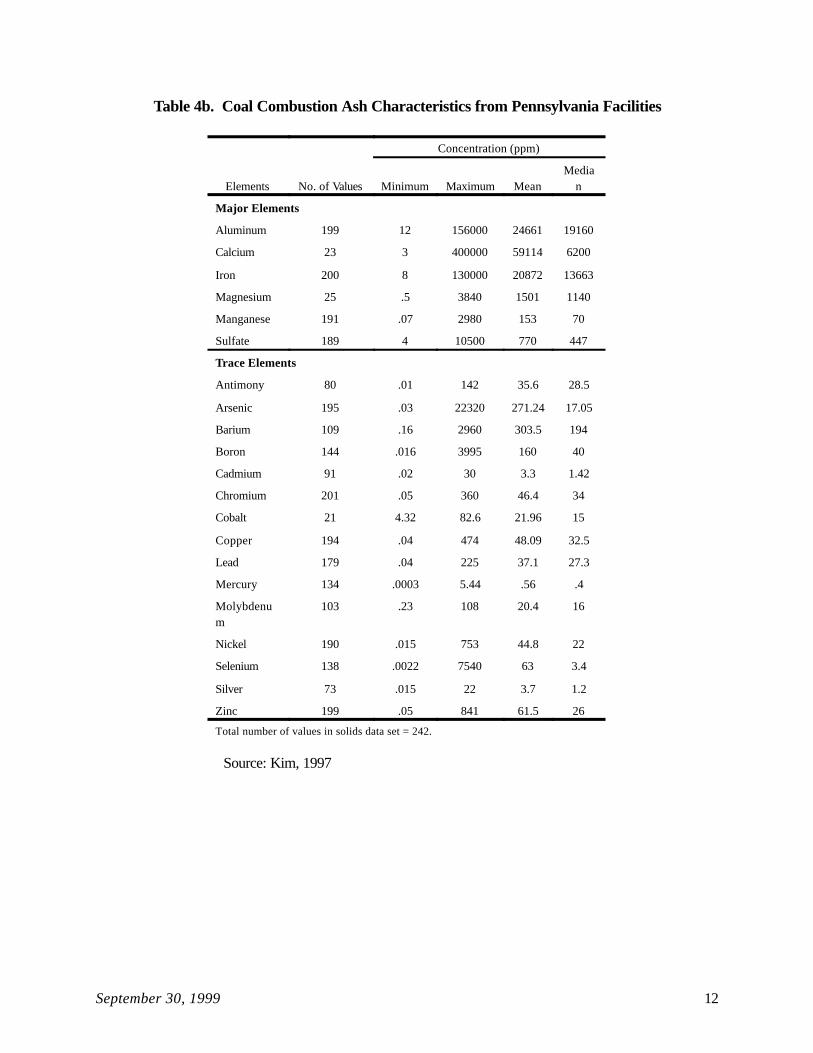
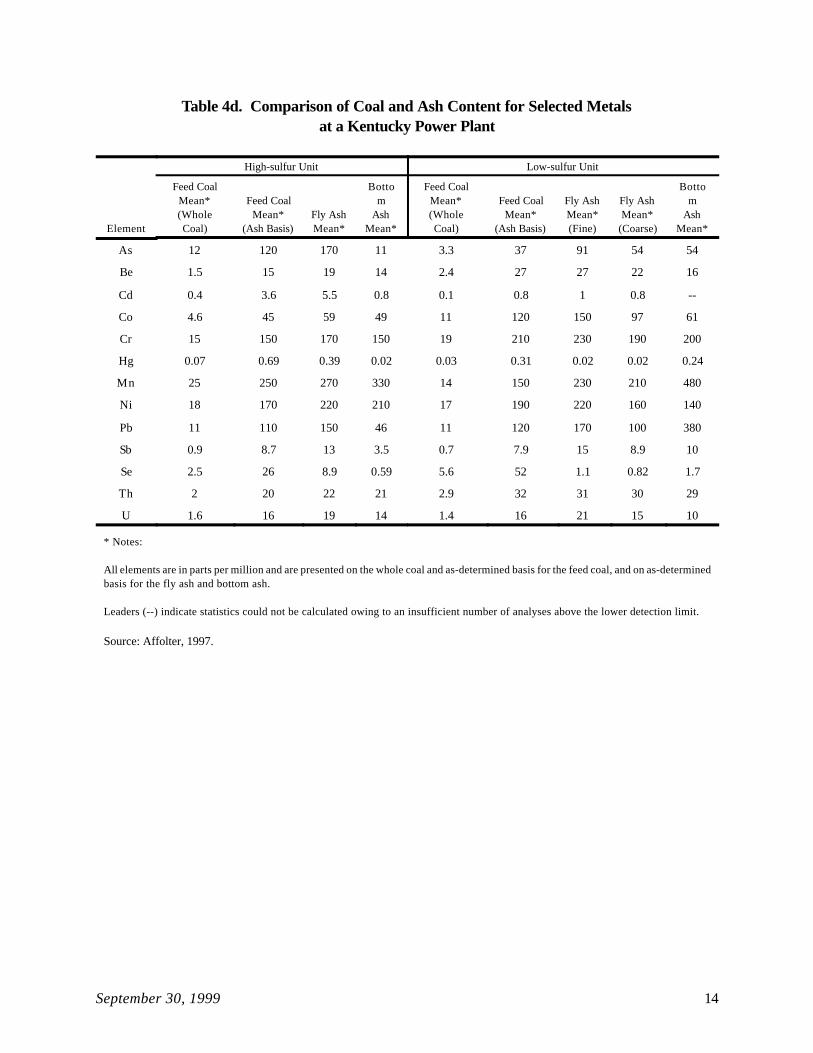
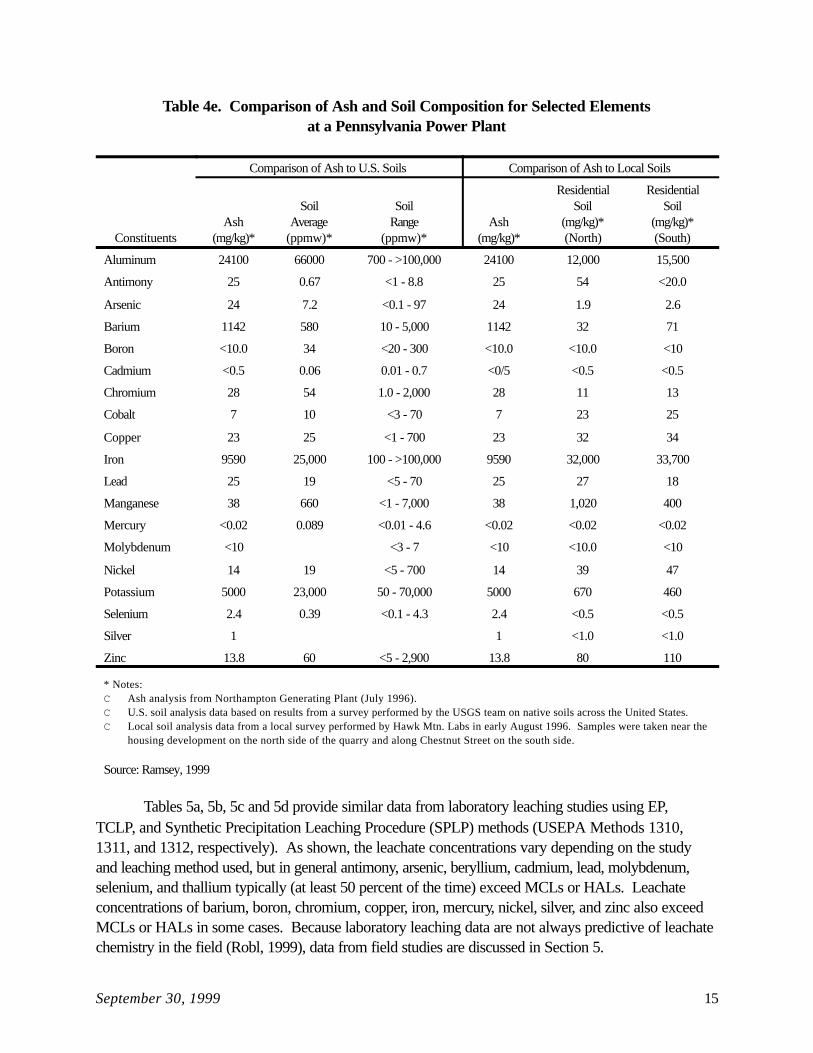
Available data on the chemical composition of coal combustion ash slurries injected into minesare limited. Data on coal ash (prior to slurrying and/or mixing with other materials) and leachate datafor coal ash are available and are included for reference, although the leachate characteristics ofmixtures of ash and cement or other materials may differ. Tables 4a through 4e summarize informationfrom selected studies that provide information on the chemical characteristics of coal combustion ash. As shown, trace metal composition varies over a wide range for each type of material (e.g., bottomash) and among types of materials. Table 4d further illustrates the variability by type of material andtype of coal based on data from a power plant in Kentucky. Table 4e provides a comparison of themetal content of ash from a Pennsylvania facility to soil.

September 30, 1999 11
Table 4a. Coal Combustion Ash Characteristics from Selected Studies
Data Source AnalyteNumber of
Samples
Number ofNon-Detected
Values
Concentration (ppm)
Mean Minimum Maximum Median
Mechanical Arsenic n/a n/a n/a 3.3 160 25.2Hopper Ash (a) Barium n/a n/a n/a 52 1152 872
Boron n/a n/a n/a 205 714 258Cadmium n/a n/a n/a 0.40 14.3 4.27Chromium n/a n/a n/a 83.3 305 172Cobalt n/a n/a n/a 6.22 76.9 48.3Copper n/a n/a n/a 42.0 326 130Fluorine n/a n/a n/a 2.50 83.3 41.8Lead n/a n/a n/a 5.2 101 13.0Manganese n/a n/a n/a 123 430 191Mercury n/a n/a n/a 0.008 3.00 0.073Selenium n/a n/a n/a 0.13 11.8 5.52Silver n/a n/a n/a 0.08 4.0 0.70Strontium n/a n/a n/a 396 2430 931Vanadium n/a n/a n/a 100 377 251Zinc n/a n/a n/a 56.7 215 155
Fine Fly Ash (b) Arsenic n/a n/a n/a 2.3 279 56.7Barium n/a n/a n/a 110 5400 991Boron n/a n/a n/a 10.0 1300 371Cadmium n/a n/a n/a 0.10 18.0 1.60Chromium n/a n/a n/a 3.6 437 136Cobalt n/a n/a n/a 4.90 79.0 35.9Copper n/a n/a n/a 33.0 349 116Fluorine n/a n/a n/a 0.40 320 29.0Lead n/a n/a n/a 3.10 252 66.5Manganese n/a n/a n/a 24.5 750 250Mercury n/a n/a n/a 0.005 2.50 0.10Selenium n/a n/a n/a 0.60 19.0 9.97Silver n/a n/a n/a 0.04 8.0 0.501Strontium n/a n/a n/a 30.0 3855 775Vanadium n/a n/a n/a 11.9 570 248Zinc n/a n/a n/a 14.0 2300 210
1993 Data (c) Antimony 46 35 10.5 0.2 205 4.6Arsenic 81 3 76.4 0.0003 391.0 43.4Barium 74 3 1589 0.02 10850 806.5Beryllium 12 0 201.8 0.200 2105 5.0Boron 27 0 469.5 2.98 2050 311Cadmium 66 41 6.1 0.0100 76.0 3.4Chromium 83 8 129 0.19 651 90Copper 78 1 123 0.20 655 112Lead 76 2 67.0 0.02 273 56.8Mercury 27 7 4.3 0.013 49.5 0.1Nickel 71 0 117.5 0.1 1270 77.6Selenium 81 16 8.7 0.0003 49.5 7.7Silver 62 42 3.7 0.01 49.5 3.2Thallium 11 4 19.2 0.15 85.0 9.0Vanadium 61 5 397 43.5 5015 252Zinc 79 0 286.5 0.28 2200 148
Source: USEPA, 1993b (a) Mechanical hopper fly ash data from Tetra Tech’s 1983 Study and presented in the 1988 RTC.(b) Fine fly ash data from Tetra Tech’s 1983 Study and presented in the 1988 RTC.(c) Statistics calculated assuming that values below the detection are equal to ½ the detection limit.
September 30, 1999 12
Table 4b. Coal Combustion Ash Characteristics from Pennsylvania Facilities
Concentration (ppm)
Elements No. of Values Minimum Maximum MeanMedia
n
Major Elements
Aluminum 199 12 156000 24661 19160
Calcium 23 3 400000 59114 6200
Iron 200 8 130000 20872 13663
Magnesium 25 .5 3840 1501 1140
Manganese 191 .07 2980 153 70
Sulfate 189 4 10500 770 447
Trace Elements
Antimony 80 .01 142 35.6 28.5
Arsenic 195 .03 22320 271.24 17.05
Barium 109 .16 2960 303.5 194
Boron 144 .016 3995 160 40
Cadmium 91 .02 30 3.3 1.42
Chromium 201 .05 360 46.4 34
Cobalt 21 4.32 82.6 21.96 15
Copper 194 .04 474 48.09 32.5
Lead 179 .04 225 37.1 27.3
Mercury 134 .0003 5.44 .56 .4
Molybdenum
103 .23 108 20.4 16
Nickel 190 .015 753 44.8 22
Selenium 138 .0022 7540 63 3.4
Silver 73 .015 22 3.7 1.2
Zinc 199 .05 841 61.5 26
Total number of values in solids data set = 242.
Source: Kim, 1997

September 30, 1999 13
Table 4c. Summary of Fluidized Bed Combustion Ash Composition(concentrations in ppm)
Material Num.of Minimum 25th 50th 75th 90th 95th MaximumType Constituent Values Value Percentile Percentile Percentile Percentile Percentile ValueBed Ash Aluminum 34 9.000 3825.00 10682.00 30446.00 56700.00 68800.00 104300.00 Antimony 58 0.100 2.50 3.50 28.00 62.00 111.40 1775.00 Arsenic 62 0.250 3.50 9.93 34.70 58.00 82.00 119.70 Barium 68 0.050 7.00 62.15 172.00 274.00 316.10 453.00 Beryllium 38 0.500 0.50 1.10 8.00 15.00 17.00 31.00 Boron 52 0.050 1.50 3.15 22.74 41.38 118.00 304.00 Cadmium 61 0.003 0.50 0.50 1.50 3.60 6.75 14.00 Chromium 68 3.700 5.00 16.18 41.85 56.10 74.10 259.80 Cobalt 47 0.125 1.40 3.90 14.00 37.90 51.40 128.40 Copper 65 0.500 1.70 8.90 18.50 26.00 42.70 50.00 Iron 33 6.200 9570.00 13010.00 15640.00 18534.00 21111.10 31500.00 Lead 67 0.050 1.50 2.50 26.00 56.00 66.00 89.90 Manganese 33 34.500 62.00 110.00 379.00 610.00 719.40 892.90 Mercury 54 0.000 0.01 0.10 0.10 0.43 1.10 208.90 Molybdenum 52 0.050 3.90 13.00 19.60 27.00 48.00 190.00 Nickel 63 2.000 22.50 66.70 735.00 1000.00 1270.00 1440.00 Potassium 41 1.300 100.00 150.00 240.00 1340.00 4700.00 11950.00 Selenium 56 0.001 0.52 2.00 3.50 3.50 13.40 45.00 Silver 55 0.005 0.50 0.50 1.00 5.00 7.00 338.00 Thallium 29 0.250 2.50 3.50 5.00 20.00 25.00 50.00 Vanadium 37 12.000 1150.00 3820.00 5700.00 7550.00 8700.00 10000.00 Zinc 65 1.000 20.00 26.00 33.10 52.70 147.50 399.00Fly Ash Aluminum 42 20.000 23495.60 32835.65 53415.00 88900.00 105920.00 176300.00 Antimony 66 0.100 2.86 3.50 36.00 63.55 151.70 1370.00 Arsenic 73 0.100 3.50 17.00 39.22 93.70 115.00 176.00 Barium 73 0.100 17.00 177.00 320.33 540.00 940.00 7700.00 Beryllium 39 0.500 0.50 1.20 6.00 11.00 15.00 16.00 Boron 60 0.050 1.50 6.98 50.00 101.95 606.00 2473.00 Cadmium 72 0.003 0.50 0.60 2.10 4.00 7.00 13.00 Chromium 76 0.500 6.05 29.50 56.45 77.60 104.00 211.10 Cobalt 47 0.125 2.00 5.00 19.00 33.90 75.30 178.50 Copper 71 0.500 2.00 28.10 47.00 73.35 73.35 99.00 Iron 46 22.170 18620.00 26530.00 32722.00 50900.00 55962.00 81318.00 Lead 75 0.500 1.50 17.50 44.80 65.00 73.00 129.50 Manganese 42 0.100 86.00 126.40 196.70 470.00 661.60 57700.00 Mercury 73 0.000 0.10 0.31 0.95 1.68 7.35 384.20 Molybdenum 67 0.050 3.10 9.00 21.10 28.50 48.64 143.60 Nickel 75 12.500 32.80 51.20 529.00 825.00 900.00 1270.00 Potassium 44 1.125 150.00 214.50 3132.00 8332.49 11478.80 14680.00 Selenium 69 0.001 2.05 3.50 5.40 23.00 39.00 166.00 Silver 64 0.005 0.50 0.50 2.00 3.40 5.00 38.50 Thallium 34 0.500 2.50 3.50 5.00 20.00 25.00 39.01 Vanadium 39 36.333 160.00 2880.00 3840.00 4830.00 5430.00 10000.00 Zinc 73 1.000 28.00 36.00 54.50 79.77 114.40 167.90Combined Ash Aluminum 48 1.090 14617.50 24585.00 32950.00 44300.00 64000.00 75850.00 Antimony 45 0.003 0.50 10.00 26.00 43.87 51.70 142.00 Arsenic 60 0.140 7.08 13.05 32.49 68.90 106.15 115.50 Barium 57 0.100 120.00 180.00 253.00 457.70 650.00 690.00 Beryllium 12 0.295 0.99 1.91 2.51 5.00 9.50 9.50 Boron 45 0.904 14.40 21.10 31.95 45.00 49.00 1670.00 Cadmium 50 0.000 0.25 0.69 1.34 3.49 5.00 7.00 Chromium 58 8.000 19.30 34.50 47.30 53.70 56.00 1906.00 Cobalt 30 1.200 2.84 4.60 8.00 9.80 12.54 18.70 Copper 56 1.900 19.10 26.10 37.45 71.00 249.00 408.10 Iron 48 850.000 8042.50 12765.00 18175.00 26600.00 28074.70 51600.00 Lead 57 0.714 13.00 23.00 33.80 52.30 67.00 89.00 Manganese 47 20.000 49.00 61.80 91.00 133.00 170.40 905.00 Mercury 57 0.000 0.06 0.26 0.61 0.80 2.78 29.00 Molybdenum 50 0.050 2.50 9.96 16.00 24.00 27.00 41.00 Nickel 59 0.500 11.35 15.40 23.00 70.60 530.00 985.00 Potassium 26 2.820 2950.00 4140.00 5400.00 6362.00 6600.00 9163.00 Selenium 59 0.003 1.25 4.00 9.80 16.00 22.97 27.00 Silver 48 0.005 0.35 0.75 1.70 2.45 5.00 21.80 Thallium 8 0.180 1.88 5.19 18.55 25.00 25.00 25.00 Vanadium 11 19.570 21.50 38.00 838.00 1700.00 5000.00 5000.00 Zinc 57 6.100 14.40 19.90 26.00 48.10 257.00 90619.00
Source: Council of Industrial Boiler Owners (CIBO), 1997
September 30, 1999 14
Table 4d. Comparison of Coal and Ash Content for Selected Metalsat a Kentucky Power Plant
Element
High-sulfur Unit Low-sulfur Unit
Feed CoalMean*(WholeCoal)
Feed CoalMean*
(Ash Basis)Fly AshMean*
Bottom
AshMean*
Feed CoalMean*(WholeCoal)
Feed CoalMean*
(Ash Basis)
Fly AshMean*(Fine)
Fly AshMean*
(Coarse)
Bottom
AshMean*
As 12 120 170 11 3.3 37 91 54 54
Be 1.5 15 19 14 2.4 27 27 22 16
Cd 0.4 3.6 5.5 0.8 0.1 0.8 1 0.8 --
Co 4.6 45 59 49 11 120 150 97 61
Cr 15 150 170 150 19 210 230 190 200
Hg 0.07 0.69 0.39 0.02 0.03 0.31 0.02 0.02 0.24
Mn 25 250 270 330 14 150 230 210 480
Ni 18 170 220 210 17 190 220 160 140
Pb 11 110 150 46 11 120 170 100 380
Sb 0.9 8.7 13 3.5 0.7 7.9 15 8.9 10
Se 2.5 26 8.9 0.59 5.6 52 1.1 0.82 1.7
Th 2 20 22 21 2.9 32 31 30 29
U 1.6 16 19 14 1.4 16 21 15 10
* Notes:
All elements are in parts per million and are presented on the whole coal and as-determined basis for the feed coal, and on as-determinedbasis for the fly ash and bottom ash.
Leaders (--) indicate statistics could not be calculated owing to an insufficient number of analyses above the lower detection limit.
Source: Affolter, 1997.
September 30, 1999 15
Table 4e. Comparison of Ash and Soil Composition for Selected Elementsat a Pennsylvania Power Plant
Constituents
Comparison of Ash to U.S. Soils Comparison of Ash to Local Soils
Ash(mg/kg)*
SoilAverage
(ppmw)*
SoilRange
(ppmw)*Ash
(mg/kg)*
ResidentialSoil
(mg/kg)*(North)
ResidentialSoil
(mg/kg)*(South)
Aluminum 24100 66000 700 - >100,000 24100 12,000 15,500
Antimony 25 0.67 <1 - 8.8 25 54 <20.0
Arsenic 24 7.2 <0.1 - 97 24 1.9 2.6
Barium 1142 580 10 - 5,000 1142 32 71
Boron <10.0 34 <20 - 300 <10.0 <10.0 <10
Cadmium <0.5 0.06 0.01 - 0.7 <0/5 <0.5 <0.5
Chromium 28 54 1.0 - 2,000 28 11 13
Cobalt 7 10 <3 - 70 7 23 25
Copper 23 25 <1 - 700 23 32 34
Iron 9590 25,000 100 - >100,000 9590 32,000 33,700
Lead 25 19 <5 - 70 25 27 18
Manganese 38 660 <1 - 7,000 38 1,020 400
Mercury <0.02 0.089 <0.01 - 4.6 <0.02 <0.02 <0.02
Molybdenum <10 <3 - 7 <10 <10.0 <10
Nickel 14 19 <5 - 700 14 39 47
Potassium 5000 23,000 50 - 70,000 5000 670 460
Selenium 2.4 0.39 <0.1 - 4.3 2.4 <0.5 <0.5
Silver 1 1 <1.0 <1.0
Zinc 13.8 60 <5 - 2,900 13.8 80 110
* Notes:C Ash analysis from Northampton Generating Plant (July 1996).C U.S. soil analysis data based on results from a survey performed by the USGS team on native soils across the United States.C Local soil analysis data from a local survey performed by Hawk Mtn. Labs in early August 1996. Samples were taken near the
housing development on the north side of the quarry and along Chestnut Street on the south side.
Source: Ramsey, 1999
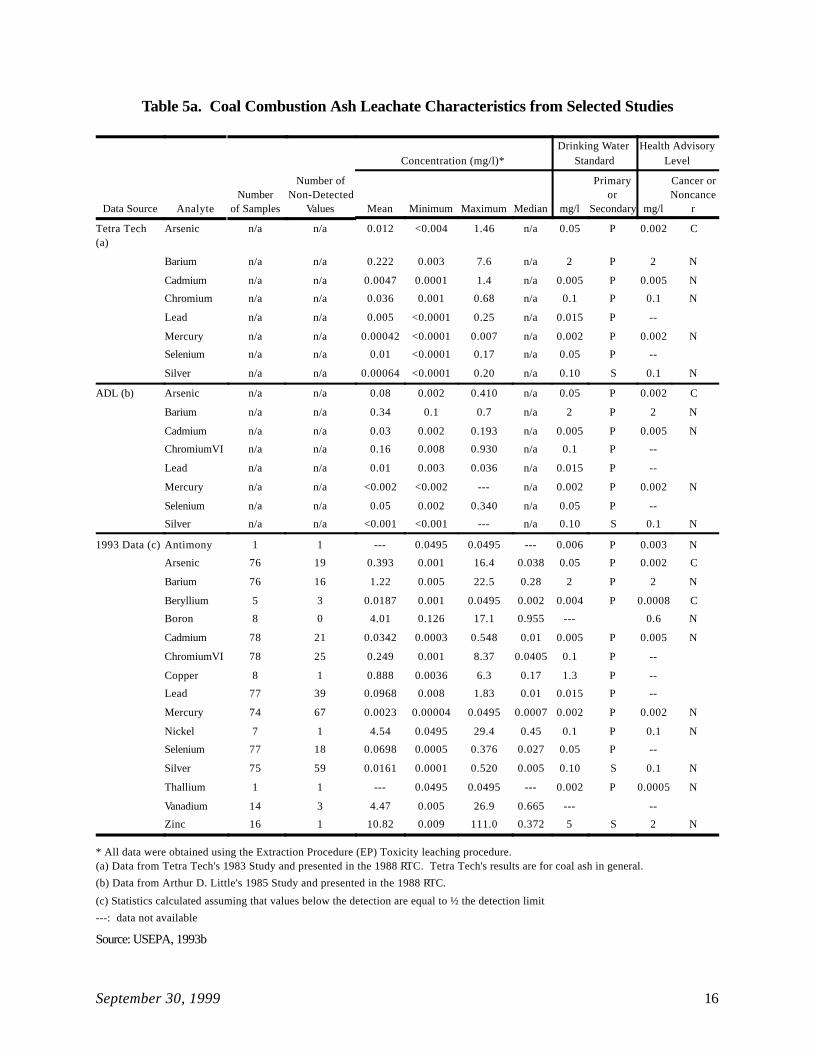
Tables 5a, 5b, 5c and 5d provide similar data from laboratory leaching studies using EP,TCLP, and Synthetic Precipitation Leaching Procedure (SPLP) methods (USEPA Methods 1310,1311, and 1312, respectively). As shown, the leachate concentrations vary depending on the studyand leaching method used, but in general antimony, arsenic, beryllium, cadmium, lead, molybdenum,selenium, and thallium typically (at least 50 percent of the time) exceed MCLs or HALs. Leachateconcentrations of barium, boron, chromium, copper, iron, mercury, nickel, silver, and zinc also exceedMCLs or HALs in some cases. Because laboratory leaching data are not always predictive of leachatechemistry in the field (Robl, 1999), data from field studies are discussed in Section 5.
September 30, 1999 16
Table 5a. Coal Combustion Ash Leachate Characteristics from Selected Studies
Data Source AnalyteNumber
of Samples
Number ofNon-Detected
Values
Concentration (mg/l)*Drinking Water
StandardHealth Advisory
Level
Mean Minimum Maximum Median mg/l
Primaryor
Secondary mg/l
Cancer orNoncance
r
Tetra Tech(a)
Arsenic n/a n/a 0.012 <0.004 1.46 n/a 0.05 P 0.002 C
Barium n/a n/a 0.222 0.003 7.6 n/a 2 P 2 N
Cadmium n/a n/a 0.0047 0.0001 1.4 n/a 0.005 P 0.005 N
Chromium n/a n/a 0.036 0.001 0.68 n/a 0.1 P 0.1 N
Lead n/a n/a 0.005 <0.0001 0.25 n/a 0.015 P --
Mercury n/a n/a 0.00042 <0.0001 0.007 n/a 0.002 P 0.002 N
Selenium n/a n/a 0.01 <0.0001 0.17 n/a 0.05 P --
Silver n/a n/a 0.00064 <0.0001 0.20 n/a 0.10 S 0.1 N
ADL (b) Arsenic n/a n/a 0.08 0.002 0.410 n/a 0.05 P 0.002 C
Barium n/a n/a 0.34 0.1 0.7 n/a 2 P 2 N
Cadmium n/a n/a 0.03 0.002 0.193 n/a 0.005 P 0.005 N
ChromiumVI n/a n/a 0.16 0.008 0.930 n/a 0.1 P --
Lead n/a n/a 0.01 0.003 0.036 n/a 0.015 P --
Mercury n/a n/a <0.002 <0.002 --- n/a 0.002 P 0.002 N
Selenium n/a n/a 0.05 0.002 0.340 n/a 0.05 P --
Silver n/a n/a <0.001 <0.001 --- n/a 0.10 S 0.1 N
1993 Data (c) Antimony 1 1 --- 0.0495 0.0495 --- 0.006 P 0.003 N
Arsenic 76 19 0.393 0.001 16.4 0.038 0.05 P 0.002 C
Barium 76 16 1.22 0.005 22.5 0.28 2 P 2 N
Beryllium 5 3 0.0187 0.001 0.0495 0.002 0.004 P 0.0008 C
Boron 8 0 4.01 0.126 17.1 0.955 --- 0.6 N
Cadmium 78 21 0.0342 0.0003 0.548 0.01 0.005 P 0.005 N
ChromiumVI 78 25 0.249 0.001 8.37 0.0405 0.1 P --
Copper 8 1 0.888 0.0036 6.3 0.17 1.3 P --
Lead 77 39 0.0968 0.008 1.83 0.01 0.015 P --
Mercury 74 67 0.0023 0.00004 0.0495 0.0007 0.002 P 0.002 N
Nickel 7 1 4.54 0.0495 29.4 0.45 0.1 P 0.1 N
Selenium 77 18 0.0698 0.0005 0.376 0.027 0.05 P --
Silver 75 59 0.0161 0.0001 0.520 0.005 0.10 S 0.1 N
Thallium 1 1 --- 0.0495 0.0495 --- 0.002 P 0.0005 N
Vanadium 14 3 4.47 0.005 26.9 0.665 --- --
Zinc 16 1 10.82 0.009 111.0 0.372 5 S 2 N
* All data were obtained using the Extraction Procedure (EP) Toxicity leaching procedure.(a) Data from Tetra Tech's 1983 Study and presented in the 1988 RTC. Tetra Tech's results are for coal ash in general.
(b) Data from Arthur D. Little's 1985 Study and presented in the 1988 RTC.
(c) Statistics calculated assuming that values below the detection are equal to ½ the detection limit
---: data not available
Source: USEPA, 1993b

September 30, 1999 17
Table 5b. Coal Combustion Ash Leachate Characteristics from Selected Studies
Constituent
DrinkingWater
Standard(mg/l)
Health Advisory Levels Kincaid StationTCLP
10/18/94(mg/l)
Coffen StationTCLP
8/22/97(mg/l)
Kincaid (50%)/Coffen (50%)Fly Ash Leachate (mg/l)
mg/lCancer orNoncancer
TCLP3/31/98
TCLP4/30/98
TCLP5/7/98
TCLP8/20/98
TCLP11/17/98
DeionizedWater
4/30/98
Antimony 0.006 P 0.003 N -- 0.140 0.07 0.0332 0.03 0.06 0.09 --
Arsenic 0.05 P 0.002 C 0.40 0.075 0.049 0.0267 0.20 0.10 0.28 --
Barium 2 P 2 N 2 0.47 0.641 0.376 <1 <1 <1 --
Beryllium 0.004 P 0.0008 C -- 0.015 ND ND 0.019 <0.0002 <0.0001 --
Boron -- 0.6 N -- 34.2 51.68 92.1 49 35 23 --
Cadmium 0.005 P 0.005 N 0.30 0.163 0.168 ND 0.21 0.0005 0.0052 --
Chloride 250 S -- -- -- -- -- -- -- -- 3.4
Chromium 0.1 P 0.1 N 1.4 0.083 0.166 0.39 0.31 0.023 0.043 --
Cobalt -- -- -- 0.11 ND ND 0.11 0.007 0.004 --
Copper 1.3 P -- -- 0.43 ND ND 0.67 0.023 0.028 --
Cyanide, total 0.2 P 0.2 N -- -- -- -- -- -- -- 0.011
Fluoride 4 P -- -- -- -- -- -- -- -- 8.1
Iron 0.3 S -- -- 0.17 ND ND 10 0.02 0.09 --
Lead 0.015 P -- 0.4 0.04 ND ND 0.07 <0.01 <0.06 --
Manganese 0.05 S -- -- 0.88 ND ND 1.9 0.10 0.1 --
Mercury 0.002 P 0.002 N <0.0002 ND ND ND <0.0002 <0.0002 0.0022 --
Nickel 0.1 P 0.1 N -- 0.97 ND ND 0.80 0.090 0.094 --
Selenium 0.05 P -- 0.046 0.011 0.451 0.869 0.05 0.29 0.3 --
Silver 0.1 S 0.1 N <0.05 ND ND ND <0.005 <0.005 0.012 --
Sulfate 500 P -- -- ND -- -- -- -- -- 1210
Thallium 0.002 P 0.0005 N -- 0.021 ND ND <0.4 0.006 0.008 --
Zinc 5 S 2 N -- 3.21 0.045 0.177 3.1 <1 <1 --
Source: Crislip, 1999
Table 5c. Coal Combustion Ash Leachate Characteristics from Pennsylvania Facilities
Elements
Mean/Median Leachate Concentrations(in mg/l, by method)
Drinking WaterStandard
Health AdvisoryLevel
ASTM(4)* EPTOX(10)* SPLP(20)* TCLP(200)* mg/l P/S* mg/l C/N*
Antimony BDL .15/.15 .13/.06 .28/.11 0.006 P 0.003 NArsenic 01/.008 .06/.02 .18/.09 .10/.03 0.05 P 0.002 CBarium .40/.20 .20/.24 .29/.22 .40/.30 2 P 2 NBoron BDL 1.09/1.02 2.1/.19 1.30/.50 -- 0.6 NCadmium .009/.009 .012/.004 .003/.003 .04/.02 0.005 P 0.005 NChromium .22/.22 .11/.02 .05/.06 .14/.08 0.1 P 0.1 NCobalt BDL BDL .01/.01 .22/.05 -- --Copper .06/.05 .03/.01 .06/.04 .09/.05 1.3 P --Lead .02/.02 .02/.02 BDL .17/.15 0.015 P --Mercury BDL .001/.001 .001/.001 .01/.003 0.002 P 0.002 NMolybdenum .02/.02 .10/.08 .39/.09 .23/.19 -- 0.04 NNickel .06/.04 .17/.15 .09/.08 .15/.12 0.1 P 0.1 NSelenium .015/.015 .03/.05 .13/.11 .12/.05 0.05 P --Silver BDL .001/.001 .003/.003 .03/.02 0.1 S 0.1 NZinc .18/.18 .35/.29 .04/.03 .65/.14 5 S 2 N*( ) Indicates number of samples per method; P=primary; S=secondary; C=cancer; N=non-cancer.BDL=Below Detection Limit
Source: Kim, 1997

September 30, 1999 18
Table 5d. Summary of Fluidized Bed Combustion Ash Leachate Test Results*(concentrations in ppm)
Material Num.of Minimum 25th 50th 75th 90th 95th Maximum
Type Constituent Values Value Percentile Percentile Percentile Percentile Percentile Value
Bed Ash Aluminum 26 0.05000 0.13000 0.3250 1.6000 10.5000 13.140 20.600 Antimony 26 0.00250 0.05000 0.3350 0.5000 0.7100 0.920 1.250 Arsenic 69 0.00100 0.01000 0.0500 0.0500 0.1250 0.180 0.300 Barium 67 0.02500 0.05000 0.2000 0.4520 0.9000 1.000 8.400 Beryllium 11 0.00008 0.00500 0.0250 0.0500 0.0500 0.280 0.280 Boron 23 0.00300 0.10000 0.1200 0.5500 2.6000 2.800 3.950 Cadmium 63 0.00100 0.01600 0.0250 0.0300 0.0500 0.090 0.500 Chromium 68 0.00500 0.02500 0.0250 0.0550 0.1770 0.220 0.320 Cobalt 15 0.05000 0.12500 0.1400 0.1750 0.2500 0.310 0.310 Copper 30 0.01000 0.02000 0.0495 0.0600 0.1340 0.158 0.184 Iron 29 0.04000 0.09900 0.1900 0.5100 2.7900 3.200 38.800 Lead 69 0.00500 0.02500 0.0500 0.2500 0.3600 0.418 0.710 Manganese 28 0.00400 0.03350 0.0545 0.1900 0.7800 7.600 10.900 Mercury 61 0.00010 0.00030 0.0010 0.0010 0.0014 0.010 0.100 Molybdenum 23 0.05000 0.12500 0.1600 0.2400 0.6100 0.940 1.200 Nickel 54 0.00500 0.02500 0.0500 0.1600 0.2360 0.250 2.500 Potassium 13 0.12500 2.00000 5.6000 8.4000 11.0000 18.600 18.600 Selenium 64 0.00050 0.00250 0.0500 0.0500 0.1000 0.134 2.500 Silver 63 0.00150 0.02400 0.0250 0.0430 0.1000 0.125 0.310 Thallium 7 0.00500 0.04500 0.0500 0.3250 0.5000 0.500 0.500 Vanadium 32 0.02500 0.10500 0.3300 0.4550 1.6400 3.400 40.000 Zinc 34 0.00250 0.02000 0.0650 0.1110 0.5100 1.040 4.460
Fly Ash Aluminum 35 0.04000 0.22000 0.5000 8.4500 23.9000 111.000 120.800 Antimony 37 0.00250 0.03070 0.1000 0.5000 1.1700 1.290 1.520 Arsenic 81 0.00050 0.01100 0.0500 0.0500 0.1190 0.250 0.600 Barium 90 0.02500 0.08000 0.3000 0.6250 1.5500 6.500 42.000 Beryllium 14 0.00008 0.00330 0.0105 0.0500 0.0500 0.050 0.050 Boron 33 0.03000 0.10000 0.2800 0.6000 0.9800 1.400 23.317 Cadmium 76 0.00100 0.02000 0.0250 0.0400 0.0600 0.100 0.500 Chromium 83 0.00500 0.02500 0.0500 0.1200 0.2000 0.260 0.910 Cobalt 18 0.00500 0.04500 0.0980 0.1370 0.2500 0.270 0.270 Copper 39 0.00500 0.02000 0.0580 0.0850 0.1330 0.160 0.183 Iron 38 0.01000 0.09000 0.1800 0.5000 0.7600 0.900 7.790 Lead 80 0.00100 0.02500 0.0500 0.2685 0.4450 0.518 0.700 Manganese 37 0.00250 0.03000 0.0500 0.3300 0.7300 1.100 1.130 Mercury 76 0.00010 0.00025 0.0010 0.0010 0.0040 0.010 0.290 Molybdenum 35 0.02320 0.07000 0.2000 0.3200 0.5900 0.610 0.720 Nickel 65 0.00500 0.02500 0.0500 0.1600 0.2500 0.330 1.200 Potassium 20 1.21000 4.63000 17.7000 39.3000 54.2500 63.400 66.800 Selenium 81 0.00050 0.00700 0.0500 0.1000 0.2000 0.266 0.420 Silver 74 0.00400 0.02000 0.0250 0.0400 0.0520 0.100 0.240 Thallium 9 0.00500 0.04500 0.0500 0.0500 0.5000 0.500 0.500 Vanadium 35 0.00750 0.09000 0.1300 0.2040 0.7000 1.640 3.200 Zinc 42 0.00500 0.02000 0.0568 0.1400 0.3700 1.040 4.460
Combined Ash Aluminum 44 0.01000 0.53500 1.8650 4.0550 8.8900 10.700 18.670 Antimony 42 0.00010 0.00500 0.0950 0.2700 0.5000 0.590 1.200 Arsenic 62 0.00230 0.01000 0.0250 0.0500 0.2500 0.350 0.890 Barium 60 0.00500 0.05600 0.1700 0.5950 1.1585 3.925 37.000 Beryllium 6 0.00200 0.00200 0.0095 0.0500 7.8000 7.800 7.800 Boron 43 0.00500 0.09000 0.1600 0.4600 0.6000 0.650 26.700 Cadmium 51 0.00250 0.00250 0.0050 0.0130 0.0500 0.050 0.130 Chromium 60 0.00330 0.02500 0.0500 0.1150 0.2450 0.280 0.600 Cobalt 24 0.00070 0.00500 0.0180 0.0250 0.0315 0.250 0.400 Copper 52 0.00250 0.01000 0.0225 0.0855 0.4400 1.860 6.100 Iron 46 0.00005 0.01500 0.0700 0.1780 0.3100 0.360 2.045 Lead 54 0.00100 0.02500 0.0500 0.1290 0.2500 0.430 1.540 Manganese 47 0.00250 0.00500 0.0500 0.3100 0.4700 0.619 0.660 Mercury 51 0.00010 0.00010 0.0002 0.0010 0.0020 0.100 0.100 Molybdenum 46 0.02500 0.05000 0.0865 0.2000 0.4100 0.540 1.200 Nickel 48 0.00500 0.02000 0.0250 0.0920 0.2640 0.420 0.900 Potassium 23 1.55400 7.50000 14.5000 20.0000 24.0000 27.200 45.300 Selenium 63 0.00100 0.00800 0.0200 0.0500 0.2400 0.256 0.350 Silver 51 0.00250 0.00500 0.0050 0.0150 0.0400 0.130 0.250 Thallium 5 0.00100 0.00100 0.0500 0.4600 0.5000 0.500 0.500 Vanadium 6 0.00500 0.08599 0.1535 1.0000 2.2000 2.200 2.200 Zinc 54 0.00250 0.00500 0.0215 0.1340 0.3000 0.480 2.400
* Leachate date obtained primarily using EP and TCLP procedures, with some SPLP and other methods also used.Source: Council of Industrial Boiler Owners (CIBO), 1997
4 Available data for the injectate are for dissolved rather than total concentrations, which may behigher and, thus, in some cases could exceed MCLs or HALs. It seems unlikely that the total valueswould be greater than MCLs in this case, however, because the total values measured for the injectatewere less than the relevant health-based benchmarks.
September 30, 1999 19
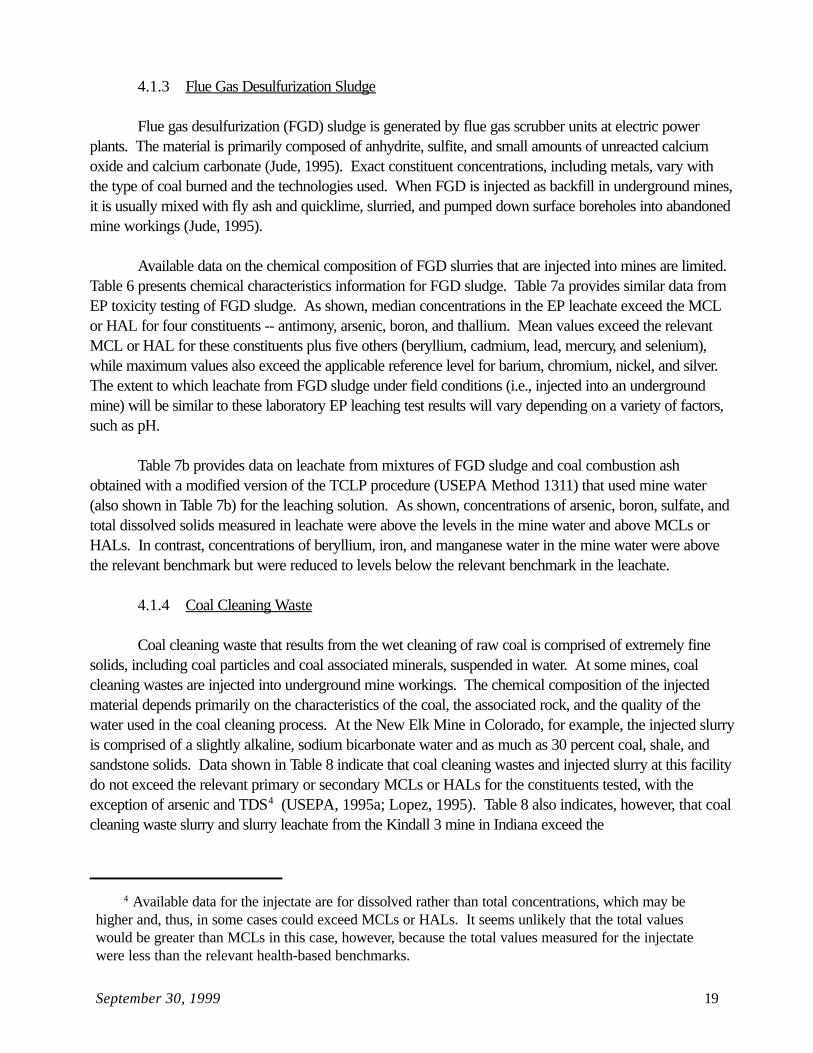
4.1.3 Flue Gas Desulfurization Sludge
Flue gas desulfurization (FGD) sludge is generated by flue gas scrubber units at electric powerplants. The material is primarily composed of anhydrite, sulfite, and small amounts of unreacted calciumoxide and calcium carbonate (Jude, 1995). Exact constituent concentrations, including metals, vary withthe type of coal burned and the technologies used. When FGD is injected as backfill in underground mines,it is usually mixed with fly ash and quicklime, slurried, and pumped down surface boreholes into abandonedmine workings (Jude, 1995).
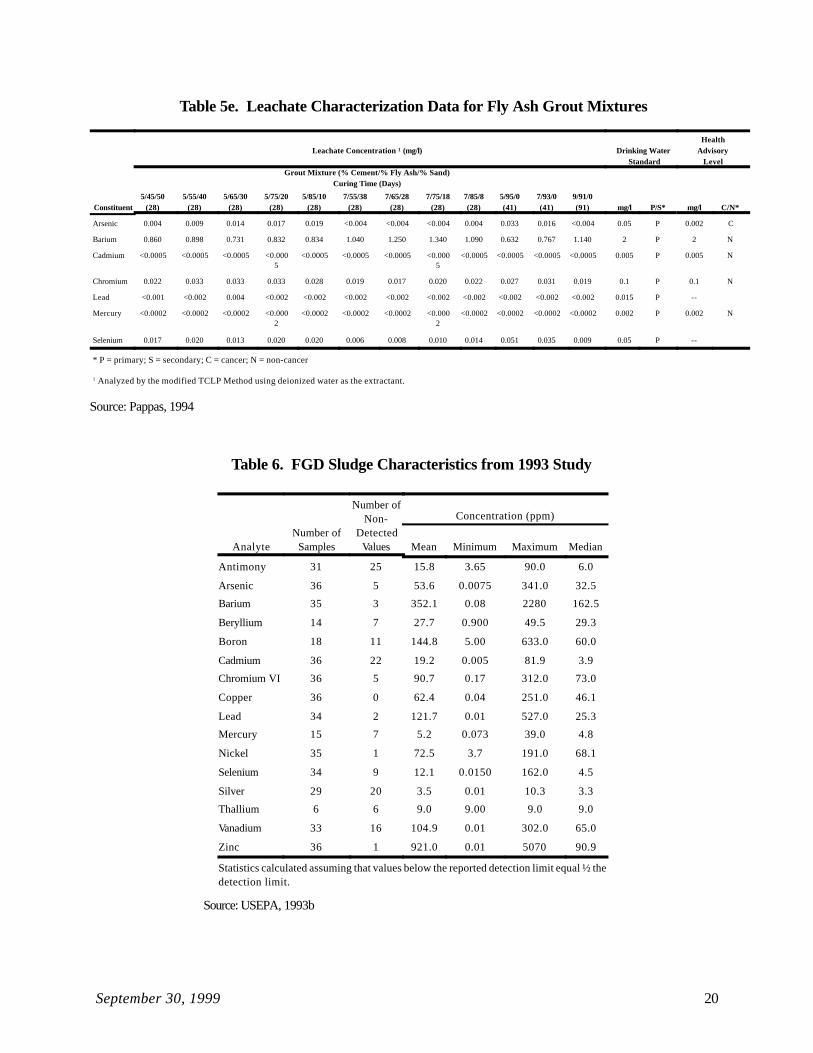
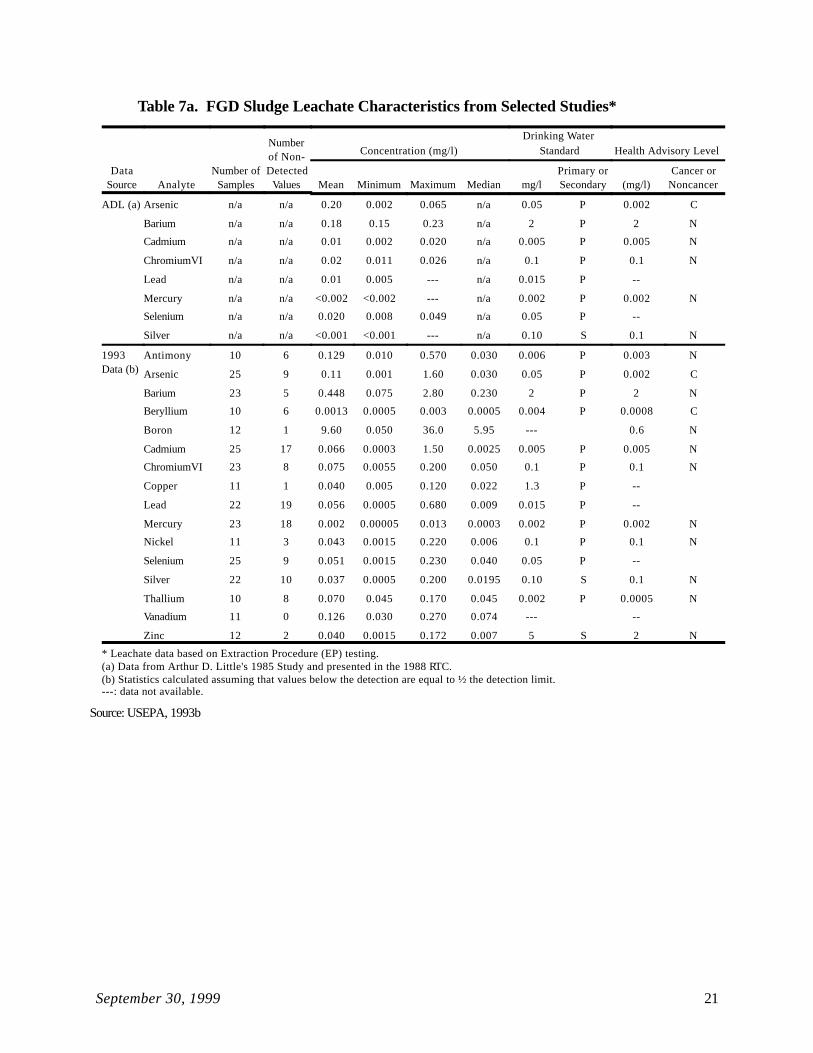
Available data on the chemical composition of FGD slurries that are injected into mines are limited. Table 6 presents chemical characteristics information for FGD sludge. Table 7a provides similar data fromEP toxicity testing of FGD sludge. As shown, median concentrations in the EP leachate exceed the MCLor HAL for four constituents -- antimony, arsenic, boron, and thallium. Mean values exceed the relevantMCL or HAL for these constituents plus five others (beryllium, cadmium, lead, mercury, and selenium),while maximum values also exceed the applicable reference level for barium, chromium, nickel, and silver. The extent to which leachate from FGD sludge under field conditions (i.e., injected into an undergroundmine) will be similar to these laboratory EP leaching test results will vary depending on a variety of factors,such as pH.
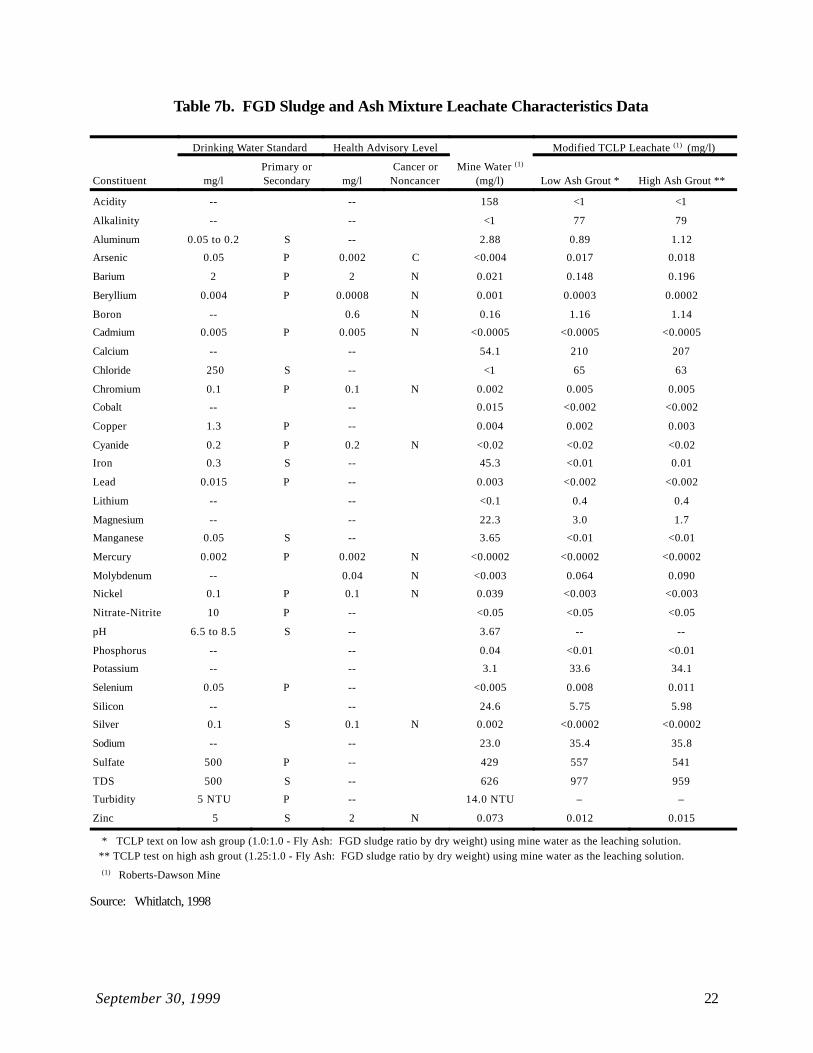
Table 7b provides data on leachate from mixtures of FGD sludge and coal combustion ashobtained with a modified version of the TCLP procedure (USEPA Method 1311) that used mine water(also shown in Table 7b) for the leaching solution. As shown, concentrations of arsenic, boron, sulfate, andtotal dissolved solids measured in leachate were above the levels in the mine water and above MCLs orHALs. In contrast, concentrations of beryllium, iron, and manganese water in the mine water were abovethe relevant benchmark but were reduced to levels below the relevant benchmark in the leachate.
4.1.4 Coal Cleaning Waste
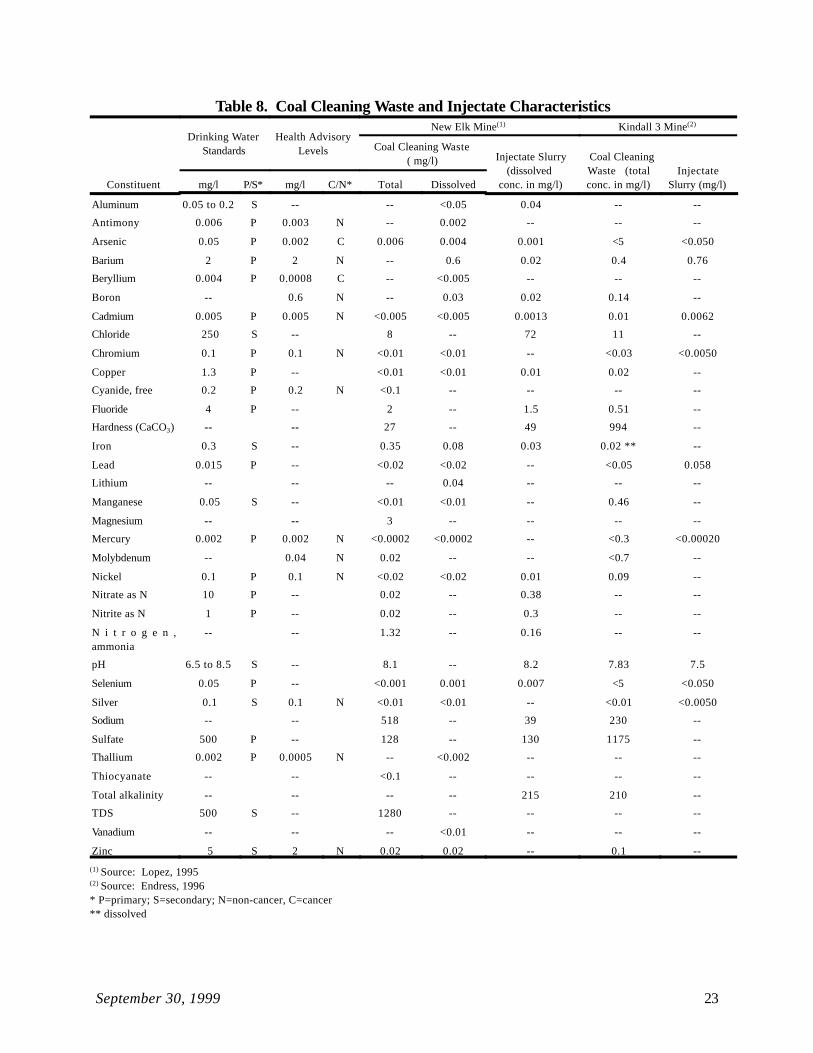
Coal cleaning waste that results from the wet cleaning of raw coal is comprised of extremely finesolids, including coal particles and coal associated minerals, suspended in water. At some mines, coalcleaning wastes are injected into underground mine workings. The chemical composition of the injectedmaterial depends primarily on the characteristics of the coal, the associated rock, and the quality of thewater used in the coal cleaning process. At the New Elk Mine in Colorado, for example, the injected slurryis comprised of a slightly alkaline, sodium bicarbonate water and as much as 30 percent coal, shale, andsandstone solids. Data shown in Table 8 indicate that coal cleaning wastes and injected slurry at this facilitydo not exceed the relevant primary or secondary MCLs or HALs for the constituents tested, with theexception of arsenic and TDS4 (USEPA, 1995a; Lopez, 1995). Table 8 also indicates, however, that coalcleaning waste slurry and slurry leachate from the Kindall 3 mine in Indiana exceed the
September 30, 1999 20
Table 5e. Leachate Characterization Data for Fly Ash Grout Mixtures
Constituent
Leachate Concentration 1 (mg/l) Drinking WaterStandard
HealthAdvisory
LevelGrout Mixture (% Cement/% Fly Ash/% Sand)
Curing Time (Days)
mg/l P/S* mg/l C/N*5/45/50
(28)5/55/40
(28)5/65/30
(28)5/75/20
(28)5/85/10
(28)7/55/38
(28)7/65/28
(28)7/75/18
(28)7/85/8(28)
5/95/0(41)
7/93/0(41)
9/91/0(91)
Arsenic 0.004 0.009 0.014 0.017 0.019 <0.004 <0.004 <0.004 0.004 0.033 0.016 <0.004 0.05 P 0.002 C
Barium 0.860 0.898 0.731 0.832 0.834 1.040 1.250 1.340 1.090 0.632 0.767 1.140 2 P 2 N
Cadmium <0.0005 <0.0005 <0.0005 <0.0005
<0.0005 <0.0005 <0.0005 <0.0005
<0.0005 <0.0005 <0.0005 <0.0005 0.005 P 0.005 N
Chromium 0.022 0.033 0.033 0.033 0.028 0.019 0.017 0.020 0.022 0.027 0.031 0.019 0.1 P 0.1 N
Lead <0.001 <0.002 0.004 <0.002 <0.002 <0.002 <0.002 <0.002 <0.002 <0.002 <0.002 <0.002 0.015 P --
Mercury <0.0002 <0.0002 <0.0002 <0.0002
<0.0002 <0.0002 <0.0002 <0.0002
<0.0002 <0.0002 <0.0002 <0.0002 0.002 P 0.002 N
Selenium 0.017 0.020 0.013 0.020 0.020 0.006 0.008 0.010 0.014 0.051 0.035 0.009 0.05 P --
* P = primary; S = secondary; C = cancer; N = non-cancer
1 Analyzed by the modified TCLP Method using deionized water as the extractant.
Source: Pappas, 1994
Table 6. FGD Sludge Characteristics from 1993 Study
AnalyteNumber of
Samples
Number ofNon-
DetectedValues
Concentration (ppm)
Mean Minimum Maximum Median
Antimony 31 25 15.8 3.65 90.0 6.0
Arsenic 36 5 53.6 0.0075 341.0 32.5
Barium 35 3 352.1 0.08 2280 162.5
Beryllium 14 7 27.7 0.900 49.5 29.3
Boron 18 11 144.8 5.00 633.0 60.0
Cadmium 36 22 19.2 0.005 81.9 3.9
Chromium VI 36 5 90.7 0.17 312.0 73.0
Copper 36 0 62.4 0.04 251.0 46.1
Lead 34 2 121.7 0.01 527.0 25.3
Mercury 15 7 5.2 0.073 39.0 4.8
Nickel 35 1 72.5 3.7 191.0 68.1
Selenium 34 9 12.1 0.0150 162.0 4.5
Silver 29 20 3.5 0.01 10.3 3.3
Thallium 6 6 9.0 9.00 9.0 9.0
Vanadium 33 16 104.9 0.01 302.0 65.0
Zinc 36 1 921.0 0.01 5070 90.9
Statistics calculated assuming that values below the reported detection limit equal ½ thedetection limit.
Source: USEPA, 1993b
September 30, 1999 21
Table 7a. FGD Sludge Leachate Characteristics from Selected Studies*
DataSource Analyte
Number ofSamples
Numberof Non-Detected
Values
Concentration (mg/l)Drinking Water
Standard Health Advisory Level
Mean Minimum Maximum Median mg/lPrimary orSecondary (mg/l)
Cancer orNoncancer
ADL (a) Arsenic n/a n/a 0.20 0.002 0.065 n/a 0.05 P 0.002 C
Barium n/a n/a 0.18 0.15 0.23 n/a 2 P 2 N
Cadmium n/a n/a 0.01 0.002 0.020 n/a 0.005 P 0.005 N
ChromiumVI n/a n/a 0.02 0.011 0.026 n/a 0.1 P 0.1 N
Lead n/a n/a 0.01 0.005 --- n/a 0.015 P --
Mercury n/a n/a <0.002 <0.002 --- n/a 0.002 P 0.002 N
Selenium n/a n/a 0.020 0.008 0.049 n/a 0.05 P --
Silver n/a n/a <0.001 <0.001 --- n/a 0.10 S 0.1 N
1993Data (b)
Antimony 10 6 0.129 0.010 0.570 0.030 0.006 P 0.003 N
Arsenic 25 9 0.11 0.001 1.60 0.030 0.05 P 0.002 C
Barium 23 5 0.448 0.075 2.80 0.230 2 P 2 N
Beryllium 10 6 0.0013 0.0005 0.003 0.0005 0.004 P 0.0008 C
Boron 12 1 9.60 0.050 36.0 5.95 --- 0.6 N
Cadmium 25 17 0.066 0.0003 1.50 0.0025 0.005 P 0.005 N
ChromiumVI 23 8 0.075 0.0055 0.200 0.050 0.1 P 0.1 N
Copper 11 1 0.040 0.005 0.120 0.022 1.3 P --
Lead 22 19 0.056 0.0005 0.680 0.009 0.015 P --
Mercury 23 18 0.002 0.00005 0.013 0.0003 0.002 P 0.002 N
Nickel 11 3 0.043 0.0015 0.220 0.006 0.1 P 0.1 N
Selenium 25 9 0.051 0.0015 0.230 0.040 0.05 P --
Silver 22 10 0.037 0.0005 0.200 0.0195 0.10 S 0.1 N
Thallium 10 8 0.070 0.045 0.170 0.045 0.002 P 0.0005 N
Vanadium 11 0 0.126 0.030 0.270 0.074 --- --
Zinc 12 2 0.040 0.0015 0.172 0.007 5 S 2 N
* Leachate data based on Extraction Procedure (EP) testing.(a) Data from Arthur D. Little's 1985 Study and presented in the 1988 RTC.(b) Statistics calculated assuming that values below the detection are equal to ½ the detection limit.---: data not available.
Source: USEPA, 1993b
September 30, 1999 22
Table 7b. FGD Sludge and Ash Mixture Leachate Characteristics Data
Constituent
Drinking Water Standard Health Advisory Level
Mine Water (1)
(mg/l)
Modified TCLP Leachate (1) (mg/l)
mg/lPrimary orSecondary mg/l
Cancer orNoncancer Low Ash Grout * High Ash Grout **
Acidity -- -- 158 <1 <1
Alkalinity -- -- <1 77 79
Aluminum 0.05 to 0.2 S -- 2.88 0.89 1.12
Arsenic 0.05 P 0.002 C <0.004 0.017 0.018
Barium 2 P 2 N 0.021 0.148 0.196
Beryllium 0.004 P 0.0008 N 0.001 0.0003 0.0002
Boron -- 0.6 N 0.16 1.16 1.14
Cadmium 0.005 P 0.005 N <0.0005 <0.0005 <0.0005
Calcium -- -- 54.1 210 207
Chloride 250 S -- <1 65 63
Chromium 0.1 P 0.1 N 0.002 0.005 0.005
Cobalt -- -- 0.015 <0.002 <0.002
Copper 1.3 P -- 0.004 0.002 0.003
Cyanide 0.2 P 0.2 N <0.02 <0.02 <0.02
Iron 0.3 S -- 45.3 <0.01 0.01
Lead 0.015 P -- 0.003 <0.002 <0.002
Lithium -- -- <0.1 0.4 0.4
Magnesium -- -- 22.3 3.0 1.7
Manganese 0.05 S -- 3.65 <0.01 <0.01
Mercury 0.002 P 0.002 N <0.0002 <0.0002 <0.0002
Molybdenum -- 0.04 N <0.003 0.064 0.090
Nickel 0.1 P 0.1 N 0.039 <0.003 <0.003
Nitrate-Nitrite 10 P -- <0.05 <0.05 <0.05
pH 6.5 to 8.5 S -- 3.67 -- --
Phosphorus -- -- 0.04 <0.01 <0.01
Potassium -- -- 3.1 33.6 34.1
Selenium 0.05 P -- <0.005 0.008 0.011
Silicon -- -- 24.6 5.75 5.98
Silver 0.1 S 0.1 N 0.002 <0.0002 <0.0002
Sodium -- -- 23.0 35.4 35.8
Sulfate 500 P -- 429 557 541
TDS 500 S -- 626 977 959
Turbidity 5 NTU P -- 14.0 NTU – –
Zinc 5 S 2 N 0.073 0.012 0.015
* TCLP text on low ash group (1.0:1.0 - Fly Ash: FGD sludge ratio by dry weight) using mine water as the leaching solution. ** TCLP test on high ash grout (1.25:1.0 - Fly Ash: FGD sludge ratio by dry weight) using mine water as the leaching solution.
(1) Roberts-Dawson Mine
Source: Whitlatch, 1998
September 30, 1999 23
Table 8. Coal Cleaning Waste and Injectate Characteristics
Constituent
Drinking WaterStandards
Health AdvisoryLevels
New Elk Mine(1) Kindall 3 Mine(2)
Coal Cleaning Waste ( mg/l) Injectate Slurry
(dissolved conc. in mg/l)
Coal CleaningWaste (totalconc. in mg/l)
InjectateSlurry (mg/l)mg/l P/S* mg/l C/N* Total Dissolved
Aluminum 0.05 to 0.2 S -- -- <0.05 0.04 -- --
Antimony 0.006 P 0.003 N -- 0.002 -- -- --
Arsenic 0.05 P 0.002 C 0.006 0.004 0.001 <5 <0.050
Barium 2 P 2 N -- 0.6 0.02 0.4 0.76
Beryllium 0.004 P 0.0008 C -- <0.005 -- -- --
Boron -- 0.6 N -- 0.03 0.02 0.14 --
Cadmium 0.005 P 0.005 N <0.005 <0.005 0.0013 0.01 0.0062
Chloride 250 S -- 8 -- 72 11 --
Chromium 0.1 P 0.1 N <0.01 <0.01 -- <0.03 <0.0050
Copper 1.3 P -- <0.01 <0.01 0.01 0.02 --
Cyanide, free 0.2 P 0.2 N <0.1 -- -- -- --
Fluoride 4 P -- 2 -- 1.5 0.51 --
Hardness (CaCO3) -- -- 27 -- 49 994 --
Iron 0.3 S -- 0.35 0.08 0.03 0.02 ** --
Lead 0.015 P -- <0.02 <0.02 -- <0.05 0.058
Lithium -- -- -- 0.04 -- -- --
Manganese 0.05 S -- <0.01 <0.01 -- 0.46 --
Magnesium -- -- 3 -- -- -- --
Mercury 0.002 P 0.002 N <0.0002 <0.0002 -- <0.3 <0.00020
Molybdenum -- 0.04 N 0.02 -- -- <0.7 --
Nickel 0.1 P 0.1 N <0.02 <0.02 0.01 0.09 --
Nitrate as N 10 P -- 0.02 -- 0.38 -- --
Nitrite as N 1 P -- 0.02 -- 0.3 -- --
N i t r o g e n ,ammonia
-- -- 1.32 -- 0.16 -- --
pH 6.5 to 8.5 S -- 8.1 -- 8.2 7.83 7.5
Selenium 0.05 P -- <0.001 0.001 0.007 <5 <0.050
Silver 0.1 S 0.1 N <0.01 <0.01 -- <0.01 <0.0050
Sodium -- -- 518 -- 39 230 --
Sulfate 500 P -- 128 -- 130 1175 --
Thallium 0.002 P 0.0005 N -- <0.002 -- -- --
Thiocyanate -- -- <0.1 -- -- -- --
Total alkalinity -- -- -- -- 215 210 --
TDS 500 S -- 1280 -- -- -- --
Vanadium -- -- -- <0.01 -- -- --
Zinc 5 S 2 N 0.02 0.02 -- 0.1 --
(1) Source: Lopez, 1995(2) Source: Endress, 1996* P=primary; S=secondary; N=non-cancer, C=cancer ** dissolved

5 This approach might be used when the goal is to fill the mineshaft to prevent access rather than tofill substantial portions of the mine workings.
September 30, 1999 24
primary MCLs for arsenic, cadmium, and lead and the secondary MCLs for TDS, sulfate, and manganese.
4.1.5 Mine Drainage Precipitate Waste
Mine drainage precipitate waste, or sludge, resulting from treatment (generally neutralization) ofAMD is composed of ferric oxide, gypsum, hydrated aluminum oxide, variable amounts of sulfates, calciumsalts, carbonates, bicarbonates and trace amounts of silica, phosphate, manganese, copper, and zinccompounds (Smith, 1987). Additional metals (e.g., lead, arsenic, selenium) may be present depending onthe mineralogy of the coal and associated rocks of the drainage area.
4.2 Well Characteristics
Mine backfill materials are typically injected into underground mines through one or more drilledwells or through a pipeline installed in the mine shaft and appropriate portions of the underground workings. In some situations, injection may be directly into a mineshaft without a pipeline for distributing the injectedmaterial within the mine workings.5 The specific injection method(s) selected by a facility depends primarilyon the backfilling objectives and method (see Section 4.3) to be used.
If drilled wells are used, the details of well construction (e.g., diameter, casing, cementing) aredetermined by site-specific factors such as depth to the mine workings to be backfilled and the geology ofthe overlying strata, as well as backfilling practices. If the mine workings to be backfilled are mostlyhorizontal and relatively shallow (e.g., a few hundred feet or less below ground surface), backfilling may beaccomplished by injecting backfill material down a well until the well will not accept any additional material,plugging the well, and then drilling and “filling” additional wells located at appropriate locations throughoutthe mine workings. For example, the underground workings at the abandoned Roberts-Dawsonunderground coal mine in Ohio were backfilled with 23,000 cubic yards of fly ash and FGD sludge injectedthrough 318 injection points (DOE, 1998a). Similarly, 227 injection points were used to backfill a 23-acreportion of the Omega underground coal mine in West Virginia (DOE, 1998b).
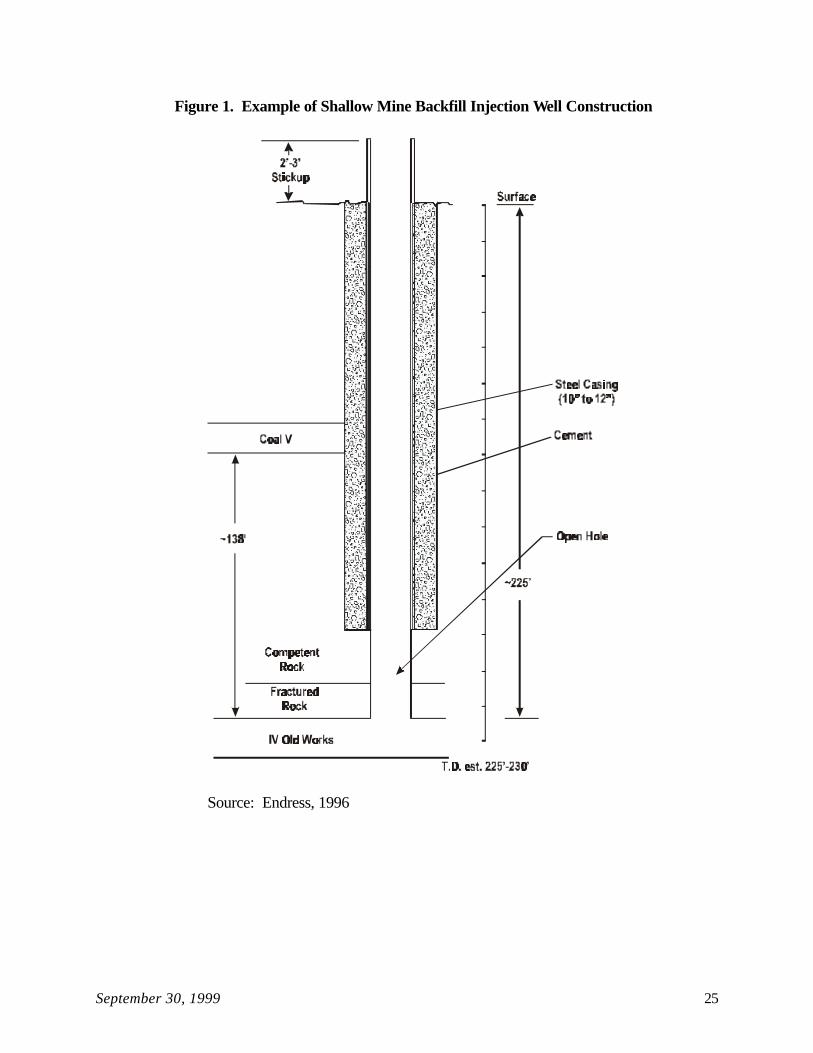
In this type of backfill operation, each injection well is used for a relatively short period of time(e.g., days). Such wells may have a casing run from the surface to the top of the mine workings (see Figure1). Conductor pipe may also be used depending on the stability of near-surface rock and soil (Crislip,1998). Alternatively, material may be injected down the drill pipe and a casing does not need to beinstalled.
September 30, 1999 25
Source: Endress, 1996
Figure 1. Example of Shallow Mine Backfill Injection Well Construction

September 30, 1999 26
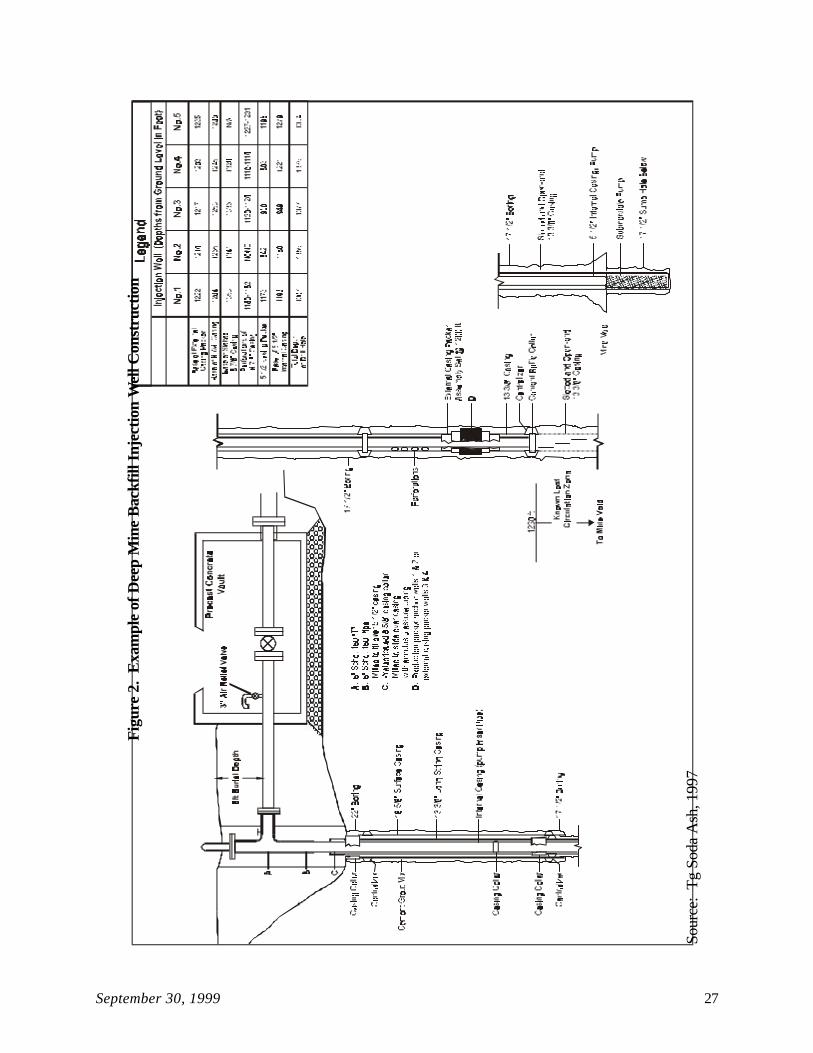
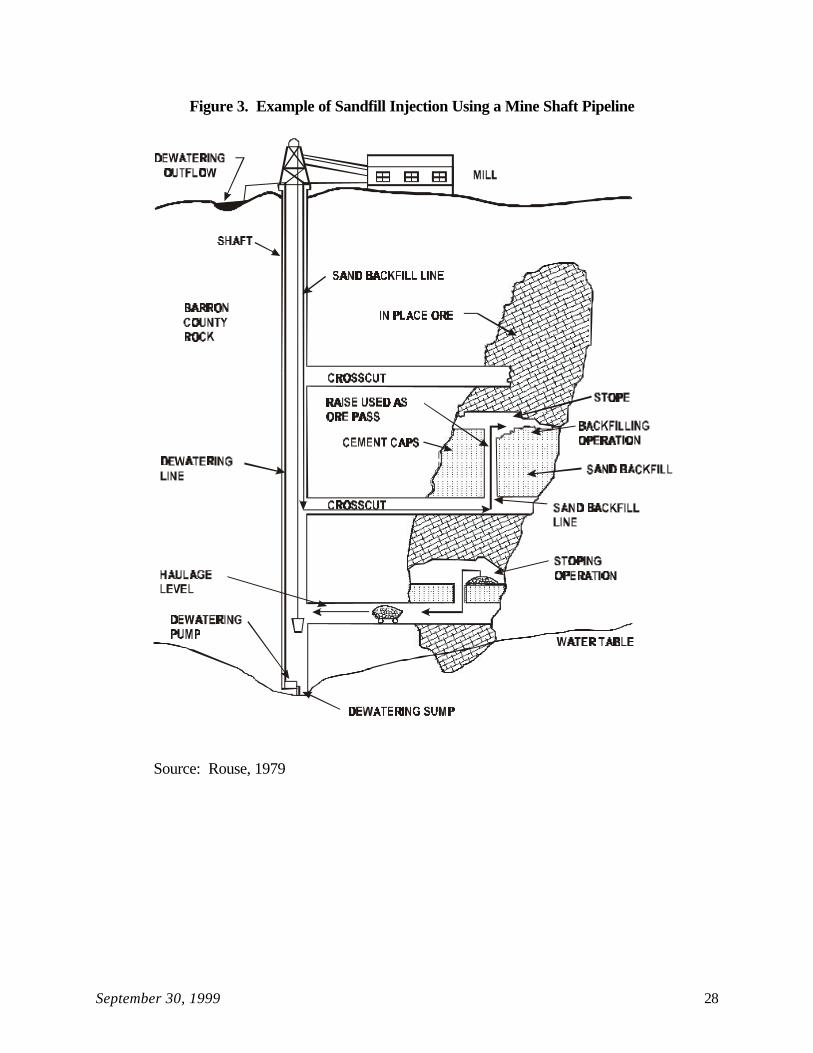
When the mine workings to be backfilled are deeper, fewer injection points may be needed butmore piping and related distribution equipment in the mine workings may be required. When deeper wellsare used, well construction may more typically involve the use of multiple casings, as illustrated in Figure 2. When pipelines are used, as illustrated in Figure 3, they are used to convey the backfill to the desiredlocation in the mine. Distribution of backfill material by piping within a mine is common when active minesare backfilled, especially mines that use mining methods dependent on on-going backfilling of mined-outstopes.
4.3 Operational Practices
The operational practices for mine backfill wells vary depending on how the backfill material isplaced in the mine and the relationship between mining and backfilling activities. In general, operationalpractices do not appear to make mine backfill wells particularly vulnerable to accidental contamination ofthe injectate or to misuse, although monitoring of the injectate and ground water help minimize the potentialfor misuse. In addition, backfill injection often occurs into zones already affected by prior activities (e.g.,AMD formation following mining), sometimes with the primary objective of reducing existing contaminationproblems.
4.3.1 Placement Methods
Injection of backfill into underground mines may be accomplished using hand, gravity, mechanical,pneumatic, and hydraulic placement methods. The most popular methods are pneumatic and hydraulic(Underground Injection Council Research Foundation, 1988). Hand and mechanical methods, such as beltor sling packing machines, are restricted to construction of selected supports from within a mine.
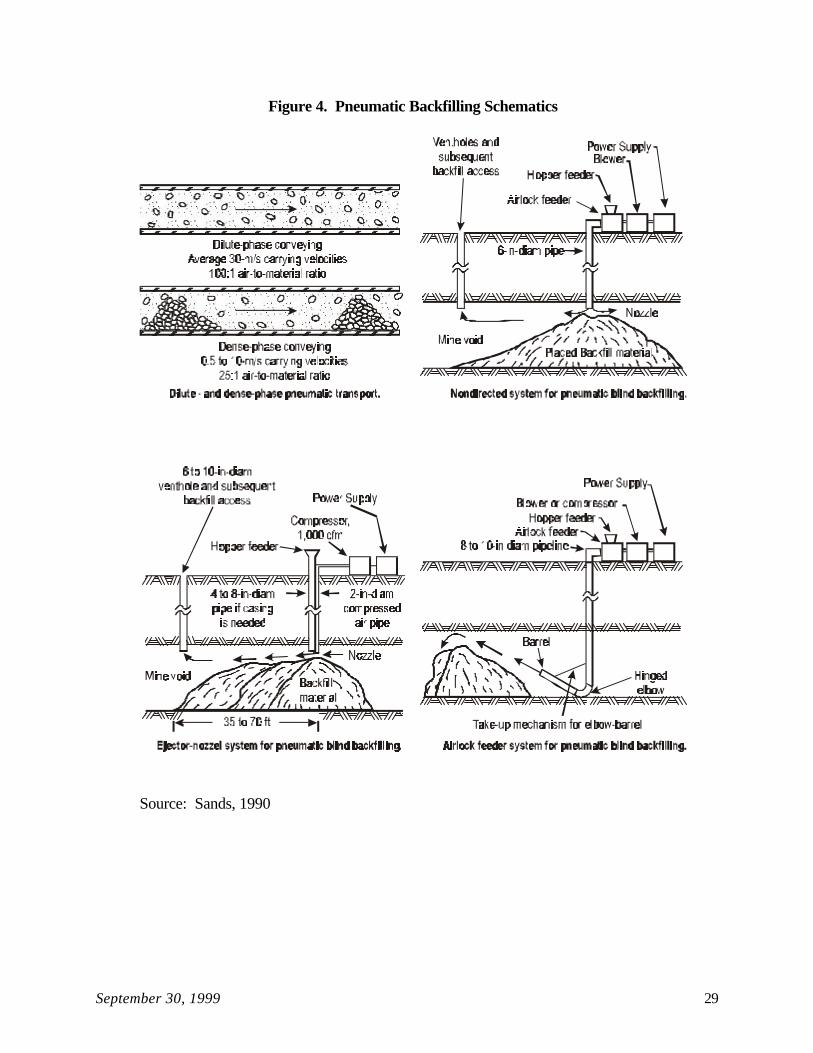
Pneumatic Backfilling
In pneumatic backfilling operations, backfill material is transported into a mine through a well orpipeline in a stream of continually flowing air, either in a vacuum or under pressure (see Figure 4). When a“dense phase” approach is used, the pipeline is nearly filled with material that is moved as a fluid with lowvelocity air pressure in slugs. When the more common “dilute phase” approach is used, an air/backfillmixture typically consisting of less than 5 percent fill material is moved through a pipeline at relatively highvelocity as a fluid. Both approaches tend to be used where water is scarce, the mine is dry, or where waterwould interfere with mining or the backfill process (Walker, 1993; Sand, 1990).
Hydraulic backfilling
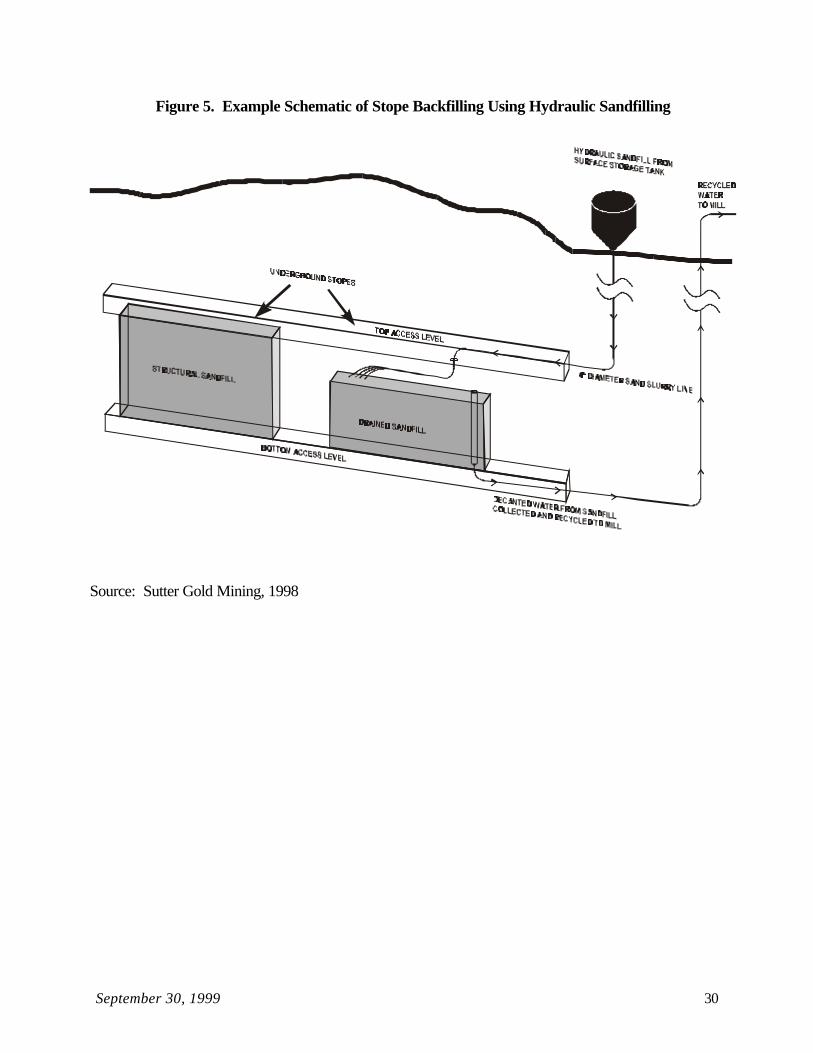
Hydraulic backfilling, which is more common than pneumatic backfilling, is the practice of fillingmine voids with backfill material by washing or pumping the backfill material as a slurry through a well orpipeline into the mine (see Figure 5). Hydraulic backfilling is normally accomplished by one of threemethods: controlled flushing, blind flushing, and pumped slurry injection.
September 30, 1999 27
Fig
ure
2. E
xam
ple
of D
eep
Min
e B
ackf
ill I
njec
tion
Wel
l Con
stru
ctio
n
Sour
ce:
Tg S
oda
Ash
, 199
7
September 30, 1999 28
Source: Rouse, 1979
Figure 3. Example of Sandfill Injection Using a Mine Shaft Pipeline
September 30, 1999 29
Source: Sands, 1990
Figure 4. Pneumatic Backfilling Schematics
September 30, 1999 30
Source: Sutter Gold Mining, 1998
Figure 5. Example Schematic of Stope Backfilling Using Hydraulic Sandfilling
September 30, 1999 31
Controlled flushing is used in mines where workers can safely enter and gain access to key areasduring the filling operations. When this approach is used, bulkheads may be built in mine passages aroundthe perimeter of the area to be filled. One or more wells are constructed and cased from the surface to theupper portion of the mine workings to be filled. At the base of the vertical portion of the well, additionalpiping may be used to aid in distributing the slurry into the mine workings. Horizontal dispersal from thepoint of discharge ranges from 300 to 1,000 or more feet, depending on the vertical distance from theground surface to the mine opening and the solids concentration of the slurry. Because controlled flushingprovides relatively uniform distribution of backfill material, it generally provides better structural supportthan the other methods and so is preferred where conditions permit (Whaite, 1975).
Blind flushing is used when the mine workings are inaccessible to workers. With this approach, aslurry of backfill material is gravity fed through a well (either a drilled well or a mine shaft) into the mine untilthe well will not accept any additional backfill material. The quantity that can be injected down a single welldepends on the conditions underground, such as the slope, height, and the proximity of pillars in the mineworkings. Usually, hundreds of injection points are required (Whaite, 1975).
Pumped slurry injection is similar to blind flushing except that the slurry is pumped down a wellrather than injected by gravity. With this approach, increased distribution of the fill material within the minecan be achieved due to the increased velocity at which the slurry is injected. As shown in Figure 6, solidparticles settle out near the borehole when the slurry is first delivered and the velocity of the injected slurrydrops as it enters the mine workings. As more material is injected, the fluid velocity increases in the mineworkings and the solid materials are transported farther from the borehole (Whaite, 1975).
4.3.2 Integrated Mining and Backfilling
At some mines, backfill activities are closely integrated with mining activities. For example, in thecase of base metal and uranium mining, a common operational practice is to develop a mine using a cut-and-fill method, illustrated in Figure 3. This method involves the following steps:
C a cross cut is driven from the main access shaft to the ore vein;
C a raise, later to be used as an ore pass for delivering the broken ore to the haulage level, is drivenupwards to intersect the vein;
C the raise is used as a platform to excavate a “slice” of ore to create a stope or excavated roomabove the level of the raise;
C after each horizontal “slice” is cleaned of ore, the orepass is extended upward; and

September 30, 1999 32
Source: Whaite, 1975
Figure 6: Schematic Depiction of Pumped Slurry Backfill Injection
C the void is slurry backfilled and capped with cement which provides a floor from which the next“slice” of ore, and process is repeated (Underground Injection Practices Council ResearchFoundation, 1988).
Alternatively, an “underhand” cut-and-fill method involving a “top down” rather than “bottom up” sequenceof cut and fill, such that the ceiling rather than the floor of the stope is comprised of cemented backfill, isused. An example is the Bulldog Mountain Mine in the Creede Mining District of Colorado. In both“bottom up” and “underhand” operations, backfill material is normally delivered through a pipeline down themine shaft to the stope being filled.
September 30, 1999 33
4.3.3 Retroactive Backfilling
When backfilling is performed after mining is complete or largely complete, blind gravity or pumpedslurry injection are common approaches. As discussed above in Section 4.2, such applications mayinvolved hundreds of injection wells, each of which may be operated for only a few days, in an effort to getthorough distribution of the fill material within the mine workings.
4.3.4 Well Maintenance and Closure
As mentioned, most backfill wells are used for short periods of time (e.g., days or weeks) and,thus, little maintenance is required. When a backfill injection well is used on an on-going basis, periodicintegrity testing may be performed, as discussed in more detail in Section 6. When injection is through apipeline down a mine shaft, as would be typical at a site where backfilling is an integral part of miningactivity, maintenance would normally be a part of mine operations and would include inspection and repairor replacement of piping as needed.
Available information provides few descriptions of well closure and abandonment practices. Where wells are used to backfill slurries that are similar in may respects to grouts (i.e., self-cementing), itappears that the injection borehole is simply grouted to the surface. In some cases, cementing of theborehole may occur either near the surface or from the injection zone to the surface.
5. POTENTIAL AND DOCUMENTED DAMAGE TO USDWs
5.1 Injectate Constituent Properties
The primary constituent properties of concern when assessing the potential for Class V mining,sand, or other backfill wells to adversely affect USDWs are toxicity, persistence, and mobility. The toxicityof a constituent is the potential of that contaminant to cause adverse health effects if consumed by humans. Appendix D to the Class V UIC Study provides information on the health effects associated withcontaminants found above MCLs or HALs in the injectate of mining, sand, or other backfill wells and otherClass V wells. Based on the information presented in Section 4, the following constituents that were foundto routinely or frequently exceed health-based standards in TCLP or other leachate from one or more typesof backfill material: antimony, arsenic, barium, beryllium, boron, cadmium, chromium, lead, mercury,molybdenum, nickel, selenium, thallium, and zinc. Aluminum, copper, iron, manganese, TDS, sulfate, andpH have been measured above secondary MCLs in TCLP or other leachate and are also discussed,although these standards are designed to minimize aesthetic (taste) effects not adverse health effects (health-based standards do not exist for these parameters).
Persistence is the ability of a chemical to remain unchanged in composition, chemical state, andphysical state over time. Appendix E to the Class V UIC Study presents published half-lives of commonconstituents in fluids released in mining, sand, or other backfill wells and other Class V wells. All of thevalues reported in Appendix E are for ground water. Caution is advised in interpreting these valuesbecause ambient conditions have a significant impact on the persistence of both inorganic and organic
September 30, 1999 34
compounds. Appendix E also provides a discussion of mobility of certain constituents found in the injectateof mining, sand, or other backfill wells and other Class V wells.
The persistence of constituents that leach from mine backfill following injection will depend oncomplex solution-mineral equilibria that will be determined by site-specific conditions such as leachate andground water characteristics, host rock characteristics, and oxygen availability in the mine workings and thesurrounding formation. Because the point of injection for most backfill wells is typically within a permeableunit, or into a zone where prior mining activity has created a preferential (as compared to adjacentundisturbed formations) flow pathway, physical conditions are relative conducive to mobility. It should benoted, however, that in some situations backfilling occurs under dry conditions, while in others the primaryobjective of backfilling is to reduce the mobility of metals and other constituents in mine water by alteringthe physical and chemical conditions in the mine.
For injected backfill, mobility of metals in the mine environment is primarily dependent on theirtendency to dissolve rather than remain in a solid form, which generally increases as pH decreases for mostmetals. For iron, for example, the solubility decreases abruptly when pH increases above 6.5 due to theoxidation of ferrous iron (Fe+2) to the much less soluble ferric iron (Fe+3), which readily precipitates as ironoxide or iron hydroxide. This oxidation to ferric iron can also occur, with the resulting marked decrease insolubility, under acidic conditions created by oxidation and hydrolysis reactions that occur when mine waterfrom a strongly reducing environment is exposed to an oxygen supply. In either case, the resulting decreasein dissolved iron concentrations also reduces the concentrations of many other metals, notably arsenic andselenium, that co-precipitate with iron and/or adsorb onto the iron oxides and hydroxides. Mine water isfrequently acidic due to the oxidation of sulfide minerals, with the result that the mobility of most metals isgenerally relatively high absent measures that limit oxygen availability, such as backfill injection (Levens,1996; EPRI, 1998; Freeze and Cherry, 1979; Robl, 1999).
Unlike most metals, the solubility of chromium in the +6 form is not especially dependent on pH. Chromium in the +3 form is much more common in coal mines, however, and shows decreasing solubilitywith increasing pH.
Some other constituents present in injected backfill and backfill leachate, such as boron and sulfate,do not have solubilities controlled by pH. Most sulfate is likely to remain in solution although someprecipitation of sulfate may occur when enough calcium or magnesium is present. In addition, adsorptionmay occur at very low pH values. Similarly, boron is also likely to be present in backfill leachate (EPRI,1998).
As discussed in more detail below in Section 5.2, injection of backfill material often occurs at siteswhere low pH water is present or in contact with the backfill injection zone. At these sites, mobility of mostmetals present in the backfill will be greater than if injection occurred under neutral or alkaline pHconditions. Nevertheless, backfill injection under these conditions can result in a decrease in total (injectateplus in-situ sources) metal mobility in the mine for several reasons. First, some backfills can reduce waterflow rates through the mine. Second, backfill can reduce the oxidation of sulfides by reducing or eliminating

6 Because the diffusion of oxygen in water is about four orders of magnitude less than in air, floodingof a mine to eliminate direct air contact with pyrite or other sulfide minerals greatly reduces acidgeneration and, thus, metal solubility and mobility (Sutter Gold Mining Company, 1998).
7 Where ground water contamination has been identified at mining sites, it has not been clearlyattributable to backfilling.
8 It should be noted, however, that backfill of tailings occurs in other contexts as well. For example,at Solvay Soda Ash Joint Venture in Green River, Wyoming, tailings are injected along with processingplant wastewater and fly ash from coal fired boilers. The injected tailings consist of shale breaks fromwithin the ore itself, calcium carbonate from the caustic soda plant, and low grade oil shale (Wyoming,1996). The available data do not include specific studies related to ground water impacts from this orother similarly “unique” situations and, thus, they are not discussed in this section.
9 Total water production from 4,450 feet of mine workings ranges from 5 gallons per minute (gpm) insummer to 20 gpm in winter, with most of this water entering the mine from the surface throughventilation boreholes.
September 30, 1999 35
direct contact with air through sealing or flooding of the mine voids.6 Third, some backfill materials that arealkaline in nature, such as coal ash and FGD sludge, can at least temporarily increase the pH of acidic minewater present in the injection zone (Levens, 1996; Whitlatch, 1998; Kim, 1998).
5.2 Observed Impacts
None of the 23 states included in Table 1 indicated documented cases in which mine backfill wellshave caused contamination of a USDW.7 Studies have been conducted, however, by government,industry, and universities that examine the effects of backfill injection on ground water quality, in partbecause coal beds in some areas supply water to domestic wells (University of Kentucky, 1998).
This section summarizes studies of the effects of backfill injection on ground water quality. It isorganized in two parts. The first part discusses backfill in metal mines and the second discusses backfill incoal mines.8
5.2.1 Metal Mines
The potential or observed impacts of underground mine backfilling on ground water quality havebeen evaluated in several studies of metal mines. For the Lincoln Mine Project, a gold mine in California,the leachability of backfill material was measured and evaluated in the context of the conditions that occurnaturally at the mine. Ground water at the site is limited, occurring in the weathered bedrock (generally notdeeper than 20 to 30 feet) and limited bedrock fractures.9 Because the gold deposit contains arsenopyrite(FeAsS) (0.2 to 0.65 percent by weight of the ore), the focus of ground water quality investigations hasbeen on arsenic. Analysis of samples from bedrock ground water monitoring wells over a four year periodshows naturally occurring arsenic concentrations that range from 0.0014 to 0.185 mg/l, with well-specificaverages ranging from 0.008 to 0.063 mg/l for the six wells examined (Sutter Gold Mining Company,1998). Maximum concentrations in three wells and the average concentration in one well exceed the MCL

September 30, 1999 36
of 0.05 mg/l. The minimum concentration in five of the six wells exceeds the HAL of 0.002 mg/l. Inaddition, assessment of the acid formation potential of the backfill material indicates that it was quite low,with an acid neutralization/acid generation potential ratio of 98:1, due to the presence of carbonate mineralsthat yield a mine water pH of 8.3+. Deionized water leaching of the backfill (sandfill) material showed anarsenic concentration of 0.13 mg/l compared to a reported average concentration of 0.2 mg/l for groundwater in the ore zone (Sutter Gold Mining Company, 1998). Thus, it appears that the potential for releaseof arsenic from backfill material to degrade ground water is low. In addition, suitability of ground water foruse as drinking water is low due to limited availability and naturally occurring arsenic.
The U.S. Bureau of Mines (USBM) also examined the impact of mine backfill material on groundwater quality. At a moderately deep underground lead-zinc mine located in the Coeur d’Alene MiningDistrict of northern Idaho, samples of ground water both before and after contact with a sandfilled stopeshowed an increase in electrical conductance. Increased concentrations of Ca, Mg, SO4
-2, and HCO3-
account for most of the increase. Sulfate levels increased from levels slightly below the MCL of 500 mg/lto levels that ranged from 797 to 1,171 mg/l. Changes in other metal concentrations were generally mixed,with relatively small increases observed for some sampling events and decreases observed for others. Zincwas an exception, showing consistently higher levels after contact with the sandfill (at levels consistently lessthan the non-cancer lifetime HAL of 2 mg/l). Lead and arsenic levels were present at levels above theMCL before and after contact with the sandfill. For all of the metals, the levels observed both before andafter contact with backfill material were well below the maximum leachability values measured in thelaboratory, as shown above in Tables 2 and 3 (Levens, 1993).
In a related investigation, USBM also examines the effect of cemented sandfill on ground water byanalyzing samples collected both before and after contact with the backfill. In this investigation, samplesfrom exploratory boreholes represent water quality within the native rock, whereas samples from a sumpand seeps that contact the backfill within the mine represent water quality affected by backfilling. Comparison with the uncemented backfill examined above showed a much greater acid neutralizationcapacity. This is consistent with the higher pH values observed after contact with the cemented backfill(6.5 to 9.3) as compared to the pH measured in the native rock boreholes (6.29 to 7.98).
Concentrations of Ca, K, Mg, and SO4-2 are also higher after backfill contact, with SO4
-2
concentrations increasing to levels that in most cases exceeded the primary MCL. Concentrations of zincand lead also increased. Zinc levels remained well below the non-cancer lifetime HAL of 2 mg/l. Leadlevels, in contrast, were typically several times the MCL action level of 0.015 mg/l before contact with thebackfill. After backfill contact, levels were sometimes increased and sometimes decreased, but generallywere above the MCL. Secondary MCLs were also exceeded both before and after contact with backfillfor Iron and Mn. Iron concentrations were generally lower after backfill contact while Mn concentrationsshowed both increases and decreases following backfill contact (Levens, 1996).
Notable increases in the concentrations of Ca, K, and SO4-2 were also observed in the laboratory
for three cemented backfill samples after washing with deionized water (see Table 3). Further laboratoryexposure (for 227 days) to a sulfuric acid wash showed additional increases in Ca, SO4
-2, and metalconcentrations. Concentrations of most constituents measured in the laboratory were notably higher than

10 Mine water pH at the mines examined was 7 or greater, so the results indicated by these sites maynot apply to mines with acidic water (Smith, 1987).
September 30, 1999 37
those measured in the field following contact with backfill. Notable exceptions are Ba, K, and Na, whichshowed lower concentrations in the laboratory than were observed in the field. Cadmium, lead, and SO4
-2
concentrations exceeded primary MCLs while concentrations of iron, manganese, silver, and zinc exceededsecondary MCLs in the laboratory leaching tests (Levens, 1996).
Observed differences in leachate concentrations appear to be due to differences in the particle-sizedistribution of the backfill (tailings) material, with generally lower concentrations for backfill containing awide size distribution. In addition, the presence of sulfide minerals and Ca and Mg carbonates in thebackfill appeared to be important in determining the acid neutralizing capacity of the cemented material and,thus, the release of some metals. The data also indicate that backfill cementing may help reduce metalrelease and that ground water, to which releases occur, may contain metals at concentrations above MCLs(Levens, 1996).
At the Homestake mine in South Dakota, samples were collected from drainage from the sandbackfill that was placed in stopes. Results indicate that the pH fluctuates around 8.0. As shown in Table 9,concentrations of arsenic, iron, and nickel in exceed MCLs or HALs in some samples of drainage from abackfilled stope. Arsenic and iron concentrations also exceed MCLs in mine water collected at a variety oflocations in the mine (Scheetz, 1999).
Backfill injection has also been widely used in uranium mines. Field sampling of tailings and backfill,and studies of water discharging from where backfill was used suggest that short- and long-term effects onground water quality are negligible both during and following completion of mining (Levens, 1996).
5.2.2 Coal Mines
A study conducted in 1987 assessed the injection of coal slurry wastes from coal preparation andsludge from treatment of AMD into underground coal mines in West Virginia. The study examined waterquality using samples from 9 mines that had received injection of slurry or AMD treatment sludge. Slurryinjection (at 6 mines) was found to improve the already degraded water quality by increasing alkalinity andpH10, and decreasing concentration of iron and manganese. Sulfate concentrations also increased,however. Only minor changes in trace

September 30, 1999 38
Table 9. Backfill Drainage At Homestake Mine, South Dakota
Constituent Units
Drinking WaterStandards
Health AdvisoryLevels (1)
(2)(3)
(4)a b c d a b c
Aluminum mg/l 0.05-0.2 S -- -- 0.229 0.346 0.649 0.309 -- -- -- --Arsenic mg/l 0.05 P 0.002 C 0.063 0.032 0.019 0.028 0.056 <0.005 0.001 0.001 0.003Cadmium mg/l 0.005 P 0.005 N <0.001 -- -- -- -- <0.001 0.001 0.001 0.001Chromium mg/l 0.1 P 0.1 N <0.001 -- -- -- -- -- <0.001 NF <0.001Copper mg/l 1.3 P -- 0.006 0.037 0.015 0.018 0.020 <0.005 0.01 0.092 0.035Gold mg/l -- -- <0.001 <0.001 <0.001 <0.001 <0.001 <0.001 <0.001 0.001 0.002Iron mg/l 0.3 S -- 0.59 -- -- -- -- 0.348 0.06 0.08 0.43Lead mg/l 0.015 P -- <0.001 -- -- -- -- <0.001 0.005 NF 0.01Mercury mg/l 0.002 P 0.002 N -- -- -- -- -- <0.0002 0.0 0.0 0.0Nickel mg/l 0.1 P 0.1 N 0.148 0.010 0.005 0.005 0.005 0.008 NF NF NFSelenium mg/l 0.05 P -- -- <0.005 <0.005 <0.005 <0.005 <0.005 -- -- --Zinc mg/l 5 S 2 N 0.016 0.054 0.056 0.061 0.055 <0.050 NF NF 0.016
CN Total mg/l -- -- 13.71 -- -- -- -- -- -- -- --
CN WAD mg/l -- -- 0.40 -- -- -- -- -- -- -- --
NF = not found (not detected)(1) Water issuing from sand backfill on the 7,100 foot level of the mine(2) Water from selected underground sumps (labeled a-d) in the mine(3) A combination of surface water and ground water from the upper underground levels of the mine(4) Three samples (labeled a-c) of mine water (stope drainage) prior to treatmentSource: Scheetz, 1999
element concentrations were apparent following injection, and these changes do not appear to be threats todrinking water (Smith, 1987).
Sludge injection (at 3 mines) appeared to increase alkalinity, pH, sulfate, and total suspended solids(TSS). However, pH and alkalinity decreased when injected sludge had a much lower pH than the nativemine water. Sludge injection into mines with high (> 7) pH water resulted in lower iron and manganeseconcentrations, except where the concentration of these elements were very low (<0.1 mg/l) prior toinjection. Injection into mines with low pH resulted in a great increase of iron concentrations, presumablyas a result of dissolution from the sludge. Most changes in trace element concentrations were negligible,with the possible exception of arsenic, which showed a large apparent increase at one mine. However,concern about potential analytical error complicate assessment of this result (Smith, 1987).
A recent study also examined the impact of injection of a grouting material composed of fly ash,FBC, and FGD sludge into an abandoned underground mine near Friendsville, Maryland. At this site,ground water (AMD) seeping from the mine was a known cause of surface water quality degradation, andinjection was initiated with the intention of improving both ground and surface water quality. Seepage waterquality measured before injection indicated Fe and Mn concentrations above secondary MCLs, SO4
-2
concentrations generally above the primary MCLs, and Zn concentrations sometimes above the HAL.

11 About 5,600 cubic yards of fly ash, FBC ash, and FGD sludge were injected as a slurry via 38boreholes in October and November 1996.
12 Water to make the slurry was pumped from the main mine pool, which temporarily lowered thelevel by about 2 feet.
13 Ground water is being monitored in the overlying Freeport Sandstone, the Middle Kitanning No. 6coal seam, and the underlying Clarion Sandstone. Two perched aquifers exist: one in the FreeportSandstone, caused by the underlying claystone and siltstone which immediately overlies the No. 6 coal;
(continued...)
September 30, 1999 39
0
50
100
150
200
250
300
350
400
CA
LC
IUM
, m
g/L
0
500
1000
1500
2000
2500
SU
LF
AT
E,
mg
/L
Calcium
Sulfate
0
5
10
15
20
25
30
35
1/6/95 7/25/95 2/10/96 8/28/96 3/16/97 10/2/97 4/20/98
CA
LC
IUM
LO
AD
, kg
/day
020406080100120140160180
SU
LF
AT
E L
OA
D,
kg/d
ay
Grout Injection Period
Figure 7. Calcium and Sulfate Concentrationsand Loads at an Abandoned Maryland Coal
Mine (from Aljoe, 1999)
Immediately after injection11, acidity of the AMDincreased markedly along with dissolved iron andaluminum concentrations, and then decreased to pre-injection levels by the following summer. Ca andSO4
-2 concentrations also increased in the AMDfollowing injection and remain high (as of April 1998),apparently due to dissolution of these materials fromthe injected grout (see Figure 7) (Aljoe, 1999).
The initial increase in acidity of the AMDfollowing grouting most likely resulted from changes inmine pool hydrology, including a drop in mine poolelevation that occurred when water was pumped fromthe mine to prepare the grout.12 This drop inelevation would have exposed an estimated 10,500cubic feet of highly-fractured, previously-submergedmaterial within the mine to atmospheric oxygen. Another change could have been re-routing of flowthrough new areas of the mine workings, therebymobilizing acidic products that had previously beenstored in stagnant zones within the mine. Theintention of the backfilling effort had been to entirely fill the mine voids with grout, thereby isolating thepyritic surfaces from air and water and reducing the AMD production rate. This did not occur, however,because limited information available on the size of the mine workings led to an underestimate of thequantity of grout needed (Aljoe, 1999).
In a similar project initiated in 1997, grout comprised of a 1.25:1.00 (by dry weight) mixture of flyash and FGD filter cake with 5 percent added lime was injected through 318 drilled grout holes into anabandoned underground coal mine near Conesville, OH. The objective of the injection project was toinject grout that would seal old mine entries and coat the floor and walls of the abandoned mine chambers,thereby reducing the amount of oxygen available and slowing the process of acid formation. Becausegrouting was only completed in early 1998, it is too early to determine the net effect on water quality, whichwill be monitored for three additional years.13 For all surface and ground water monitoring locations

13 (...continued)and one in the No. 6 coal caused by claystone, siltstone and limestone layers between it and theunderlying Clarion Sandstone. The lowest and most extensive aquifer is in the Clarion Sandstone andintersects major hydrologic boundaries, such as Wills Creek.
September 30, 1999 40
(through September 1998), no measurable increase in arsenic, chromium, boron, or pH levels have beenobserved since grout injection (Whitlatch, 1998).
Laboratory studies of the reaction between the grout and AMD showed a significant increase insolution pH to approximately 8 and in the concentration of a number of ions, including arsenic and boron. Only 1.32 percent of the arsenic present in the grout was released over the 168-day reaction time and theresulting arsenic levels were below the primary MCL. Because further solubilization could result in higherconcentrations, both arsenic and boron will receive particular attention in the on-going monitoring program(Whitlatch, 1998).
The reason for the apparent difference in the reaction between the grout and AMD in thelaboratory and the field is not yet clear, but it appears that conditions within the mine are unfavorable for thedevelopment of acid neutralization reactions. This may be due to the fact that longer contact times arerequired than are achieved in the mine. It should be noted, however, that the project is designed to achieveAMD reduction through successful sealing of the mine and does not rely on acid neutralization by the grout.Observations to date show that the water level has risen in the mine, indicating that the grout was ofsufficient strength to provide effective seals. In-situ core samples taken after about nine months indicatethat the grout is highly impermeable and has weathered very little (Whitlatch, 1998).
At sites in Greene and Clinton counties in Pennsylvania and Upshur county in West Virginia,injection of mixtures of fly ash, FBC ash, lime, AMD treatment sludge, and/or cement with water has beenused in attempt to reduce AMD from reclaimed surface mined areas as well. At these sites, grout wasinjected at relatively shallow (< 30 feet) depths in an attempt to fill voids in the spoil material, therebyreducing contact between the buried pyrite and air and water (Kim, 1998).
At the Greene county site, the pH in wells in the injection area increased by 0.5 pH units and thepH of the seep (discharge from the spoil area) increased slightly from 3.2 to 3.3 following grouting. Acidity was unchanged in the injection area but decreased in the seep. In the injection area and the seep,little difference in trace metal concentrations was observed before and after grouting (Kim, 1998).
At the Clinton county site, pH increased and acidity decreased in samples from the injection areaand discharges. The pH remained less than 3, however. Average trace metal data from about two yearsafter injection indicate higher concentrations of As, Co, Cu, Ni, and Zn in the injection area, butconcentrations in the discharge were closer to the discharge levels from areas without injection (Kim,1998).
At the Upshur county site, the average pH of the water in the injection area decreased initially afterinjection, but had increased when the water was sampled five years later. This increase, however, could

14 Recent experimental work indicates injection of alkaline FBC ash in dilute slurry form may bemore effective in reducing AMD than ash injected in the form of low-permeability grout. In somesituations, the benefits from increased neutralization may outweigh the potential increase in the release oftrace metals from the ash (Canty, 1999).
September 30, 1999 41
be due to the similar increases observed in the inflows and the ungrouted area. Acidity decreased in theinjection area, the inflows, and outflows immediately following injection. Five years after injection, acidityhad decreased further in the injection area and increased in the discharger, although it remained below thepre-injection level. Also, concentrations of Ba, Be, Cd, Co, Cr, Cu, Ni, Pb, Sb, and Zn were generallyhigher in the injection area and discharge than the inflow or control areas, but were still less than primaryand secondary MCLs (Kim, 1998).
6. ALTERNATIVE AND BEST MANAGEMENT PRACTICES
A number of best management practices (BMPs) can be implemented to provide increased benefitsand protection of USDWs with mine backfill wells. As discussed above, the effect of mine backfilloperations on ground water quality depends to a large extent on the characterisitics of the backfill and themine, and the interaction between the two. Thus, selecting the appropriate backfill materials for a mine andselecting appropriate BMPs require characterization of the the backfill materials, including the potential tocause AMD, and an understanding of where the backfill will be placed (especially with respect to the watertable) and how the backfill is expected to react over time in this environment.
BMPs are discussed below in relation to injectate characteristics, design and construction,operation, and closure. The discussion is neither exhaustive nor represents an USEPA preference for thestated BMPs. Each state, USEPA Region, and federal agency may require certain BMPs to be installedand maintained based on that organization’s priorities and site-specific considerations.
6.1 Injectate Characteristics
Some injected backfill materials have cement-like properties that cause them to harden followinginjection. Although the importance of the cementing properties of the injected backfill will vary with siteconditions and the objectives, cement-like characteristics are generally, but not always, desirable.14 Cementing properties are intrinsic to some backfilled materials and can be created in all materials commonlyused for backfilling through the use of appropriate mixtures and additives. Cementing properties provideboth increased structural support (where backfill is provided to control subsidence) and reducedpermeability. Reduced permeability generally serves to reduce dissolution of constituents from the injectedmaterial. In addition, flow rates through the backfilled zone are reduced, thereby reducing the availability ofoxygen and the release of constituents from the mine surfaces as well as the backfill material.
6.2 System Design and Construction
As discussed above, backfill injection is sometimes used with the intention of preventing or abatingAMD. Although injection is intended to increase pH and reduce acidity, the acidic conditions present in

15 An expandable plug used in a well’s casing to isolate producing zones; also to isolate a section ofthe borehole to be filled with cement when a well is plugged.
16 An instrument for measuring the inside diameter of a well.
September 30, 1999 42
these applications will lead to the dissolution of some constituents from the injected backfill. Thisdissolution can be reduced, however, by ensuring that the mine voids are filled as completely as possiblewith the injected material, thereby reducing the availability of oxygen and the potential for additional acidformation. To achieve this objective requires adequate distribution of the backfill within the mine workings,which in turn requires appropriate quantities of injection material, appropriate well spacings, and injectionpressures that will distribute the material and effectively fill the mine voids. In addition, bonding agentsand/or materials to reduce the porosity of the injected backfill can help to reduce the residual void spaceremaining after backfill injection. These considerations warrant special attention when injection occurs ininactive mines where access and knowledge of the size and geometry of the mine workings are limited.
BMPs for well construction may vary significantly with site conditions and the type of backfillinjected. Backfill injection often occurs in abandoned mines or other settings where injection is performedin an effort to improve existing poor ground water quality. In these situations, injection through uncasedboreholes may be appropriate if the wells are relatively shallow, the strata have sufficient integrity, theinjectate is grout-like in nature, and injection only occurs for a short period, such as a few days. At otherinjection sites, however, casing is clearly needed to ensure that the injected material reaches the intendedformation. This is particularly true when the injection well is relatively deep, operates on an on-going basis,passes through a USDW, and/or injects a low solids content fluid. In some cases, the site setting or thenature of the injected material may make the use of tubing appropriate.
6.3 Well Operation
For backfill wells that operate on an on-going basis, which most often occurs in association withbackfilling that is integrated with mining operations, BMPs include mechanical integrity tests (MIT) beforethe well is put into service and periodically during use. A variety of MITs may be run on backfill wells tocheck casing integrity. For example, pressure tests may be run prior to initial well operation andsubsequently at periodic intervals, generally ranging from one to five years. Because mine backfill injectionis normally done without a tubing string, pressure testing requires that a temporary, retrievable bridge plug15
be set near the bottom of the casing. This retrievable plug approach is used at least at one site in Wyoming. The appropriate pressure for a pressure test depends on anticipated well operating conditions. At theWyoming facility, testing at a pressure 10 percent greater than the maximum pressure reached during theprevious year (or maximum of 200 psi) is required (State of Wyoming 1988, 1996).
Due to the relatively high solids content of injected backfill as compared to other types of injectedfluids, abrasion can threaten casing integrity. Thus, caliper logs16 may be run periodically on the entirelength of the surface. A casing log run prior to well use provides a baseline against which subsequent logscan be compared. In Wyoming, casing logs are repeated at nine month intervals unless the results show

September 30, 1999 43
more than 20 percent reduction in the wall thickness of the casing, in which case the log is repeated everysix months (Wyoming 1988, 1996).
Other examples of MIT used in backfilling operations include Multifrequency ElectromagneticThickness (MET) logs and cement bond logs. MET has been used by Tg Soda Ash, Inc. during theoperation of an underground tailings disposal and mine backfilling system to evaluate corrosion and metalloss (Tg Soda Ash, 1997). Cement bond logs (and caliper logs) have been used in the Big Island TronaMine to evaluate the integrity of cement to pipe and cement to formation bonding (Wickersham, 1995).
6.4 Well Closure
Appropriate well abandonment is important to ensure that the well does not provide a pathwaythrough which contamination of USDWs could occur. As with well construction and operation,appropriate closure practices depend onsite conditions. In some situations, abandonment may be as simpleas allowing the injected material to fill the well bore after the mine stops accepting additional injectedmaterial. This approach is most likely to be appropriate for shallow wells used for short periods to injectself-cementing grouting materials into closed or abandoned mines.
In other situations, protection of USDWs may require plugging and abandonment using more“conventional” cementing techniques. For example, in Wyoming abandonment includes setting a cast ironbridge plug approximately 50 feet above the bottom of the casing. Cement is placed in the casing bypumping through a tubing string in stages as the tubing is withdrawn. This is performed until the entirecasing is cemented to the surface. At the surface, the casing is cut off 5 feet below the ground surface andthe land surface reclaimed in accordance with mine abandonment permits (Wyoming 1988, 1996).
In another example, all injection wells, water withdrawal wells, and monitoring boreholes at theKindall 3 Mine in Indiana were required to be plugged and sealed with cement from the bottom to thesurface. Figure 8 provides example cross sections showing borehole plugging methods. In this example, acement basket is used instead of a bridge plug to establish the location in the casing at which cementingbegins.

September 30, 1999 44
Source: Endress, 1996
Figure 8. Cross Sections of Typical Borehole Plugging Methods
September 30, 1999 45
7. CURRENT REGULATORY REQUIREMENTS
As discussed below, several federal, state, and local programs exist that either directly manage orregulate Class V mining, sand, and other backfill wells. On the federal level, management and regulation ofthese wells falls primarily under the UIC program authorized by the Safe Drinking Water Act (SDWA). Some states and localities have used these authorities, as well as their own authorities, to extend thecontrols in their areas to address concerns associated with mining, sand, and other backfill wells.
7.1 Federal Programs
7.1.1 SDWA
Class V wells are regulated under the authority of Part C of SDWA. Congress enacted theSDWA to ensure protection of the quality of drinking water in the United States, and Part C specificallymandates the regulation of underground injection of fluids through wells. USEPA has promulgated a seriesof UIC regulations under this authority. USEPA directly implements these regulations for Class V wells in19 states or territories (Alaska, American Samoa, Arizona, California, Colorado, Hawaii, Indiana, Iowa,Kentucky, Michigan, Minnesota, Montana, New York, Pennsylvania, South Dakota, Tennessee, Virginia,Virgin Islands, and Washington, DC). USEPA also directly implements all Class V UIC programs onTribal lands. In all other states, which are called Primacy States, state agencies implement the Class V UICprogram, with primary enforcement responsibility.
Mining, sand, and other backfill wells currently are not subject to any specific regulations tailoredjust for them, but rather are subject to the UIC regulations that exist for all Class V wells. Under 40 CFR144.12(a), owners or operators of all injection wells, including mining, sand, and other backfill wells, areprohibited from engaging in any injection activity that allows the movement of fluids containing anycontaminant into USDWs, “if the presence of that contaminant may cause a violation of any primarydrinking water regulation . . . or may otherwise adversely affect the health of persons.”
Owners or operators of Class V wells are required to submit basic inventory information under 40CFR 144.26. When the owner or operator submits inventory information and is operating the well suchthat a USDW is not endangered, the operation of the Class V well is authorized by rule. Moreover, undersection 144.27, USEPA may require owners or operators of any Class V well, in USEPA-administeredprograms, to submit additional information deemed necessary to protect USDWs. Owners or operatorswho fail to submit the information required under sections 144.26 and 144.27 are prohibited from usingtheir wells.
Sections 144.12(c) and (d) prescribe mandatory and discretionary actions to be taken by the UICProgram Director if a Class V well is not in compliance with section 144.12(a). Specifically, the Directormust choose between requiring the injector to apply for an individual permit, ordering such action as closureof the well to prevent endangerment, or taking an enforcement action. Because mining, sand, and otherbackfill wells (like other kinds of Class V wells) are authorized by rule, they do not have to obtain a permit
17 May 2003 is the deadline including an 18-month extension.
September 30, 1999 46
unless required to do so by the UIC Program Director under 40 CFR 144.25. Authorization by ruleterminates upon the effective date of a permit issued or upon proper closure of the well.
Separate from the UIC program, the SDWA Amendments of 1996 establish a requirement forsource water assessments. USEPA published guidance describing how the states should carry out a sourcewater assessment program within the state’s boundaries. The final guidance, entitled Source WaterAssessment and Programs Guidance (USEPA 816-R-97-009), was released in August 1997.
State staff must conduct source water assessments that are comprised of three steps. First, statestaff must delineate the boundaries of the assessment areas in the state from which one or more publicdrinking water systems receive supplies of drinking water. In delineating these areas, state staff must use“all reasonably available hydrogeologic information on the sources of the supply of drinking water in thestate and the water flow, recharge, and discharge and any other reliable information as the state deemsnecessary to adequately determine such areas.” Second, the state staff must identify contaminants ofconcern, and for those contaminants, they must inventory significant potential sources of contamination indelineated source water protection areas. Class V wells, including mining, sand, and other backfill wells,should be considered as part of this source inventory, if present in a given area. Third, the state staff must“determine the susceptibility of the public water systems in the delineated area to such contaminants.” Statestaff should complete all of these steps by May 2003 according to the final guidance.17
7.1.2 SMCRA
The Office of Surface Mining Reclamation and Enforcement (OSM) in the U. S. Department of theInterior oversees state mining regulatory and reclamation activities under the Surface Mining Control andReclamation Act (SMCRA), or directly implements mining programs in states that have not obtainedprimacy under SMCRA. The Office also directly regulates coal mining and reclamation activities onfederal and Indian lands. The Bureau of Land Management (BLM), also a part of the U. S. Department ofthe Interior, is responsible for the management of public lands, including minerals leasing and oversight forthe development of energy and mineral leasing and compliance with regulations governing the extraction ofmineral resources. It is also responsible for subsurface resource management where mineral rights, but notthe land surface, are federally owned.
Regulations promulgated by the Office of Surface Mining in Title 30 Chapter 7 apply to minebackfill wells if the well is located in a state that has not accepted primacy under SMCRA. In somePrimacy States, the federal requirements have also served as the model for the state regulations.
Part 784 of Chapter 7 addresses underground mining permit application requirements, and containsminimum requirements for the reclamation and operation plan that must be submitted as part of the permitapplication. Section 784.25 provides that each underground mining permit application must supply a plandescribing the design, operation, and maintenance of any proposed coal processing waste disposal facility,including flow diagrams and any other necessary drawings and maps, for the approval of the state

September 30, 1999 47
regulatory authority and the Mine Safety and Health Administration under 30 CFR 817.81(f), thepermanent program performance standards for underground disposal of coal mining waste. The sectionprovides further that:
C Each plan shall describe the sources and quality of waste to be stowed, area to be backfilled,percent of the mine void to be filled, method of constructing underground retaining walls, influenceof the backfilling operation on active underground mine operations, surface area to be supported bythe backfill and the anticipated occurrence of surface effects following backfilling;
C The applicant shall describe the source of the hydraulic transport mediums, method of dewateringthe backfill that is emplaced, retention of water underground, treatment of water if released tosurface streams, and the effect on the hydrology; and
C The plan shall describe each permanent monitoring well to be located in the backfilled area, thestratum underlying the mined coal, and gradient from the backfilled area except where pneumaticbackfilling operations are exempted from hydrologic monitoring (30 CFR 784.25).
Both §817.81(f), the permanent program requirements on underground disposal of coal mine wastedescribed above, and §817.71(j), the permanent program requirements on underground disposal of excessspoil, provide that coal mine waste or excess spoil may be disposed of in underground mine workings “onlyin accordance with a plan approved by the regulatory authority and MSHA under §784.25.”
SMCRA also authorizes the promulgation of regulations addressing the surface effects ofunderground coal mining operations. The statute provides in 30 U.S.C.A. §1266 that with respect tosurface disposal of mine wastes, tailings, coal processing wastes, and other wastes in areas other than themine workings or excavations, permitted mining operations are required to stabilize all waste piles andensure that the leachate from such piles will not fall below the water quality standards established underfederal or state law for surface or ground waters. The provision does not specify that leachate must resultfrom precipitation, and could be applied to leachate from injection into a surface rubble pile (which couldbe defined as a Class V well).
BLM regulations establish performance standards for coal mining and for solid minerals other thancoal under federal leases and licenses. The rules pertaining to underground coal mining specify thatbackfilling of exploratory drill holes, openings, and excavations must be in accordance with soundengineering practices and an approved plan (43 CFR 3484.2). Non-coal mineral mining also must beconducted according to an approved plan, which must address backfilling of drill holes (see e.g., 43 CFR3522.3-3(c)(3)). In addition, BLM rules provide that the operator/lessee must dispose of all wastesresulting from the mining, reduction, concentration, or separation of mineral substances in accordance withthe terms of the lease, approved mining plan, applicable federal, state, and local law and regulations and thedirections of the authorized officer (43 CFR 3596.2).

September 30, 1999 48
7.2 State and Local Programs
Ninety-eight percent of the documented mine backfill wells and 99 percent of estimated wells in theUnited States exist in 10 states: Idaho, Illinois, Indiana, Kansas, North Dakota, Ohio, Pennsylvania, Texas,West Virginia, and Wyoming. Attachment A of this volume describes how each of these states currentregulate mining, sand, and other backfill wells.
In Indiana and Pennsylvania, USEPA Regions 5 and 3, respectively, directly implement the UICClass V program. The USEPA Regions apply inventory requirements and use permit by rule to ensurenon-endangerment of USDWs. Indiana, in addition, has enacted state regulations that apply tounderground mining operations, including backfilling of mines, that are implemented by the state’sDepartment of Natural Resources. Indiana’s requirements for backfilling plans parallel requirementsestablished in 30 CFR 817.81(f) under SMCRA. Pennsylvania, in addition, regulates mine backfill wellprojects through regulations implemented by the Bureau of Mining and Reclamation.
In the eight states that are Primacy States for Class V UIC wells, state regulations pertaining tomine backfill wells vary significantly in their scope and stringency.
• Mine tailing backfill wells are authorized by rule in Idaho, unless use of such a well results inexceedance of water quality standards, when the well is required to obtain an individual permit orclose.
• Illinois has enacted UIC Class V requirements that are identical to those of the USEPA. The stateapplies inventory requirements and uses permit by rule to ensure non-endangerment of USDWs. Inaddition, the state has enacted a Groundwater Protection Act and ground water quality regulationsthat require responses to ground water contamination before it exceeds specified ground waterquality standards.
• Kansas has incorporated the federal UIC Class V regulations by reference. (Mine backfill wellsthat are designed to backfill salt caverns are covered by the state’s Class III UIC requirements. andby water well requirements and are not discussed in this report.) Class V mine backfill wells arepermitted by rule.
• North Dakota uses inventory requirements and permit by rule to ensure non-endangerment ofUSDWs from mine backfill wells. In addition, the state places special requirements for siting,construction, and operation of backfill wells into the contracts that the state enters into forbackfilling to address highway subsidence, the predominant backfilling activity that takes place inthe state.
• Ohio authorizes by rule Class V UIC mine backfill wells and requires drilling and operating permitsfor some types of wells, including backfill wells. In addition, Ohio’s rules pertaining to undergroundcoal mines, administered by the Division of Mines and Reclamation, require the development of areclamation plan, including ground water monitoring, and specify that discharge of water into

September 30, 1999 49
underground mines is prohibited unless approved by the Division of Mines. Ohio’s requirementsfor backfilling plans parallel the requirements in 30 CFR 817.81(f) under SMCRA.
• In Texas, mine backfill wells are authorized by rule. The state’s mining regulations exempt shaftsand boreholes authorized under the UIC program. The state requirements for Class V wells,however, include siting, construction, and closure standards.
• West Virginia issues individual permits or area permits to mine backfill wells.
• Wyoming covers mine backfill wells under the general permit provisions of the state’s Class V UICrequirements. In addition to requiring the submission of information, the general permitrequirements also include a well operator to establish a monitoring program. In addition, the state’sregulations pertaining to underground coal mining require a permit to return coal-mining waste toabandoned underground workings.
September 30, 1999 50
ATTACHMENT ASTATE AND LOCAL PROGRAM DESCRIPTIONS
This attachment does not describe every state’s control programs; instead it focuses on the tenstates where relatively large numbers of mine backfill wells are known to exist: Idaho, Illinois, Indiana,Kansas, North Dakota, Ohio, Pennsylvania, Texas, West Virginia, and Wyoming. Altogether, these tenstates have a total of 4,992 documented mine backfill wells, which is almost 99 percent of the documentedwell inventory for the nation.
Idaho
Idaho is a UIC Primacy State for Class V wells and has promulgated regulations for its UICprogram in the Idaho Administrative Code (IDAPA), Title 3, Chapter 3.
Permitting
Idaho’s rules state that mine tailings backfill wells are authorized by rule as part of mining operations“because federal studies show the threat of endangerment from use of these wells is low. They aretherefore exempt from the MCLs and permitting requirements of the UIC rules, provided that their use islimited to the injection of mine tailings only.” For rule-authorized mine backfill wells inventory informationmust be supplied (37.03.03.030.01 IDAPA).
The rules provide that the use of a well shall not result in water quality standards at points ofbeneficial use being exceeded or otherwise affect a beneficial use. If water quality standards are exceededor beneficial uses affected, the rules state that the well may be put under the permit requirements of Title 3,Chapter 3, or the well may be required to be remediated or closed (37.03.03.025.03.g IDAPA (Rule25)).
If a mining backfill well is placed under the permitting requirements, detailed permit applicationinformation is required. It includes information on location and construction of the proposed well; proposedinjectate; local features such as topography, wells producing water, surface waters, residences, andgeology; and maps and cross sections depicting all USDWs within a quarter mile radius of the injectionwell, their location relative to the injection zone, and the direction of water movement. Corrective actionand contingency plans must be prepared and submitted, and proof of financial responsibility must besupplied.
18 “Ground water” is defined as “any water that occurs beneath the surface of the earth in asaturated geological formation of rock or soil.” A “Drinking Water Source” is defined as “an aquiferwhich contains water having less than ten thousand (10,000) mg/l total dissolved solids” that has not beenexempted from that designation by the Director of the Department of Water Resources.
September 30, 1999 51
Siting and Construction
Class V wells may be required to be located at a distance from a point of diversion for beneficialuse sufficient to minimize or prevent ground water18 contamination resulting from unauthorized or accidentalinjection (37.03.03.050.03.a IDAPA)
Operating Requirements
Idaho’s requirements for use of Class V wells are based on the premise that if the injected fluidsmeet MCLs for drinking water at the wellhead, and if ground water produced from adjacent points ofdiversion for beneficial use meets the water quality standards found in Idaho’s “Water Quality Standardsand Wastewater Treatment Requirements,” 16.01.02 IDAPA, administered by the Idaho Department ofHealth and Welfare, the aquifer will be protected from unreasonable contamination. The state may, whennecessary “to protect the ground water resource from deterioration and preserve it for diversion tobeneficial use,” require specific injection wells to be constructed and operated in compliance withadditional requirements (37.03.03.050.01 IDAPA (Rule 50)). Rule-authorized wells “shall conform to theMCLs at the point of injection and not cause any water quality standards to be violated at the point ofbeneficial use” (37.03.03.050.04.d. IDAPA).
Monitoring, recordkeeping, and reporting may be required if the state finds that the well mayadversely affect a drinking water source or is injecting a contaminant that could have an unacceptable effectupon the quality of the ground waters of the state (37.03.03.055 IDAPA (Rule 55)). As a condition of useof mine tailings backfill wells, the owner or operator may be required to monitor ground water(37.03.030.025.03.g IDAPA (Rule 25)).
Financial Responsibility
No financial responsibility requirement exists for rule-authorized mine backfill wells. Operators of permitted wells are required to demonstrate financial responsibility through a performance bond or otherappropriate means (the rule does not specify the amount(s) required) to abandon the injection wellaccording to the conditions of the permit (37.03.03.35.03.e IDAPA).
Plugging and Abandonment
The Idaho Department of Water Resources (IDWR) has prepared “General Guidelines forAbandonment of Injection Wells,” which are not included in the regulatory requirements. IDWR expects toapprove the final abandonment procedure for each well. The General Guidelines recommend the following:

September 30, 1999 52
C The casing should be pulled, if possible, or cut a minimum of two feet below the land surface.
C The total depth of the well should be measured.
C If the casing is left in place, it should be perforated and neat cement with up to 5 percent bentonitecan be pressure-grouted to fill the hole. As an alternative, when the casing is not pulled, coursebentonite chips or pellets may be used. If the well extends into the aquifer, the chips or pellets mustbe run over a screen to prevent any dust from entering the hole. Perforation of the casing is notrequired under this alternative
C If the well extends into the aquifer, a clean pit-run gravel or road mix may be used to fill the bore upto ten feet below the top of the saturated zone or ten feet below the bottom of the casing,whichever is deeper, and cement grout or bentonite clay used to the surface. Gravel may not beused if the lithology is undetermined or unsuitable.
C A cement cap should be placed at the top of the casing if the casing is not pulled, with a minimum oftwo feet of soil overlying the filled hole/cap.
C Abandonment of the well must be witnessed by an IDWR representative.
Illinois
Illinois is a UIC Primacy State for Class V wells. The Illinois Environmental Protection Agency(IEPA), Bureau of Land, has promulgated rules establishing a Class V UIC program in 35 IllinoisAdministrative Code (IAC) 704. These rules are identical in substance to USEPA rules in 40 CFR 144(704.101 IAC). In addition, Part 702, “RCRA and UIC Permit Programs,” establishes requirements forthose UIC wells required to obtain a permit, while Part 705 describes the procedures for issuing UICpermits. Finally, 35 IAC Part 730 sets out technical criteria and standards for the UIC program. Part 730Subpart F currently does not specify technical criteria and standards for siting, construction, operating,monitoring and reporting, mechanical integrity, or closure for Class V UIC wells, although other subparts ofPart 730 do so for other classes of UIC wells (730.151 IAC).
Permitting
Any underground injection, except into a well authorized by permit or rule, is prohibited. Theconstruction of any well required to have a permit is prohibited until the permit has been issued (704.12.IAC). However, injection into Class V wells is authorized by rule (704.146 IAC). Owners or operatorsof wells authorized by rule must submit inventory information (704.148 IAC). In addition, IEPA mayrequire submission of other information deemed necessary by IEPA (704.149 IAC). In addition to theinventory information required from all Class V wells, certain categories of wells, including sand or otherbackfill wells as defined by 35 IAC 730.105(e)(8), are required to submit additional information, includingthe following:
19 “Potable” is defined as “generally fit for human consumption in accordance with accepted watersupply principles and practices.”
September 30, 1999 53
C Location of each well by township, range, section, and quarter-section;C Date of completion of each well,C Identification and depth of the formation(s) into which each well is injecting,C Total depth of each well,C Casing and cementing record, tubing size, and depth of packer,C Nature of the injected fluids,C Average and maximum injection pressure at the wellhead,• Average and maximum injection rate, and• Date of the last MITs, if any (704.148(b)(2) IAC).
Operating Requirements
No operating requirements are specified for Class V UIC wells permitted by rule. Such wells,however, are subject to the state’s ground water protection requirements. Under Illinois’ Ground WaterQuality regulations, found in 35 Ill. Adm.Code Part 620, a classification system is established for theState’s ground waters. The regulations also enact a nondegradation provision, establish standards forquality of ground waters, and create procedures for the management and protection of ground waters. Theregulation defines “potential route” of ground water contamination to include, among others, abandoned andimproperly plugged wells of all kinds, drainage wells, and all injection wells. The regulation provides that noperson shall cause a violation of the state’s Environmental Protection Act, the Groundwater Protection Act,or regulations adopted under those Acts, including the Ground Water Quality regulations.
The fours classes of ground water established by the classification system are (I) potable resourceground water;19 (II) general resource ground water, which cannot easily be tapped to supply drinkingwater; (III) special resource ground water, which is “demonstrably unique (e.g., irreplaceable”), vital for aparticularly sensitive ecological system (not further defined), or contributes to a dedicated nature preserve;and (IV) other ground water, which is naturally saline, contaminated, or is limited in its resource potential(e.g., within a zone of attenuation for a solid waste landfill, under a coal mine refuse disposal area, under apotential contaminant source, within a previously mined area, or ground water that has been designated asan exempt aquifer under the underground injection policy of 730.104 IAC (620.201 - 240 IAC). (Under730.104 IAC an aquifer or portion of an aquifer that otherwise meets the criteria for a USDW may bedetermined to be an exempted aquifer if it does not currently serve as a source of drinking water and itcannot now and will not in the future serve as a source of drinking water.)
The Ground Water Quality regulations prohibit impairment of resource ground water and requirepreventive notice and response procedures to detect and address contaminants before they exceed theground water quality standards for Class I and III ground waters. The regulations also include groundwater quality standards for each class of ground water, as well as ground water quality restorationstandards. The latter include coal reclamation ground water quality standards, addressing inorganicchemical constituents and pH in ground water, within an underground coal mine, or within the cumulative
September 30, 1999 54
impact area of ground water for which the hydrologic balance has been disturbed from a permitted coalmine (620.450(b). These requirements also address coal mine refuse disposal areas, but do not explicitlyaddress mine backfill activities.
Indiana
USEPA Region 5 directly implements the UIC program for Class V injection wells in Indiana. Inaddition, however, state regulations found in Title 310 Indiana Administrative Code (IAC) administered bythe Indiana Department of Natural Resources (DNR), Division of Reclamation, apply to mine backfill wells.
Permitting
The DNR permitting rules require applications for underground mining operation permits todescribe proposed disposal methods and sites for placing underground development waste and excess spoilgenerated at surface areas (310 IAC 12-3-86). Each plan also must describe the design, operation, andmaintenance of any proposed coal processing waste disposal facility, including the source and quality ofwaste, the area to be backfilled, the method of constructing underground retaining walls, the source of thehydraulic transport mediums, the method of dewatering the emplaced backfill, the retention of waterunderground, the effect on the hydrology, each monitoring well to be located in the backfilled area, thestratum underlying the mined coal, and the gradient from the backfilled area (310 IAC 12-3-91).
Regulations of the Water Pollution Control Board also specify that if an applicant for an NationalPollutant Discharge Elimination System (NPDES) permit proposes to dispose of pollutants by undergroundinjection as part of the overall effort to meet the requirements of the NPDES program, the application shallbe denied, unless conditions can be placed in the NPDES permit that will control the proposed discharge toprevent pollution of ground water resources of such character and degree as would endanger or threaten toendanger the public health and welfare (327 IAC 5-4-2).
Siting and Construction
Approval must be obtained for return of coal processing waste to abandoned undergroundworkings (310 IAC 12-3-91). Plans submitted to the Division of Reclamation must identify the locations ofthe wells.
Operating Requirements
Coal processing waste may be returned to underground mine workings only in accordance with thewaste disposal program approved under 310 IAC 12-3-91 (310 IAC 12-5-46 and 310 IAC 12-5-110). The Division of Reclamation specifies operating requirements on a case-by-case basis. Quarterly groundwater analyses must be submitted, and must continue to be submitted following completion of injectionactivities until a demonstration can be made that no adverse effects on the hydrologic balance haveoccurred. Each drilled hole, well, or other exposed underground opening identified in the approved permit
September 30, 1999 55
application for use to return coal processing waste or water to underground workings must be temporarilysealed before use and protected during use (310 IAC 12-5-9).
Mechanical Integrity Testing
Not specified by statute or regulation.
Financial Responsibility
Operators are required to post a performance bond with DNR’s Division of Reclamation. Thebond is released upon a showing that following cessation of injection activities no adverse effects to thehydrologic balance have occurred.
Plugging and Abandonment
If no longer in use, a drilled hole or well must be cased, sealed, or otherwise managed to preventacid or other toxic drainage from entering ground or surface waters and to minimize disturbance to theprevailing hydrologic balance (310 IAC 12-5-74 and 310 IAC 12-5-76).
Kansas
Kansas is a UIC Primacy State for Class V wells. It has incorporated the federal UIC regulationsby reference in Kansas Administrative Regulations (KAR) Article 28-46.
Permitting
Mine backfill wells, except for wells backfilling salt caverns, are permitted by rule under KAR 28-46. Mine backfill wells that are designed to backfill salt caverns are covered by regulations for Class IIIsalt solution mining wells (KAR 28-43) and also are covered by KAR 28-30.
Siting and construction
There are no siting or construction requirements for mine backfill wells, except for wells backfillingsalt caverns.
Operating requirements
There are no operating requirements for mine backfill wells, except for wells backfilling salt caverns. The state requires salt cavern backfill well operators to prepare a closure plan and to fill wells with grout,relying upon requirements for abandonment in 28-30 KAR.

September 30, 1999 56
North Dakota
North Dakota is a UIC Primacy State for Class V wells. Regulations establishing the UIC programare found in Article 33-25 of the North Dakota Administrative Code (NDAC).
Permitting
Underground injection is prohibited, unless authorized by permit or rule (33-25-01-03 NDAC).Injection into a Class V well is authorized by rule indefinitely, subject to the requirements of subsections 4(evidence of financial responsibility), 5 (maintenance of records until 3 years after plugging andabandonment), and 6 (reporting within 24 hours of any endangerment of a USDW and any noncompliancewith a permit condition or malfunction of the injection system that could cause fluid migration into orbetween USDWs) of § 33-25-01-10 and subsection 3 (notice to the Department of Health beforeconversion or abandonment of the well) of §33-25-01-12 NDAC. The operator of a Class V wellauthorized by rule may be required to apply for and obtain an individual or area permit under specificcircumstances, including cases in which protection of a USDW requires the injection operation to beregulated by requirements not contained in the rules (33-25-01-16 NDAC).
Siting and Construction
Although not explicitly called for by the Class V requirements, siting and construction requirementsare imposed on mine backfill wells by the Abandoned Mine Lands Division of the Public ServiceCommission on a case-by-case basis through the contract terms that the Division includes in its contractsfor backfilling services.. The wells are sited where abandoned underground mines that lie beneath towns orhighways have caused subsidence. The contracts call for the wells to be constructed as 5 inch diameterholes cased with 3 inch I.D. Schedule 40 PVC pipe., and to be 50-70 feet deep. None inject intoUSDWs.
Operating Requirements
Operating requirements are established by contract. The contractors who construct and operatethe wells are required to inject grout in conformance with contract specifications, including specificationsconcerning grout pressure at the well head, flow rates, pumping rates, and cumulative volume pumped;grout constituents and consistency; records and recordkeeping; and permitting.
Subsection 5 of § 33-25-01-10 requires records to be maintained concerning the nature andcomposition of injected fluids for three years after plugging and abandonment of the well. A single type ofinjectate, which has been approved by the Department of Health, is utilized by the Abandoned MinesDivision of the Public Service Commission. Operations are generally concluded within 24 hours. Aqualified inspector is on-site whenever injection occurs.
Subsection 6 of § 33-25-01-10 requires a report within 24 hours of any monitoring or otherindication that any contaminant may cause an endangerment to a USDW, or any noncompliance with a
September 30, 1999 57
permit condition or malfunction of the injection system that may cause fluid migration into or betweenUSDWs.
Mechanical Integrity Testing
Not specified by statute or regulation.
Financial Responsibility
Subsection 4 of § 33-25-01-10 requires operators to have sufficient financial responsibility andresources to close, plug, and abandon the underground injection operation in a manner prescribed by theDivision of Water Supply and Pollution Control of the Department of Health. A surety bond, or otherevidence of adequate assurance, in an amount satisfactory to the Department, must be provided.
Plugging and Abandonment
Subsection 3 of § 33-25-01-12 requires notice before conversion or abandonment of the well.
Ohio
Ohio is a UIC Primacy State for Class V wells. Regulations establishing the UIC program arefound in Chapter 3745-34 of the Ohio Administrative Code (OAC). In addition, the Ohio Department ofNatural Resources, Division of Mines and Reclamation, regulates active and abandoned mines.
Permitting
Class V injection wells are defined to include sand backfill and other backfill wells used to inject amixture of water and sand, mill tailings or other solids into mined out portions of subsurface mines (3745-34-04 OAC). Any underground injection, except as authorized by permit or rule, is prohibited. Theconstruction of any well required to have a permit is prohibited until the permit is issued (3745-34-06OAC).
Injection into Class V injection wells is authorized by rule (3745-34-13 OAC).However, a drilling and operating permit is required for injection into a Class V injection well of sewage,industrial wastes, or other wastes (including backfill), as defined in § 6111.01 of the Ohio Revised Code,into or above a USDW (3745-34-13 OAC and 3745-34-14 OAC).
Permit applications must include a description of the activities conducted by the applicant; facilitylocation, listing of other permits under specified programs, where the well is to be drilled, name of thegeological formation to be used and the proposed total depth of the well, type of drilling equipment to beused, plan for disposal of water and other waste substances, composition of the substance to be injected,topographic map indicating specified features, and description of the business (3745-34-16 OAC).
September 30, 1999 58
Class V injection well permits may be issued on an area basis. The permit will specify requirementsfor construction, monitoring, reporting, operation, and abandonment (3745-34-18 OAC).
Ohio's rules on underground coal mines, administered by the Division of Mines and Reclamation,require the development of a reclamation plan that must be submitted as part of an application for a permitto conduct coal mining (1501:13-4-14 OAC). The plan must include a description of the measures to beused to seal or manage mine openings and to plug, case or manage exploration holes, other bore holes,wells, and other openings within the proposed permit area (1501:13-4-14(D)(2)(g) OAC). It must includea ground water monitoring plan, including identification of the monitoring parameters, sampling frequency,and site locations, sufficient to monitor the suitability of the ground water for current and approved post-mining land uses and the objectives for protection of the hydrologic balance established in the permit(1501:13-4-14(F)(1)(a) OAC).
The rules require submission of a subsidence control plan, including a detailed description of thesubsidence control measures that will be taken to prevent or minimize subsidence, such as backfilling voids(1501:13-4-14(M)((2)(e) OAC). The Ohio rules also adopt the MSHA requirements concerning return ofcoal mine wastes to abandoned underground workings. They require the application to contain a plan thatdescribes the design, operation, and maintenance of any proposed coal processing waste disposal facility. The plan must describe the source and quality of waste to be stowed, area to be backfilled, percent of themine void to be filled, method of constructing underground retaining walls, influence of the backfillingoperation on active underground mine operations, surface area to be supported by the backfill, and theanticipated occurrence of surface effects following backfill. The application is required to describe the source of the hydraulic transport mediums, method of dewatering the emplaced backfill,retention of water underground, treatment of water if released to surface streams, and the effect on thehydrology. The plan must describe each permanent monitoring well to be located in the backfilled area, thestratum underlying the mined coal, and the gradient from the backfilled area. Pneumatic backfillingoperations are covered, except they may be exempted from requirements specifying hydrologic monitoring(1501:13-4-14(N)(1)-(5) OAC).
Siting and Construction
The permit applicant must submit plans for testing, drilling, and construction, and no constructionmay commence before permit issuance. Permits will contain conditions specifying constructionrequirements (3745-34-27 OAC).
The mining rules specify that each exploration hole, other drill or borehole, shaft, well, or otherexposed mine opening must be cased, sealed, or otherwise managed as approved by the Division of Mines. Each well or other opening identified in the approved permit application for use to return coal processingwaste or water to underground workings must be temporarily sealed before use and protected during useby barricades, fences, or other protective devices. When no longer needed, they must be capped, sealed,backfilled, or otherwise properly managed as required by the Division of Mines (1501:13-9-02 OAC).
September 30, 1999 59
Operating Requirements
Permits contain conditions specifying operation requirements, including maximum injection volumesand/or pressures and monitoring and reporting requirements (3745-34-27 OAC). Permittees are requiredto maintain records of the nature and composition of all injected fluids for three years. Reports of anynoncompliance that may endanger health or the environment, including any monitoring or other informationthat indicates that any contaminant may cause an endangerment to a USDW, or any noncompliance with apermit condition or malfunction of the injection system that may cause fluid migration into or betweenUSDWs must be reported within 24 hours (3745-34-26 (J) and (K) OAC).
Wells must be inspected before commencing injection. The permittee must provide notice beforeconversion or abandonment of the well (3745-34-26 (M) and (N) OAC).
The mining rules also establish a general requirement for protection of the hydrologic system frommining activities. Backfilled materials are required to be placed so as to minimize contamination of groundwater systems with acid, toxic, or otherwise harmful mine drainage, and to minimize adverse effects ofmining on ground water systems outside the permit area (1501:13-9-04(K) OAC). Discharge of waterinto underground mines is prohibited, unless specifically approved by the Division of Mines and by thefederal MSHA, and such discharges are limited to water, coal processing waste, fly ash from a coal-firedfacility, sludge from an acid-mine drainage treatment facility, flue-gas desulfurization sludge, inert materialused for stabilizing underground mines, and underground mine development wastes (1501:13-9-04(Q)OAC).
Mechanical Integrity Testing
Permits may include a condition prohibiting injection operations until the permittee shows that thewell has mechanical integrity, as specified under § 3745-34-34 OAC ((3745-34-27 OAC). Detailedspecifications for mechanical integrity are included in § 3734-34-34.
Financial Responsibility
Permittees are required to maintain financial responsibility and resources sufficient to close, plug,and abandon the underground injection operation (3734-34-27 OAC).
Plugging and Abandonment
Permits may include conditions to ensure that plugging and abandonment of the well will not allowthe movement of fluids either into or between USDWs (3745-34-27 OAC). There is no establishedclosure guidance or policy that lists specific materials or procedures to be employed. Site-specific closureplans are reviewed by Ohio USEPA.
September 30, 1999 60
Pennsylvania
USEPA Region 3 directly implements the UIC program for Class V injection wells in Pennsylvania. However, the Bureau of Mining and Reclamation in the Department of Environmental Protection approvesmine backfill well projects. The Department has no specific regulations pertaining to mine backfill wells.Technical specifications are provided to drilling contractors as part of the contract for mine backfillprojects. The technical specifications vary depending on the well location (i.e., anthracite coal regions orbituminous coal regions).
Permitting
The drilling contractor is required to obtain all necessary permits, and to comply with all existinglaws, ordinances, rules and regulations relating to the contractor’s operations.
Siting and Construction
The Department determines well siting. All work is required to be done under the direction of aResident Engineer or the Technical Specifications of the contract. Technical Specifications addressoverburden drilling, drilling in material other than overburden, and casing with steel or PVC pipe.
Operating Requirements
Technical specifications address supply, delivery, and injection of grout material. A Departmentinspector is onsite during operations.
Mechanical Integrity Testing
Not specified by statute or regulation.
Financial Responsibility
Not specified by statute or regulation.
Plugging and Abandonment
A technical specification addresses sealing of boreholes. The contractor is required to sealboreholes according to the directions of the Department’s representative. Sealing is required by means of aminimum of 10 feet of cement backfill below the overburden/rock interface or below the bottom of thesmaller casing pipe, whichever is deeper. In the event that “significant” quantities of water are encountered,the contractor may be required to set the plug below the aquifer and build the seal from that elevation.

September 30, 1999 61
Texas
Texas is a UIC Primacy State for Class V wells. The Injection Well Act (Chapter 27 of the TexasWater Code) and Title 3 of the Natural Resources Code provide statutory authority for the UIC program. Regulations establishing the UIC program are found in Title 30, Chapter 331 of the Texas AdministrativeCode (TAC).
Permitting
Underground injection is prohibited, unless authorized by permit or rule (331.7 TAC). Injectioninto a Class V well is authorized by rule, although the Texas Natural Resources Control Commission(TNRCC) may require the owner or operator of a well authorized by rule to apply for and obtain aninjection well permit (331.9 TAC). No permit or authorization by rule is allowed where an injection wellcauses or allows the movement of fluid that would result in the pollution of a USDW. A permit orauthorization by rule must include terms and conditions reasonably necessary to protect fresh water frompollution (331.5 TAC). Sand backfill wells used to inject a mixture of water and sand, mill tailings or othersolids into mined out portions of subsurface mines are specifically defined as Class V wells (331.11(a)(4)(H) TAC). The state’s mining regulations require permits for the construction, use, or operation of anew shaft, but exempt penetrations or boreholes authorized by the TNRCC under the undergroundinjection control program and penetrations authorized by the TNRCC whose purpose is the transmission ofconcrete slurries, muds, or bulk materials to underground mine workings (329.4 TAC). Therefore thestate’s mining backfill wells are regulated under the UIC program and not the mining program.
Siting and Construction
All Class V wells are required to be completed in accordance with the following specifications inthe rules, unless otherwise authorized by the TNRCC:
C A form provided either by the Water Well Drillers Board or the TNRCC must be completed.
C The annular space between the borehole and the casing must be filled from ground level to a depthof not less than 10 feet below the land surface or well head with cement slurry. Specialrequirements are imposed in areas of shallow unconfined ground water aquifers and in areas ofconfined ground water aquifers with artesian head.
C In all wells where plastic casing is used, a concrete slab or sealing block must be placed above thecement slurry around the well at the ground surface (the rules include additional specificationsconcerning the slab).
C In wells where steel casing is used, a slab or block will be required above the cement slurry, exceptwhen a pitless adaptor is used. The rules contain additional requirements concerning adaptors.
September 30, 1999 62
C All wells must be completed so that aquifers or zones containing waters that differ significantly inchemical quality are not allowed to commingle through the borehole-casing annulus or the gravelpack and cause degradation of any aquifer zone.
C The well casing must be capped or completed in a manner that will prevent pollutants from enteringthe well.
C When “undesirable” water is encountered in a Class V well, the undesirable water must be sealedoff and confined to the zone(s) of origin (331.132 TAC).
Operating Requirements
Not specified by statute or regulation.
Mechanical Integrity Testing
Injection may be prohibited for Class V wells that lack mechanical integrity. The TNRCC mayrequire a demonstration of mechanical integrity at any time if there is reason to believe mechanical integrityis lacking. The TNRCC may allow plugging of the well or require the permittee to perform additionalconstruction, operation, monitoring, reporting, and corrective actions which are necessary to prevent themovement of fluid into or between USDWs caused by the lack of mechanical integrity. Injection mayresume on written notification from the TNRCC that mechanical integrity has been demonstrated (331.4TAC).
Financial Responsibility
Chapter 27 of the Texas Water Code, “Injection Wells,” enacts financial responsibilityrequirements. However, the requirement, unless incorporated into a individual permit for a Class V well,applies specifically only to Class I and Class III wells (331.142 TAC).
Plugging and Abandonment
Plugging and abandonment of a well authorized by rule is required to be accomplished inaccordance with §331.46 TAC (331.9 TAC). In addition, closure standards specific to Class V wellsprovide that closure is to be accomplished by removing all of the removable casing and filling the entire wellwith cement to land surface. Alternatively, if the use of the well is to be permanently discontinued, and if thewell does not contain undesirable water, the well may be filled with fine sand, clay, or heavy mud followedby a cement plug extending from the land surface to a depth of not less than 10 feet. If the use of a wellthat contains undesirable wateris to be permanently discontinued, either the zone(s) containing undesirable water or the fresh water zone(s)must be isolated with cement plugs and the remainder of the wellbore filled with sand, clay, or heavy mud toform a base for a cement plug extending from the land surface to a depth of not less than 10 feet (331.133TAC).
September 30, 1999 63
West Virginia
West Virginia is a UIC Primacy State for Class V wells. Regulations establishing the UIC programare found in Title 47-13 West Virginia Code of State Regulations (WVAC). The state regulates sandbackfill and other backfill wells used to inject a mixture of water and sand, mill tailings or other solids intomined out portions of subsurface mines as Class V wells (47-13-3.4.5.b. WVAC).
Permitting
Class V injection wells are authorized by rule unless the Office of Water Resources of the Divisionof Environmental Protection (DEP) requires an individual permit (47-13-12.4.a. and 47-13-13.2 WVAC). All backfill wells in the state are required to have either individual permits or, if a group of wells in closeproximity injects into the same abandoned mine, an area permit (Parsons, 1999).
Siting and Construction
Individually permitted wells are subject to case-by-case construction requirements, based on plansfor testing, drilling, and construction submitted as part of the permit application. Wells subject to areapermits also are subject to construction requirements for all wells authorized by the permit (47-13-13.6, .7,and .4.b.2 WVAC).
Operating Requirements
Owners or operators of Class V wells are required to submit inventory information describing thewell, including its construction features, the nature and volume of injected fluids, alternative means ofdisposal, the environmental and economic consequences of well disposal and its alternatives, operationstatus, location, and ownership information (47-13-12.2 WVAC).
Individual and area permits specify requirements for monitoring, reporting, and operation for allwells authorized by the permit (47-13-13.4, .6, and .7 WVAC). Owners and operators must meet therequirements for monitoring and records (requiring retention of records pursuant to 47-13-13.6.b. WVACconcerning the nature and composition of injected fluids until 3 years after completion of plugging andabandonment); immediate reporting of information indicating that any contaminant may cause anendangerment to USDWs or any malfunction of the injection system that might cause fluid migration into orbetween USDWs.
The rules enact a general prohibition against any underground injection activity that causes or allowsthe movement of fluid containing any contaminant into USDWs, if the presence of that contaminant maycause a violation of any primary drinking water regulations under 40 CFR Part 142 or promulgated underthe West Virginia Code or may adversely affect the health of persons. If at any time a Class V well maycause a violation of the primary drinking water rules the well may be required to obtain a permit or takeother action, including closure, that will prevent the violation (47-13-13.1 WVAC). Inventory requirements
September 30, 1999 64
for Class V wells include information regarding pollutant loads and schedules for attaining compliance withwater quality standards (47-13-13.2.d.1 WVAC).
If protection of a USDW requires, the injection operation may be required to satisfy requirementsfor corrective action, monitoring, and reporting, or operation, that are not contained in the UIC rules (47-13-13.2.c.1.C. WVAC).
Mechanical Integrity
Backfill wells required to obtain an individual permit will be required to demonstrate that the wellhas mechanical integrity (47-13-13.7.h WVAC). Wells permitted by rule or subject to an area permit maybe required to demonstrate mechanical integrity.
Financial Responsibility
A Class V well required to obtain an individual permit will be required to demonstrate financialresponsibility and resources for plugging and abandonment. Evidence of financial responsibility includessubmission of a surety bond or other adequate assurance such as a financial statement of other materialacceptable to DEP.
Plugging and Abandonment
Backfill wells required to obtain an individual permit will be subject to permit conditions pertainingto plugging and abandonment to ensure that the plugging and abandonment of the well will not allow themovement of fluids into or between USDWs. A plan for plugging and abandonment will be required (47-13-13.7.f WVAC). Wells permitted by rule or subject to an area permit may be required to submit a planfor plugging and abandonment.
Wyoming
Wyoming is a UIC Primacy State for Class V wells and the Wyoming Department ofEnvironmental Quality (DEQ) Water Quality Division, has promulgated regulations pertaining to its Class VUIC program in Chapter 16, Water Quality Rules and Regulations (WQRR). Rules on ground waterpollution control permits are promulgated in Chapter 9, WQRR, but Class V wells are specificallyexempted from coverage by Chapter 9 (Chapter 9 Section 3(a) WQRR). The DEQ Land Quality Divisionhas promulgated requirements pertaining to coal and non-coal mining.
Permitting
Mining, sand, and backfill facilities (category 5B1) are covered by the General Permit provisions ofthe state’s Class V rules (Chapter 16 Section 7 WQRR). A general permit is a permit issued to a class ofoperators, all of which inject similar types of fluids for similar purposes. General permits require lessinformation to be submitted by the applicant than individual permits, and do not require public notice for a

September 30, 1999 65
facility to be included under the authorization of a general permit (Chapter 16 Section 2 (l) WQRR). General permits specify the subclass of injection facility covered, the geographic area covered, the generalnature of the fluids discharged, and the location of the receiver where the discharge will be allowed.
The state’s coal mining regulations (CRR) provide that a permit applicant who is proposing toreturn coal-mining waste to abandoned underground workings must:
C Describe the design, operation, and maintenance of any proposed coal-processing waste facility,including flow diagrams and any other necessary drawings and maps, for the approval of the DEQand the Mine Safety and Health Administration;
C Describe the sources and quality of waste to be stowed, area to be backfilled, percent of the minevoid to be filled, method of constructing underground retaining walls, influence of the backfillingoperation on active underground mine operations, surface area to be supported by the backfill andthe anticipated occurrence of surface effects following backfilling;
C Describe the source of the hydraulic transport mediums, method of dewatering the placed backfill,retainment of water underground, treatment of water if released to surface streams, and the effecton the hydrologic regime;
C Describe each permanent monitoring well to be located in the backfilled area, the stratumunderlying the mined coal, and gradient from the backfilled area except where pneumatic backfillingoperations are exempted from hydrologic monitoring; and
C Be approved by MSHA as well as DEQ prior to implementation (Chapter 7 Section 2(b)(xv)CRR).
Permit applicants for underground coal mines must describe in their permit application measures tobe taken in the mine to prevent or minimize subsidence, including backfilling of voids (Chapter 7 Section1(a)(v)(C) CRR).
Siting and Construction
Class V facilities may not be located within 500 feet of any active public water supply well,regardless of whether or not the well is completed in the same aquifer. This minimum distance may increaseor the existence of a Class V well may be prohibited within a wellhead protection area, source waterprotection area, or water quality management area (Chapter 16 Section 10(n) WQRR).
A separate permit to construct is not required under Chapter 3 of the WQRR for any Class Vfacility. Construction requirements are included in the UIC permit issued under Chapter 16 (Chapter 16,Section 5 (v) WQRR). In order to be covered by a general permit, an operator must submit theinformation required by Chapter 16 Section 6 (i), (ii) and (iii), which includes a brief description of thenature of the business and activities to be conducted, information about the operator, and the location of the

September 30, 1999 66
facility. Additional information also may be required as a condition of the general permit. The rules specifythat certain construction and operating requirements must be included (see operating requirements)(Chapter 16 Section 10(d) WQRR).
A facility is covered by a general permit as soon as the DEQ has issued a general statement ofacceptance to allow the construction and operation of the facility (Chapter 16 Section 7 WQRR). Thefacility must meet construction requirements in Chapter 16 Section 10 WQRR, submit notice of completionof construction to the DEQ, and allow for inspection upon completion of construction prior to commencingany injection activity (Chapter 16 Section 5(c)(I)(U) WQRR).
Operating Requirements
The general permit conditions include a requirement that the permittee properly operate andmaintain all facilities and systems, furnish information to the DEQ upon request, allow inspections, establish a monitoring program pursuant to Chapter 16 Section 11 WQRR and report monitoring results, give prior notice of physical alterations or additions, and orally report confirmed noncompliance resulting inthe migration of injected fluid into any zone outside of the permitted receiver within 24 hours and follow upwith a written report within 5 days. Detailed information requirements also are included in the generalpermit, including a requirement to monitor the injectate at a specified frequency and report the informationto DEQ (Chapter 16 Section 7WQRR). A continuous monitoring program normally will not be required,but monitoring frequency will depend on the ability of the facility to cause adverse environmental damage oraffect human health (Chapter 16 Section 7(e)(v) WQRR).
The rules (Chapter 16 Section 10(d) WQRR) also specify that the permittee must demonstrate:
C Mechanical integrity of any well designed to remain in service for more than 60 days;
C Provision for controlling the type of material injected and to insure that no hazardous waste isinjected;
C Leak detection in all surface piping;
C Provision for insuring that the backfill remains within the permitted area of injection; and
C Provision to ensure that the injection does not cause a ground water standards violation for theclass of use of the receiver.
The mining regulations further provide that surface entries and accesses to underground workingsmust be located, designed, constructed, and utilized to prevent or control gravity discharge of water fromthe mine in excess of state or federal water quality standards (Chapter 7 Section 2(b)(ii) CRR).
Public notice must be given of any proposed measures to prevent or control adverse surfaceeffects, such as subsidence (Chapter 7 Section 3(a)(ii) CRR).
September 30, 1999 67
Mechanical Integrity
Permittees are required to adopt measures to insure the mechanical integrity of any well designed toremain in service for more than 60 days. No specific regulatory requirements on MIT have been enacted;the specific tests to be used will depend on the specific well conditions.
Financial Responsibility
Not specified by statute or regulation.
Plugging and Abandonment
Wells may be abandoned in place if it is demonstrated to DEQ that no hazardous waste orradioactive waste has ever been discharged through the facility, all piping allowed for the discharge haseither been removed or the ends of the piping have been plugged in such a way that the plug is permanentand will not allow for a discharge, and all accumulated sludges are removed from holding tanks, lift stations,or other waste handling structures prior to abandonment (Chapter 16 Section 12 (a) WQRR).

September 30, 1999 68
REFERENCES
Affolter, R. H., Brownfield, M.E., and Breit, G. N. 1997. Temporal Variations in the Chemistry ofFeed Coal, Fly Ash, and Bottom Ash and Bottom Ash from a Coal-Fired Power Plant. Presented atthe 1997 International Ash Utilization Symposium, organized by the University of Kentucky Cneter forApplied Energy Research, Lexington, Kentucky, October 20-22.
Agency for Toxic Substances and Disease Registry (ATSDR). 1999. Toxicity Frequently AskedQuestions (ToxFAQs) Fact Sheets. Atlanta, GA: Agency for Toxic Substances and Disease Registry,Division of Toxicology. Available: http://www.atsdr.cdc.gov/tfacts.html [March].
Aljoe, W. W. 1999. Hydrologic and Water Quality Changes Resulting from Injection of CCB Groutinto a Maryland Underground Mine. Presented at the American Coal Ash Association’s 13thInternational Symposium on Use and Management of Coal Combustion Products, Orlando, FL, January11-15, 1999.
Brackebusch, F.W. 1994. “Basics of paste backfill systems.” Mining Engineering. 46:1175-1178.October 1994.
Brookins, D.G., Thomson, B.M., and Longmire, P.A. 1982. Early Diagenesis of Uranium Mine StopeBackfill. Paper in Paper in Uranium Mill Tailings Managemetn: Proceedings of the Fifth Symposium (Ft.Collins, CO, December 9-10, 1982). Colorado State Uiversity, Ft. Collins, CO. Pp 27-37.
Canty, G. A., and Everett, J.W. 1999. An In-Situ Remediation Method for Abandoned UndergroundCoal Mines Using Coal Combustion Products, in Proceedings, 13th International Symposium on Useand Management of Coal Combustion Products. Orlando, Florida. January 11-15, 1999. pp. 67-1 - 67-14.
Council of Industrial Boiler Owners (CIBO). 1997. Interim Final Draft Report on Fossil FuelCombustion ByProducts from Fluidized Bed Boilers. October 10, 1997.
Crislip, L. 1998. State of Illinois. Backfill mining questionnaire and associated information.
Crislip, L. 1999. Indiana Environmental Protection Agency. Information provided on injection well. February 26, 1999.
Electric Power Research Institute (EPRI). 1998. “Chemical Changes in Ash-Filled Coal Mines.” Attachment II to letter from Gary Gibbs, Utility Solid Waste Activities Group (USWAG) to Dennis Ruddy,U. S. EPA. October 30, 1998.
Endress, J. 1996. Kindall Mining, Inc. Letter of correspondence to Lisa Perenchio, U.S. EPA. June 18,1996.
September 30, 1999 69
Freeze, R. A. And Cherry, J. A. 1979. Groundwater. Prentice-Hall, Inc., Englewood Cliffs, NJ.
Jude, C.V. and T.L. Vandergrift. 1995. “Backfilling Materials and Methods for Stress TransferModification in Deep Longwall Mines.” Washington, DC: U.S. Bureau of Mines.
Karfakis, M.G., C.H. Bowman, and E. Topuz. 1996. “Characterization of Coal Mine Refuse asBackfilling Material.” Geotechnical and Geological Engineering. 14:129-150.
Kim, A. G., and Cardone. C. 1997. “Preliminary Statistical Analysis of the Effect of Fly Ash Disposal inMined Areas,” in Proceedings: 12th International Symposium on Coal Combustion By_Product(CCB) Management and Use, January 26-30, 1997. American Coal Ash Association, Alexandria, VA.
Kim, A. G. 1998. The Use of Coal Combustion By-Products to Control Acid Mine Drainage. Federal Energy Technology Center, U. S. Department of Energy. Available:http://www.fetc.doe.gov/products/power/enviro/ccb/amdcntrl.html [February 15, 1999].
Knape, B.K., ed. 1984. Underground Injection Operations in Texas: A Classification andAssessment of Underground Injection Activities, pp. 12-1 to 12-6. Texas Department of WaterResources Report 291. Austin, Texas: Texas Department of Water Resources.,
Levens, R. L., and C.M.K. Boldt. 1993. “Environmental Impacts of Mine Waste Sandfill.” Spokane,Washington, DC: U.S. Bureau of Mines.
Levens, R. L., Marcy, A. D., and Boldt, C. M. K. 1996. Environmental Impacts of Cemented MineWaste Backfill. U.S. Bureau of Mines Report of Investigation 9599, Spokane Research Center, Spokane,WA.
Longmire, P.A., Hicks, R.T., and Brookins, D.G. 1981. Aqueous Geochemical Interactions BetweenGround Water and Uranium Mine-stope Backfilling--Grants Minieral Belt, New Mexico: Applications ofEh-pH Diagrams. Paper in Uranium Mill Tailings Managemetn: Proceedings of the Fourth Symposium (Ft.Collins, CO, October 26-27, 1981). Colorado State Uiversity, Ft. Collins, CO. Pp 389-414.
Lopez, R. 1995. Basin Resources, Inc. Fax to Ron Zdgb, U.S. EPA. October 25 1995.
Maddox, S. 1998. ASARCO, Incorporated. Letter to Scotty Sorrells, Tennessee Dept. of Environmentand Conservation, transmitting analysis data for tailings from the Young Mill submitted in support of a ClassV permit application. September 15, 1998.
Osborne, P.S. 1992. U.S. EPA Region 8, Ground Water Expert. Memorandum to Thomas Pike, U.SEPA, UIC Implementation Section. May 15, 1992.

September 30, 1999 70
Pappas, J. 1994. American Electric Power (AEP). Letter to John J. Sadzewicz, Ohio EnvironmentalProtection Agency regarding Conesville Residual Waste Landfill Expansion Mine Grouting Program. March 14, 1994.
Parsons, Tina. 1999. West Virginia Department of Environmental Protection, Office of Water Resources. Telephone conversation with Craig Dean, ICF Consulting. September 10, 1999.
Ramsey, B. E. 1999. ARIPPA. Comments on USEPA Report to Congress on Fossil Fuel Combustion. USEPA Docket No. F-1000-FF2P-00019. June 12.
Righettini, G. 1999. Sutter Gold Mining Company. Letter of correspondence to K. Temple, ICFConsulting. March 31, 1999.
Robl, T. 1999. University of Kentucky, Center for Applied Energy Research. Letter of correspondenceto Amber Moreen, USEPA. June 16, 1999.
Sands, P. F., Boldt, C. M. K., and Ruff, T. M. 1990. Blind Pneumatic Stowing in Voids in AbandonedMines. U.S. Bureau of Mines Information Circular 9268, Spokane Research Center, Spokane, WA.
Scheetz, J. W. 1999. Homestake Mining Company. Letter of correspondence to K. Temple, ICFConsulting. April 16, 1999.
Schrand, W.D. 1992. Beech Coal Company. Letter of correspondence to Matt Mankowshi, U.S. EPA. April 2, 1992.
Smith, D.M, and H.W. Rauch. 1987. “Assessment of Class V Well Injection of Coal Mining Waste intoUnderground Mines in West Virginia.” International Symposium on Class V Injection WellTechnology, Washington, DC, 20-24 September 1987.
Sutter Gold Mining Company. 1998. “Environmental Analysis of Underground Backfilling at the LincolnProject.” Sutter Creek, California. March.
Thomson, B.M. and Heggen, R.J. 1982. Water Quality and Hydrologic Impacts of Dispsoal of UraniumMill tailings by Backfilling. Paper in Management of Wawstes from Uranium Mining and Milling, IAEA,Vienna, Austria, IAE-SM-262/51. pp. 373-384.
Thomson, B.M., Longmire, P.A., and Brookins, D.G. 1986. Geochemical Constraints onUnderground Disposal of Uranium Mill Tailings. Appl. Geochem., v. 1, pp 335-343.
Tg Soda Ash, Inc. 1997. Annual Mining Report, 1996-1997. Appendix C Injection Wells.
September 30, 1999 71
Underground Injection Practices Council Research Foundation. 1988. Proceedings of the InternationalSymposium on Class V Injection Well Technology, Las Vegas, Nevada, 13-15 September, 1988.
U. S. Department of Energy (DOE). 1998a. Injection of FGD Grout to Abate Acid Mine Drainage inUnderground Coal Mines. Project Fact Sheet AR020.1298. Available: http://www.fetc.doe.gov/products/power/enviro/ccb/factshts/factshts.html [February, 1999].
U. S. Department of Energy (DOE). 1998b. Injection of Coal Combustion ByProducts (CCBs) Into theOmega Mine for the Reduction of Acid Mine Drainage. Project Fact Sheet AR022.1298. Available: http://www.fetc.doe.gov/products/power/enviro/ccb/factshts/factshts.html [February 1999]
U.S. EPA. 1984. National secondary drinking water regulations. Publication No. EPA 570/9-76-000.
U.S. EPA. 1992. Integrated Risk Information System (IRIS) Background Document 4: U.S. EPARegulatory Action Summaries. Cincinnati, OH: Office of Research and Development. January.
U.S. EPA. 1993a. Health Advisories for Drinking Water Contaminants. Office of Water HealthAdvisories. Lewis Publishers, Ann Arbor.
U.S. EPA 1993b. 1993 Fossil Fuel Combustion Database. Unpublished. Office of Solid Waste.U.S. EPA. 1995a. Rule Authorization for Basin Resources, Inc. EPA RA File #C05000-03715. October 31, 1995.
U.S. EPA. 1995b. National Primary Drinking Water Regulations Contaminant Specific Fact SheetsInorganic Chemicals - Technical Version. Washington, D.C.: Office of Water, Office of Ground Waterand Drinking Water. EPA 811-95-002-T. http://www.epa.gov/OGWDW/dwh/t-ioc.html. October.
U.S. EPA. 1996. Drinking Water Regulations and Health Advisories. Office of Water. EPA 822-B-96-002.
U.S. EPA. 1998. National primary drinking water regulations. 40 CFR §141.32.
U.S. EPA. 1999a. Integrated Risk Information System (IRIS). Cincinnati, OH: Office of Research andDevelopment, National Center for Environmental Assessment. Available: http://www.epa.gov/ngispgm3/iris/index.html [March].
U.S. EPA. 1999b. National Primary Drinking Water Regulations Technical Fact Sheets. Washington,D.C.: Office of Water, Office of Ground Water and Drinking Water. Available: http://www.epa.gov/OGWDW/hfacts.html [March].
U.S. EPA. 1999c. Sulfate in Drinking Water. Office of Ground Water and Drinking Water. http://www.epa.gov/OGWDW/sulfate.html. April.

September 30, 1999 72
University of Kentucky. 1998. High Volume--High Value Usage of Flue Gas Desulfurization (FGD) By-Products in Underground Mines. Final Technical Report for the period October 1, 1993 to July 31, 1998. U. S. Department of Energy Cooperative Agreement No. DE-FC21-93MC30251. Center for AppliedEnergy Research, Lexington, Kentucky.
Vlasak, P. et al. 1993. “Ash Slurry Behavior in Process of Hydraulic Backfill in Underground Coal Mine.”Slurry Handling and Pipeline Transport 12th International Conference, Brugge, Belgium. September1993.
Walker, J.S. 1993. “State-of-the-act techniques for backfilling abandoned mine voids.” Pittsburgh, PA:U.S. Bureau of Mines.
Whaite, R.H. and A.S. Allen. 1975. “Pumped-Slurry Backfilling of Inaccessible Mine Workings forSubsidence Control.” Washington, DC: U.S. Bureau of Mines.
Whitlatch, E. E., Bair, E. S., Chin, Y. P., Traina, S. J., Walker, H. W., and Wolfe, W. E. 1998. Injectionof FGD Grout to Mitigate Acid Mine Drainage at the Roberts-Dawson Underground Coal Mine,Coshocton and Muskingum Counties, Ohio. Final Report to Ohio Coal Development Office,Department of Development, State of Ohio. Columbus, OH. December, 6, 1998.
Wickersham, Dale B. 1995. Wickersham Consulting. Letter to Beth Goodnough, Rhone-Poulence (nowknown as OCI) of Wyoming. September 29, 1995.
Wyoming. 1996. “Department of Environmental Quality: Groundwater Pollution Control Permit,Authorization to Discharge into Underground Receiver.” Permit #96-201. June 14, 1996.
Wyoming. 1988. “Department of Environmental Quality: Groundwater Pollution Control Permit,Authorization to Discharge into Underground Receivers.” Permit #UIC88-411. October 11, 1988.