Embed Size (px)
Citation preview
studies
380 Public Finance Quarterly 2017/2
TThe collapse of the soviet union laid the foundation for member states and Central and eastern european socialist countries to pass into a period of transition. in spite of expectations, the process was burdened with challenges due to the different economic policies. Nevertheless, accession to various organisations and unions, including the Commonwealth of independent states (Cis), the eurasian economic union, the european union (eu) and the OeCd, has fulfilled the role of strengthening local economies.
Goryunov, Kotlikoff, and Sinelnikov –Murylev (2015) conclude that in the long-term, in-creasing expenditure on social affairs and fall-ing tax revenue from the oil and gas sectors lead to a budget deficit and result in unsta-ble fiscal policy for the Russian economy. The authors believe that the Russian government should find additional sources to finance ris-ing public spending. Goryunov et al. (2013) consider public expenditure to be real debt, and feel that oil and gas revenue represent the main source of covering spending for the Rus-sian economy. it has been conclusively shown (Raudla and Kattel, 2011) that after the 2008
Nijat Huseynov
The Classification of Public Expenditure in Post-Soviet Union States and OECD Member CountriesSummary: Fiscal policy has been an essential tool for world economies, developing countries in particular, in enhancing economic
development. This paper investigates the management of public expenditures in the selected countries, including OECD members
and Post-Soviet states. In essence, these countries have encountered similar economic milestones. The primary goal of this research
is to characterise the fiscal policies of these countries and draw parallels, including the application of correlation analysis between
the expenditure on economic affairs and GDP. Ultimately, the analysis of available data reveals that the distribution and percentage of
public expenditure within GDP have been diversified in the various economic sectors due to different dominant economic activities.
Based on the main results of the cluster analysis, two groups are distinguished: 6 countries in the first group and 9 in the second
group. The expenditure on social affairs has been a priority for both groups. However, the second group of countries have spent more
money on social purposes. The correlation analysis shows that there is a positive linear relationship between expenditure on the
economic affairs and GDP in the past decade in all of the countries selected.
KeywordS: public expenditure, fiscal policy, GDP, OECD, post-Soviet states
JeL CodeS: E62, H50, O10, P20
E-mail address: [email protected]
studies
Public Finance Quarterly 2017/2 381
global financial crisis, estonia cut public ex-penditure and increased tax rates. Kasperowicz (2015) mentions that the global financial cri-sis had a negative impact on the Baltic states’ economies and, as the result, these govern-ments have taken consolidation measures. A recent study by Klyviene (2014) proves that public spending cuts in Baltic states can posi-tively affect output. Grigoli (2012) presents the main feature of fiscal policy in the slovak Republic after the global financial crisis. in his case study, the author concludes that the government tried spending more on social af-fairs in comparison with the eu and OeCd average. Setnikar and Petkovšek (2014) high-light the general situation of the fiscal policy in slovenia. The authors believe that the gov-ernment should balance public finances in or-der to meet the requirements of the eu and to ensure sustainable economic development. transfers from state Oil Fund of the Republic of Azerbaijan to the state budget have ensured immense financial resources to cover pub-lic spending. However, this situation creates fundamental challenges for sustainable fiscal policy and economic growth (Aslanli, 2015). Additionally, the Belarusian government has applied several fiscal policy reforms, however, the levels of transparency are still insufficient (eckardt, Martinez-Vazquez, and timofeev, 2014). Mkhatrishvili and Zedginidze (2015) mention that, after the Rose Revolution and the Russian-Georgian War, fiscal consolida-tion strategy has lead to higher debt and fiscal expansion. Chironachi (2015) considers the cooperation between monetary policy and fis-cal policy to be the key tool in Moldova to en-sure long-term economic stability. Azhgaliyeva (2014) investigates the effects of fiscal policy on the National Fund’s revenue, reserves and public spending in Kazakhstan. in this case study, the author emphasises the importance of fiscal policy in preventing the high volatil-ity of oil revenue.
Abdullaev and Konya (2014) indicate that the transition period in uzbekistan was the main reason for the deterioration of the budget. However, in this study, the authors also conclude that the government has been successful in implementing economic reforms and recommend that the government reduce the tax burden in order to ensure sustainable development. Aleksandrova (2013) is of the opinion that the ukrainian government was unable to develop efficient and effective fis-cal tools. The author believes that fiscal pol-icy should be directed at fostering economic growth. Kazandziska (2015) draws attention to the cut in public expenditure in Poland during the economic decline of 2000/2001 and 2012/2013. Another key conclusion of the study is that compared to other eu mem-ber states, fiscal policy in Poland was less effi-cient. According to Endrit and Drini (2013), fiscal policy in Hungary is connected to po-litical fiscal cycles. Barro and Gordon (1989) found that government consumption could not ensure sufficient stimulus for investment and growth.
The structure of the study is organised as follows. The section on methodology explains the author’s approach to the research. The study then continues with the presentation of the main features of public spending in the selected countries. The next section is devoted to discussing the results of the analysis. Final-ly, the paper concludes with the summary of the analysis and comments pertaining to the various countries.
METHODOlOGy
The study characterises public expenditure in the selected countries through cluster analysis. The main goal of cluster analysis is to identify which objects in a given set are similar (Romesburg, 2004). The author interprets the
studies
382 Public Finance Quarterly 2017/2
share of public expenditure of GdP in each country in order to understand their respective fiscal policy. Furthermore, total expenditure for each country has been broken down into four variables:
•expenditure on general public services•expenditure on defence, public order,
safety, environmental protection•expenditure on economic affairs (agricul-
ture, forestry, fishing and hunting, fuel, energy, mining, manufacturing, construction, transport, communication)
•expenditure on social affairs (housing, community amenities, health, recreation, culture, religion, education, social protec-tion)
in addition, the author has used correlation analysis between expenditure on economic af-fairs and GdP for each country in order to investigate their potential relationship and ef-ficiency.
SElECTED COUnTrIES anD DaTa
The main source of the data is the Government Finance statistics of the iMF. The author has selected 15 countries (OeCd members: Hun-gary, the slovak Republic, slovenia, Poland; Post-soviet union states: Latvia, Lithuania, Azerbaijan, Belarus, Georgia, Kazakhstan, Moldova, the Russian Federation, the ukraine, uzbekistan; Countries that fall into both categories: estonia). The author has used 2013 data for the cluster analysis in order be able to characterise the countries efficiently based on available data. The main indicator for each of the countries is the percentage of GdP. However, the author has used data from 2000 to 2014 for the correlation analysis.
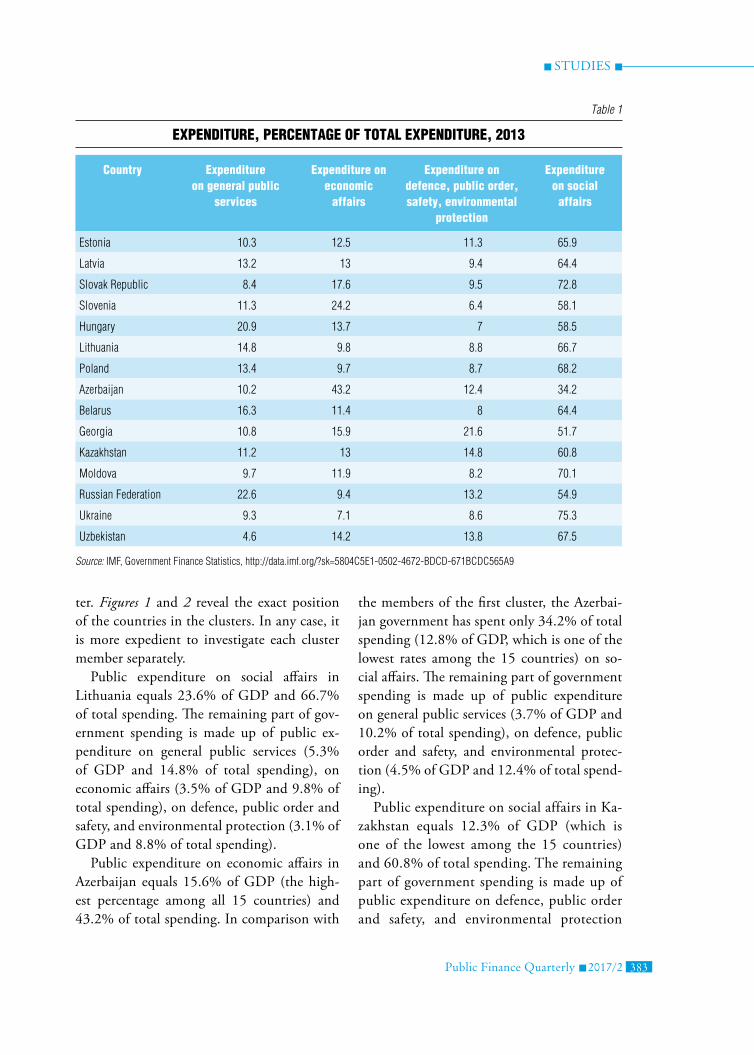
Table 1 shows public expenditure in each country in 2013. The table reveals that ex-penditure on social affairs represented a domi-nant part of public spending for all countries,
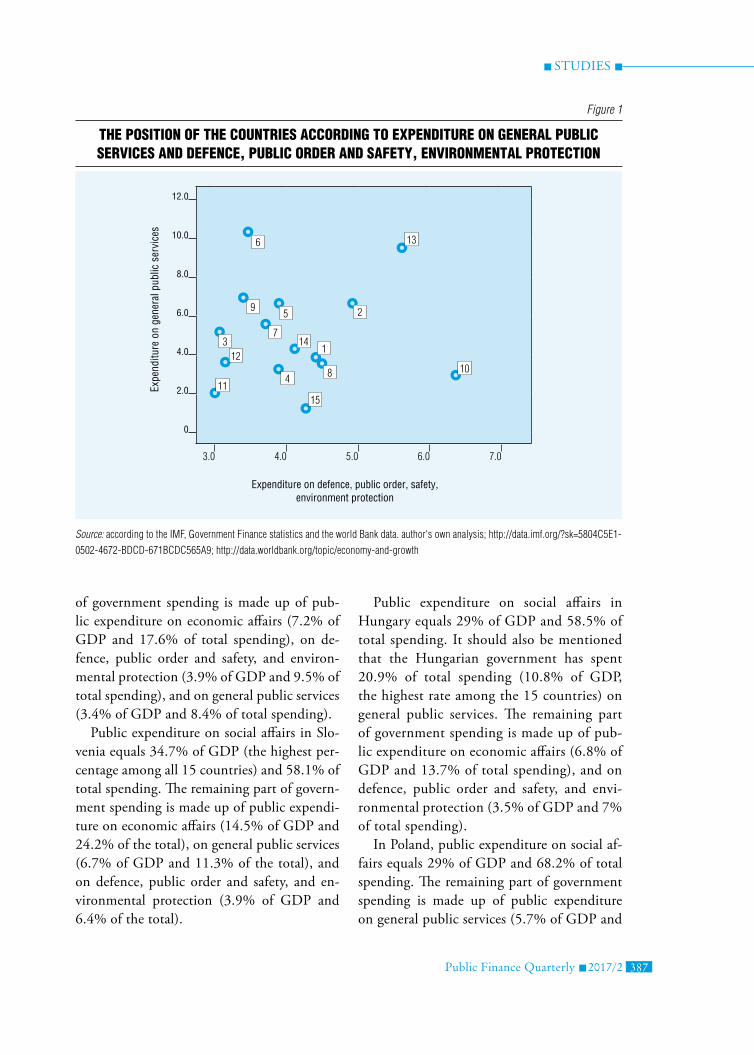
with the exception of Azerbaijan. Further-more, the Russian Federation, Hungary and Belarus have spent the highest percentage of total expenditure on general public services. in contrast, Azerbaijan and Georgia have spent the main part of their public expendi-ture on economic affairs and defence, public order and safety, and environmental protec-tion.
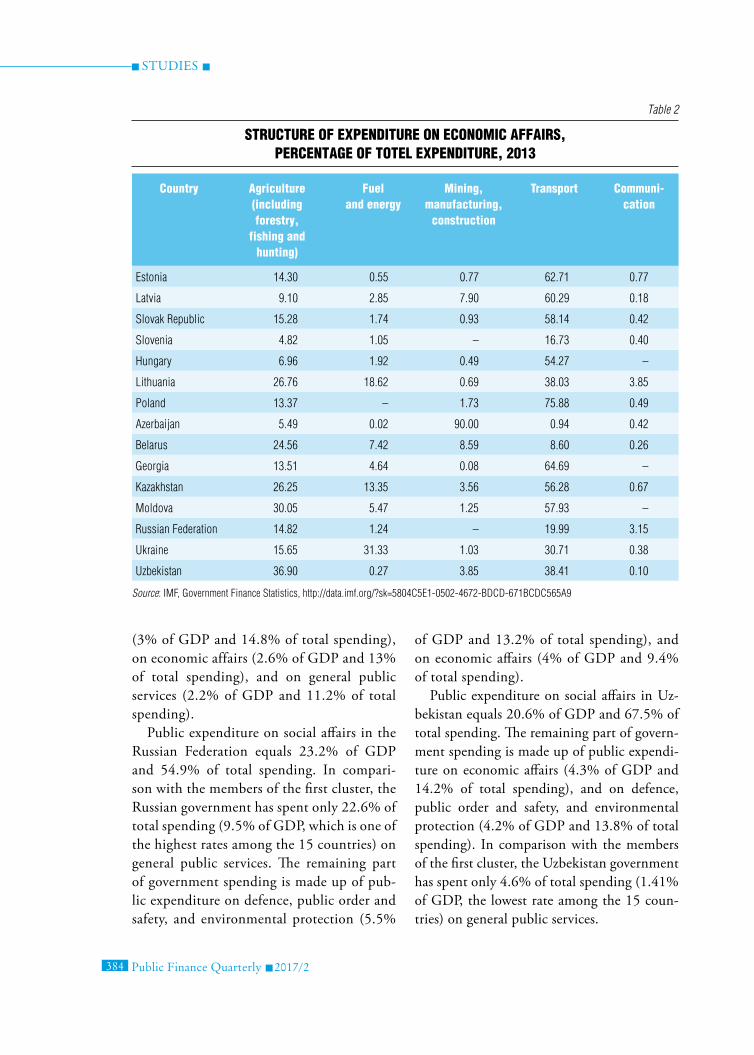
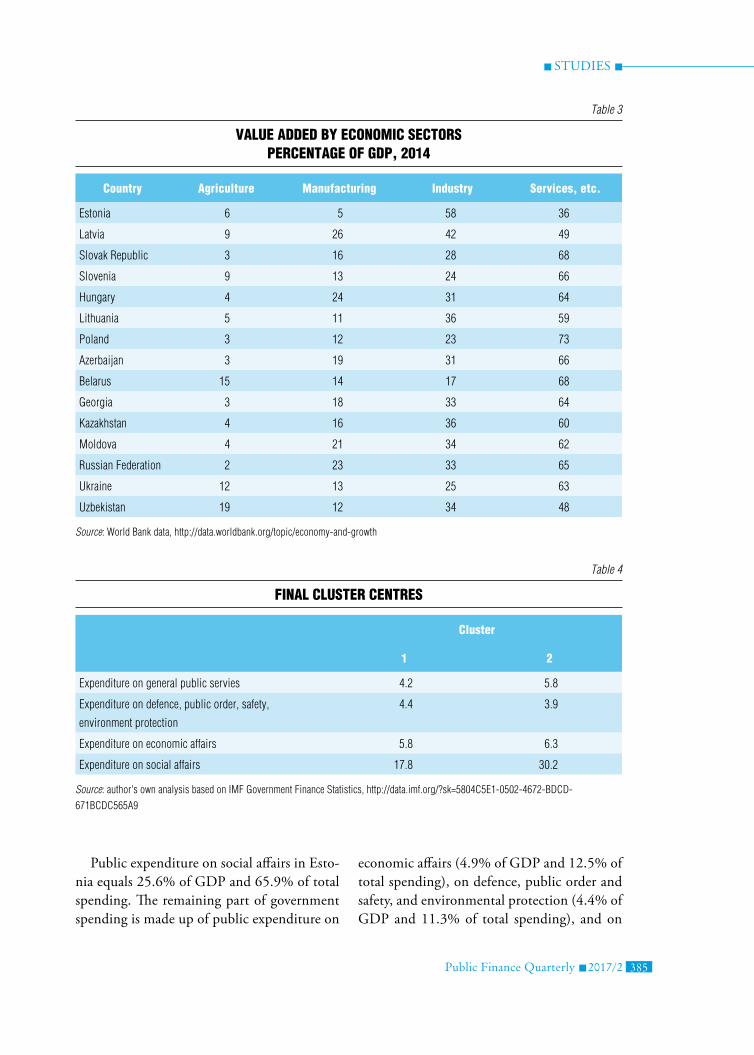
According to Table 2, within expenditure on economic affairs, the iMF takes five main activities into account: agriculture, including forestry, fishing and hunting; fuel and energy; mining, manufacturing and construction; transport; and communication. undoubtedly, the distribution of public spending on eco-nomic affairs varies on account of the different economic potentials in each country. Apart from that, the contribution level of economic sectors has also been varied in each county (see Table 3).
rESUlTS
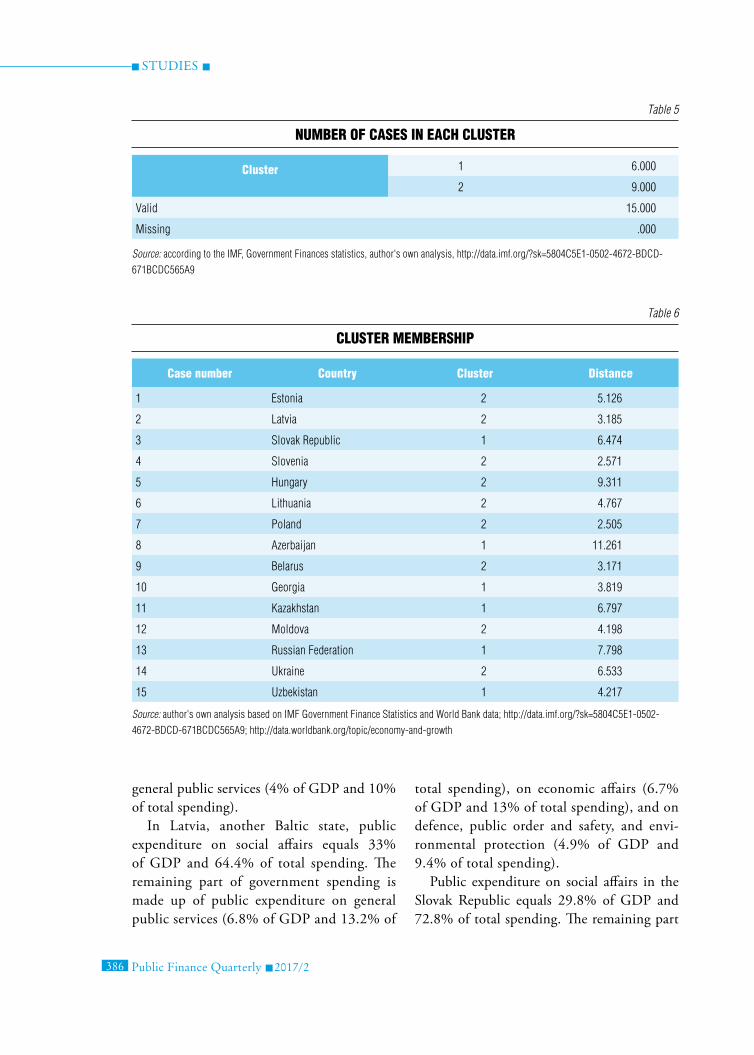
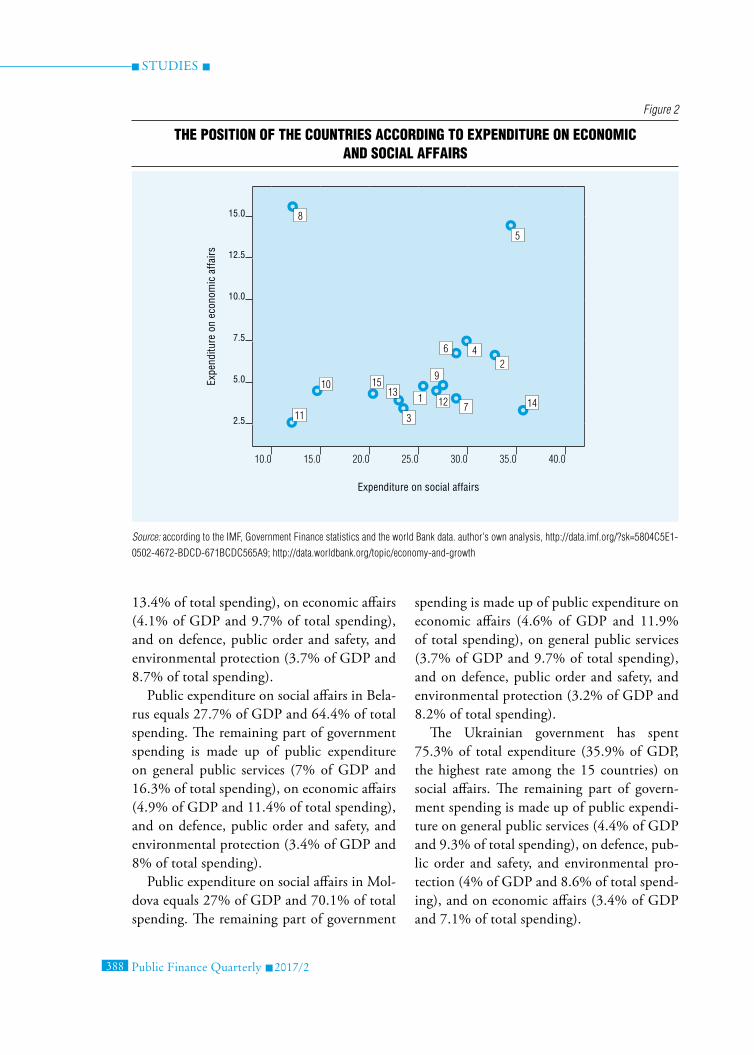
Table 4 identifies final cluster centres for the 15 countries. The countries have been divided to two groups with a 6 to 9 ratio (see Table 5). All in all, the expenditure on social affairs has been a priority for both count-ry groups. However, in the cluster 2, this predominance is greater than in cluster 1 with a value of 30.2. The expenditure on economic affairs represents the second direction for the countries.
Lithuania, Azerbaijan, Georgia, Kazakh-stan, the Russian Federation, uzbekistan are in the first cluster, and estonia, Latvia, the slovak Republic, slovenia, Hungary, Poland, Belarus, Moldova, the ukraine are in the sec-ond cluster (see Table 6). in the case of each country, the distance makes it clear how simi-lar they are to each other or in which range they fall into from the centre point of the clus-
studies
Public Finance Quarterly 2017/2 383
ter. Figures 1 and 2 reveal the exact position of the countries in the clusters. in any case, it is more expedient to investigate each cluster member separately.
Public expenditure on social affairs in Lithuania equals 23.6% of GdP and 66.7% of total spending. The remaining part of gov-ernment spending is made up of public ex-penditure on general public services (5.3% of GdP and 14.8% of total spending), on economic affairs (3.5% of GdP and 9.8% of total spending), on defence, public order and safety, and environmental protection (3.1% of GdP and 8.8% of total spending).
Public expenditure on economic affairs in Azerbaijan equals 15.6% of GdP (the high-est percentage among all 15 countries) and 43.2% of total spending. in comparison with
the members of the first cluster, the Azerbai-jan government has spent only 34.2% of total spending (12.8% of GdP, which is one of the lowest rates among the 15 countries) on so-cial affairs. The remaining part of government spending is made up of public expenditure on general public services (3.7% of GdP and 10.2% of total spending), on defence, public order and safety, and environmental protec-tion (4.5% of GdP and 12.4% of total spend-ing).
Public expenditure on social affairs in Ka-zakhstan equals 12.3% of GdP (which is one of the lowest among the 15 countries) and 60.8% of total spending. the remaining part of government spending is made up of public expenditure on defence, public order and safety, and environmental protection
Table 1
expenditure, percentage of total expenditure, 2013
country expenditure on general public
services
expenditure on economic
affairs
expenditure on defence, public order, safety, environmental
protection
expenditure on social
affairs
Estonia 10.3 12.5 11.3 65.9
latvia 13.2 13 9.4 64.4
Slovak republic 8.4 17.6 9.5 72.8
Slovenia 11.3 24.2 6.4 58.1
Hungary 20.9 13.7 7 58.5
lithuania 14.8 9.8 8.8 66.7
Poland 13.4 9.7 8.7 68.2
azerbaijan 10.2 43.2 12.4 34.2
Belarus 16.3 11.4 8 64.4
Georgia 10.8 15.9 21.6 51.7
Kazakhstan 11.2 13 14.8 60.8
Moldova 9.7 11.9 8.2 70.1
russian Federation 22.6 9.4 13.2 54.9
Ukraine 9.3 7.1 8.6 75.3
Uzbekistan 4.6 14.2 13.8 67.5
Source: IMF, Government Finance Statistics, http://data.imf.org/?sk=5804C5E1-0502-4672-BDCD-671BCDC565a9
studies
384 Public Finance Quarterly 2017/2
(3% of GdP and 14.8% of total spending), on economic affairs (2.6% of GdP and 13% of total spending), and on general public services (2.2% of GdP and 11.2% of total spending).
Public expenditure on social affairs in the Russian Federation equals 23.2% of GdP and 54.9% of total spending. in compari-son with the members of the first cluster, the Russian government has spent only 22.6% of total spending (9.5% of GdP, which is one of the highest rates among the 15 countries) on general public services. The remaining part of government spending is made up of pub-lic expenditure on defence, public order and safety, and environmental protection (5.5%
of GdP and 13.2% of total spending), and on economic affairs (4% of GdP and 9.4% of total spending).
Public expenditure on social affairs in uz-bekistan equals 20.6% of GdP and 67.5% of total spending. The remaining part of govern-ment spending is made up of public expendi-ture on economic affairs (4.3% of GdP and 14.2% of total spending), and on defence, public order and safety, and environmental protection (4.2% of GdP and 13.8% of total spending). in comparison with the members of the first cluster, the uzbekistan government has spent only 4.6% of total spending (1.41% of GdP, the lowest rate among the 15 coun-tries) on general public services.
Table 2
Structure of expenditure on economic affairS, percentage of totel expenditure, 2013
country agriculture (including forestry,
fishing and hunting)
fuel and energy
mining, manufacturing,
construction
transport communi- cation
Estonia 14.30 0.55 0.77 62.71 0.77
latvia 9.10 2.85 7.90 60.29 0.18
Slovak republic 15.28 1.74 0.93 58.14 0.42
Slovenia 4.82 1.05 – 16.73 0.40
Hungary 6.96 1.92 0.49 54.27 –
lithuania 26.76 18.62 0.69 38.03 3.85
Poland 13.37 – 1.73 75.88 0.49
azerbaijan 5.49 0.02 90.00 0.94 0.42
Belarus 24.56 7.42 8.59 8.60 0.26
Georgia 13.51 4.64 0.08 64.69 –
Kazakhstan 26.25 13.35 3.56 56.28 0.67
Moldova 30.05 5.47 1.25 57.93 –
russian Federation 14.82 1.24 – 19.99 3.15
Ukraine 15.65 31.33 1.03 30.71 0.38
Uzbekistan 36.90 0.27 3.85 38.41 0.10
Source: IMF, Government Finance Statistics, http://data.imf.org/?sk=5804C5E1-0502-4672-BDCD-671BCDC565a9
studies
Public Finance Quarterly 2017/2 385
Public expenditure on social affairs in esto-nia equals 25.6% of GdP and 65.9% of total spending. The remaining part of government spending is made up of public expenditure on
economic affairs (4.9% of GdP and 12.5% of total spending), on defence, public order and safety, and environmental protection (4.4% of GdP and 11.3% of total spending), and on
Table 3
Value added by economic SectorS percentage of gdp, 2014
country agriculture manufacturing industry Services, etc.
Estonia 6 5 58 36
latvia 9 26 42 49
Slovak republic 3 16 28 68
Slovenia 9 13 24 66
Hungary 4 24 31 64
lithuania 5 11 36 59
Poland 3 12 23 73
azerbaijan 3 19 31 66
Belarus 15 14 17 68
Georgia 3 18 33 64
Kazakhstan 4 16 36 60
Moldova 4 21 34 62
russian Federation 2 23 33 65
Ukraine 12 13 25 63
Uzbekistan 19 12 34 48
Source: World Bank data, http://data.worldbank.org/topic/economy-and-growth
Table 4
final cluSter centreS
cluster
1 2
Expenditure on general public servies 4.2 5.8
Expenditure on defence, public order, safety,
environment protection
4.4 3.9
Expenditure on economic affairs 5.8 6.3
Expenditure on social affairs 17.8 30.2
Source: author's own analysis based on IMF Government Finance Statistics, http://data.imf.org/?sk=5804C5E1-0502-4672-BDCD-
671BCDC565a9
studies
386 Public Finance Quarterly 2017/2
general public services (4% of GdP and 10% of total spending).
in Latvia, another Baltic state, public expenditure on social affairs equals 33% of GdP and 64.4% of total spending. The remaining part of government spending is made up of public expenditure on general public services (6.8% of GdP and 13.2% of
total spending), on economic affairs (6.7% of GdP and 13% of total spending), and on defence, public order and safety, and envi-ronmental protection (4.9% of GdP and 9.4% of total spending).
Public expenditure on social affairs in the slovak Republic equals 29.8% of GdP and 72.8% of total spending. The remaining part
Table 5
number of caSeS in each cluSter
cluster 1 6.000
2 9.000
Valid 15.000
Missing .000
Source: according to the IMF, Government Finances statistics, author's own analysis, http://data.imf.org/?sk=5804C5E1-0502-4672-BDCD-
671BCDC565a9
Table 6
cluSter memberShip
case number country cluster distance
1 Estonia 2 5.126
2 latvia 2 3.185
3 Slovak republic 1 6.474
4 Slovenia 2 2.571
5 Hungary 2 9.311
6 lithuania 2 4.767
7 Poland 2 2.505
8 azerbaijan 1 11.261
9 Belarus 2 3.171
10 Georgia 1 3.819
11 Kazakhstan 1 6.797
12 Moldova 2 4.198
13 russian Federation 1 7.798
14 Ukraine 2 6.533
15 Uzbekistan 1 4.217
Source: author's own analysis based on IMF Government Finance Statistics and World Bank data; http://data.imf.org/?sk=5804C5E1-0502-
4672-BDCD-671BCDC565a9; http://data.worldbank.org/topic/economy-and-growth
studies
Public Finance Quarterly 2017/2 387
of government spending is made up of pub-lic expenditure on economic affairs (7.2% of GdP and 17.6% of total spending), on de-fence, public order and safety, and environ-mental protection (3.9% of GdP and 9.5% of total spending), and on general public services (3.4% of GdP and 8.4% of total spending).
Public expenditure on social affairs in slo-venia equals 34.7% of GdP (the highest per-centage among all 15 countries) and 58.1% of total spending. The remaining part of govern-ment spending is made up of public expendi-ture on economic affairs (14.5% of GdP and 24.2% of the total), on general public services (6.7% of GdP and 11.3% of the total), and on defence, public order and safety, and en-vironmental protection (3.9% of GdP and 6.4% of the total).
Public expenditure on social affairs in Hungary equals 29% of GdP and 58.5% of total spending. it should also be mentioned that the Hungarian government has spent 20.9% of total spending (10.8% of GdP, the highest rate among the 15 countries) on general public services. The remaining part of government spending is made up of pub-lic expenditure on economic affairs (6.8% of GdP and 13.7% of total spending), and on defence, public order and safety, and envi-ronmental protection (3.5% of GdP and 7% of total spending).
in Poland, public expenditure on social af-fairs equals 29% of GdP and 68.2% of total spending. The remaining part of government spending is made up of public expenditure on general public services (5.7% of GdP and
Figure 1
the poSition of the countrieS according to expenditure on general public SerViceS and defence, public order and Safety, enVironmental protection
Expe
nditu
re o
n ge
nera
l pub
lic s
ervi
ces
12.0
10.0
8.0
6.0
4.0
2.0
0
3.0 4.0 5.0 6.0 7.0
Expenditure on defence, public order, safety, environment protection
Source: according to the IMF, Government Finance statistics and the world Bank data. author's own analysis; http://data.imf.org/?sk=5804C5E1-
0502-4672-BDCD-671BCDC565a9; http://data.worldbank.org/topic/economy-and-growth
5
8
2
10
11
12
3
6
9
7
4
15
14
1
13
studies
388 Public Finance Quarterly 2017/2
13.4% of total spending), on economic affairs (4.1% of GdP and 9.7% of total spending), and on defence, public order and safety, and environmental protection (3.7% of GdP and 8.7% of total spending).
Public expenditure on social affairs in Bela-rus equals 27.7% of GdP and 64.4% of total spending. The remaining part of government spending is made up of public expenditure on general public services (7% of GdP and 16.3% of total spending), on economic affairs (4.9% of GdP and 11.4% of total spending), and on defence, public order and safety, and environmental protection (3.4% of GdP and 8% of total spending).
Public expenditure on social affairs in Mol-dova equals 27% of GdP and 70.1% of total spending. The remaining part of government
spending is made up of public expenditure on economic affairs (4.6% of GdP and 11.9% of total spending), on general public services (3.7% of GdP and 9.7% of total spending), and on defence, public order and safety, and environmental protection (3.2% of GdP and 8.2% of total spending).
The ukrainian government has spent 75.3% of total expenditure (35.9% of GdP, the highest rate among the 15 countries) on social affairs. The remaining part of govern-ment spending is made up of public expendi-ture on general public services (4.4% of GdP and 9.3% of total spending), on defence, pub-lic order and safety, and environmental pro-tection (4% of GdP and 8.6% of total spend-ing), and on economic affairs (3.4% of GdP and 7.1% of total spending).
Figure 2
the poSition of the countrieS according to expenditure on economic and Social affairS
Expe
nditu
re o
n ec
onom
ic a
ffairs
15.0
12.5
10.0
7.5
5.0
2.5
10.0 15.0 20.0 25.0 30.0 35.0 40.0
Expenditure on social affairs
Source: according to the IMF, Government Finance statistics and the world Bank data. author's own analysis, http://data.imf.org/?sk=5804C5E1-
0502-4672-BDCD-671BCDC565a9; http://data.worldbank.org/topic/economy-and-growth
1510
11
13
3
8
5
2
14
46
712
9
1
studies
Public Finance Quarterly 2017/2 389
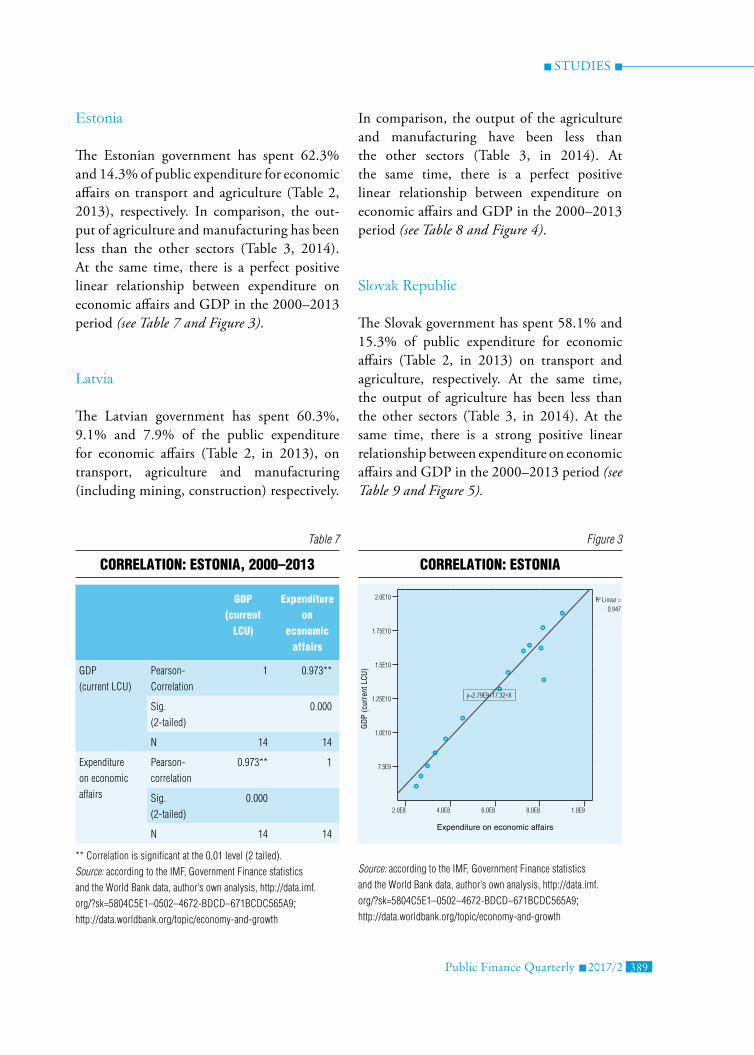
Estonia
The estonian government has spent 62.3% and 14.3% of public expenditure for economic affairs on transport and agriculture (table 2, 2013), respectively. in comparison, the out-put of agriculture and manufacturing has been less than the other sectors (table 3, 2014). At the same time, there is a perfect positive linear relationship between expenditure on economic affairs and GdP in the 2000–2013 period (see Table 7 and Figure 3).
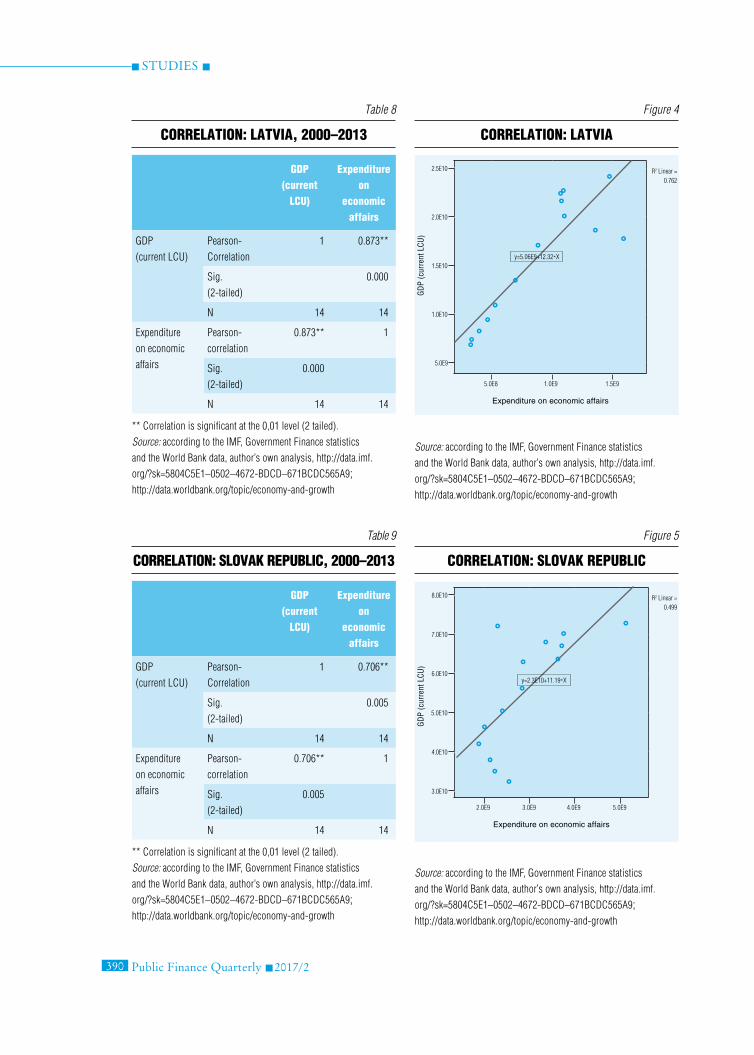
Latvia
The Latvian government has spent 60.3%, 9.1% and 7.9% of the public expenditure for economic affairs (table 2, in 2013), on transport, agriculture and manufacturing (including mining, construction) respectively.
in comparison, the output of the agriculture and manufacturing have been less than the other sectors (table 3, in 2014). At the same time, there is a perfect positive linear relationship between expenditure on economic affairs and GdP in the 2000–2013 period (see Table 8 and Figure 4).
Slovak Republic
The slovak government has spent 58.1% and 15.3% of public expenditure for economic affairs (table 2, in 2013) on transport and agriculture, respectively. At the same time, the output of agriculture has been less than the other sectors (table 3, in 2014). At the same time, there is a strong positive linear relationship between expenditure on economic affairs and GdP in the 2000–2013 period (see Table 9 and Figure 5).
Table 7
correlation: eStonia, 2000–2013
gdp (current
lcu)
expenditure on
economic affairs
GDP
(current lCU)
Pearson-
Correlation
1 0.973**
Sig.
(2-tailed)
0.000
n 14 14
Expenditure
on economic
affairs
Pearson-
correlation
0.973** 1
Sig.
(2-tailed)
0.000
n 14 14
** Correlation is significant at the 0,01 level (2 tailed).
Source: according to the IMF, Government Finance statistics
and the World Bank data, author’s own analysis, http://data.imf.
org/?sk=5804C5E1–0502–4672-BDCD–671BCDC565a9; http://data.worldbank.org/topic/economy-and-growth
Figure 3
correlation: eStonia
Source: according to the IMF, Government Finance statistics
and the World Bank data, author’s own analysis, http://data.imf.
org/?sk=5804C5E1–0502–4672-BDCD–671BCDC565a9; http://data.worldbank.org/topic/economy-and-growth
GD
P (c
urre
nt L
CU)
2.0E10 r2 linear = 0.947
1.75E10
1.5E10
1.25E10
1.0E10
7.5E9
2.0E8 4.0E8 6.0E8 8.0E8 1.0E9
Expenditure on economic affairs
y=2.79E9+17.32*X
studies
390 Public Finance Quarterly 2017/2
Table 8
correlation: latVia, 2000–2013
gdp (current
lcu)
expenditure on
economic affairs
GDP
(current lCU)
Pearson-
Correlation
1 0.873**
Sig.
(2-tailed)
0.000
n 14 14
Expenditure
on economic
affairs
Pearson-
correlation
0.873** 1
Sig.
(2-tailed)
0.000
n 14 14
** Correlation is significant at the 0,01 level (2 tailed).
Source: according to the IMF, Government Finance statistics
and the World Bank data, author’s own analysis, http://data.imf.
org/?sk=5804C5E1–0502–4672-BDCD–671BCDC565a9; http://data.worldbank.org/topic/economy-and-growth
Figure 4
correlation: latVia
Source: according to the IMF, Government Finance statistics
and the World Bank data, author’s own analysis, http://data.imf.
org/?sk=5804C5E1–0502–4672-BDCD–671BCDC565a9; http://data.worldbank.org/topic/economy-and-growth
GD
P (c
urre
nt L
CU)
2.5E10 r2 linear = 0.762
2.0E10
1.5E10
1.0E10
5.0E9
5.0E8 1.0E9 1.5E9
Expenditure on economic affairs
y=5.06E9+12.32*X
Table 9
correlation: SloVak republic, 2000–2013
gdp (current
lcu)
expenditure on
economic affairs
GDP
(current lCU)
Pearson-
Correlation
1 0.706**
Sig.
(2-tailed)
0.005
n 14 14
Expenditure
on economic
affairs
Pearson-
correlation
0.706** 1
Sig.
(2-tailed)
0.005
n 14 14
** Correlation is significant at the 0,01 level (2 tailed).
Source: according to the IMF, Government Finance statistics
and the World Bank data, author’s own analysis, http://data.imf.
org/?sk=5804C5E1–0502–4672-BDCD–671BCDC565a9; http://data.worldbank.org/topic/economy-and-growth
Figure 5
correlation: SloVak republic
Source: according to the IMF, Government Finance statistics
and the World Bank data, author’s own analysis, http://data.imf.
org/?sk=5804C5E1–0502–4672-BDCD–671BCDC565a9; http://data.worldbank.org/topic/economy-and-growth
GD
P (c
urre
nt L
CU)
8.0E10 r2 linear = 0.499
7.0E10
6.0E10
5.0E10
4.0E10
3.0E10
2.0E9 3.0E9 4.0E9 5.0E9
Expenditure on economic affairs
y=2.3E10+11.19*X
studies
Public Finance Quarterly 2017/2 391
Azerbaijan
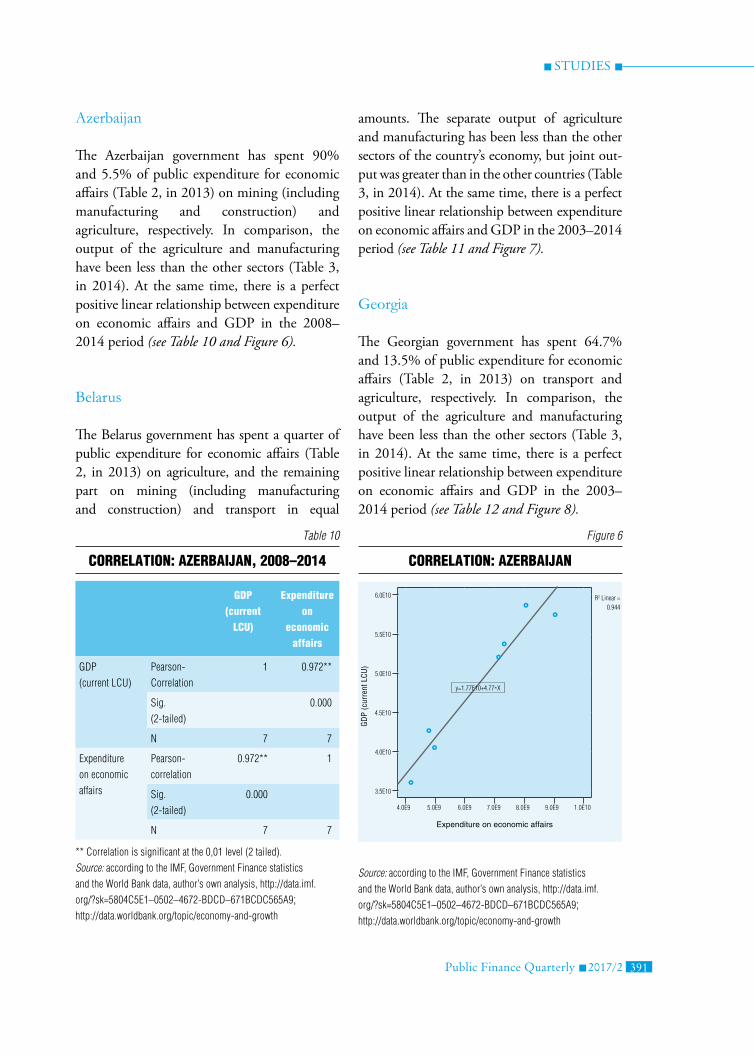
The Azerbaijan government has spent 90% and 5.5% of public expenditure for economic affairs (table 2, in 2013) on mining (including manufacturing and construction) and agriculture, respectively. in comparison, the output of the agriculture and manufacturing have been less than the other sectors (table 3, in 2014). At the same time, there is a perfect positive linear relationship between expenditure on economic affairs and GdP in the 2008–2014 period (see Table 10 and Figure 6).
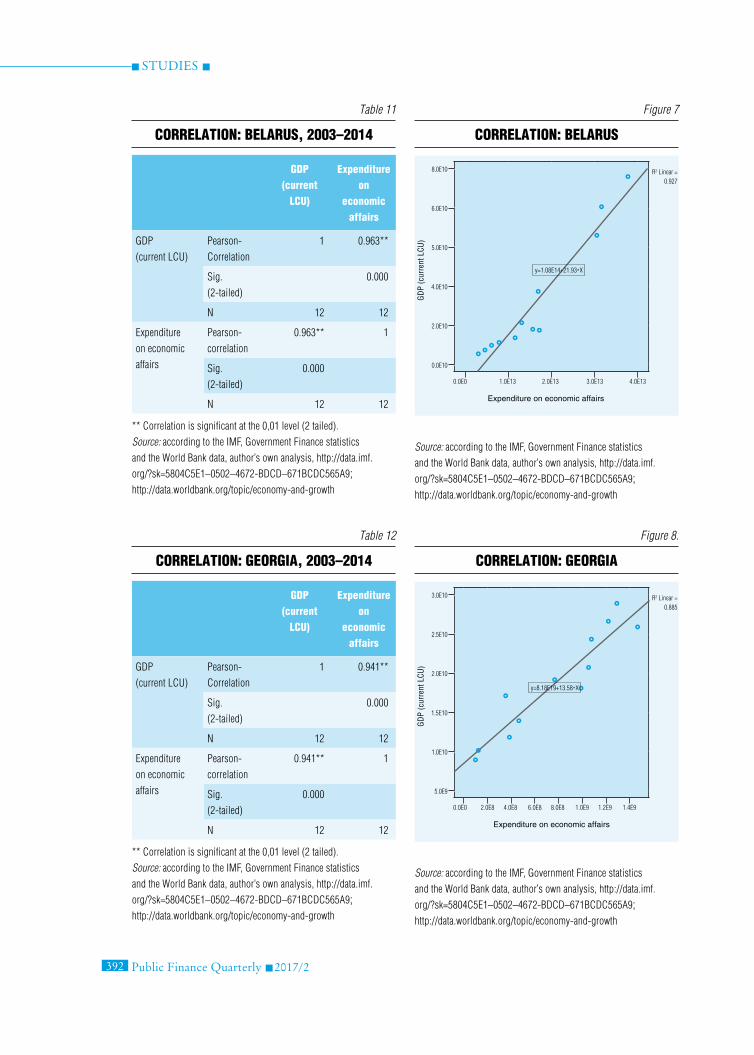
Belarus
The Belarus government has spent a quarter of public expenditure for economic affairs (table 2, in 2013) on agriculture, and the remaining part on mining (including manufacturing and construction) and transport in equal
amounts. The separate output of agriculture and manufacturing has been less than the other sectors of the country’s economy, but joint out-put was greater than in the other countries (table 3, in 2014). At the same time, there is a perfect positive linear relationship between expenditure on economic affairs and GdP in the 2003–2014 period (see Table 11 and Figure 7).
Georgia
The Georgian government has spent 64.7% and 13.5% of public expenditure for economic affairs (table 2, in 2013) on transport and agriculture, respectively. in comparison, the output of the agriculture and manufacturing have been less than the other sectors (table 3, in 2014). At the same time, there is a perfect positive linear relationship between expenditure on economic affairs and GdP in the 2003–2014 period (see Table 12 and Figure 8).
Table 10
correlation: azerbaijan, 2008–2014
gdp (current
lcu)
expenditure on
economic affairs
GDP
(current lCU)
Pearson-
Correlation
1 0.972**
Sig.
(2-tailed)
0.000
n 7 7
Expenditure
on economic
affairs
Pearson-
correlation
0.972** 1
Sig.
(2-tailed)
0.000
n 7 7
** Correlation is significant at the 0,01 level (2 tailed).
Source: according to the IMF, Government Finance statistics
and the World Bank data, author’s own analysis, http://data.imf.
org/?sk=5804C5E1–0502–4672-BDCD–671BCDC565a9; http://data.worldbank.org/topic/economy-and-growth
Figure 6
correlation: azerbaijan
Source: according to the IMF, Government Finance statistics
and the World Bank data, author’s own analysis, http://data.imf.
org/?sk=5804C5E1–0502–4672-BDCD–671BCDC565a9; http://data.worldbank.org/topic/economy-and-growth
GD
P (c
urre
nt L
CU)
6.0E10 r2 linear = 0.944
5.5E10
5.0E10
4.5E10
4.0E10
3.5E10
4.0E9 5.0E9 6.0E9 7.0E9 8.0E9 9.0E9 1.0E10
Expenditure on economic affairs
y=1.77E10+4.77*X
studies
392 Public Finance Quarterly 2017/2
Table 11
correlation: belaruS, 2003–2014
gdp (current
lcu)
expenditure on
economic affairs
GDP
(current lCU)
Pearson-
Correlation
1 0.963**
Sig.
(2-tailed)
0.000
n 12 12
Expenditure
on economic
affairs
Pearson-
correlation
0.963** 1
Sig.
(2-tailed)
0.000
n 12 12
** Correlation is significant at the 0,01 level (2 tailed).
Source: according to the IMF, Government Finance statistics
and the World Bank data, author’s own analysis, http://data.imf.
org/?sk=5804C5E1–0502–4672-BDCD–671BCDC565a9; http://data.worldbank.org/topic/economy-and-growth
Figure 7
correlation: belaruS
Source: according to the IMF, Government Finance statistics
and the World Bank data, author’s own analysis, http://data.imf.
org/?sk=5804C5E1–0502–4672-BDCD–671BCDC565a9; http://data.worldbank.org/topic/economy-and-growth
GD
P (c
urre
nt L
CU)
8.0E10 r2 linear = 0.927
6.0E10
5.0E10
4.0E10
2.0E10
0.0E10
0.0E0 1.0E13 2.0E13 3.0E13 4.0E13
Expenditure on economic affairs
y=1.08E14+21.93*X
Table 12
correlation: georgia, 2003–2014
gdp (current
lcu)
expenditure on
economic affairs
GDP
(current lCU)
Pearson-
Correlation
1 0.941**
Sig.
(2-tailed)
0.000
n 12 12
Expenditure
on economic
affairs
Pearson-
correlation
0.941** 1
Sig.
(2-tailed)
0.000
n 12 12
** Correlation is significant at the 0,01 level (2 tailed).
Source: according to the IMF, Government Finance statistics
and the World Bank data, author’s own analysis, http://data.imf.
org/?sk=5804C5E1–0502–4672-BDCD–671BCDC565a9; http://data.worldbank.org/topic/economy-and-growth
Figure 8.
correlation: georgia
Source: according to the IMF, Government Finance statistics
and the World Bank data, author’s own analysis, http://data.imf.
org/?sk=5804C5E1–0502–4672-BDCD–671BCDC565a9; http://data.worldbank.org/topic/economy-and-growth
GD
P (c
urre
nt L
CU)
3.0E10 r2 linear = 0.885
2.5E10
2.0E10
1.5E10
1.0E10
5.0E9
0.0E0 2.0E8 4.0E8 6.0E8 8.0E8 1.0E9 1.2E9 1.4E9
Expenditure on economic affairs
y=8.18E19+13.58*X
studies
Public Finance Quarterly 2017/2 393
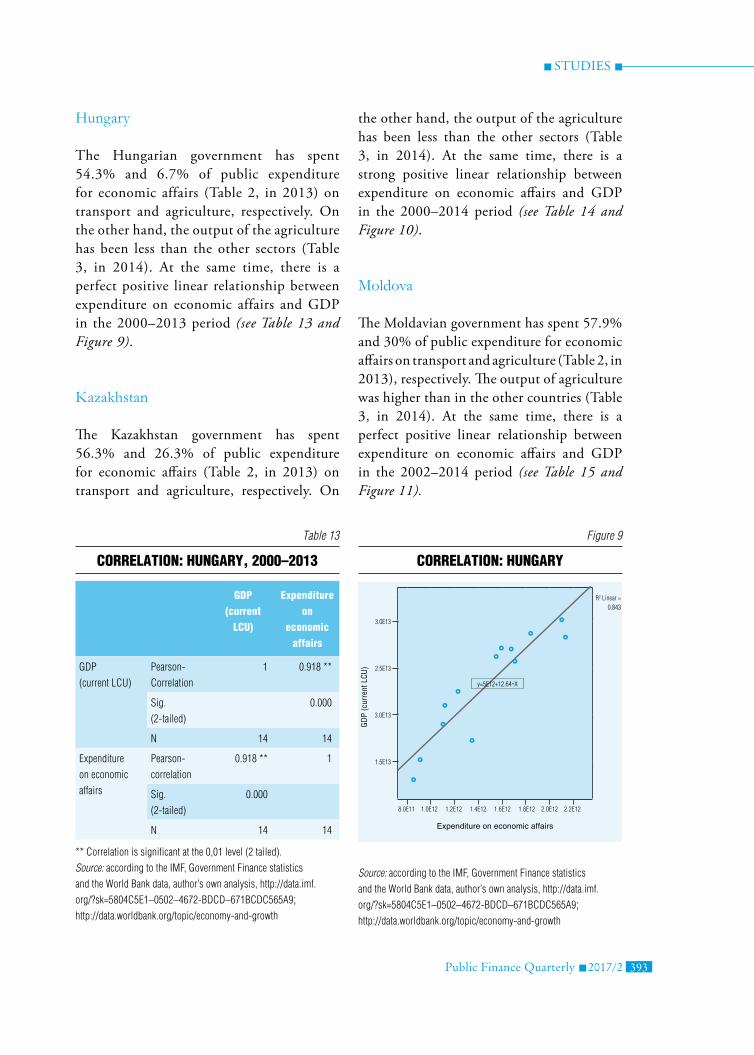
Hungary
the Hungarian government has spent 54.3% and 6.7% of public expenditure for economic affairs (table 2, in 2013) on transport and agriculture, respectively. On the other hand, the output of the agriculture has been less than the other sectors (table 3, in 2014). At the same time, there is a perfect positive linear relationship between expenditure on economic affairs and GdP in the 2000–2013 period (see Table 13 and Figure 9).
Kazakhstan
The Kazakhstan government has spent 56.3% and 26.3% of public expenditure for economic affairs (table 2, in 2013) on transport and agriculture, respectively. On
the other hand, the output of the agriculture has been less than the other sectors (table 3, in 2014). At the same time, there is a strong positive linear relationship between expenditure on economic affairs and GdP in the 2000–2014 period (see Table 14 and Figure 10).
Moldova
The Moldavian government has spent 57.9% and 30% of public expenditure for economic affairs on transport and agriculture (table 2, in 2013), respectively. The output of agriculture was higher than in the other countries (table 3, in 2014). At the same time, there is a perfect positive linear relationship between expenditure on economic affairs and GdP in the 2002–2014 period (see Table 15 and Figure 11).
Table 13
correlation: hungary, 2000–2013
gdp (current
lcu)
expenditure on
economic affairs
GDP
(current lCU)
Pearson-
Correlation
1 0.918 **
Sig.
(2-tailed)
0.000
n 14 14
Expenditure
on economic
affairs
Pearson-
correlation
0.918 ** 1
Sig.
(2-tailed)
0.000
n 14 14
** Correlation is significant at the 0,01 level (2 tailed).
Source: according to the IMF, Government Finance statistics
and the World Bank data, author’s own analysis, http://data.imf.
org/?sk=5804C5E1–0502–4672-BDCD–671BCDC565a9; http://data.worldbank.org/topic/economy-and-growth
Figure 9
correlation: hungary
Source: according to the IMF, Government Finance statistics
and the World Bank data, author’s own analysis, http://data.imf.
org/?sk=5804C5E1–0502–4672-BDCD–671BCDC565a9; http://data.worldbank.org/topic/economy-and-growth
GD
P (c
urre
nt L
CU)
r2 linear = 0.843
3.0E13
2.5E13
3.0E13
1.5E13
8.0E11 1.0E12 1.2E12 1.4E12 1.6E12 1.8E12 2.0E12 2.2E12
Expenditure on economic affairs
y=5E12+12.64*X

studies
394 Public Finance Quarterly 2017/2
Table 14
correlation: kazakhStan, 2000–2014
gdp (current
lcu)
expenditure on
economic affairs
GDP
(current lCU)
Pearson-
Correlation
1 0.766 **
Sig.
(2-tailed)
0.001
n 15 15
Expenditure
on economic
affairs
Pearson-
correlation
0.766** 1
Sig.
(2-tailed)
0.001
n 15 15
** Correlation is significant at the 0,01 level (2 tailed).
Source: according to the IMF, Government Finance statistics
and the World Bank data, author’s own analysis, http://data.imf.
org/?sk=5804C5E1–0502–4672-BDCD–671BCDC565a9; http://data.worldbank.org/topic/economy-and-growth
Figure 10
correlation: kazakhStan
Source: according to the IMF, Government Finance statistics
and the World Bank data, author’s own analysis, http://data.imf.
org/?sk=5804C5E1–0502–4672-BDCD–671BCDC565a9; http://data.worldbank.org/topic/economy-and-growth
GD
P (c
urre
nt L
CU)
4.0E13 r2 linear = 0.586
3.0E13
2.0E13
1.0E13
0.0E0
0.0E0 2.0E11 4.0E11 6.0E11 8.0E11 1.0E12 1.2E12
Expenditure on economic affairs
y=2.43E111+24.48*X
Table 15
correlation: moldoVa, 2002–2014
gdp (current
lcu)
expenditure on
economic affairs
GDP
(current lCU)
Pearson-
Correlation
1 0.951**
Sig.
(2-tailed)
0.000
n 13 13
Expenditure
on economic
affairs
Pearson-
correlation
0.951** 1
Sig.
(2-tailed)
0.000
n 13 13
** Correlation is significant at the 0,01 level (2 tailed).
Source: according to the IMF, Government Finance statistics
and the World Bank data, author’s own analysis, http://data.imf.
org/?sk=5804C5E1–0502–4672-BDCD–671BCDC565a9; http://data.worldbank.org/topic/economy-and-growth
Figure 11
correlation: moldoVa
Source: according to the IMF, Government Finance statistics
and the World Bank data, author’s own analysis, http://data.imf.
org/?sk=5804C5E1–0502–4672-BDCD–671BCDC565a9; http://data.worldbank.org/topic/economy-and-growth
GD
P (c
urre
nt L
CU)
1.2E11 r2 linear = 0.905
1.0E11
8.0E10
6.0E10
4.0E10
2.0E10
0.0E0 2.0E9 4.0E9 6.0E9
Expenditure on economic affairs
y=2.29E10+15.63*X
studies
Public Finance Quarterly 2017/2 395
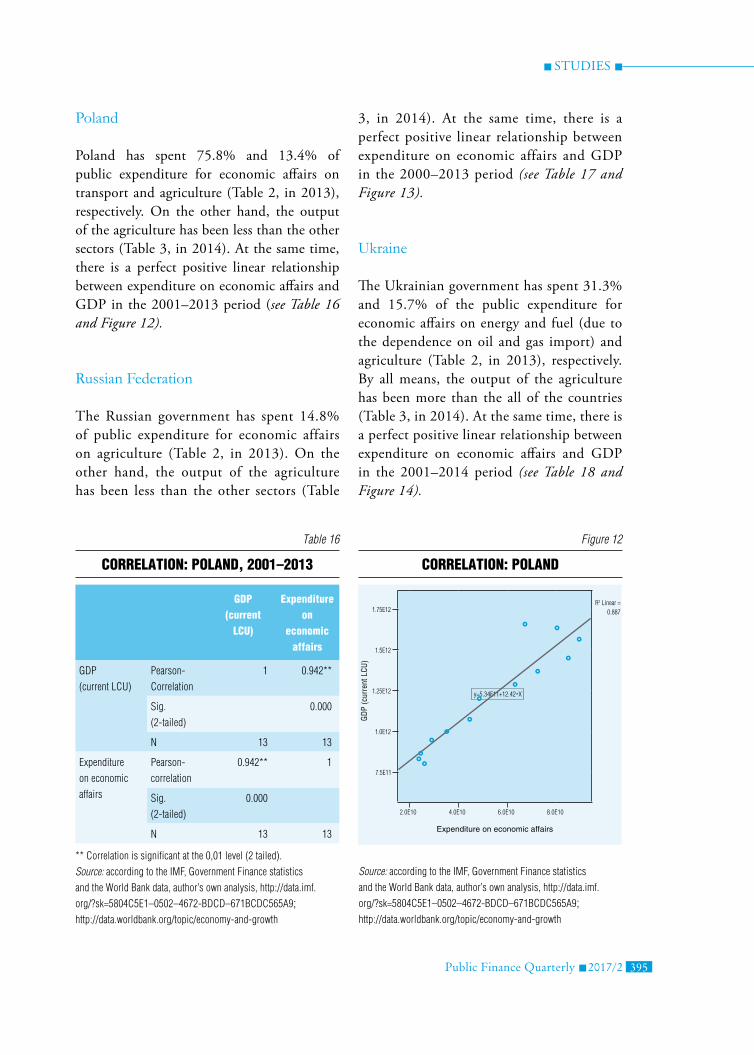
Poland
Poland has spent 75.8% and 13.4% of public expenditure for economic affairs on transport and agriculture (table 2, in 2013), respectively. On the other hand, the output of the agriculture has been less than the other sectors (table 3, in 2014). At the same time, there is a perfect positive linear relationship between expenditure on economic affairs and GdP in the 2001–2013 period (see Table 16 and Figure 12).
Russian Federation
the Russian government has spent 14.8% of public expenditure for economic affairs on agriculture (table 2, in 2013). On the other hand, the output of the agriculture has been less than the other sectors (table
3, in 2014). At the same time, there is a perfect positive linear relationship between expenditure on economic affairs and GdP in the 2000–2013 period (see Table 17 and Figure 13).
Ukraine
The ukrainian government has spent 31.3% and 15.7% of the public expenditure for economic affairs on energy and fuel (due to the dependence on oil and gas import) and agriculture (table 2, in 2013), respectively. By all means, the output of the agriculture has been more than the all of the countries (table 3, in 2014). At the same time, there is a perfect positive linear relationship between expenditure on economic affairs and GdP in the 2001–2014 period (see Table 18 and Figure 14).
Table 16
correlation: poland, 2001–2013
gdp (current
lcu)
expenditure on
economic affairs
GDP
(current lCU)
Pearson-
Correlation
1 0.942**
Sig.
(2-tailed)
0.000
n 13 13
Expenditure
on economic
affairs
Pearson-
correlation
0.942** 1
Sig.
(2-tailed)
0.000
n 13 13
** Correlation is significant at the 0,01 level (2 tailed).
Source: according to the IMF, Government Finance statistics
and the World Bank data, author’s own analysis, http://data.imf.
org/?sk=5804C5E1–0502–4672-BDCD–671BCDC565a9; http://data.worldbank.org/topic/economy-and-growth
Figure 12
correlation: poland
Source: according to the IMF, Government Finance statistics
and the World Bank data, author’s own analysis, http://data.imf.
org/?sk=5804C5E1–0502–4672-BDCD–671BCDC565a9; http://data.worldbank.org/topic/economy-and-growth
r2 linear = 0.887
GD
P (c
urre
nt L
CU)
1.75E12
1.5E12
1.25E12
1.0E12
7.5E11
2.0E10 4.0E10 6.0E10 8.0E10
Expenditure on economic affairs
y=5.34E11+12.42*X

studies
396 Public Finance Quarterly 2017/2
Table 17
correlation: ruSSian fed., 2000–2013
gdp (current
lcu)
expenditure on
economic affairs
GDP
(current lCU)
Pearson-
Correlation
1 0.885**
Sig.
(2-tailed)
0.000
n 14 14
Expenditure
on economic
affairs
Pearson-
correlation
0.885** 1
Sig.
(2-tailed)
0.000
n 14 14
** Correlation is significant at the 0,01 level (2 tailed).
Source: according to the IMF, Government Finance statistics
and the World Bank data, author’s own analysis, http://data.imf.
org/?sk=5804C5E1–0502–4672-BDCD–671BCDC565a9; http://data.worldbank.org/topic/economy-and-growth
Figure 13
correlation: ruSSian federation
Source: according to the IMF, Government Finance statistics
and the World Bank data, author’s own analysis, http://data.imf.
org/?sk=5804C5E1–0502–4672-BDCD–671BCDC565a9; http://data.worldbank.org/topic/economy-and-growth
GD
P (c
urre
nt L
CU)
r2 linear = 0.783
6.0E13
4.0E13
2.0E13
0.0E0
0.0E0 1.0E12 2.0E12 3.0E12 4.0E12 5.0E12 6.0E12
Expenditure on economic affairs
y=1.12E13+13.1*X
Table 18
correlation: ukraine, 2001–2014
gdp (current
lcu)
expenditure on
economic affairs
GDP
(current lCU)
Pearson-
Correlation
1 0.886**
Sig.
(2-tailed)
0.000
n 14 14
Expenditure
on economic
affairs
Pearson-
correlation
0.886** 1
Sig.
(2-tailed)
0.000
n 14 14
** Correlation is significant at the 0,01 level (2 tailed).
Source: according to the IMF, Government Finance statistics
and the World Bank data, author’s own analysis, http://data.imf.
org/?sk=5804C5E1–0502–4672-BDCD–671BCDC565a9; http://data.worldbank.org/topic/economy-and-growth
Figure 14
correlation: ukraine
Source: according to the IMF, Government Finance statistics
and the World Bank data, author’s own analysis, http://data.imf.
org/?sk=5804C5E1–0502–4672-BDCD–671BCDC565a9; http://data.worldbank.org/topic/economy-and-growth
r2 linear = 0.786
GD
P (c
urre
nt L
CU)
1.5E12
1.25E12
1.0E12
7.5E11
5.0E11
2.5E11
0.0E0 2.0E10 4.0E10 6.0E10
Expenditure on economic affairs
y=2.51E10+24.1*X
studies
Public Finance Quarterly 2017/2 397
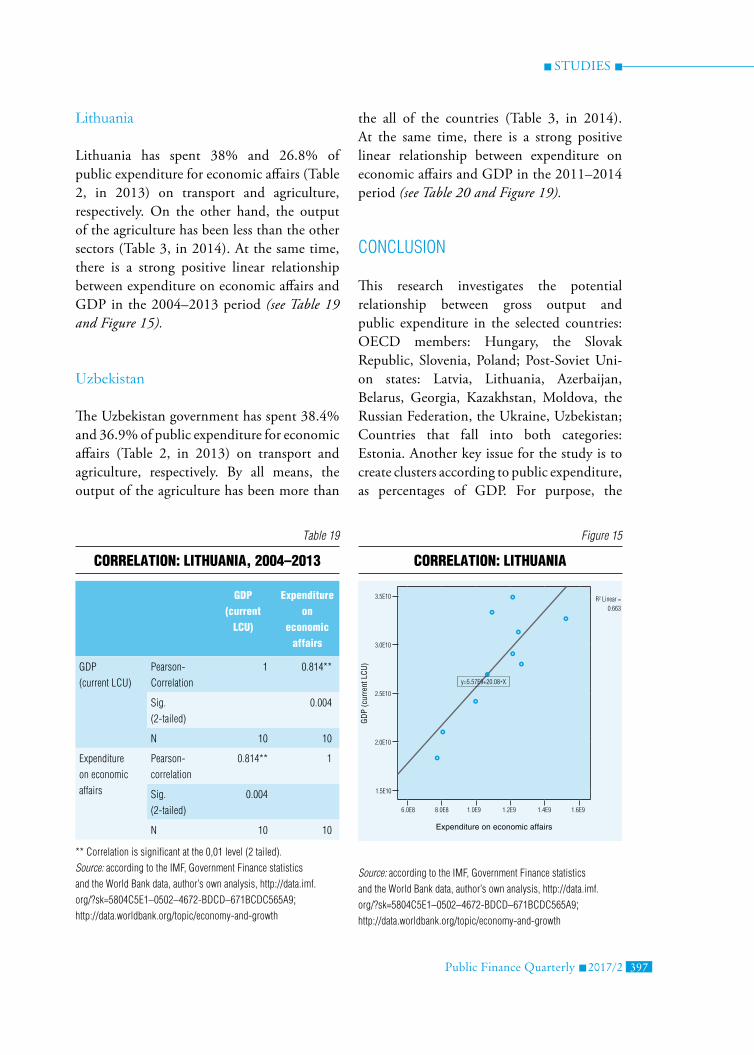
Lithuania
Lithuania has spent 38% and 26.8% of public expenditure for economic affairs (table 2, in 2013) on transport and agriculture, respectively. On the other hand, the output of the agriculture has been less than the other sectors (table 3, in 2014). At the same time, there is a strong positive linear relationship between expenditure on economic affairs and GdP in the 2004–2013 period (see Table 19 and Figure 15).
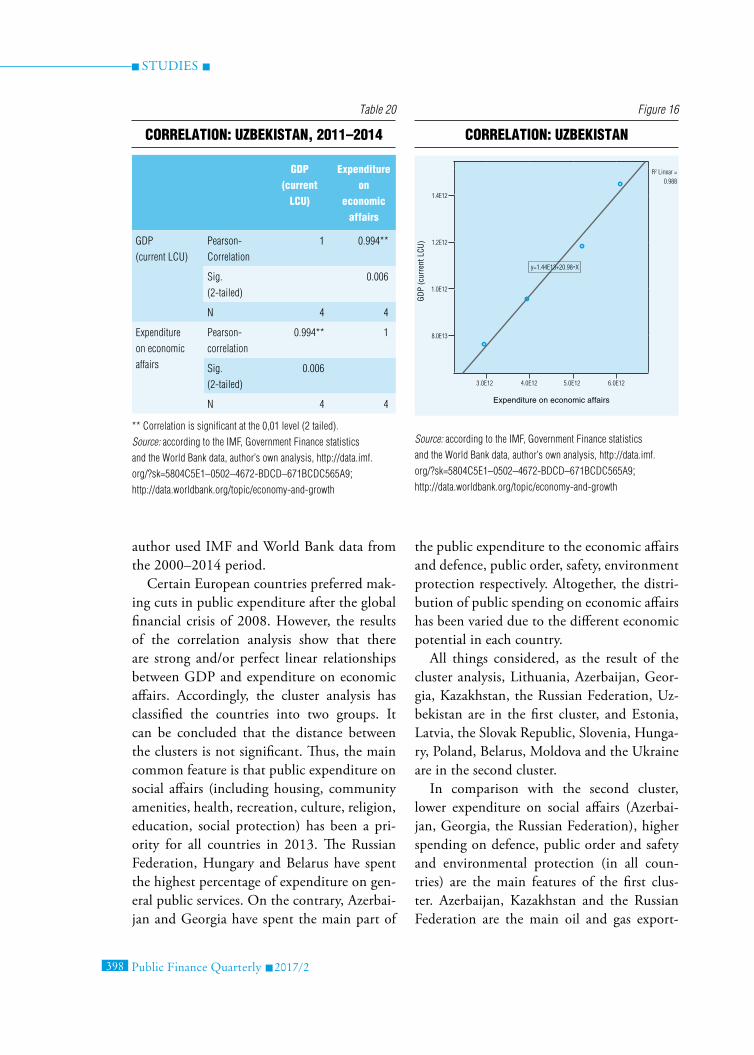
Uzbekistan
The uzbekistan government has spent 38.4% and 36.9% of public expenditure for economic affairs (table 2, in 2013) on transport and agriculture, respectively. By all means, the output of the agriculture has been more than
the all of the countries (table 3, in 2014). At the same time, there is a strong positive linear relationship between expenditure on economic affairs and GdP in the 2011–2014 period (see Table 20 and Figure 19).
COnClUSIOn
This research investigates the potential relationship between gross output and public expenditure in the selected countries: OeCd members: Hungary, the slovak Republic, slovenia, Poland; Post-soviet uni-on states: Latvia, Lithuania, Azerbaijan, Belarus, Georgia, Kazakhstan, Moldova, the Russian Federation, the ukraine, uzbekistan; Countries that fall into both categories: estonia. Another key issue for the study is to create clusters according to public expenditure, as percentages of GdP. For purpose, the
Table 19
correlation: lithuania, 2004–2013
gdp (current
lcu)
expenditure on
economic affairs
GDP
(current lCU)
Pearson-
Correlation
1 0.814**
Sig.
(2-tailed)
0.004
n 10 10
Expenditure
on economic
affairs
Pearson-
correlation
0.814** 1
Sig.
(2-tailed)
0.004
n 10 10
** Correlation is significant at the 0,01 level (2 tailed).
Source: according to the IMF, Government Finance statistics
and the World Bank data, author’s own analysis, http://data.imf.
org/?sk=5804C5E1–0502–4672-BDCD–671BCDC565a9; http://data.worldbank.org/topic/economy-and-growth
Figure 15
correlation: lithuania
Source: according to the IMF, Government Finance statistics
and the World Bank data, author’s own analysis, http://data.imf.
org/?sk=5804C5E1–0502–4672-BDCD–671BCDC565a9; http://data.worldbank.org/topic/economy-and-growth
GD
P (c
urre
nt L
CU)
3.5E10 r2 linear = 0.663
3.0E10
2.5E10
2.0E10
1.5E10
6.0E8 8.0E8 1.0E9 1.2E9 1.4E9 1.6E9
Expenditure on economic affairs
y=5.57E9+20.08*X
studies
398 Public Finance Quarterly 2017/2
author used iMF and World Bank data from the 2000–2014 period.
Certain european countries preferred mak-ing cuts in public expenditure after the global financial crisis of 2008. However, the results of the correlation analysis show that there are strong and/or perfect linear relationships between GdP and expenditure on economic affairs. Accordingly, the cluster analysis has classified the countries into two groups. it can be concluded that the distance between the clusters is not significant. Thus, the main common feature is that public expenditure on social affairs (including housing, community amenities, health, recreation, culture, religion, education, social protection) has been a pri-ority for all countries in 2013. The Russian Federation, Hungary and Belarus have spent the highest percentage of expenditure on gen-eral public services. On the contrary, Azerbai-jan and Georgia have spent the main part of
the public expenditure to the economic affairs and defence, public order, safety, environment protection respectively. Altogether, the distri-bution of public spending on economic affairs has been varied due to the different economic potential in each country.
All things considered, as the result of the cluster analysis, Lithuania, Azerbaijan, Geor-gia, Kazakhstan, the Russian Federation, uz-bekistan are in the first cluster, and estonia, Latvia, the slovak Republic, slovenia, Hunga-ry, Poland, Belarus, Moldova and the ukraine are in the second cluster.
in comparison with the second cluster, lower expenditure on social affairs (Azerbai-jan, Georgia, the Russian Federation), higher spending on defence, public order and safety and environmental protection (in all coun-tries) are the main features of the first clus-ter. Azerbaijan, Kazakhstan and the Russian Federation are the main oil and gas export-
Table 20
correlation: uzbekiStan, 2011–2014
gdp (current
lcu)
expenditure on
economic affairs
GDP
(current lCU)
Pearson-
Correlation
1 0.994**
Sig.
(2-tailed)
0.006
n 4 4
Expenditure
on economic
affairs
Pearson-
correlation
0.994** 1
Sig.
(2-tailed)
0.006
n 4 4
** Correlation is significant at the 0,01 level (2 tailed).
Source: according to the IMF, Government Finance statistics
and the World Bank data, author’s own analysis, http://data.imf.
org/?sk=5804C5E1–0502–4672-BDCD–671BCDC565a9; http://data.worldbank.org/topic/economy-and-growth
Figure 16
correlation: uzbekiStan
Source: according to the IMF, Government Finance statistics
and the World Bank data, author’s own analysis, http://data.imf.
org/?sk=5804C5E1–0502–4672-BDCD–671BCDC565a9; http://data.worldbank.org/topic/economy-and-growth
GD
P (c
urre
nt L
CU)
r2 linear = 0.988
1.4E12
1.2E12
1.0E12
8.0E13
3.0E12 4.0E12 5.0E12 6.0E12
Expenditure on economic affairs
y=1.44E13+20.98*X
studies
Public Finance Quarterly 2017/2 399
ers among the countries examined thus, in light of the above, oil and gas revenues have a substantial impact on their fiscal policy. Accordingly, the Azerbaijan government has spent 43.2% of total expenditure (15.6% of GdP) on economic affairs, particularly min-ing, manufacturing and construction due to its dependence on the oil and gas sectors. in addition, the Russian Federation has spent 22.6% of total expenditure (9.5% of GdP) on general public services on account of huge administrative costs.
in the second cluster, the shares of ex-penditure on social affairs (Latvia, slovenia, the ukraine), on defence, public order and safety, and environmental protection (esto-nia, Latvia, the ukraine), and on economic affairs (slovenia, Hungary, Latvia) as a per-
centage of GdP have been greater than in other countries. Notably, the Hungarian gov-ernment has spent 20.9% of total public ex-penditure (10.4% of GdP) on general public services.
in summary, the selected countries have spent more on social affairs (with some excep-tions), and the relationship between GdP and public expenditure on economic affairs has been strong. However, some of the countries have to decrease public expenditure on gen-eral public services, and have to increase the percentage of expenditure on economic and social affairs (particularly, Azerbaijan, Kazakh-stan and Georgia), and the oil and gas produc-ers (Azerbaijan, Kazakhstan, the Russian Fed-eration) have to diversify the economy with efficient fiscal policy.
Abdullaev, B. – Konya, L. (2014): Growth Maximizing tax Rate for uzbekistan. Applied econometrics and international development, 14(1), pp. 59–72
Aleksandrova, M. (2013): Fiscal policy effects on economic growth. World Applied sciences Jour-nal, 22(7), pp. 964–968
Aslanli, K. (2015): Fiscal sustainability and the state Oil Fund in Azerbaijan. Journal of eurasian studies, 6(2), pp. 114–121
Azhgaliyeva, d. (2014): The effect of fiscal policy on oil revenue fund: The case of Kazakhstan. Journal of eurasian studies, 5(2), pp. 157–183
Barro, R. J. – Gordon, d. B. (1989): Rules, discretion and reputation in a model of monetary policy. Journal of monetary economics, 12(1), pp. 101–121
Chironachi, C. (2015): Monetary and Fiscal Po-licy interaction and the Relationship between the Central Bank and the Government (The Case of Republic of Moldova). Journal of danubian studies and Research, 5(1)
eckardt, s., – Martinez-Vazquez, J. – timofeev, A. (2014): efficiency Cost of Fiscal equalization: The Case of Belarus (Paper No. 1401). international Cent-re for Public Policy, Andrew Young school of Policy studies, Georgia state university
endrit L. – drini i. (2013): searching for Political Fiscal Cycles in Hungary. Contemporary economics, 7(4), pp. 73–98
Goryunov, e., – Kazakova, M., – Kotlikoff, L. J., Mamedov, A., – Nesterova, K., – Nazarov, V., – Grishina, e., – trunin, P. – shpenev, A. (2013): Russia’s fiscal gap (No. 19608). National Bureau of economic Research
References
studies
400 Public Finance Quarterly 2017/2
Goryunov, e., – Kotlikoff, L. – sinelnikov-Murylev, s. (2015): The fiscal gap: An estimate for Russia. Russian Journal of economics, 1(3), pp. 240–256
Grigoli, F. (2012): Public expenditure in the slovak Republic: Composition and technical efficiency
Касперовіч-Степієн, А. (2015): Fiscal con-solidation in the Baltic states. Фінансово-кредитна діяльність: проблеми теорії та практики, (1), pp. 116–122
Kazandziska, M. (2015): Macroeconomic policy regime in Poland (No. 59/2015)
Klyvienė, V. (2014): Macroeconomic effects of fiscal policy in Lithuania, Latvia and estonia (doctoral dissertation, Vilnius university)
Mkhatrishvili, s. – Zedginidze, Z. (2015): Modeling Macro-Fiscal interlinkages: Case of Geor-gia. Central european Journal of economic Modelling and econometrics, 7(1), pp. 15–41
Raudla, R. – Kattel, R. (2011): Why did estonia choose fiscal retrenchment after the 2008 crisis? Jour-nal of public policy, 31(02), pp. 163–186
Romesburg, C. (2004): Cluster analysis for researchers. https://books.google.hu/books?hl=en&lr=&id=ZuiPv7OKm10C&oi=fnd&pg=PR5&dq=cluster+analysis&ots=7eVi2g66b&sig=lbWi73KCReeitbkuYALd12NoP3A&redir_esc=y#v=onepage&q=cluster%20analysis&f=false 01.06.2016
setnikar, C. s. – Petkovšek, V. (2014): Fiscal instability in slovenia during the economic Crisis. Zagreb international Review of economics and Business, 17(1), pp. 95–105
iMF (2014): Government Finance statistics http://data.imf.org/?sk=5804C5e1–0502–4672-BdCd–671BCdC565A9 01.06.2016
World Bank (2014): http://data.worldbank.org/topic/economy-and-growth 01.06.2016