Embed Size (px)
Citation preview

The Clients’ Perceptions of the UK as a Business Location and
the Services of UK Trade and Investment
Merituuli Iisalo
Bachelor‟s Thesis
DP in International Business
2010
Abstract DP in International Business
Authors Merituuli Iisalo
The title of your thesis The Clients‟ Perceptions of the UK as a Business Location and the Services of UK Trade and Investment
Number of pages and appendices 69 + 30
Supervisors Irma Pulkkinen
The first objective of this study is to discover how Finnish companies, which are interested in investing to the UK, perceive the UK as a business location. Another objective is to research how the companies perceive the services of UK Trade and Investment. The study is conduct-ed for UK Trade & Investment (later UKTI), which is a government based promotion organi-zation that operates internationally and offers assistance for companies, which wish to trade with the UK. The theoretical framework is divided under two main issues: Foreign target market and service marketing. The foreign target market part concentrates on understanding different factors, which companies evaluate when they are trying to find a correct location to set up their busi-ness. Factors that relate on the companies‟ own strengths and abilities to expand abroad are set aside and the concentration is specifically in the UK factors. The service marketing part researches different aspects, which comprise the service in the minds of the customers. By knowing how the customers observe these aspects, it is possible to get to know how the cus-tomers evaluate the service, and understand which the service‟s strengths and weaknesses are. The analytical approach is deductive and the research method for collecting primary data was quantitative. Data was collected through a structured online questionnaire, which was sent to 77 UKTI‟s clients in March 2010. The questionnaire was open for three weeks. During this time two reminding emails were sent and phone calls were made to encourage the clients to answer. The potential respondent group was challenging, and thus, the response rate is 17%. The findings indicate the investors perceive the UK as a rather favourable business location. The businesses situate close to their customers in the UK, and the investors believe in the UK‟s growth potential and have confidence in their investments. The social and cultural envi-ronment attracts the Finnish investors, as well as the labour law. The investors seem to con-sider the UK as a stable legal environment, but the investors are not convinced about the eco-nomic stability. Operating costs and productivity are the least favourable factors in the market. The respondents evaluate communications and technology, transport infrastructure, and level of research and development relatively low. Responsiveness, reliability and assurance are the most significant dimensions for the clients in UKTI‟s services, and the clients evaluate UKTI‟s services relatively high, especially in these factors. UKTI should contact their past clients and keep contact with their current clients, as 85% of the respondents consider they would like to receive information from UKTI also in the future.
Key words Business location, target market, services marketing, service quality, UK

Table of contents
1 Introduction .................................................................................................................... 1
1.1 Objectives and research questions ..................................................................... 1
1.2 Methodology ......................................................................................................... 2
1.3 UK Trade & Investment ..................................................................................... 3
1.4 Structure ................................................................................................................ 4
2 Foreign target market .................................................................................................... 5
2.1 Legal and political environment ......................................................................... 5
2.1.1 Stability ...................................................................................................... 5
2.1.2 Intellectual property ................................................................................ 6
2.2 Economic environment....................................................................................... 7
2.2.1 Stability ...................................................................................................... 7
2.2.2 Tax system ................................................................................................ 8
2.2.3 Incentives .................................................................................................. 9
2.2.4 Private capital ........................................................................................... 9
2.2.5 Labour ..................................................................................................... 10
2.2.6 Productivity ............................................................................................ 12
2.2.7 Quality of life ......................................................................................... 12
2.2.8 Operating costs ...................................................................................... 13
2.2.9 Market access ......................................................................................... 13
2.2.10 Gateway to other important trade areas ............................................ 14
2.2.11 Growth potential ................................................................................... 14
2.3 Social and cultural environment ....................................................................... 15
2.3.1 Elements of culture ............................................................................... 15
2.3.2 Location image....................................................................................... 17
2.3.3 Business climate ..................................................................................... 18
2.4 Technological environment .............................................................................. 18
2.4.1 Information, communications and technology ................................. 18
2.4.2 Transport ................................................................................................ 19

2.4.3 Research and development .................................................................. 19
2.5 Business environment ........................................................................................ 20
2.5.1 Proximity to industry clusters .............................................................. 20
2.5.2 Proximity to suppliers, resources and clients .................................... 20
2.6 Framework: Factors foreign investors are interested in a host country ..... 21
3 Service marketing ......................................................................................................... 23
3.1 Factors influencing on customer satisfaction ................................................. 23
3.1.1 Service features ...................................................................................... 23
3.1.2 Emotions ................................................................................................ 24
3.1.3 Attributions for service success or failure ......................................... 24
3.1.4 Perceptions of equity and fairness ...................................................... 24
3.1.5 Others‟ opinions .................................................................................... 25
3.2 Impacts of customer satisfaction ..................................................................... 25
3.2.1 Word of mouth ...................................................................................... 25
3.2.2 Loyalty ..................................................................................................... 25
3.3 Service quality ..................................................................................................... 26
3.3.1 Reliability ................................................................................................ 26
3.3.2 Responsiveness ...................................................................................... 27
3.3.3 Assurance ................................................................................................ 28
3.3.4 Empathy ................................................................................................. 28
3.3.5 Tangibles ................................................................................................. 29
3.4 Framework: Service satisfaction and quality .................................................. 30
4 Research methods ........................................................................................................ 31
4.1 Data collection .................................................................................................... 31
4.2 Validity ................................................................................................................. 33
4.3 Reliability ............................................................................................................. 34
5 Findings ......................................................................................................................... 36
5.1 Demographics of the respondents .................................................................. 36
5.1.1 Main industries ....................................................................................... 36
5.1.2 Size ........................................................................................................... 37
5.1.3 Turnover ................................................................................................. 37

5.1.4 Time in business .................................................................................... 38
5.1.5 The position of the respondent ........................................................... 39
5.1.6 Time of the market entry into the UK market ................................. 39
5.1.7 Investment sums into the UK market ................................................ 40
5.1.8 Business structure in the UK ............................................................... 40
5.1.9 Preferred locations for business .......................................................... 41
5.1.10 Last time of contact with UK Trade and Investment ...................... 42
5.2 UK as a business location by the client companies ....................................... 43
5.2.1 Political and legal factors ...................................................................... 43
5.2.2 Economic factors .................................................................................. 44
5.2.3 Social and cultural factors .................................................................... 47
5.2.4 Technological factors ............................................................................ 48
5.2.5 Business related factors ........................................................................ 49
5.2.6 Challenging factors in the UK market ............................................... 50
5.3 Companies‟ perception of operating in the UK now and in the future ..... 52
5.4 Service quality of UK Trade and Investment according to the clients ...... 53
5.4.1 Reliability ................................................................................................ 54
5.4.2 Responsiveness ...................................................................................... 55
5.4.3 Assurance ................................................................................................ 56
5.4.4 Empathy ................................................................................................. 57
5.4.5 Tangibles ................................................................................................. 58
5.4.6 Attribution of service success .............................................................. 59
5.5 UK related information UKTI‟s clients are interested in receiving ............ 60
6 Summary and conclusion ............................................................................................ 62
6.1 The UK as a business location ......................................................................... 63
6.2 The services of UK Trade and Investment .................................................... 64
6.3 Conclusion and suggestions for further research .......................................... 65
Bibliography ....................................................................................................................... 67
Appendices ......................................................................................................................... 70
Appendix 1. Adaptation of the SERVPERF scale to UKTI related statements 70

Appendix 2. Questionnaire overlay matrix .............................................................. 72
Appendix 3. Survey cover letter ................................................................................. 73
Appendix 4. Survey reminder 1 ................................................................................. 74
Appendix 5. Survey reminder 2 ................................................................................. 75
Appendix 6. Questionnaire ......................................................................................... 76
Appendix 7. Results of the questionnaire ................................................................ 86

1
1 Introduction
The United Kingdom has been able to create hundreds of thousands of work places and to
strengthen its economic growth through direct investments. Assumptions why the UK has
attracted Finnish investors are based on its strong market potential, culture and opportunities.
According to Office for National Statistics (2009), the UK is a country of 61 million people.
Inhabitants come from different backgrounds and they are open to try new products and ser-
vices. Finnish people can adapt English language and culture rather easily. Opportunities to
use the UK as a gateway to different countries are wide.
UK Trade & Investment (later UKTI) is a government based promotion agency, which oper-
ates internationally and offers assistance for companies, which wish to trade with the UK. The
study is conducted particularly for Inward Investment Team of UKTI that assists Finnish
companies especially in foreign direct investments to the UK. UKTI is concentrated on assist-
ing three target groups, which are in different stages in internationalization processes. New
investors are the largest customer group that has got the main attention in the recent years.
Other focus groups are the companies, which have invested to the UK during the past 1-3
years, and the companies, that have been operating in the UK more than three years.
UK Trade and Investment has not conducted similar research, which would have gathered
knowledge of the clients‟ opinions of the UK market nor UKTI‟s services. Lack of knowledge
of the customer groups is disadvantageous, as the satisfaction of UKTI‟s clients may affect on
their investment decisions. Knowing the clients‟ opinions means UKTI could deliver the most
valuable information for the clients in the most efficient way. There have been conducted two
studies though, which triggered off the topics for this study. In Germany, UK Trade and In-
vestment made a research in 2008, which dealt the perceptions of German decision makers
about the UK as a business location. In 2006-2007, UKTI conducted a study, which concen-
trated on researching what kind of information Finnish companies found important to receive
related to the UK market through UKTI‟s periodical newsletter.
1.1 Objectives and research questions
The purpose of this study is twofold: The first objective is to gather knowledge of which fac-
tors in the UK market attract Finnish companies to choose the UK as a business location. The
second objective is to identify opinions of the client companies about the services of a promo-

2
tional agency, UK Trade and Investment, which assists the companies to make investments to
the UK.
The main research questions are:
– How is the UK considered as a business location by the clients of UK Trade & Invest-
ment?
– How do the companies perceive the services of UK Trade and Investment?
The main research question is expanded into three sub questions contributing the research
problems. They are:
– What are the pros and cons of the UK market for foreign investors?
– What is the perception of the companies of operating in the UK market area now and in
the future?
– How UKTI has succeeded in delivering its service?
1.2 Methodology
Theoretical part defines conceptual frameworks for both subjects of the study that need to be
taken into consideration to solve the research questions. First part of the theory discusses of
location factors, which are important especially for foreign investors when investing abroad.
The second theoretical part discusses of issues related to customer satisfaction, and especially
to the service quality. It is essential to know all the relevant factors, which customers use to
base their evaluations of service. Thus it is possible to discover how the clients perceive the
services of UKTI. As the relevant factors are defined in the theory, it is possible to research,
how the UK is considered as a business location, and how the offered service of UKTI meets
the customer needs and expectations.
The research method is quantitative. Quantitative method was chosen as it was considered
important to be able to draw conclusions, which would generalize UKTI‟s customer base
within eligible time frame and resources set for the thesis. The research was conducted by
collecting primary data through online surveying with Webropol tool. Self-complete question-
naires, which mainly included closed questions, were sent to 77 clients‟ email addresses. The
questionnaires, which were received back in 18 days, were analysed through a statistical analy-

3
sis with SPSS tool. The conclusions were drawn to reflect the central issues, which were dis-
covered through the submitted responses.
1.3 UK Trade & Investment
Parent departments of promotion agency, UK Trade & Investment, are Foreign and Com-
monwealth Office and the Department for Business, Innovation and Skills of the United
Kingdom, of which UKTI receives most of its funding. There are a number of local offices in
the UK and over 150 offices are overseas. One of the offices is situated in Helsinki. The total
number of employees is around 2500. (UKTI 2009.)
UKTI has been in Finland since 2003. The study is made especially for Inward Investment
Team that assists Finnish companies for free of charge. The team assists companies no matter
of their size and experience in the UK market, however most of the customers are small and
medium-sized companies and the main concern of UKTI is to promote foreign direct invest-
ments (later FDI). (UKTI 2008, 11-12, 14). There are two employees in the Inward Invest-
ment Team and the team‟s main budget, the marketing budget, is GPB£ 23500 (Aaltonen, M.
16.12.2009).
UKTI generates the UK investment activity by performing several supporting tasks. The team
provides advice on where and how business can be set up. One of the essential tasks of the
team is to provide required market entry data, and thorough and tailored information of re-
search and development, taxation, human capital, administrative regulations, and other legal
and financial matters, which are vital to take into account. In practice, UKTI does not con-
clude entire market research for individual companies, but advices with it. UKTI helps busi-
nesses to tackle cultural and language related issues to ease communication. The team helps
companies to network by introducing professional advisers and important contacts. UKTI
works in a partnership with Regional Development Agencies and the Devolved Administra-
tions in Scotland, Wales and Northern Ireland. Furthermore, UKTI is able to offer access to
the UK Advisory Network, where can be found a list of professional service organizations,
such as lawyers and accountants. The team can identify UK firms as for potential business
partners, and help in other practical things, such as selecting suitable trade fairs, making visits
to expedient locations and assist in accessing financial incentives and private funding. In addi-
tion, UKTI offers aftercare service for investors, who have questions about their foreign lo-
cated investment. The team monitors FDI activities and promotes UK‟s strengths and in-
vestment opportunities. (UKTI 2009; UKTI 2008, 4, 11.)
4
1.4 Structure
The introduction part introduces the purpose and aim of the study as well as the case compa-
ny, UK Trade and Investment. The theoretical discussion is divided under two subjects, and
thus there will be two theoretical frameworks. Chapter two includes theory about the location
factors, and Chapter three investigates service marketing and customer satisfaction by concen-
trating on service quality. Section four introduces the research methods, workflow of the re-
search, and design of the survey as well as the validity and reliability discussion. Chapter five
presents findings of the research, and connects them to the introduction, theory and practice.
Section six reviews and concludes the outcomes, and provides recommendations.

5
2 Foreign target market
The first part of the theoretical presentation focuses on a research of a foreign target market.
This study is concentrated mostly on factors in the macroeconomic, as the aim is to find out
perceptions of the UK market rather than how businesses manage their internationalization
processes by their own. International business literature and UKTI‟s knowledge about the UK
market and its clients have been explored widely to ensure the most relevant factors, which
investors are interested in when expanding to the UK, are included in the theoretical part of
the foreign target market. The factors that may be the reasons why companies are interested
to conduct a foreign direct investment in a specific market often include also downsides. If the
downsides dominate the factors, this lowers the attractiveness of a specific foreign investment
location and may hinder conducting or expanding the foreign investments.
2.1 Legal and political environment
Political and legal forces rule how business can be conducted. EU countries are affected by
legislation at EU and national levels, but national laws create inconsistencies between coun-
tries. EU regulations are affective on every member state, and directives are binding only if the
member state enacts the law in line with the directive. (Jobber 2010, 73.)
The UK has a common law system, which differs from civil law used in continental Europe.
In a common-law country business contracts must be written in detail and many disputes are
decided by reliance on the authority of earlier judicial cases. In a civil-law country law is writ-
ten in broad general terms and disputes can be solved only by referring directly to law. (Kee-
gan & Green 2008, 155.)
2.1.1 Stability
Political stability is highest in countries, which have stable and consistent history (Hollensen
2007, 188). Managers should monitor information regarding the government, its policies, and
overall stability of the country to foresee potential political changes and risks for the business
(Czinkota & Ronkainen 2010, 134). According to Hollensen (2007, 195) political risk analysis
includes three steps: First, relevant issues and their importance to the firm should be assessed;
second, potential political events should be assessed; and third, political risks should be ad-
dressed by building relationships with government, customers, employees and the local com-

6
munity. Unfortunately, managers often fail to understand issues related to political risks, be-
cause they do not have background with political studies (Keegan & Green 2008, 149).
Business can be exposed to a risk of loss due to a political risk relating to a domestic policy or
risk relating to domestic affairs. There are three main political risks: Ownership risk, which
exposes property and life; operating risk, which relates to ongoing operations of the business;
and transfer risk, which refers to problems in shifting funds from one country to another.
Political risk occurs if government decides to change its policies or regulations, or if negative
events, which are outside the government control, occur. The most harmful actions govern-
ment can take and events, such as strikes, extortion, and terrorism can cause, cause that the
company loses control over specific assets without adequate compensation. Losing control
can be executed by actions such as expropriation, forced divestiture, and confiscation. Gov-
ernment can also restrict policies with issues such as access to finance, labour and suppliers or
control of prices, outputs and other company‟s activities, and reduce the value of benefits,
which foreign business expects to gain by investing abroad. (Czinkota & Ronkainen 2010, 135;
Keegan & Green 2008, 150.) Nationalistic buyers or illegal activities such as crime, corruption,
and disruption are examples out of government control. These factors are related to stability
of the legal environment, and can reduce the benefits foreign investor expects to gain in a host
country. (Czinkota & Ronkainen 2010, 151.)
2.1.2 Intellectual property
Intellectual property (later IP) refers to a legal and exclusive right to use an idea, knowledge, or
invention, and prevent competitors to profit from other innovator‟s IP (Keegan & Green
2008, 158). Intellectual property is main concern in various industries such as in research and
development. Large investments are needed in creative and investigative work to create the
product, whereas manufacturing has typically relatively low costs. (Kotabe & Helsen 2004,
160.)
IP must be intangible but it should be able to be turned into property for potential profit
making. A patent is a legal document, which provides an exclusive right for an innovator to
produce, use and sell an invention for a specified period of time. A trademark is a unique
mark, motto, device or symbol that manufacturer attaches to a product or package to distin-
guish it from competitors‟ products. A copyright protects ownership of a written, recorded,
performed or filmed creative work. (Keegan & Green 2008, 158.) Trade secret can be defined
also as IP, but it differs from other intellectual property as protection is sought without regis-

7
tration and thus it is not legally protected. However, if a business can show it took all precau-
tions to protect the idea and that infringement occurred illegally through espionage or hiring
employees with crucial knowledge of work, courts can protect trade secrets. (Kotabe & Helsen
2004, 163.)
Marketing possibilities for new innovations are wide all over the world, and the losses can
become high for a company if its innovation is counterfeited; product is copied or produced
without authorization. Associative counterfeit means a well-known brand is imitated in a way
consumers associate imitator‟s product with the genuine product. A third type of counterfeit-
ing is piracy, which refers to unauthorized publication or reproduction of copyrighted work.
(Keegan & Green 2008, 159.)
IP laws are increasingly corresponding between different countries, but there can be differ-
ences. World Trade Organization (later WTO) Agreement on Trade-Related Aspects of Intel-
lectual Property Rights was adopted in 1994. All its requirements concern equally all WTO
member states including the UK and Finland. (Czinkota & Ronkainen 2010, 150-151.)
2.2 Economic environment
According to Keegan (2002, 31), the most important characteristic of the international market
environment is the economic dimension as money can enable everything and lack of money
limits possibilities. High-cost products cannot be sold to low-income consumers and high-tech
industrial products require high-tech industries as buyers.
Most Western European countries are market economies, which mean their market systems
are economic democracies, where the government promotes competition and ensures con-
sumer protection (Keegan 2002, 34). The United Kingdom is listed in Group of Five (G-5)
with United States, France, Germany and Japan, as these comprise the major advanced coun-
tries of the world. Advanced countries have achieved their current income through a process
of sustained economic growth. (Czinkota & Ronkainen 2010, 30).
2.2.1 Stability
Economic environment and stability reflects also stability of the political system, degree of
control of economic system, constitutional guarantees, effectiveness of public administration
and labour relations and social peace (Czinkota & Ronkainen 2010, 34). Economical stability

8
can be explored in detail through economic variables, such as economic growth, unemploy-
ment, interest and exchange rates (Jobber 2010, 76). There is vast amount of information
available for advanced countries from secondary sources such as international organizations,
individual governments, and private organizations or associations. Businesses monitor espe-
cially those economic variables, which relate most significantly to their products or services.
(Czinkota & Ronkainen 2010, 34.)
2.2.2 Tax system
Income taxes are the most obvious taxes both business and individuals must pay. Companies
must estimate also the impact of payroll taxes, sales taxes, property taxes, inventory taxes, and
specialized taxes on the cost of company‟s operations. (Zimmerer & Scarborough 2008, 520.)
Country‟s tax system affects indirectly and directly to businesses. Business can benefit indirect-
ly if government reduces taxation or increases government spending. This provides more in-
come into the economy and increases the demand for goods and services, which businesses
sell. Reductions in taxes on company profits or increases in company‟s tax allowances for in-
vestment‟s capital equipment can be used directly to encourage business to increase spending
on investments, which can boost the income of firm‟s industrial products, and thus cause ex-
tra spending on consumption. Government spending can be targeted for exporting firms or
new business start ups, which in return increases business activity and may lead to more out-
put and employment in the economy. On the contrary, encouraging market by increasing gov-
ernmental spending or reducing taxation can cause inflationary pressures, which can harm
businesses. (Worthington & Britton 2006, 106-107).
According to Laulajainen and Stafford (1995, 38) most researches have shown that tax rates
do not vary as much as usually perceived, especially when taking into consideration the of-
fered services taxes allow and how much subsidies governments provide (discussed in the next
chapter, 2.2.3). Some corporations avoid regions with high taxes partly due to costs, but also
because high tax influences how they perceive the region‟s business climate. Still, taxes can
influence to the location decision when a company is about to be established in to a new area.
Many companies that are flexible with geographical location and do not require extensive la-
bour, likewise multinational companies prefer to be legally established in a hospitable tax envi-
ronment. (Laulajainen & Stafford 1995, 38-39.)
9
2.2.3 Incentives
Governments aim to create jobs for their citizens by offering incentives for foreign direct in-
vestors. There are three main types of governmental incentives: fiscal, financial, and nonfinan-
cial. Authorities have direct control on taxes, and thus reduced taxes for newly established
companies are among the most popular fiscal incentives offered for businesses. Fiscal incen-
tives typically consist of special depreciation allowances, special deductions for capital expend-
itures, tax holidays, and other reductions of the investor‟s tax burden. Financial incentives are
governments‟ special funds, which investor can use to acquire land or buildings, loan guaran-
tees, or wage subsidies. Nonfinancial incentives are guaranteed government purchases. Nonfi-
nancial incentives offer special protection from competition to direct investors through tariffs,
import quotas, local content requirements, and infrastructure investments, which improve
country‟s infrastructure facilities. (Czinkota & Ronkainen 2010, 294.)
Incentives enable the investor to improve and ease investment related issues such as training
of workers and government grants can ease obtaining buildings and machinery. Financial in-
centives benefit companies, but as many areas offer direct and indirect aid especially for large
manufacturing plants and to large retail stores, they are not considered as critical location deci-
sion factors. (Laulajainen & Stafford 1995, 40-41.) Still, internationalizing businesses can bene-
fit, if they recognize how government support for specific industries affect on which indus-
tries are competitive and which are not (Kotabe & Helsen 2004, 138).
2.2.4 Private capital
Financing foreign direct investment may involve acquisitions from external sources. There are
variety of different forms how to obtain private capital such as equity investment, debt financ-
ing, asset-based financing and non-profit agencies. The sources of private external financing
can include business angels, banks, and venture capital firms. (Shane 2005, 161.)
The resource acquisition is important for business, which doubts if it has enough capital to
finance foreign direct investment. Foreign direct investments are more likely to survive, be-
come profitable and grow in the new market with the aid of adequate capital, as the business
can respond better to the needs of a new market than without external financing. (Shane 2005,
161.) It is problematic for SME‟s that often financing institutions prefer larger, well estab-
lished firms than small companies as they perceive higher risk. (Scarborough & Zimmerer
2003, 366.)

10
Uncertainty and information asymmetry influence on the capital acquisition process, and make
it also difficult. Information asymmetry appears because the business has more in-depth
knowledge about the opportunity and method how to exploit the opportunity. The business
owner does not want to reveal the entire business plan in the negotiation stage as if the exter-
nal capital owner would know it; the capital owner could have an opportunity to implement
the plan alone. This results that company cannot disclose all information for the potential
resource provider when seeking for finance. Another problem rises if the potential resource
provider has to protect against the company, which has more knowledge how the capital can
be used and what kind is the company‟s commitment and ability to deliver results. The com-
pany can use the internal information to take advantage of the investor and gain greater con-
cession than what fully informed investor would provide. Information asymmetry between the
company and the investor also encourages the company to undertake risk with the external
resources. This thought results that the resource provider needs to compensate the risk by
offering fixed rate for the financing at a high interest rate. This leads the company to favour
risky projects with high potential returns. Problems may occur also when potential investors
are not able to distinguish businesses with good implementation plan from other businesses
with lower potential. As there are low ability businesses and better potential businesses in the
market, resource providers make financing offers to businesses of all quality levels at the aver-
age price. As the price attracts more low ability businesses, this drives high ability businesses
and their high potential opportunities away from the market. (Shane 2005, 166.)
2.2.5 Labour
Labour law regulations: Governments seek ways to improve the efficiency of the markets by reg-
ulating the labour law. Trade unions are often seen as a barrier to the operation of the market
forces, as well as cause of high wage costs and low labour productivity. Lower power of the
trade unions means better labour market flexibility, which can benefit businesses that are try-
ing to respond to competition and evolve. (Worthington & Britton 2006, 421-422.)
Availability: The most significant aspect of labour is availability, a balance between need and
supply. Labour‟s mobility and employee‟s criterion for its potential employees effect on sup-
ply. Mobility can be split into two dimensions: daily commuting and relocation to a new area.
The upper limit for daily working distance from home is 45-60 minutes for most non-
managerial labour, when excluding world-class metropolitan regions. If the work requires
skilled and specialized workers, it limits the capacity of available workers. Workers can be

11
trained for work in manufacturing, but for operations and positions requiring high quality
workers, the background in education and skills need to correspond to the demands of the
work. Even though high requirements limit the number of applicants, skilled workers are
more mobile than unskilled, meaning that if the workplace is situated in a long distance or if it
relocates, the skilled workers are more ready to follow the work than the unskilled. Even
though this is the theoretical view, the practice depends heavily upon the specific situation. If
the move is within an urban area, e.g. inside Greater London, from Greenwich to Kensington,
only the most unskilled workers can be very doubtful to follow. But in case the move is from
Finland to the UK or from England to Wales, the loss of cultural associations and family and
friendship ties would lead to resigns in all levels of the company hierarchy. Companies, who
need qualified workers prioritize this aspect in their strategy and locate in such environments,
which attract specialized and qualified workers even though the premises would be more ex-
pensive than in more unpopular areas. (Laulajainen & Stafford 1995, 21-24.)
Quality: Quality of labour is equivalent to training and skills of the labour to manage work pro-
cesses and thus produce quality products. In assembly production is it easy to divide the flow
into different stages and manage them but in process industries the stages are more difficult to
separate and insufficient skills can lead to extensive damages. In high quality industries not just
the training the employee provides but especially the background such as education and expe-
rience of the worker should correspond the needs of the work. (Laulajainen & Stafford 1995,
35.)
Productivity and salary: A worker who earns double salary compared to the other worker is no
more expensive if s/he produces twice as much. The highly paid worker should produce equal
quality at a rate above nominal pay rate differential to be a bargain. A direct measure of
productivity is the number of units produced in a time period, but comparisons are difficult to
make because the mix of production factors and workers and machinery as well as end prod-
ucts are not identical. More machinery leads usually to increased output when the workers
have skills to run the machinery. With more sophisticated products more effort is needed and
this means lower productivity. (Laulajainen & Stafford 1995, 25, 30.)
Absenteeism is also affecting to productivity and it varies geographically. There are many rea-
sons behind absenteeism. Full employment policies, liberal legislation and employees with
relaxed attitudes increase the problem. (Laulajainen & Stafford 1995, 34.)

12
2.2.6 Productivity
The real cost of labour is a consequence of productivity and other direct costs, that are salary
and fringe benefits. Fringes can include health insurance, overtime, bonuses, and paid vaca-
tions, paid sick, maternity and other leaves, unemployment compensation, retirement obliga-
tions and severance pay. The total is often 30 percent in developed industrial countries.
(Laulajainen & Stafford 1995, 26.)
Productivity and salary vary highly depending on industry and region in addition to variations
between regions within a country can be wide. Relatively unsophisticated production process-
es that require less skilled workers to produce standardized products are likely to be estab-
lished in low-wage areas. Sophisticated products and processes are likely to situate in estab-
lished business areas, where can be found many research and development facilities and cor-
porate headquarters. (Laulajainen & Stafford 1995, 25.)
Furthermore, productivity is influenced by industrial relations. The measurement is the
strength of labour unions, which can vary highly between different regions inside the same
country. The implication is that high unionization indicates trouble, though it is complex to
show that areas with low union activity would continuously attract more businesses than areas
with high unionization. Co-operative union can be an advantage to management. (Laulajainen
& Stafford 1995, 33-34.)
2.2.7 Quality of life
The common understanding is that quality of life reflects the welfare of the region and its res-
idents, thus economic environment impacts on social development. When measuring the qual-
ity of life around the world, used indicators may be life expectancy, infant mortality, adult lit-
eracy rates, and social relationships, enjoyment at work, job stability, and overall conditions in
the country. (Czinkota & Ronkainen 2010, 45.)
The used indicators change according to the purpose. The importance of quality of life for a
company searching for a new location correlates with how trained and sophisticated employ-
ees the business is searching for (Zimmerer & Scarborough 2008, 526). Companies that need
to hire skilled and relatively mobile workers are typically also searching to locate in areas with
cultural facilities, high levels of services and good housing possibilities, as these are important
factors for their workers. (Laulajainen & Stafford 1995, 49.)

13
2.2.8 Operating costs
When foreign investor is researching where to locate, it has to consider the total cost of opera-
tion on its business. Differences can be found between different countries, but also between
different regions. A region may have low property costs, but labour costs and tax rates may be
high compared to other areas. To solve questions related to operating costs there can be used
a matrix shown in Table 1, which covers relevant operating costs, to assist in selecting the best
location for a business. (Zimmerer & Scarborough 2008, 521.)
Table 1. Operating costs matrix (Zimmerer & Scarborough 2008, 521)
Location Criterion Weight
Score (Low=1, High 5)
State Weighted Score (Weight x Score)
Location 1
Location 2
Location 3
Quality of labour force
Wage rates
Union activity
Property/building costs
Utility costs
Transportation costs
Tax burden
Education/training assistance
Start-up incentives
Raw material availability
Quality of life
Others
In Table 1, manager defines a weight to each location criterion, which tells how important the
criterion is for the company and then each location option is scored. The weighted score is
calculated for each criterion and criterions weighted scores are added. The location with the
highest total weighted score is the best location option for the business.
2.2.9 Market access
Governments prefer often to attract foreign direct investors by removing barriers and making
direct investors‟ market access uncomplicated, as democratic market economies consider these
kinds of businesses increase employment and income, and thus generate economic growth to

14
the host country. Still many countries review desirability and effect of major incoming invest-
ment projects. Restrictions for foreign investments may permit more control for domestic
industries, but it also denies access to foreign capital and innovation. This may tighten credit
markets, higher interest rates, and weaken willingness to adapt to changing world market con-
ditions. (Czinkota & Ronkainen 2010, 81, 294.)
Many governments and trade organizations create vast amount of marketing information
available for businesses to ease the market access, but often many small businesses do not use
the information. SMEs may feel there is too much information or they may not be aware
where to search for. This makes it complex to find the correct and specific information rele-
vant to individual businesses. (Scarborough & Zimmerer 2003, 366.)
2.2.10 Gateway to other important trade areas
Particular countries have wider and stronger connections with other countries around the
world than others because of factors such as central geographical location, extensive history in
trade, and historical events. Favourable business location provides possibilities for growth and
further internationalization if success is sufficient over the time. Businesses that seek opportu-
nities in the world markets should make a foreign investment to a host country, where net-
working possibilities are wide and policies favour expanding to a third country. (Zimmerer &
Scarborough 2008, 531.)
2.2.11 Growth potential
Growth is an objective shared by governments and businesses. For government the aim is to
have a sustained level of non-inflationary growth, which is usually led by exports. Real national
income and gross domestic product express growth in annual rates. Growth is hard to de-
scribe inclusively, but general definition of desirable level of growth in Western countries is
that nation‟s levels of real growth would be steady and 3-4%, growth rates would be higher
than the main competitors‟ rates. The growth should also be based on investment in technol-
ogy and on increased sales in exports, rather than on government spending or current con-
sumption. Economic growth is good for business as the increases in output correlates with
increases in consumption. Where growth forecast for the economy is favourable, business
confidence increases and this often reflects in increased levels of investment, and eventually to
employment. (Worthington & Britton 2006, 99-100.)

15
2.3 Social and cultural environment
Culture is system of learned behaviour patterns that distinguish characteristics of the members
of different societies. Because culture resists change and fosters continuity, problems may
arise when person from another culture needs to adjust to another culture. (Czinkota & Ron-
kainen 2010, 92-94.) If a manager fails to have cultural sensitivity when conducting business
with a person from a different cultural background, it is highly unlikely a productive business
relationship will be established. Learning local habits and customs enables foreigner to show
his or her respect around the globe. (Scarborough & Zimmerer 2003, 368.)
2.3.1 Elements of culture
Ability to adapt to another culture is based on patience, flexibility and tolerance for others‟
beliefs. Effective implementation of local operations and success overseas depends very much
how business adapts to the cultural environment. Manager should get familiar, distinguish
relevant differences, and isolate potential opportunities as well as problems related to elements
of culture. The elements of culture are (Czinkota & Ronkainen 2010, 92-94, 96):
– Verbal and nonverbal language
– Religion
– Values and attitudes
– Manners and customs
– Material elements
– Aesthetics
– Education
– Social institutions
Verbal and nonverbal language: Understanding local language helps international manager gather
information and evaluate market personally without depending on the opinions of others.
Language provides access to society and improves one‟s ability to interpret contexts and
meanings. International managers should familiarize themselves also with the hidden language
of foreign culture. Understanding nonverbal language such as concept of time, friendship pat-
terns and business agreements are relevant issues for businesses that invest abroad. (Czinkota
& Ronkainen 2010, 100.)

16
Religion: The ideals for life are defined in religion and those can be noticed in the values and
attitudes of societies and individuals. Values and attitudes, which reflect the religion, are the
most challenging for the marketer to adjust to. The dominant religions in the world are the
ones which have most followers, but also the religions that have influenced on world history
are significant even though these religions would not have as many followers. (Czinkota &
Ronkainen 2010, 100.)
Values and attitudes: Values are mutual beliefs of group norms that individuals have internalized
and attitudes are evaluations that are based on shared values. Foreign marketer has to be cau-
tious especially with values and attitudes in the society that are rooted deep and close to fun-
damental beliefs such as religion. (Czinkota & Ronkainen 2010, 102.)
Manners and customs: Knowledge about manners and customs is essential whether the motiva-
tion behind learning foreign manners and customs was to have a business negotiation abroad
or sell product to foreign customers. Potential areas, which foreign manager may not be pre-
pared to understand related to manners and customs are 1) inadequate understanding of dif-
ferent ways of thinking, 2) inadequate attention to the necessity of saving face, 3) inadequate
appreciation of the host country, 4) inadequate recognition of the decision, and 5) inadequate
allocation of time for negotiations. (Czinkota & Ronkainen 2010, 103.)
International manager should also carefully distinguish reasonable ways of conducting busi-
ness abroad. As in many countries norms of conducting business vary, issues such as offering
bribes may seem corruption from the outsider‟s point of view but perceived as fairly normal
within the culture. Many experienced international business managers argue that one country
should not apply its moral principles to other culture in which bribery and corruption are
common. These managers argue that if they are to compete in international markets, they
should be free to use the most common methods of competition in the host country. Espe-
cially in limited markets, stiff competition forces firms to find any way possible to attain a
contract. Then again, the question remains unsolved as unrestricted bribery could result in
businesses to concentrate on what is the best way to bribe rather than what is the best tech-
nique to produce and market products. (Czinkota & Ronkainen 2010, 151-152.)
Material elements are results of technology and refer how a society organizes its economic activi-
ty. It is reflected in the availability and sufficiency of the basic economic, social, financial, and
marketing infrastructures. The basic economic infrastructure refers to transportation, energy,
and communications systems. The social infrastructure consists of housing, health and educa-

17
tional systems. The financial and marketing infrastructures relate to agencies, which facilitate
firms‟ operations. (Czinkota & Ronkainen 2010, 105.)
Aesthetics: Each society has own ideas and concerns of good taste, which is expressed in the
arts and in symbolism of colours, form and music. What is acceptable in aesthetic nature may
vary dramatically in different places, though markets would seem otherwise very similar. In-
ternational companies need to take into consideration local tastes and concerns in designing
facilities, products and other business related materials. (Czinkota & Ronkainen 2010, 107.)
Education conveys and shares culture. Educational levels of culture can be assessed by using
literacy rates, enrolment in education, and information of overall level and qualitative aspects
of education. Education levels have impact on many business functions such as when as-
sessing do the workers have suitable educational background for the work, what is the most
efficient way to train the work force and how a product such as a technical device should be
adapted, to make it easy for the target customers to use it. (Czinkota & Ronkainen 2010, 107.)
Social institutions affect how people relate to each other. The Western family unit consists of
parents and children, whereas in other countries the family unit may include grandparents and
other relatives. This has an impact on consumption patterns. Managers and subordinates can
be separated explicitly by wide range of boundaries from different social classes to separate
office facilitates, but in other culture equality and lack of status symbols can be the key for
successful cooperation in the work place. (Czinkota & Ronkainen 2010, 108.)
2.3.2 Location image
Businesses‟ concern about the location image is great especially if the investment is large and
fixed. (Laulajainen & Stafford 1995, 49.) Managers take decisions based on hard factors, but
also on their perceptions. Thus the brand of a certain country can ease and fasten the decision
process about locating the company in to a certain country or region. (Anholt 2007, 8, 29.)
Anholt (2007, 5) arguments reputations of places occur more randomly than brand images of
products, services and companies. The image of the place is affected by more complex factors
and linked events that are planned or can occur unexpectedly. In most of the cases the reputa-
tion of a place is shifting all the time between the complex of negative and positive, but there
are also places with images that stay mainly negative or positive. (Anholt 2007, 8.)

18
Place has a strong reputation if most of the people have same kind of image of a certain place.
Weak reputation is due to inadequate images people, who are aware of the place, have, or if
the people describe the place with many different individual images. Strong and famous imag-
es do not equal automatically on positivity. (Anholt 2007, 8.)
2.3.3 Business climate
Some countries are more business friendly for foreign investors than others. Business climate
adds up all different factors, which relate to the company and its operations such as do the
region have laws that impose restrictions on the way company can be established?; what is the
region‟s corporate income tax rate?; are there laws that restrict business on Sundays?; has the
region devoted to improve the technological infrastructure? (Zimmerer & Scarborough 2008,
520.)
2.4 Technological environment
The availability and quality of infrastructure are important for ensuring marketers‟ operations
run as planned. Technological developments have enabled markets to offer more efficient
services for transportation, communication, and energy. A firm uses these functions for mar-
keting communications, distributing, information and financing. (Worthington & Britton
2006, 159.)
A region‟s communications and technology infrastructures play significant factors for busi-
nesses. Firms‟ ability to communicate in the market can be predicted by using indicators of
communication infrastructure such as telephones, computers, broadcast media, and print me-
dia. There are significant differences between regions penetration rates, and assessing the in-
frastructure reveals where are the best opportunities for companies‟ operations to run as ex-
pected. (Czinkota & Ronkainen 2010, 42-43.)
2.4.1 Information, communications and technology
Integration of information technology and communications contributes internally to compa-
nies‟ working habits and its marketing systems. Information and communications provides
business environment, where participants can operate independently, and at the same time be
connected to each other. Developments in information and communications have eased the
creation of content, and its efficient delivery through various communication tools. The pro-

19
gress in technological development has shortened the life cycles of companies‟ services and
products. Delivery of new innovations is faster and companies have to observe changes to
maintain their position in the markets. Technology has tightened competition as it has upgrad-
ed the speed to communicate and reduced the needed work force. (Kasper, Helsdingen &
Vries 1999, 83.)
2.4.2 Transport
Transportation industry transports two main subjects: freight and passengers. Options for
transportation vary between road, rail, water and air. Selection of mode is based on attributes
of freight and the time how long it can take to be delivered. Transportation networks are im-
portant for companies, which operations are dependent of physical distribution. The devel-
opment of transportation infrastructure is related to overall economic development around
the world and in individual countries, because economic development increases overall de-
mand of products. (Kasper et al.1999, 112-113.)
2.4.3 Research and development
According to Worthington and Britton (2006, 161-162) „research‟ can be theoretical or ap-
plied, whereas „development‟ means using the research in the production process. Most of the
research and development of private companies is designed to develop and improve products
and production processes, which make the production more profitable.
Level of research and development is especially important for companies that invest abroad
because of the following reasons (Czinkota & Ronkainen 2010, 470):
– to help technology transfer from parent to subsidiary
– to develop and improve products for foreign markets
– to develop products and processes for simultaneous application in firms‟ world markets
– to generate new technology and innovations to stay ahead in long-term
Multinational companies choose the location of their R&D facilities by evaluating different
locations‟ specific skills and access to scientific and technical personnel and information in
industry or universities. The location decision may be driven also by unique features of the

20
market such as the market is the leader in specific industry and it has a trendsetting image.
(Czinkota & Ronkainen 2010, 471.)
2.5 Business environment
Closeness to markets is the most important factor in the location with some industries such as
manufacturing and service industries. It is vital for manufacturing and service industries to
situate near suppliers and/or clients (Zimmerer & Scarborough 2008, 519).
2.5.1 Proximity to industry clusters
Locating near an industry cluster can be worthwhile because regions with clusters are often
perceived to have greatest competition advantage. A competitive industrial cluster is a geo-
graphic concentration of competitive businesses in the same industry that buys or sells with
region‟s other industries, uses common technologies, or shares specialized workforce. (Zim-
merer & Scarborough 2008, 524.) Industry clusters form around certain driver industries,
which have the region‟s main competitive advantage. Geographic clustering is dynamic and
forward looking especially with knowledge activities, which are driven by innovation and po-
tential technology rather than existing industry linkages. (McCann 2002, 278.)
Research and development industries prefer locating near research universities, because they
may benefit from knowledge transfers from local universities. Most activities of R&D firms
include investing in ability to observe relevant technological and economic information, iden-
tifying technical and market possibilities, and acquiring knowledge, information and skills to
develop technologies. Usually firms are competent to master the new technology, but the risk
is to fail in adjusting the firm‟s systems of coordination and controlling them to match the
new technological opportunities. Thus, proximity to other businesses in similar industries and
to universities with research capabilities is beneficial. (McCann 2002, 279.)
2.5.2 Proximity to suppliers, resources and clients
Short distance to supplier enables manufacturers to be more flexible with orders and have
fewer costs than if the supplier would locate far from the manufacturing plant. This also ap-
plies to some business services, as they are actually second or third tier retailers. Though sup-
pliers that are nearer customers are more appreciated, the customer is less tolerant with a long
delivery times than a customer, which has more distance to the supplier. When considering

21
retailing, as long as there are enough customers within an area, the most vital requirements are
met and retailer can set up a physical presence. The size of the physical presence correlates
with the distance how far the customers are willing to come. (Laulajainen & Stafford 1995,
53.)
2.6 Framework: Factors foreign investors are interested in a host country
Companies observe the environment where they operate and adapt to take advantage of
emerging opportunities. They are also able to reduce the amount and possible damage of po-
tential threats by looking outwards to the environment. (Jobber 2010, 73.) There have been
included a combination of factors in Figure 1 that UKTI‟s clients, which are mostly foreign
direct investors, are most likely interested in when investing to the UK. The factors in the
combination have been gathered from all of the sources presented earlier in Chapter 2. These
factors attract companies to invest to the UK when they are perceived positively, and can hin-
der foreign investing if investors find them negative.
Macro dimensions of the environment are political and legal, economic, social and cultural,
and technological. (Keegan 2002, 31). Four big arrows illustrate influence macroenvironment
has over microenvironment and the foreign investor. Although a group of a few large compa-
nies or multinationals can sometimes influence on some of the factors, these forces of the
host country remain invariable in most companies (Kasper et al.1999,75). This study is mainly
concentrated on forces in the macroeconomic that business managers cannot control, as the
aim is to research the UK market rather than businesses‟ investing processes to the UK.
Microenvironment consists of business related factors. Grey small arrow heading from the
microenvironment to the investor displays influence of the microenvironment on foreign in-
vestor and on decisions the investor has to make. Grey small arrow pointing from the foreign
investor to microenvironment visualizes that also the investor can influence substantially on
some external factors in the microenvironment if the company‟s strategy is efficient enough
(Jobber 2010, 73).

22
Figure 1. Factors of the host country that foreign investors are interested
BUSINESS
–Industry clusters
–Proximity to:
–Clients;
–Suppliers;
–And resources
MACROENVIRONMENT
FOREIGN
INVESTOR
TECHNOLO-
GICAL
– Information
and commu-
nications;
– Technolo-
gical;
– And
transport
infra-
structure
– R&D
ECONOMIC
– Stability
– Tax system
– Incentives
– Capital
– Labour
– Productivity
– Quality of life
– Operating
costs
– Growth
potential
– Gateway to
other
important
trade areas
– Market
access
SOCIAL/CULTURAL
– Adaptability to
elements of culture
– Location image
POLITICAL/LEGAL
– Stability
– Intellectual property
MICRO-
ENVIRONMENT

23
3 Service marketing
In this study, services are defined as processes and performances, which the service provider
offers for its clients and coproduces with the clients. As UKTI does not take fees for the ser-
vices it offers, price of the services is not discussed. The services may include tangible reports,
website or in case of a conference, tangible information materials. But for the most part, the
entire service is provided to clients through problem analysis activities, meetings with clients,
and reporting. Service marketing reflects the service provider urge to obtain more efficient
ways to understand their customers. Thus the service provider is able to deliver quality ser-
vices, and to strengthen its position against competition.
3.1 Factors influencing on customer satisfaction
Customer satisfaction is customer‟s evaluation of a service or a product, which is based on
how well the service or the product has met the customer‟s needs and expectations. If the
company fails meeting the customer‟s needs and expectations, the result is dissatisfaction. Sat-
isfaction evolves over time as variety of changing factors influence on it. Service is experi-
enced differently depending on which point of the service cycle the customer satisfaction is
being measured. Each experience gained during different parts of the cycle affect on ultimate
satisfaction. (Zeithaml, Bitner & Gremler 2009, 104-105.)
3.1.1 Service features
Customers‟ evaluation of the service features influences significantly on customer satisfaction.
For a service provider such as an investment promotion agency, important features might
include helpfulness and knowledge of staff, reliability and responding to the customers‟ re-
quests. In studies concentrating on satisfaction, firms can determine through specific means,
such as focus groups, which are important features and attributes for their service. Thus per-
ceptions of the important features can be measured as well as an overall satisfaction. Custom-
ers make trade-offs among different service features depending which kind of service is being
evaluated and how critical the service is. Examples of trade-offs are price versus quality versus
friendliness of staff versus customization. (Zeithaml et al. 2009, 105.

24
3.1.2 Emotions
Customers‟ emotions, which are stable and persistent, or mood, which occurs at specific times
and in specific situations, affect on perceptions of gained service. In addition, the experienced
service can induce specific emotions because of the service itself or because of the moods and
emotions of the service provider or other customers. Positive moods can make customers
more ready to follow and cooperate within the service process as planned and gain aimed re-
sult easier. Customers with negative moods may be less interested to engage themselves in
essential parts of service and the effectiveness of the service, as well as the satisfaction level
may decrease. Strong feelings may influence customers to judge services in more opinionated
way. (Zeithaml et al. 2009, 64, 105.)
3.1.3 Attributions for service success or failure
Attributions are the perceived causes, which a customer finds affecting the end result of the
service. Especially, if the customer is surprised by an outcome, the customer starts to search
for answers why the outcome was different than expected. As the customer is able to make
own decisions during the service process, the customer takes usually at least some responsibil-
ity for how the things turn out. Even if the customers would not take responsibility for the
result, customer satisfaction can be influenced also by other attributions. If there occurs an
error during the service process and the customer perceives that as an incident, which the ser-
vice provider could not control or it occurs rarely, the customers are less dissatisfied with the
error‟s impact on them. (Zeithaml et al. 2009, 106.)
3.1.4 Perceptions of equity and fairness
Fairness is central to customers‟ perceptions of satisfaction especially in service recovery situa-
tions, when problems have occurred and service provider has hopefully taken action to fix the
problem. Customers think issues such as were others served better, or were the others offered
better quality of the service when customers perceive how fairly they were treated. Satisfaction
with a service provider after a service failure is determined heavily according to perceptions of
fair treatment. (Zeithaml et al. 2009, 106.)
25
3.1.5 Others’ opinions
Other people influence often to customer satisfaction. If a business orders a service from an-
other business, satisfaction of the employee, who placed the order, is likely to be influenced by
other employees‟ opinions and experiences about the service. This happens especially when
there has to be implemented changes in the company because it is part of the service itself or
the outcome of the service suggests changes. (Zeithaml et al. 2009, 107.)
3.2 Impacts of customer satisfaction
Post experiences of satisfaction or dissatisfaction contribute significantly what customers tell
other potential and potential customers are strongly influenced by these opinions (Zeithaml et
al. 2009, 65). Customer satisfaction correlates also with customer loyalty and thus, many com-
panies try to understand customer satisfaction and the ways it can be improved (Zeithaml et
al. 2009, 109).
3.2.1 Word of mouth
Customers use personal and nonpersonal sources when purchasing services, because both
convey information, but they rely to a greater extent on personal opinions especially with pure
services that do not include tangible products within the service. Media offers information of
search qualities, which are attributes that customer can determine before ordering the service
such as the length of the service relationship. For services, much is still undefined at the point
of purchasing the service. Experience qualities can be discovered during consumption or after
the service, and best way to find them out is to rely on friends or experts, who are familiar
with the service. Understanding and controlling world of mouth has grown to be challenging
but essential on social connection websites, blogs, and other individually driven mass commu-
nication tools. The best way to drive positive world of mouth is to produce impressive service
experiences. If the service turns out dissatisfying, it is critical to have a service recovery strate-
gy, which limits harmful world of mouth. (Zeithaml et al. 2009, 53, 56, 65.)
3.2.2 Loyalty
The relationship between customer satisfaction and customer loyalty is especially strong when
customers appear very satisfied. Thus it may not be enough for building loyalty if the compa-
nies are just trying to satisfy their customers. Instead, they should try to satisfy customers even

26
more or even delight them. Research shows that companies, which invest in service and excel
in customer satisfaction, gain excess profit. This suggests that if the service company needs to
improve its financial status, the effort should be focused in discovering ways to improve cus-
tomer service, and expenses should be cut elsewhere. Downsizing in customer service can
prove critical if the customers perceive their demands and needs are not fulfilled properly.
(Zeithaml et al. 2009, 109-110.)
3.3 Service quality
The dominant element customers evaluate in services is service quality (Zeithaml et al. 2009,
103). Customers base their evaluations of service on several relevant factors. The factors have
been categorized under five quality dimensions. The quality dimensions represent how cus-
tomers organize information related to service quality in their minds. (Zeithaml et al. 2009,
111.) The service quality dimensions are (Bruhn & Georgi 2006, 52; Grönroos 2001, 74;
Zeithaml et al. 2009, 111):
– Reliability: capability to perform the promised service dependably and accurately.
– Responsiveness: willingness to respond to customer‟s needs and wishes in a prompt matter.
– Assurance: employee‟s capability to deliver the output in a professional and polite matter,
and inspire trust and confidence in customer.
– Empathy: willingness and capability to care about customers‟ requests and give them indi-
vidual attention.
– Tangibles: appeal of physical facilities, equipment, personnel‟s appearance, and written
materials.
3.3.1 Reliability
Reliability has been noted to be most important determinant of perceptions of service quality.
Reliability means that the company delivers what it promises related to delivery, service provi-
sion, and problem resolution as seen in Table 2. Customers want to interact with service pro-
viders that keep promises, especially, about the service outcomes and core service attributes.
Companies need to understand the importance of reliability. Businesses, that do not perform
the core service, which customers think they will be receiving, fail the customers in the easiest
and most crucial way. (Zeithaml et al. 2009, 113-114.) When a service employee has time to
listen and help, the performance is perceived sincere (Zeithaml et al. 2009, 61). In addition to
27
examples in tables 2-6, see how UKTI‟s services are adapted to Service Performance
(SERVPERF) scale, which is generally used for evaluating services, in Appendix 1.
Table 2. Examples of how business-to-business customers judge reliability (Zeithaml et al.
2009, 116)
Reliability: Delivering what has been prom-ised
Needed information is provided when requested.
Provided information is correct.
Customer requests are executed accurately.
Meetings are kept on schedule.
Problems are fixed at the first time they occur.
Predictions prove to be accurate.
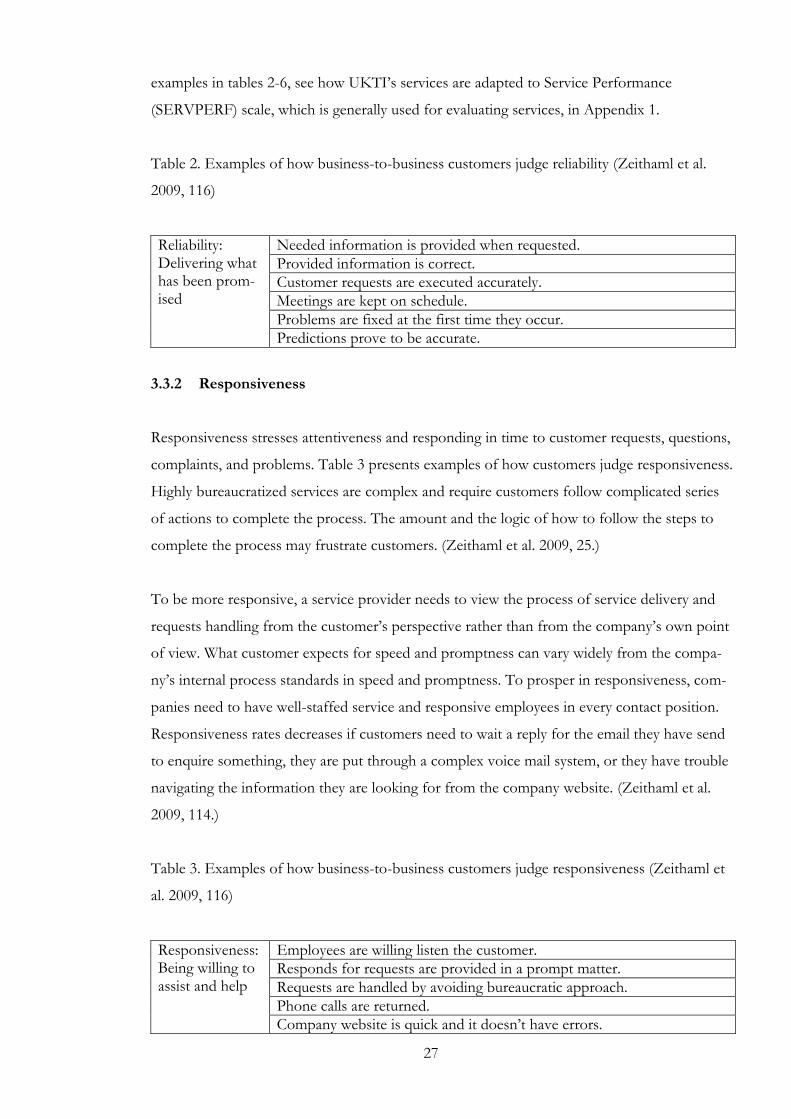
3.3.2 Responsiveness
Responsiveness stresses attentiveness and responding in time to customer requests, questions,
complaints, and problems. Table 3 presents examples of how customers judge responsiveness.
Highly bureaucratized services are complex and require customers follow complicated series
of actions to complete the process. The amount and the logic of how to follow the steps to
complete the process may frustrate customers. (Zeithaml et al. 2009, 25.)
To be more responsive, a service provider needs to view the process of service delivery and
requests handling from the customer‟s perspective rather than from the company‟s own point
of view. What customer expects for speed and promptness can vary widely from the compa-
ny‟s internal process standards in speed and promptness. To prosper in responsiveness, com-
panies need to have well-staffed service and responsive employees in every contact position.
Responsiveness rates decreases if customers need to wait a reply for the email they have send
to enquire something, they are put through a complex voice mail system, or they have trouble
navigating the information they are looking for from the company website. (Zeithaml et al.
2009, 114.)
Table 3. Examples of how business-to-business customers judge responsiveness (Zeithaml et
al. 2009, 116)
Responsiveness: Being willing to assist and help
Employees are willing listen the customer.
Responds for requests are provided in a prompt matter.
Requests are handled by avoiding bureaucratic approach.
Phone calls are returned.
Company website is quick and it doesn‟t have errors.
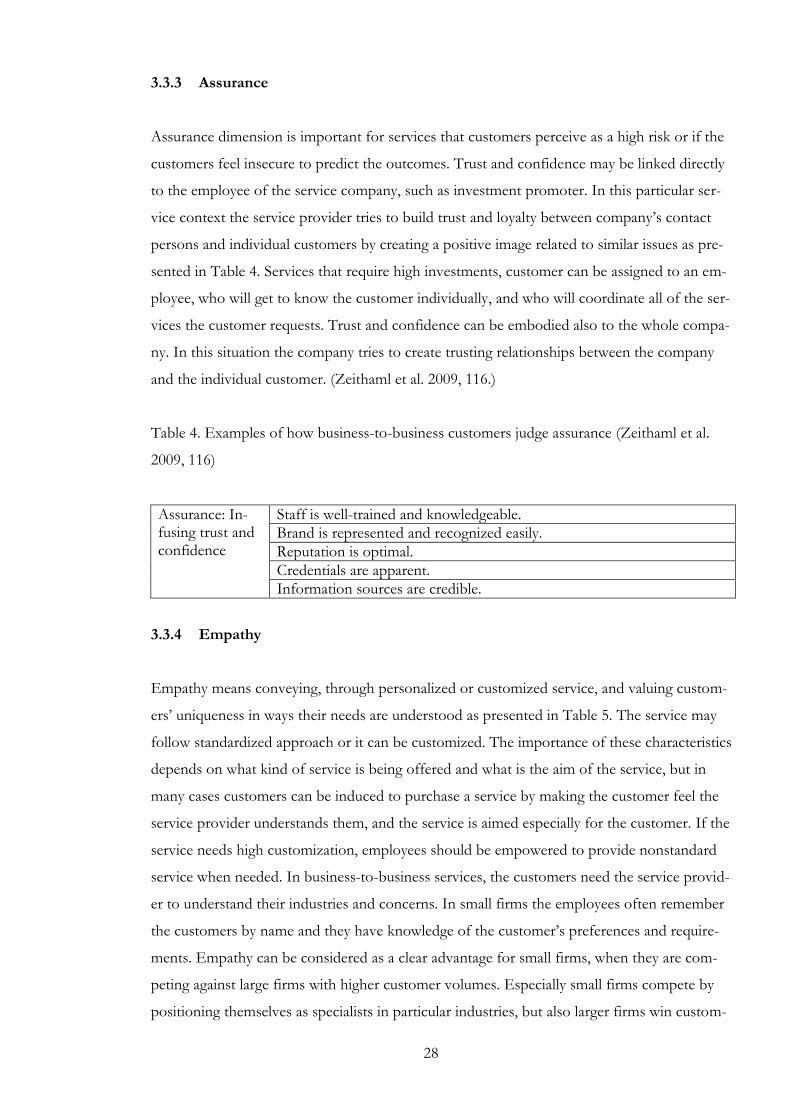
28
3.3.3 Assurance
Assurance dimension is important for services that customers perceive as a high risk or if the
customers feel insecure to predict the outcomes. Trust and confidence may be linked directly
to the employee of the service company, such as investment promoter. In this particular ser-
vice context the service provider tries to build trust and loyalty between company‟s contact
persons and individual customers by creating a positive image related to similar issues as pre-
sented in Table 4. Services that require high investments, customer can be assigned to an em-
ployee, who will get to know the customer individually, and who will coordinate all of the ser-
vices the customer requests. Trust and confidence can be embodied also to the whole compa-
ny. In this situation the company tries to create trusting relationships between the company
and the individual customer. (Zeithaml et al. 2009, 116.)
Table 4. Examples of how business-to-business customers judge assurance (Zeithaml et al.
2009, 116)
Assurance: In-fusing trust and confidence
Staff is well-trained and knowledgeable.
Brand is represented and recognized easily.
Reputation is optimal.
Credentials are apparent.
Information sources are credible.
3.3.4 Empathy
Empathy means conveying, through personalized or customized service, and valuing custom-
ers‟ uniqueness in ways their needs are understood as presented in Table 5. The service may
follow standardized approach or it can be customized. The importance of these characteristics
depends on what kind of service is being offered and what is the aim of the service, but in
many cases customers can be induced to purchase a service by making the customer feel the
service provider understands them, and the service is aimed especially for the customer. If the
service needs high customization, employees should be empowered to provide nonstandard
service when needed. In business-to-business services, the customers need the service provid-
er to understand their industries and concerns. In small firms the employees often remember
the customers by name and they have knowledge of the customer‟s preferences and require-
ments. Empathy can be considered as a clear advantage for small firms, when they are com-
peting against large firms with higher customer volumes. Especially small firms compete by
positioning themselves as specialists in particular industries, but also larger firms win custom-

29
ers on their side by offering knowledgeable and customized service. (Zeithaml et al. 2009, 25-
26, 115.)
Table 5. Examples of how business-to-business customers judge empathy (Zeithaml et al.
2009, 116)
Empathy: Valu-ing customers‟ individuality
Customers are recognized as individuals.
Individual needs are understood.
Responds as human interaction needed.
Customer‟s industry is understood.
Acknowledges and adapts to specific customer needs.
Staff gets to know the client.
Remembers previous problems.
Customer is heard.
Customer needs are being anticipated.
3.3.5 Tangibles
Tangibles represent the service‟s physical evidence; what the customers can see and feel by
experiencing the facilities and material the service uses and provides for the customers. The
importance of tangibles is the highest for industries, which emphasize tangibles in their strate-
gies such as in restaurant and entertainment industries, and their new customers are most ex-
posed to use tangibles (see Table 6) to draw conclusions of the service. Physical evidences
offer noticeable opportunities for the service company to boost their image and send con-
sistent and strong messages concerning the company‟s purpose, the intended market seg-
ments, and the nature of the service. (Zeithaml et al. 2009, 25, 115.)
Table 6. Examples of how business-to-business customers judge tangibles (Zeithaml et al.
2009, 116)
Tangibles: Em-bodying the service
Appearance of brochures, flyers and other printed materials are in line with the brand.
Appearance of a website is optimal.
Office area is neat.
Employees are dressed professionally.
Equipment is modern.
Reports look professionally written.

30
3.4 Framework: Service satisfaction and quality
Figure 2 in the next page represents customer perceptions of quality and customer satisfac-
tion. Service quality indicates often concrete quality attributes: reliability, responsiveness, as-
surance, empathy, and tangibles. Customer satisfaction refers the whole entity of the service.
(Bruhn & Georgi 2006, 54, 57.)
According to Bruhn and Georgi ( 2006, 54, 57) customer expectations are essential for per-
ceived service quality and customer satisfaction. Customer expectations are generated by emo-
tions, attributions, feelings of equity and fairness and others‟ opinions. All of these influencing
factors are affected by previous experiences.
The study focuses to collect clients‟ evaluations of the service quality to find out how satisfied
they are to UKTI‟s services. Satisfied clients are loyal for the same service provider. They are
expected to return to use UKTI‟s services also in the future if they need further assistance
along investment processes. Satisfied clients create also positive image about the services for
the surrounding environments. Positive word of mouth may attract new clients when satisfied
clients share their success stories related to the service. Customer loyalty and positive word of
mouth of UKTI‟s clients are expected to increase positivity towards the UK market and in-
crease investments.
Figure 2: Framework of customer perceptions of quality and customer satisfaction combines
part of model adopted from Zeithaml et al. 2009 (103) to theoretical background from Bruhn
and Georgi (2006) and Grönroos (2001), which are discussed in previous subchapters.
Reliability
SERVICE
QUALITY WORD OF
MOUTH
Responsi-
veness
Assurance
Empathy
Tangibles
CUSTOMER
SATISFACTION
Influencing factors
Attributions Equity &
fairness
Others’
opinions
Emotions
CUSTOMER
LOYALTY

31
4 Research methods
A quantitative primary research was chosen as a research method to reach the aim to gather
UKTI‟s clients‟ opinions about the UK as a business location and the services of the UK
Trade and Investment. According to Ghauri and Grønhaug (2005, 111), qualitative methods
are most suitable when the problem is unstructured and it not has been research a lot; When
there is knowledge already available, quantitative methods are used often to test how well dif-
ferent hypotheses correspond to specific target groups‟ opinions. The quantitative method
was chosen as literature has already theoretical knowledge available related to the factors for-
eign investors assess when evaluating business locations, as well as how customers judge ser-
vices. Additionally, UKTI has drawn conclusions about their clients‟ opinions within several
years‟ experience. Quantitative methods are also recommended when the research is result
oriented instead of process oriented, and the focus is to research issues particularly instead of
draw conclusions through broad holistic answers, which are typical for qualitative researches
(Ghauri & Grønhaug 2005, 110).
4.1 Data collection
The population of target group was 77 respondents, which represented the list UKTI provid-
ed. 77 potential respondents represent most of UKTI‟s Inward Investment Team‟s clients.
There was not a clearly defined customer database available and thus different databases were
used to gather a list of most of the UKTI‟s clients. According to this, the used sampling pro-
cedure was a convenience sample. Convenience sample refer to that the units are most con-
venient to be selected for some reason and they belong to the target group (Ghauri &
Grønhaug 2005, 146). The list included especially Finnish direct investors that have expanded
to the UK in the recent years, and UK Trade and Investment has assisted them. According to
Official Statistics of Finland (2009), there are all together 200 Finnish investors in the UK.
None of demographic factors were selected to narrow down the potential respondent popula-
tion.
Quantitative online survey was chosen as survey method and it was conducted by Webropol
tool. This was preferred as the aim was to collect data within limited amount of time, and data
collection through interviews from several respondents would not have served the aim to
gather data from numerous respondents. Surveying is typical quantitative research method,
which can reach a lot of respondents within limited amount of time, whereas qualitative data

32
collection involves more time and happens by using research instruments such as interviews,
focus groups and observation (Ghauri & Grønhaug 2005, 110).
The questionnaire was designed based on the theoretical background of the study. The ques-
tionnaire is available in Appendix 6. The theory contributed to the research questions (see
Appendix 2), which were inspired by the subjects for the study that the sponsoring company,
UKTI, had appointed. When the draft of the questionnaire was ready, it was sent to UKTI,
and a meeting was arranged to be able to discuss about the questions. The questionnaire was
finalized according to the feedback of UKTI, and it was pre-checked by quantitative analysis
instructor in HAAGA-HELIA to make sure there would not occur difficulties when analyzing
responses in SPSS.
The questionnaire was created only in English according to the advice of the sponsoring com-
pany. Potential respondent group included also non-Finnish speakers, and UKTI assured all
their customers have knowledge in English. The translation was checked by native English
speaker and UKTI checked wording and specific terms. This was conducted to make sure the
language is clear and specific decreases generalization and estimates in responding (Ghauri &
Grønhaug 2005, 228). Only structured questions were used, as according to Saunders, Lewis
& Thornhill (2009, 375) open-ended questions are complex to analyze between potential large
amounts of respondents. Structured questions limit the choice options for answering, whereas
unstructured questions may capture more in-depth information from respondents, but can
also raise the potential for interviewer bias (Czinkota & Ronkainen 2010, 258). Some specific
question batteries required option “other” in the end, and if respondents replied “other”, they
were asked to specify their answer in own words.
There were several questions which used Likert-scales for answering options. The scale organ-
izes responses according to how similarly respondents have answered (Kvantimotv 2009). In
the questionnaire it was made sure all similar type question batteries had a scale of seven vari-
ants. Thus, it was possible to compare results between others without errors due to different
values in the scales (Kvantimotv 2009). Scale with seven variants instead of optional five vari-
ant scales created also more variant visually between responses and made analysing the data
more defined.
The questions were organized to be in a fluent order as possible for the respondents. Ques-
tions, which demand respondent‟s opinion, were assumed to be more demanding to answer,
than fact based demographics, which managers of the companies are usually well aware of.

33
Thus demographical data was asked in the end to minimize respondents‟ fatigue to answer
questions, in which respondents‟ opinions were asked.
The questionnaire was pre-tested by 6 business students. Pre-testing is important to discover
any possible problems in clarity, structure and time-need (Ghauri & Grønhaug 2005, 228).
According to the feedback, some adjustments were made in the questionnaire. A cover letter
was created and accepted to be in line with UKTI. In order to attract respondents, effort was
made to convince the potential respondents of the need for the survey for UKTI. According
to Saunders et al. (2009, 389) the cover letter should explain why the research is conducted;
and according to Kvantimotv (2009), where the information is going to be used. These issues
were also considered in the cover letter.
The questionnaire was sent to email addresses of a population of 77 persons during the week
nine, on 9.3.2010 (see Appendix 3). It appeared that the questionnaire attracted only couple of
respondents. A reminder of the survey was sent after one week, and a second reminder was
sent on week 11 (see Appendices 4 and 5). The population was not active in returning the
questionnaire, and a list of 15 potential respondents‟ phone numbers was received from
UKTI. Potential respondents were contacted by phone and asked if they could answer to the
questionnaire. Nine persons who had been contacted by phone returned the questionnaire.
The survey was closed on Monday 27.3.2010 and the total number of respondents was 13.
4.2 Validity
Validity is required so reliability could be achieved, thus a research measure can be valid if it is
not reliable, but the measure cannot be reliable without it being valid. Validity refers to integri-
ty of the answers in the research, which is the degree how well the research succeeded in
measuring what its intention was to measure. If the respondent understands the question the
way the researcher intended, the measurement validity is high. (Bryman & Bell 2003, 33.) The
respondents should be able to understand the questions in similar way and the results should
provide answers to the research problems for the research to have measurement validity. The
sample has to be also extensive enough so it can be parallel to the whole population, thus the
research is externally valid. (Heikkilä 2004, 29.)
The absence of an interviewer excludes risk that the respondents may have misunderstood
some of the questions because of the interviewer. But then again, the absence also means
there was no possibility to provide in-depth explanations to specify questions for the respond-

34
ents (Saunders et al. 2009, 326). Therefore the questionnaire‟s questions were aimed to be
designed in manner they were easy to understand and answer, and pre-testing was organized
to confirm the respondents would understand the questions as they were intended. The clarity
of the questionnaire was supported by a clear layout and Likert-scales, which were kept as 7-
point-scales throughout the questionnaire. The questionnaire was rather long, as it was com-
prised of two different subjects and demographical data, and this may have caused respondent
fatigue. There was no time limit to fill out the questionnaire, so respondent did not need to
hurry in case they wanted to consider their answers. The research findings responded the re-
search problems clearly. These factors tell that despite the questionnaire was lengthy; the
measurement validity of the study is rather high.
The target respondent group was UKTI‟s clients that represent companies that are established
in Finland, and which are investing to the UK, or are interested in investing to the UK. The
potential respondent group was comprised of 77 companies. If the respondent rate would
have been higher than 17%, the perceptions of the UK market area could have been parallel
to other Finnish UK investors, and thus more externally valid, as the whole population of
Finnish investors in the UK is only around 200 (Official Statistics of Finland, 2009). As the
response rate remained very low, 17%, there is a concern that the results would change if the
study would be conducted again and if more potential respondents would take part in the
questionnaire.
4.3 Reliability
Reliability measures whether the results would be the same or not if the research would be
repeated. More similarity in the results between two correspondingly conducted researches
refers to that the research is more reliable. There are two relevant factors for this study that
measure reliability: stability and internal reliability. (Bryman & Bell 2003, 33.)
Stability measures whether a measures are able to produces stable results within same re-
spondents if the research would be repeated (Bryman & Bell 2003, 33). The reliability of this
study can be analysed by using other factors such as respondents‟ knowledge and honesty and
external factors, which may have affected on reliability. To ensure stability the research was
conducted by companies, which are all UKTI‟s clients and they have adequate knowledge
about the UK market as the questionnaires were mostly sent to top managers and owners of
the companies, who have been, and are, strongly involved in investing to the UK, and who
have received services from UKTI. The questionnaire was sent to target group‟s individual

35
emails, thus respondents were able to take the survey when they felt it was most appropriate
from them, and they had three weeks to participate in the survey. Even respondents were able
to decide when and where to answer the questionnaire, they may have been influenced by
negative situational factors, such as stress and lack of time as most of the email addresses were
work emails. 7-point Likert scales were used for several questions that observed respondents‟
opinions. Within Likert-scales the problem is that some respondents tend to stay in the middle
of the scale in their answers as it does not require strong opinion about the matter. This might
have affected the results, but it was necessary to have the middle option, as the questionnaire
aimed to enable the respondents to express themselves freely.
The reliability of the research is supported by that the targeted respondents were the most
qualified to provide answers to the questionnaire. The external conditions were also eligible in
a way the respondents were able to choose their own time and place to concentrate for re-
sponding to the survey. Also all opinions were appreciated whether they were strong or not.

36
5 Findings
The findings part analyses the results of the questionnaire and factors that may explain the
outcomes. Chapter 5.1 reveals demographical data of the respondents, and Chapters 5.2-5.4
introduce the results for UK as a business location. Chapter 5.4 discusses of UKTI‟s services.
The questionnaire was sent to population of 77 potential respondents. The final response rate
was 17%. A series of 17 questions were asked in the questionnaire. The research findings were
collected by online Webropol tool, and the analysis was conducted by SPSS statistical pro-
gramme and Microsoft Excel.
5.1 Demographics of the respondents
Demographics refer to backgrounds of the respondents‟ companies. In this study de-
mographics reveal main company facts about the businesses, where the respondents are work-
ing. Facts include also information about companies‟ internationalization to the UK.
5.1.1 Main industries
Three industries, named as options for demographical data, are based on UKTI‟s classification
of the most common industries, in which their clients are typically operating. Figure 5 shows,
majority of the respondents work for companies that operate in information and communica-
tion technology.
Figure 5: Main industries of the companies (n=13)
53,8 %
7,7 %
7,7 %
30,8 %
0 % 20 % 40 % 60 % 80 % 100 %
Information and CommunicationTechnology (includes telecommunications,
software, creative and media)
Environmental (includes environmentaltechnologies, renewable energies, energy,
efficient technologies)
Healthcare (includes medical technologies,life sciences)
Other* (please specify)

37
Amount of 8% are operating in the environmental industry, and another 8% are operating in
healthcare, which includes medical technologies and life sciences. One third chose the option
“other”, and these four respondents specified individually that their industries are related with
automation, construction materials, wooden structures, and financial sector combined with IT
services. (See also Table 16 in Appendix 7.)
5.1.2 Size
Classification for size of the companies is based on EU standards. As seen in Figure 6, most
of the respondents are working in micro companies. 15% are working in small, medium, or
large companies. 8% of the total respondents are working for a macro company. (See also
Table 17 in Appendix 7.)
Figure 6: Number of the companies‟ employees (n=13)
5.1.3 Turnover
Figure 7 illustrates that most of the companies have a turnover of 2 million or less. 23% are
working in a company with the yearly revenue of EUR€ 21-30 million. In total, 8% of the
respondents revealed the turnover of the company is EUR€ 2-10 million, as well as another
8% responded their turnover is EUR€ 11-20 million. None of the companies have the turno-
ver between EUR€ 31-50 million, but 15% of the companies exceed at least EUR€ 51 million
of revenue during the financial year. (See also Table 18 in Appendix 7.)
42,6 %
15,4 %
15,4 %
15,4 %
7,7 %
Micro (1-9)
Small (10-50)
Medium (51-250)
Large (251-1000)
Macro (1001 or over)

38
Figure 7: Turnover of the companies (n=13)
5.1.4 Time in business
Figure 8 demonstrates that majority of the companies have entered the business between the
last 1-5 years.
Figure 8: Companies‟ time in business (n=13)
There are 8% of companies that have been established between the last 6-10 years, as well as
other 8% between the last 11-15 years. Another considerable group besides the 1-5 years ago
established companies, is the group of companies, which have entered the market at least 16
years ago. (See also Table 19 in Appendix 7.)
46,2 %
7,7 %
7,7 %
23,1 %
0,0 %
0,0 %
15,4 % Less than EUR€ 2 million
EUR€ 2-10 million
EUR€ 11-20 million
EUR€ 21-30 million
EUR€ 31-40 million (0%)
EUR€ 41-50 million (0%)
EUR€ 51 million or more
0,0 %
53,8 %
7,7 %
7,7 %
30,8 % Less than 1 year (0%)
1-5 years
6-10 years
11-15 years
16 years or more

39
5.1.5 The position of the respondent
Nearly all of the respondents belong to top management in the company according to the
Figure 9.
Figure 9: The position of the respondent in the company (n=13)
Remaining 8% represent the middle management. This improves the validity of the survey as
managers make investment decisions and have wide knowledge of the market. (See also Table
20 in Appendix 7.)
5.1.6 Time of the market entry into the UK market
Figure 10 presents most of the companies, 54%, have entered to the UK market within 1-3
years.
Figure 10: Companies‟ time of the market entry into the UK (n=13)
92,3 %
7,7 % 0,0 %
Top management
Middle management
Employee (0%)
23,1 %
53,8 %
23,1 %
Company is expanding to theUK at the moment, or it hasexpanded <1yr ago
Company has expanded to theUK within 1-3 yrs
Company expanded to the UK>3yrs ago

40
There are 23% of new entrants, which have expanded to the UK less than one year ago, or
who are still strongly considering to invest in the UK. The amount of new entrants is being
offset by similar 23% of businesses, which have more than 3 years‟ experience of the UK
market. (See also Table 21 in Appendix 7.)
5.1.7 Investment sums into the UK market
All of the respondents have made financial investments to the UK as seen in Figure 11.
Figure 11: Companies investment sums into the UK market (n=13)
Almost half of the companies have invested estimated EUR€ 1-100 000 in the UK. There are
15% of companies that have invested EUR€ 100 001-200 000. Investment categories of EUR€
200 001-300 000, EUR€300 001-400 00, EUR€ 400 001-500 000 had 8 % respondents each.
There are 15% of the respondent‟s companies that have invested EUR€ 600 001 or more in
the UK market. (See also Table 22 in Appendix 7.)
5.1.8 Business structure in the UK
Figure 12 displays that wholly-owned subsidiary is the most common entry mode when going
to the UK with 54% of the companies. 15% have gone to the UK by signing partnership to
ease the market entry.
0,0 %
46,2 %
15,4 %
7,7 %
7,7 %
7,7 %
0,0 %
15,4 %
0 % 10 % 20 % 30 % 40 % 50 %
EUR€ 0
EUR€ 1-100 000
EUR€ 100 001-200 000
EUR€ 200 001-300 000
EUR€ 300 001-400 000
EUR€ 400 001-500 000
EUR€ 500 001-600 000
EUR€ 600 001 or more

41
Figure 12: Companies‟ business structures in the UK (n=13)
Amount of 8% had chosen to conduct a joint venture, and 23% answered “other”. The ones
who had answered “other” commented that they used branch office and UK Ltd stand alone
to enter the UK market. One respondent told his company is still importing to the UK,
though they have imported since 2006 and are now considering of making a foreign direct
investment. (See also Table 23 in Appendix 7.)
5.1.9 Preferred locations for business
There are 92% of companies that are located in Finland as can be noted in Figure 13.
Figure 13: Locations where companies are established at the moment (n=13)
15,4 %
7,7 %
53,8 %
23,1 %
0 % 20 % 40 % 60 % 80 % 100 %
Partnership
Joint venture
Wholly-owned subsidiary
Other* (please specify)
92,3 %
0,0 %
0,0 %
7,7 %
0,0 %
15,4 %
7,7 %
7,7 %
30,8 %
7,7 %
7,7 %
7,7 %
0,0 %
61,5 %
0 % 20 % 40 % 60 % 80 % 100 %
Finland
East of England
East Midlands
London
Northern Ireland
North East England
North West England
Scotland
South East England
South West England
Wales
West Midlands
Yorkshire and Humber
Other* than the UK or FIN (please specify)

42
South East England is the 2nd largest investment region in the UK among the Finnish
companies with 31% of businesses. In North East England there are 15% of investors. In
London, North West England, Scotland, South West England, Wales, and West Midlands
there are 8% of Finnish companies in each. East of England, East Midlands, Northern
Ireland, and Yorkshire and Humber do not have any Finnish investors according to the
respondents.
Most of the respondents, 62%, are also located in other countries. When respondents were
asked to specify in which other locations they are situated, 23% of the respondents answered
they are located in Sweden, as well as another 23% are located in the USA. Two companies
revealed as multinationals, as they mention they are present in 20 and 26 other countries. All
together 54% of the companies are located in four or more countries, if assumed that those
respondents who ticked “other”, are all located also in the UK and in Finland. (See also Table
24 in Appendix 7.)
5.1.10 Last time of contact with UK Trade and Investment
When considering all three companies that have expanded to the UK less than one year ago,
Figure 14 shows, one of them had been in contact with UKTI 2-6 months ago since the sur-
vey was conducted, one 7-12 months ago, and the third one during 2007-2008.
Figure 14: Last time the company was in contact with UK Trade and Investment (n=13)
33,3 %
33,3 %
33,3 %
28,6 %
28,6 %
14,3 %
28,6 %
0,0 %
0,0 %
33,3 %
33,3 %
0 % 10 % 20 % 30 % 40 % 50 %
Less than 2 months ago
2-6 months ago
7-12 months ago
During 2007-2008
During 2005-2006
During 2003-2004
Other (please specify)
Company is expanding to the UK at the moment, or it has expanded less than 1 yearago.
Company has expanded to the UK within 1-3 years.
Company was established in the UK more than 3 years ago.

43
The respondents included seven companies, which have expanded to the UK within 1-3 years.
Two companies have been in contact with UKTI in the past 2-6 months, one in the past 7-12
months and another two during 2007-2008.
There were three respondents, whose companies expanded to the UK more than three years
ago. Statistics reveal one of them was in contact with UKTI 2-6 months ago, one 7-12 months
ago, and third one predictably a long time ago, as the respondent had chosen “other” and
commented he could not remember when he had been last time in contact with UKTI. (See
also Table 25 in Appendix 7.)
5.2 UK as a business location by the client companies
All of the factors, which were included in the survey, are perceived in positive side of the
scale, above neutral (4). The total average of all of the factors is 4.84, and 10 out of 23 factors
are above the total average. (See also Figure 29 and Table 4 in Appendix 7.) The respondents
evaluated different factors in this question with following scale: 1=Strongly unfavourable,
2=Mostly unfavourable, 3=Partially unfavourable, 4=Neutral, 5=Partially favourable,
6=Mostly favourable, 7=Strongly favourable .
5.2.1 Political and legal factors
Foreign investors are interested in the host country‟s political environment especially of legal
stability, and possibilities to protect intellectual property against fraud and lost. Business can
be exposed to a risk of business loss due to a political instability, but as seen in Figure 15,
Finnish investors do not consider there are substantially unstable issues in the UK‟s political
environment that could have a critical effect to their companies.
Figure 15. Favourability of political and legal factors in the UK
5,15
4,69
4,92
4,84
1 2 3 4 5 6 7
Legal stability
Intellectual property rights
Political/legal total
All categories total
Mean
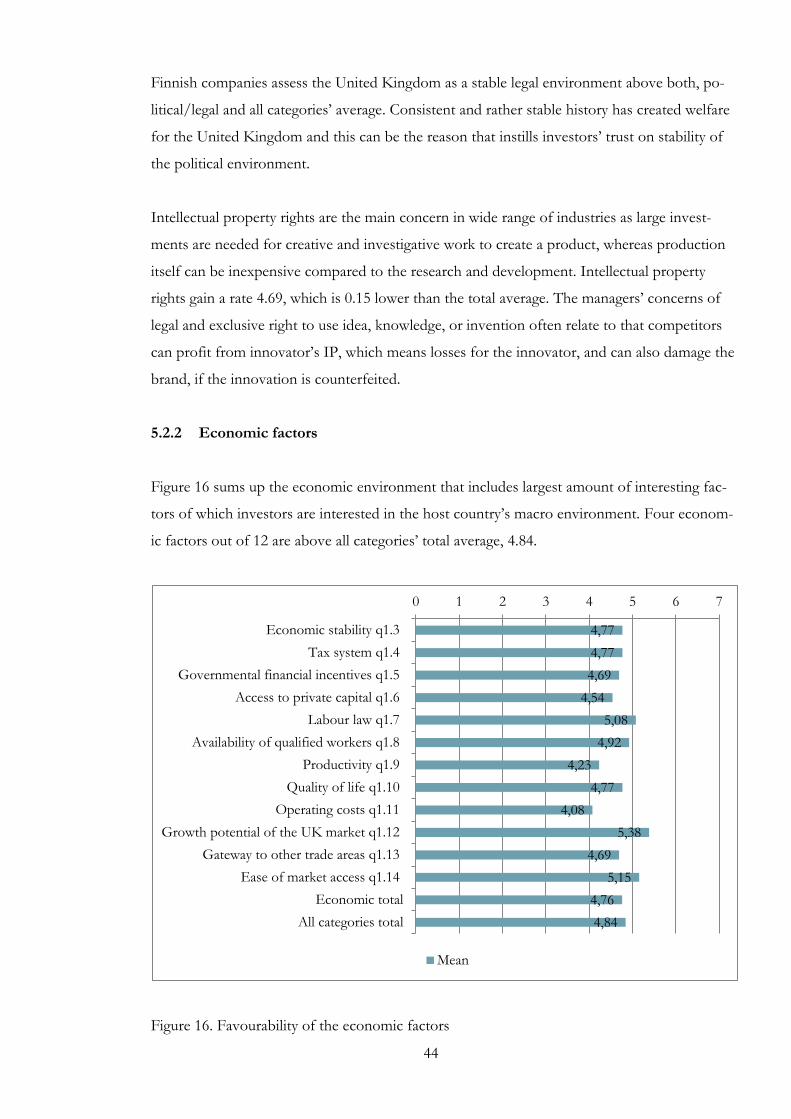
44
Finnish companies assess the United Kingdom as a stable legal environment above both, po-
litical/legal and all categories‟ average. Consistent and rather stable history has created welfare
for the United Kingdom and this can be the reason that instills investors‟ trust on stability of
the political environment.
Intellectual property rights are the main concern in wide range of industries as large invest-
ments are needed for creative and investigative work to create a product, whereas production
itself can be inexpensive compared to the research and development. Intellectual property
rights gain a rate 4.69, which is 0.15 lower than the total average. The managers‟ concerns of
legal and exclusive right to use idea, knowledge, or invention often relate to that competitors
can profit from innovator‟s IP, which means losses for the innovator, and can also damage the
brand, if the innovation is counterfeited.
5.2.2 Economic factors
Figure 16 sums up the economic environment that includes largest amount of interesting fac-
tors of which investors are interested in the host country‟s macro environment. Four econom-
ic factors out of 12 are above all categories‟ total average, 4.84.
Figure 16. Favourability of the economic factors
4,77
4,77
4,69
4,54
5,08
4,92
4,23
4,77
4,08
5,38
4,69
5,15
4,76
4,84
0 1 2 3 4 5 6 7
Economic stability q1.3
Tax system q1.4
Governmental financial incentives q1.5
Access to private capital q1.6
Labour law q1.7
Availability of qualified workers q1.8
Productivity q1.9
Quality of life q1.10
Operating costs q1.11
Growth potential of the UK market q1.12
Gateway to other trade areas q1.13
Ease of market access q1.14
Economic total
All categories total
Mean

45
The most favourable factor in the UK‟s economic environment is growth potential of the UK
market (q1.12). In Western countries, desired growth is described as steady real growth rates,
which are higher than the main competitors‟ rates, and the growth is based on investment in
technology and on increased exports, rather than on government spending, or current con-
sumption. Investors‟ perception of high growth potential is very advantageous for the UK, as
favourable growth forecast increases business confidence and often reflects in increased levels
of investment.
Second, most favourable factor is ease of market access (q1.14). It can be concluded that for-
eign investors are seen to generate economic growth for the UK and it has been efficient in
removing barriers, and the country supports companies by offering information to ease the
market access.
Labour law (q1.7) is perceived more favourable than the average with rate 5.08. Companies
usually prefer labour laws that are flexible, as flexibility eases company‟s recruitment, firing,
working hours‟ and working conditions‟ systems and salary negotiations. Flexible labour law
usually means also that trade unions have low power in the society.
The UK is perceived to have partially favourable amount of potential employees, as the bal-
ance between the need and supply of qualified workers (q1.8) is rated with 4.92. The qualified
employees have education and experience that corresponds the needs of the work.
Economic stability (q1.3) is perceived close, but below the average with a rate 4.77. Economic
stability often reflects also political stability, which the investors perceived more favourable
with rate 5.15 in the survey. Economic growth, unemployment, interest and exchange rates are
also highly connected to the economic stability, and due to the UK‟s steep downturn, these
are potential reasons, why economic stability is depressed below the average.
Tax system (q1.4) is also rated below the average with the same rate as economic stability with
rates 4.77. When investors assess taxes they typically evaluate income taxes and the impact of
payroll taxes, sales taxes, property taxes, inventory taxes, and specialized taxes on the cost of
company‟s operations. Businesses‟ opinion about the tax system could be improved if gov-
ernment would reduce overall taxation or increase government spending, as then people
would be able to buy more from businesses. Investors also prefer tax allowances and reduc-
tions in taxes on company profits, and these procedures encourage businesses to increase
spending on investments.

46
Quality of life reflects the welfare of the region and its residents. Economic environment im-
pacts on social development. Quality of life (q1.10) is a third factor, which is perceived close,
but below the total average with a rate 4.77. Quality of life is important for companies that try
to attract trained and sophisticated employees.
Governmental financial incentives (q1.5) are perceived lower than the previously mentioned
factors with a mean 4.69. Assuming that offered incentives would be more favourable for the
investors they could be more interested in investing to the UK as financial incentives provide
loan guarantees, wage subsidies and ease companies to acquire land and buildings.
Companies, which are eager to internationalize around the world, respect business locations,
which they consider as suitable areas for international networking. Countries that act as gate-
ways into other important trade areas have also efficient internationalization possibilities for
businesses. Investors evaluate this factor (q1.13) in the UK host country with a rate 4.69.
The resource acquisition is particularly important for businesses, which doubt they have
enough capital to finance the foreign investment. Access to private capital in the UK market
(q1.6) is evaluated with a mean 4.54. Problematic to SMEs, which most of the UKTI‟s clients
are, can be the fact that financial institutions prefer larger, well established firms, because
small and medium sized firms perceive higher risk. This may lead SMEs to obtain capital from
sources, which offer financing at high interest rate.
Productivity (q1.9) is rated 4.23, and it is the second least favourable factor in the UK market
compared to all other factors, which investors may be attracted and interested in, when they
are considering investing to the UK. The low rate of the productivity suggests the costs are
too high in the UK compared to the volume or quality of the production and outcome. Ac-
cording to the survey, the investors perceive the labour law and availability of qualified work-
ers rather favourable. This finding suggests that the main concern with productivity does not
originate from labour.
The most unattractive factor in the UK market is operating costs (q1.11) with a rating 4.08.
Operating costs consist mainly of quality of labour force, training assistance, wage rates, union
activity, tax burden, quality of life, property and building costs, utility costs, transportation
costs, start-up incentives. The list includes factors, which gained comparatively good rate from
the investors in the survey, such as labour law (q1.7) and availability of qualified workers
(q1.8), which affect also on training assistance, wage rates, and union activity. Quality of life

47
(q1.10), tax system (q1.4) and financial incentives (q1.5) were also perceived comparatively
high. This suggests that property and building costs, utility costs, and transportation costs
should be examined further to be able to identify if among them, there are significant reasons,
which lowers the average of the operating costs and productivity. In addition, it should be
noted that productivity and operating costs are also dependable on the company‟s own ability
to create profitable and sustainable strategies, and manage them correctly.
5.2.3 Social and cultural factors
All three factors in the social and cultural factors‟ category in Figure 17 have an equal rating of
5.15. Thus, social and cultural environment is appreciated as the most favourable environment
in the UK market.
Figure 17: Favourability of the social and cultural factors in the UK
Investors‟ ease to adapt in the British culture can be based on patience, flexibility and toler-
ance for others‟ beliefs. The ease of adapting can be based also in a wide range of cultural sim-
ilarities in verbal and nonverbal language, religion, values and attitudes, manners and customs,
material elements, aesthetics, education, and social institutions.
Managers make location decisions based on hard facts, but also on their perceptions. Investors
have partially favourable image of the UK as business location. The investors perceive the UK
also as a friendly location for their business. The UK‟s attitude toward the businesses refers to
positive business climate. Business climate adds up different factors related what company
considers important for its business and operations.
5,15
5,15
5,15
5,15
4,84
0 1 2 3 4 5 6 7
Ease of adapting to culture
UK's business experience
UK's attitude toward your business
Social/cultural total
All categories total
Mean

48
5.2.4 Technological factors
All three factors of the technological environment are perceived below the average. Figure 18
illustrates transport infrastructure as well as communications and technology infrastructure,
which are both 4.62.
Figure 18: Favourability of the technological factors in the UK
Transport infrastructure is important for companies, which operations are dependent of phys-
ical distribution of freight or passengers. Communications and technology infrastructure con-
tribute to the businesses‟ working habits and marketing systems. If communications and tech-
nology infrastructure could be improved, the businesses in the United Kingdom would have
fewer difficulties to create content and deliver it efficiently through various communication
tools for people involved in business. Technology tightens competition and upgrades the
speed to communicate, and thus reduces also needed workforce.
The lowest factor in the technology category is the level of research and development with a
mean 4.38. Research and development is also the third lowest factor in the whole environment
after economical environment‟s productivity and operating costs. Level of research and devel-
opment is especially important for businesses that conduct foreign investments with a goal to
develop and improve products and processes according to company specific needs, or to gen-
erate new technology and innovations to gain competitive advantage.
4,62
4,62
4,38
4,54
4,84
1 2 3 4 5 6 7
Communications and technology
Transport infrastructure
Level of research and development
Technological total
All categories total
Mean

49
5.2.5 Business related factors
Business related factors comprise the only group, which falls into company‟s microenviron-
ment. Companies are able to influence better on microenvironment through its strategy and
actions than on macroenvironment. Figure 19 represents situating near the customers can be
considered as the main attraction factor why investors are establishing the business to the UK.
Figure 19: Favourability of the business related factors in the UK
Proximity to clients gained the most favourable rating among the UK market factors, which
raises remarkably the average of the business category. Businesses, which situate near their
customers, have better capabilities to perform the service or produce a product according to
the wishes of the customer and to decrease the complexity of delivering it.
Proximity to suppliers and resources is lower than both of the averages. Companies, which
can locate near their suppliers and resources are more flexible with orders and have fewer
costs than if they would locate further.
Proximity to industry cluster receives rate 5.08, which is similar to the total average. Investors
respect locating near industry clusters, as regions with clusters have greater competitive ad-
vantage. The geographic clusters are dynamic and future oriented especially in knowledge ac-
tivities, which are driven by innovation and potential technology, rather than existing industry
linkages.
5,08
5,62
4,62
5,11
4,84
1 2 3 4 5 6 7
Proximity to industry cluster
Proximity to clients
Proximity to suppliers and resources
Business total
All categories total
Mean

50
5.2.6 Challenging factors in the UK market
Figure 20 shows that the companies, which have expanded to the UK less than one year ago
(3 respondents), answered to this question most often; on average 2 responses were given per
respondent. (See also Table 10 in Appendix 7.)
Figure 20: The most challenging factors in the UK market along companies‟ expansion pro-
cesses (n=13)
The factors, which were included in the Question 2, were chosen especially to concentrate on
the UK market factors in the macroenvironment, which companies cannot influence directly.
13 respondents were given a chance to choose 1-3 factors each. There could have been 36
responses if all eligible respondents would have named the most possible amount of challeng-
ing factors. Altogether, 18 responses were received.
33,3 %
33,3 %
33,3 %
33,3 %
33,3 %
28,6 %
14,3 %
28,6 %
57,1 %
100,0 %
33,3 %
0 % 20 % 40 % 60 % 80 % 100 %
Inconsistency or uncertainty in legislation
Financial issues such as obtainingloans/credit
Communications or technology or transportinfrastructure
Labour related issues such as inflexibility oflabour regulations
Illegal activities such as crime, corruption,discrimination
Lack of accurate and helpful information
Barriers in establishing a business
Other (please specify)
Company is expanding or has expanded to the UK <1yr ago
Company has expanded to the UK within 1-3yrs
Company expanded to the UK >3yrs ago
51
There were 33% of respondents in each of the following options: Inconsistency or uncertainty
in legislation, communications or technology or transport infrastructure, labour related issues,
lack of accurate information and “other”. Newest entrants have not faced problems with fi-
nancial issues nor in crime. Barriers for establishing a business to the UK seem to have been
low for the businesses that have expanded less than one year ago to the UK market.
When considering companies, which have expanded to the UK within 1-3 years, each re-
spondent gave approximately 1.3 answers. One third of the respondents responded they find
financial issues challenging. Amount of 14% had also answered illegal activities are a challeng-
ing factor for them. Crime, corruption, and disruption, are related to political stability, but
they are mostly out of government control. Illegal activities can reduce the benefits the foreign
investor expects to gain when company invests in a foreign country. Over half of the group,
58%, answered the option “other”.
The companies, which have expanded to the UK more than three years ago seem to have
overcome challenging factors and forgot most of them, assuming companies do face challeng-
es in the foreign market especially in the start of the internationalization process, as the figures
of the new entrants suggest. Respondents answered to this question averagely as many times
as the companies, which have expanded to the UK within 1-3years (1.3 times). Financial is-
sues, such as obtaining loans and credit, are seen as the most challenging factor in the UK
market according to the companies (3 respondents), which have been in the UK for the long-
est time. Financing is a vital issue for companies, as the foreign investments are more likely to
stay profitable and grow in the market with the help of sufficient financing. In addition, the
respondent group had marked as other challenging factor only the option “other”.
The “other” option received most of the answers. Half of the respondents who ticked “oth-
er”, described issues, which would be possible to be solved by the effort and decisions of the
company itself. As the study concerns to research the UK market instead companies own
strategies to go and succeed abroad, following issues related to microenvironment are not
discussed further. These were the answers related to the company‟s microenvironment:
– “There are no negative factors in the UK market, but we face challenges in our sales work”
– “Lack of customers”
– ”Potential customers lack awareness of our product.”

52
Comments related to macroenvironment, in which company cannot influence, were:
– “Problems in communication with HMRC regarding VAT registration”
– ”Tax increase”
– ”Very conservative approach to new players in the market.”
Taxes were discussed in the chapter 2.2: Economic environment; and approach to new players
in the market, was discussed in relation to the question about attitude toward investor‟s com-
pany, in chapter 2.3: Social and cultural environment.
5.3 Companies’ perception of operating in the UK now and in the future
Predicting five years ahead can be considered as a long period of time especially for small and
medium sized companies, particularly in economy, which has suffered high losses during the
last couple of years. However, companies seem to be determined and positive about their fu-
ture. The determination is reflected in consistent answers that managers gave to different sug-
gestions what will happen to their companies as Figure 21 shows.
Figure 21: Companies‟ perception of operating in the UK market area now and during the
next five years (Scale: 1=Strongly disagree, 2=Mostly disagree, 3=Partially disagree,
4=Neutral, 5=Partially agree, 6=Mostly agree, 7= Strongly agree)
5,77
5,23
1,62
2,00
3,38
4,38
0 1 2 3 4 5 6 7
Most of the company's operations increase.
Company's operations increase especially in theUK.
Most of the company's operations decline.
Company's operations decline especially in theUK.
Company stays in the UK, but parts of UKoperations are moved outside.
Company faces other changes, than presentedabove.
Mean

53
The determination can also be deduced from most of the answers by noting they are far from
the option neutral (4). When asked about the managers‟ prediction of their companies‟ futures,
the respondents were substantially in favour of that their operations increase. This corre-
sponds to the fact that respondents mostly disagree that most of the company‟s operations
would decrease. Companies partially agreed that their operations increase especially in the UK.
This was consistent with that managers mostly disagreed that company‟s operations would
decline especially in the UK. It was partially disagreed that companies stay in the UK but parts
of UK operations are moved outside. Respondents were rather neutral to option, which
claimed company faces other changes than presented above. (See also Table 11 in Appendix
7.)
5.4 Service quality of UK Trade and Investment according to the clients
It can be noted UKTI has succeeded quite well in satisfying their clients with dimensions that
are important for clients. Respondents evaluated service quality with following 7-Likert scale:
Significance scale: 1=Very insignificant, 2=Mostly significant, 3=Partially insignificant,
4=Neutral, 5=Partially significant, 6=Mostly significant, 7= Strongly significant; Dimension
scale: 1=Strongly disagree, 2=Mostly disagree, 3=Partially disagree, 4=Neutral, 5=Partially
agree, 6=Mostly agree, 7= Strongly agree. (See also Figure 29 and Tables 12-13 in Appendix
7.)
Figure 22: Dimensions of the service quality and their significance
6,15
5,92
5,77
5,31
4,38
5,51
5,54
5,6
5,54
5,07
5,18
5,38
0 1 2 3 4 5 6 7
q4.1-4.5; 5.1 Reliability
q4.6-4.9; 5.2Responsiveness
q4.10-4.13; 5.3 Assurance
q4.14-4.18; 5.4 Empathy
q4.19-4.22; 5.5 Tangibles
Total
Significance Dimension

54
5.4.1 Reliability
Clients observe reliability as the most important dimension in services, and thus the company
has to deliver what it promises for the clients related to service provision and problem resolu-
tion. Figure 23 indicates clients appreciate UKTI‟s ability to perform the promised service
dependably and accurately above the total average of all the dimensions.
Figure 23: Reliability
The clients mostly agree, with a rate 5.69, that when UKTI promises to do something by a
certain time, it does so; when client has a problem, UKTI‟s employees show sincere interest in
solving it; and UKTI provides its services according to the promised schedule. The clients are
bit more doubtful with the accuracy of received service, which lowers the average of the relia-
bility dimension. The clients partially agree, with a rate 5.38, that UKTI provides accurate in-
formation and UKTI performs the services right and without making mistakes with a rate
5.23.
It should be assured the employees have enough time to show interest in helping the client.
When the employees have time to concentrate on listen the client, the service provider can
5,23
5,38
4,92
4,38
5,46
5,07
0 1 2 3 4 5 6 7
Employees of UKTI provide individualassistance according to your company's specific
needs.
UKTI's employees deal clients in a caringfashion.
UKTI offers assistance keeping your company'sbest interests at heart.
Employees of UKTI understand your industryand business specific needs.
UKTI's operating hours are convenient forclients.
Total
Mean

55
offer correct information according to the client‟s requests and predictions prove accurate. By
doing this, performance is perceived sincere.
5.4.2 Responsiveness
UKTI‟s main strength in its services is that the employees are attentive and responding. The
clients appreciate that the employees are willing to help customers and provide prompt service
as the second most important issue in services after reliability. Employees of UKTI are seen
easy to contact in Figure 24 with a top rate 5.92. UKTI also gives prompt services for its cli-
ents according to a rate 5.85.
Figure 24: Responsiveness
Clients perceive that employees of UKTI can be sometimes too busy to assist the client. Even
though the responsiveness is UKTI‟s strongest dimension, the average would be even higher
if UKTI would be able to keep its customers better informed when it performs the services.
To prosper in responsiveness the companies need to have well-staffed service, which has time
to keep clients informed and respond to them according to the clients‟ standards for speed
and promptness.
5,15
5,85
5,92
5,46
5,60
0 1 2 3 4 5 6 7
UKTI keeps customers informed when UKTIwill perform its services.
Employees of UKTI give you prompt service.
Employees of UKTI are easy to contact.
Employees of UKTI are never too busy toassist you.
Total
Mean

56
5.4.3 Assurance
Assurance is particularly important in services that are perceived containing high risks. UKTI‟s
service itself does not include a risk, but investing abroad, which UKTI is trying to encourage
the companies, which have potential to do, can involve a considerable risk. According to Fig-
ure 25, UKTI‟s clients perceive employees' knowledge and courtesy and their ability to inspire
trust and confidence as the third most important dimension out of five. The average score for
statements related to assurance is 5.54, mostly agree. Employees of UKTI are seen consistent-
ly courteous with clients with 5.92. Clients also feel secure when they interact with UKTI 5.68.
Figure 25: Assurance
The employees of UKTI are evaluated slightly below the assurance average in that they are
professional and skillful when they perform their tasks with a rate 5.46. The clients perceive
also that UKTI‟s employees could instill more confidence in clients and their companies‟ ex-
pansion as the rate is 5.08.
Trust and confidence can be instilled better to clients by making sure the staff obtains training
regularly and the clients are aware of the qualifications of the staff. The reputation of the or-
ganization should be optimal and the brand should be aimed to be present in relevant contexts
such as in certain events and publications of which the target group is interested in.
5,08
5,69
5,92
5,46
5,54
0 1 2 3 4 5 6 7
The behaviours of UKTI's employees instillconfidence in you and your company's
expansion.
You feel secure when interacting with UKTI.
The employees of UKTI are consistentlycourteous with you.
Employees of UKTI appear professional andskillful when they perform their tasks.
Total
Mean

57
5.4.4 Empathy
Empathy means conveying through customized service and that specific needs of clients are
valued. Caring, individualized attention is considered as the second least significant service
dimension by the clients, and it receives the lowest average, 5.07, compared between all the
dimensions.
As seen in Figure 26, the convenience of UKTI‟s operating hours is functional as the operat-
ing hours are assessed relatively high with rate 5.46.
Figure 26: Empathy
The clients feel the employees care about the client companies according to a rate 5.46. Clients
perceive also above the average with a rate 5.23 that UKTI provides individual assistance ac-
cording to the company‟s specific needs.
Clients do not strongly believe UKTI offers assistance keeping the company‟s best interests at
heart, and the clients are more neutral than confident with that UKTI‟s employees understand
clients‟ industries and business specific needs. The service provider values the client‟s individ-
5,23
5,38
4,92
4,38
5,46
5,07
0 1 2 3 4 5 6 7
Employees of UKTI provide individualassistance according to your company's specific
needs.
UKTI's employees deal clients in a caringfashion.
UKTI offers assistance keeping yourcompany's best interests at heart.
Employees of UKTI understand your industryand business specific needs.
UKTI's operating hours are convenient forclients.
Total
Mean

58
uality by acknowledging and adapting to the client‟s specific needs. The clients should be rec-
ognized as individuals by getting to know the client and the company‟s industry.
5.4.5 Tangibles
Tangibles represent the service in physical context; Tangibles can be described in elements
that clients see and feel by experiencing the material the service provides for its clients. Figure
27 shows the significance of tangibles is low for the clients in UKTI‟s service, as UKTI‟s
strategy does not need to emphasize the importance of tangibles as part of the offered service.
Figure 27: Tangibles
The appearance of physical facilities, equipment, personnel, and written materials is the most
insignificant issue for the clients and the clients evaluate its significance in service with 4.38.
The tangibles are perceived almost neutral. The tangibles are evaluated with an average of
5.18, partially agree.
The appearance of the employees is in line with the expected business etiquette with a mean
5.62, and materials associated with the service look professional as a rate 5.54 suggests. It is
partially agree that the physical facilities of UKTI are visually appealing. Clients agree only
partially that technological equipment is appropriate and modern, and the statement receives
the second lowest rate between all the statements, 4.54. Investing some sums and time in
4,54
5,00
5,62
5,54
5,18
0 1 2 3 4 5 6 7
Technological equipment is appropriate andmodern.
The physical facilities of UKTI are visuallyappearing.
The employees of UKTI appear neat.
Materials associated with the service (e.g.reports, statements) are professional looking.
Total
Mean

59
physical evidence of the organization offers opportunity for a service to boost the image and
send consistent and strong messages about company‟s purpose, the intended segments and
the nature of the service.
5.4.6 Attribution of service success
Clients are also mostly satisfied with the performance of UK Trade and Investment as noted
in Figure 28. Customer satisfaction in service is not influenced only by the received service but
also client‟s personal factors, such as emotions and situational factors, such as others opinions
as well as post experiences, such as if company succeeded in the UK market or not, after
UKTI had assisted the company to go to the UK.
Figure 28: Overall perception of UKTI‟s services (Scale: 1=Strongly disagree, 2=Mostly disa-
gree, 3=Partially disagree, 4=Neutral, 5=Partially agree, 6=Mostly agree, 7= Strongly agree)
Customer satisfaction correlates in many cases with customer loyalty and thus it is significant
to understand how customer satisfaction can be improved. UKTI‟s clients agree partially that
using UKTI's services has provided value for the company's foreign investment when it is
compared to the time the company has spent with UKTI's services. Research suggests that
companies, which invest in service and excel in service, gain excess profit. Thus in UKTI‟s
5,62
5,31
6,00
5,64
1 2 3 4 5 6 7
I am satisfied with the performance of UKTrade and Investment.
I feel that UKTI's service provides value formy company's investment in the UK in
relation the time my company has spent withUKTI's services.
I would recommend UKTI's services forothers.
Total
Mean
60
case, increasing the satisfaction of UKTI‟s customers may also increase the favourability to
invest in the UK.
In services, much is still undefined at the point of purchasing the service even though the
length of the service, relationship and the cost can be defined beforehand. Best way to under-
stand the services experience qualities is to get information from a friend or an expert, who is
familiar with the service. The clients mostly agree they would recommend UKTI's services for
others. The positive attitude in recommending UKTI for others may influence on potential
clients to get on to UKTI.
5.5 UK related information UKTI’s clients are interested in receiving
Extensive figures can be found in Figure 30 and Table 15 in Appendix 7. Question 7 does not
relate specifically to any of the research question. The question was added to the survey, as
UKTI wished to gain information concerning what kind of UK related information UKTI‟s
clients are interested in receiving according to group division, based on when the companies
have expanded to the UK. The companies were asked to tick as many issues they wanted. All
together 13 answers were received which means on average respondent was interested to re-
ceive information of approximately 5.23 issues. Only 15% of all businesses responded they do
not need any information.
Companies that have expanded to the UK less than a year ago answered approximately 6
times per respondent. New entrants would be most interested in receiving information about
establishing business in the UK (q7.1) and human resources (q7.6). They would be also inter-
ested in being introduced to important contacts (q7.10) and growing industry networks
(q7.16).
Companies, which have expanded to the UK within 1-3 years answered approximately 5.86
times per investor. This group was interested in issues around how to grow the company in
the UK market. The respondents specified they would be interested to be introduced to im-
portant contacts (q7.10), identifying UK firms as for potential partners (q7.8), helping with
practical things (q7.13), finding new UK business opportunities (q7.14), knowing about ex-
pansion (q7.15), and growing industry networks in the UK (q7.16).
Companies, which expanded more than three years ago, are least in need of information of
UKTI. They answered approximately 3 times per respondent. They were in favour to be in-

61
troduced to important contact (7.10), identify UK firms as for potential partners (q7.8), taxa-
tion (q7.5), market research (q7.8), finding new UK business opportunities (q7.14), and grow-
ing industry networks (q7.16).
62
6 Summary and conclusion
This study had two main objectives. The first objective was to provide knowledge for UK
Trade and Investment about perceptions of their current and past clients, which are mainly
Finnish direct investors, concerning the UK market area as a business location. Factors that
relate on companies own strength to go abroad and abilities to manage the internationalization
process were set aside, and the concentration was specifically in the target market. The other
objective was to gather knowledge of how clients perceive the services of UKTI. UKTI pro-
motes foreign direct investments to the UK as these investments create wealth for the host
economy. Through the study, UKTI can understand better their clients‟ needs and wants, and
target the service better for clients in different stages of the investing processes, and thus, in-
crease Finnish investors investing to the UK market.
Methodology was quantitative. The questionnaire was sent to 77 potential respondents by
email. A series of 17 questions were asked in the questionnaire. The final response rate re-
mained in 17% even though two reminders were sent, and potential respondents were con-
tacted by phone and requested to submit the questionnaire. The low return rate risks the relia-
bility of generalizing the results. However, the validity of the study is high as the questionnaire
was prepared carefully based on theory and pre-tested to ensure the real respondents would
understand the questions correctly.
Over half of the companies are operating in information and communication technology in-
dustries, and other companies are operating in wide range of industries different from others.
Microcompanies are noticeably the largest customer group of UKTI. Half of the respondents
have been established between 1-5 years ago and have turnover more than EUR€ 2. Over half
of the companies have expanded to the UK within 1-3 years. All of the companies have in-
vested some amounts in the UK, but the largest group, 46%, has invested to the UK less than
EUR€ 100 000. Over half of the respondents have made a foreign direct investment. South
East England is the main business location of the respondents with 31% of companies, and
others locate rather evenly almost all around the UK. Most of the companies have gained ex-
perience also through other internationalization processes, as 62% of businesses are located in
a third country.

63
6.1 The UK as a business location
The investors perceive the UK as rather favourable business location. Two separate issues
stand out of the other factors as most favourable for Finnish investors: Businesses situate
close to their customers, and the investors believe in the UK‟s growth potential. UKTI should
let potential investors know that social and cultural environment attracts the Finnish investors
greatly. A respectable rating in the ease of access combined with the good rating in the social
environment suggests that the UK‟s open market policies have been implemented successful-
ly, and Finnish investors feel welcomed to do business in the UK. The labour law is also one
of the main issues attracting Finnish companies to do business in the UK. When considering
this from the theoretical aspect, the result refers the UK allows flexible policies for companies
considering their employees in the UK.
Investors seem to consider the UK as a stable legal environment, but the investors are not
confident with the economic stability. It was mentioned in the literature review, the economic
conditions often correlate with political stability. As the investors consider political stability
generally high, UKTI can instil trust on the UK‟s economy by emphasizing stable legal envi-
ronment. UKTI‟s clients should be also encouraged to evaluate the economy in the long-term,
rather than concentrating to unfavourable economic variables of the past two years, as direct
investments require long-term planning. The investors‟ trust on the sustained long-term
growth can be improved as well by emphasizing the UK‟s growth potential and the high busi-
ness experience, the investors consider the UK has.
The main challenges for UKTI‟s clients are costs and their relation to effectiveness; operating
costs and productivity are clearly least favourable factors among all the issues. Communica-
tions and technology, transport infrastructure, and level of research and development have
been judged relatively low as well. UKTI should discuss about the technological factors in
addition to the cost factor with clients to make them aware and prepared to overcome chal-
lenges related to cons of the UK market. According to the literature review large investments
are needed in creative and investigative work to create the product, whereas manufacturing
has typically relatively low costs. Thus, especially companies that are operating in research and
development should be aware of the cost factors.
There was a separate question for challenging factors in the UK. Companies, which have ex-
panded to the UK less than one year ago, had faced more challenges than others. Newest en-
trants have faced challenges equally in inconsistency or uncertainty in legislation, communica-

64
tions or technology or transport infrastructure, labour related issues, lack of accurate infor-
mation. The result suggests insecurity in the company, which is reasonable for a business op-
erating in the new environment. One third of the companies, which have expanded to the UK
within 1-3 years, responded they find financial issues challenging. Amount of 14% had also
answered illegal activities are a challenging factor for them, which can reduce the benefits the
foreign investor expects to gain when company invests in a foreign country. Over half of the
group, 58%, answered to option “other”. The investors that have been in the UK longer than
3 years perceive financial issues, such as obtaining loans and credit, as the most challenging
factor in the UK. According to the literature review, resource acquisition is important for
business, which doubts if it has enough capital to finance foreign direct investment. Foreign
direct investments are more likely to survive and grow in the new market with the aid of ade-
quate capital, as the business can respond better to the needs of a new market than without
external financing. The option “other” received most of the answers in total. Half of the re-
spondents, who ticked “other”, described issues, which would be possible to be solved by the
effort and decisions of the company itself, but as mentioned before this study concentrated to
research especially the UK‟s ability to function as a business location. Companies should eval-
uate if they have strengths to go abroad, and if so, UKTI should increase assistance in seeking
financing.
Predicting five years ahead can be considered as a long period of time especially for small and
medium sized companies, particularly in economy, which has suffered high losses during the
last couple of years. Still, the companies seem to be highly determined and quite positive
about their future in the UK market. The determination can be reasoned from most of the
answers, which were far from the neutral opinion and the answers were consistent between
others.
6.2 The services of UK Trade and Investment
UKTI should keep on paying attention especially to responsiveness, reliability and assurance,
as according to the clients, UKTI has successfully done. Responsiveness, reliability and assur-
ance are the most significant dimensions for clients in UKTI‟s services. As UKTI is evaluated
well in the dimensions that clients value the most important in received service, the result is
that most of the clients are well satisfied to UKTI and they would recommend UKTI‟s ser-
vices for others. The key strengths of UKTI are that the employees are easy to contact and
they offer prompt service (responsiveness), employees deliver what UKTI has promised for
the clients (reliability), and the employees are consistently courteous and clients feel secure

65
when interacting with UKTI‟s organization and its employees (assurance). These statements
are part of the most significant dimensions, and the customer satisfaction can be improved
even further by devoting to other dimensions‟ statements.
There are two statements that lower the total average of the service quality. Fortunately, they
belong to dimensions that clients do not prioritize as the most important issues in the service:
Clients are not convinced UKTI understands their industry and their business specific needs
(empathy); and clients consider technological equipment could be improved to be more ap-
propriate and modern (tangibles). Trainings should be organized and these events should be
easy to attend for the employees to gain deeper knowledge of most popular industries in
which UKTI‟s clients are operating. According to the literature review, expenses should be cut
elsewhere than from customer service if company needs to improve its financial status, in this
case strengthening the UK investing. Downsizing in service can prove critical if the customers
perceive their demands and needs are not fulfilled properly. The client companies are not as
sure if UKTI‟s services provide value for the company‟s investment compared the time the
clients have spent to UKTI‟s services, which is bit unexpected as UKTI offers assistance for
free and the connection is not intense. When assisting the companies, it could be reminded for
the clients the service provide creates the service always together with the client and the result
is usually better the more intensively the client participates to the service, as the literature re-
view suggests.
UKTI should contact their past clients and keep contact with their current clients also in the
future as only 15% of the respondents consider they do not need any information from
UKTI. The companies that are most interested in staying in contact with UKTI, are the cli-
ents that have expanded to the UK less than three years ago. If resources enable, UKTI
should offer aftercare services for investors that have been in the UK for a longer time.
6.3 Conclusion and suggestions for further research
The goals of the study were successfully met as UK Trade and Investment received infor-
mation they had wished to gain from their clients‟ perceptions and opinions. Old presump-
tions that Finnish investors are attracted to invest in the UK because of strong market poten-
tial and culture were explained further, and the closeness of the customers revealed as the
most favourable factor in the UK market. The Finnish investors have trust in the UK market
and their investments in the UK. Additionally, UKTI gained information about how its clients
perceive their service. The clients showed readiness to recommend the service for others as

66
they seemed also to be well satisfied to the service, though there are always issues in the cus-
tomer service and understanding clients, which can be improved. UK Trade and Investment
can further use this study as the basis to understand the clients‟ expectations and perceptions
to provide more focused service for different segments according in which stage the company
is in the internationalization process, and to attract companies to make new direct investments
to the UK market.
It is important to be aware of customers‟ needs, interests and current opinions about the ser-
vice. It would be effective to conduct similar kind of study later for UK Trade and Investment
or to find another way to receive feedback regularly. This would secure that UKTI would be
able to maintain providing accurate information about the UK market as thus, it would be
sure UKTI could be aware of changing needs of the clients continuously. The primary data
collection methods should be changed as it was witnessed during this study, the clients of
UKTI that are mostly top management, answer to email questionnaires rarely. The form could
concentrate only on one main topic to decrease the length of the questionnaire and time need-
ed to provide feedback. Feedback could be collected in UKTI‟s events, where potential target
group would be present, or a feedback form could be sent to the client after being recently in
contact with the company. An organized and updated database, which could contain the most
important details about the clients, would improve UKTI‟s knowledge related to their clients,
and ease UKTI contacting especially the clients that UKTI has not been in contact recently.

67
Bibliography
Aaltonen, M. 16.12.2009. Investment Adviser. UK Trade & Investment. E-mail message.
Anholt, S. 2007. Competitive Identity. The New Brand Management for Nations, Cities and
Regions. Palgrave Macmillan, New York.
Bruhn M. & Georgi D. 2006. Services Marketing, Managing the Service Value Chain. Pearson
Education Limited, Essex. United Kingdom.
Bryman A. & Bell E. 2003. Business Research Methods. Oxford University Press. USA.
Czinkota M. & Ronkainen I. 2010. Principles of International Marketing. 9th Edition. South-
Western, Cengage Learning. Canada.
Ghauri P. & Grønhaug K. 2005. Research Methods in Business Studies. 3rd Edition. Pearson
Education Limited, Essex. United Kingdom.
Grönroos C. 2001. Service Management and Marketing, a Customer Relationship Manage-
ment Approach. 2nd Edition. John Wiley & Sons Ltd, West Sussex. United Kingdom.
Heikkilä T. 2004. Tilastollinen tutkimus [Statistical Research]. 5th Edition. Edita Prima Oy.
Helsinki.
Hollensen S. 2007. Global Marketing. 4th Edition. Pearson Education Limited, Harlow. United
Kingdom.
Jobber D. 2010. Principles of Marketing. 6th Edition. McGraw-Hill Education, Berkshire.
United Kingdom.
Kasper H., Helsdingen P., & Vries W. 1999. Services Marketing Management. John Wiley &
Sons Ltd, Chichester. United Kingdom.
Keegan W. 2002. Global Marketing Management. 7th Edition. Pearson Education, New Jersey.
United States of America.

68
Keegan W. & Green M. 2008. Global Marketing. 5th Edition. Pearson Education, New Jersey.
United States of America.
Kotabe M. & Helsen K. 2004. Global Marketing Management. 3rd Edition. John Wiley and
Sons, Inc., Hoboken. United States of America.
Kotler P., Asplund C., Rein I. & Haider D 1999. Marketing Places Europe. 2nd Edition. Pear-
son Education Limited, Harlow. United Kingdom.
Kvantimotv 2009. Kvantitatiivisten menetelmien tietovaranto.
http://www.fsd.uta.fi/menetelmaopetus/intro.html. Quoted 30.5.2010.
Laulajainen, R. & Stafford H. 1995. Corporate Geography Business Location Principles and
Cases. Kluwer Academic Publishers Group, Dordrecht. Netherlands.
McCann P. 2002. Industrial Location Economics. Edward Elgar Publishing Limited, Chelten-
ham. United Kingdom.
Official Statistics of Finland 2009. Finnish subsidiaries abroad in 2007.
http://www.tilastokeskus.fi. Quoted 17.3.2010.
Office for National Statistics 2009. Population Change.
http://www.statistics.gov.uk/cci/nugget.asp?ID=950. Quoted 3.12.2009.
Saunders M., Lewis P. & Thornhill A. 2009. Research Methods for Business Students. 5th Edi-
tion. Pearson Education, Essex. United Kingdom.
Scarborough N. & Zimmerer T. 2003. Effective Small Business Management; An Entrepre-
neurial Approach. 7th Edition. Pearson Education, New Jersey. United States of America.
Shane S. 2005. A General Theory of Entrepreneurship. EDWARD Elgar Publishing Inc.
Cheltenham. United Kingdom.
UKTI 2009, UK Trade and Investment. UKTI: Your springboard for global growth: A guide
to how UKTI can help international investors set up their business in the UK.
http://www.ukinvest.gov.uk/UKTI-publications/4049380/en-GB.html. Quoted 5.12.2009.

69
UKTI 2008, UK Trade and Investment. Your springboard for global growth: An overview of
UK Trade & Investment services, Norwich. United Kingdom.
Worthington I. & Britton C. 2006. The Business Environment. 5th Edition. Pearson Educa-
tion, Essex. United Kingdom.
Zeithaml V. Bitner M. &. Gremler D. 2009. Services Marketing. 5th Edition. McGraw-Hill
Companies, New York.
Zimmerer T. & Scarborough N. 2008. Essentials of Entrepreneurship and Small Business
Management. 5th Edition. Pearson Education, New Jersey. United States of America.

70
Appendices
Appendix 1. Adaptation of the SERVPERF scale to UKTI related statements
Table 7. SERVPERF SCALE adapted to UKTI
Dimension Question Adapted items
Corresponding items from the SERVPERF scale
Reliability Rel.1
When UKTI promises to do something by a cer-tain time, it does so.
When the service pro-vider promises to do something by a certain time, it does so.
Reliability Rel.2
When you have a prob-lem, UKTI‟s employees show a sincere interest in solving it.
When you have a prob-lem, the service provider shows a sincere interest in solving it.
Reliability Rel.3
UKTI performs the ser-vice right and without making mistakes.
The service provider performs the service right the first time.
Reliability Rel.4
UKTI provides its ser-vices according to the schedule/opening hours etc. it has promised.
The service provider provides its services at the time it promises to do so.
Reliability Rel.5 UKTI provides accurate information.
The service provider insists on error-free rec-ords.
Responsiveness Resp.1
UKTI keeps customers informed when UKTI will perform its services.
The service provider keeps customers in-formed about when ser-vices will be performed.
Responsiveness Resp.2 Employees of UKTI give you prompt service.
Employees of the service provider give you prompt service.
Responsiveness Resp.3 Employees are easy to contact.
Employees of the service provider are always will-ing to help you.
Responsiveness Resp.4
Employees of UKTI are never too busy to assist you.
Employees of the service provider are never too busy to respond to your request.
Assurance A1
The behaviours of UKTI‟s employees instil confidence in you and your company‟s expan-sion.
The behaviour of the service provider‟s em-ployees instils confi-dence in you.
Assurance A2 You feel secure when interacting with UKTI.
You feel safe in your transactions with the service provider.

71
Assurance
A3
The employees of UKTI are consistently courte-ous with you.
The employees of the service provider are con-sistently courteous with you.
Assurance A4
Employees of UKTI appear professional and skilful when they per-form their tasks.
The employees of the service provider have the knowledge to answer your questions.
Empathy E1
Employees of UKTI provide individual assis-tance according to your company‟s specific needs.
The service provider gives you individual at-tention.
Empathy E2
UKTI‟s employees deal clients in a caring fash-ion.
The service provider has employees who deal customers in a caring fashion.
Empathy E3
UKTI offers assistance keeping your company‟s best interests at heart.
The service provider has your best interests at heart.
Empathy E4
Employees of UKTI understand your industry and business specific needs.
Employees of the service provider understand your specific needs.
Empathy E5 UKTI‟s operating hours are convenient.
The service provider has operating hours that are convenient to all its cus-tomers.
Tangibles T1
Technological equip-ment is appropriate and modern.
The service provider has modern-looking equip-ment.
Tangibles T2
The physical facilities of UKTI are visually ap-pearing.
The physical facilities of the service provider are visually appealing.
Tangibles T3 The employees of UKTI appear neat.
The employees of the service provider appear neat.
Tangibles T4
Materials associated with the service (e.g. reports, statements) are profes-sional looking.
Materials associated with the service (e.g. reports, statements) are visually appealing at the service provider.
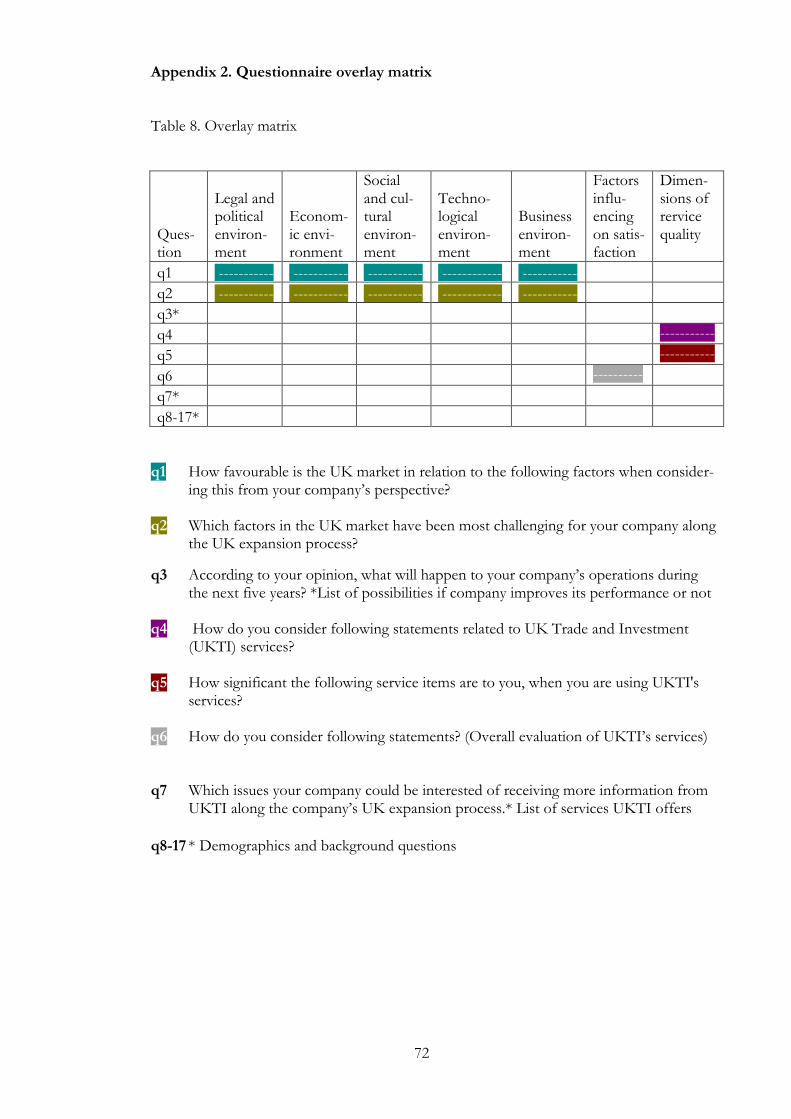
72
Appendix 2. Questionnaire overlay matrix
Table 8. Overlay matrix
Ques-tion
Legal and political environ-ment
Econom-ic envi-ronment
Social and cul-tural environ-ment
Techno-logical environ-ment
Business environ-ment
Factors influ-encing on satis-faction
Dimen-sions of rervice quality
q1 ----------- ----------- ----------- ------------ -----------
q2 ----------- ----------- ----------- ------------ -----------
q3*
q4 -----------
q5 -----------
q6 ----------
q7*
q8-17*
q1 How favourable is the UK market in relation to the following factors when consider-ing this from your company‟s perspective?
q2 Which factors in the UK market have been most challenging for your company along
the UK expansion process?
q3 According to your opinion, what will happen to your company‟s operations during the next five years? *List of possibilities if company improves its performance or not
q4 How do you consider following statements related to UK Trade and Investment
(UKTI) services? q5 How significant the following service items are to you, when you are using UKTI's
services? q6 How do you consider following statements? (Overall evaluation of UKTI‟s services) q7 Which issues your company could be interested of receiving more information from
UKTI along the company‟s UK expansion process.* List of services UKTI offers
q8-17 * Demographics and background questions

73
Appendix 3. Survey cover letter
Dear Respondent,
You are invited to participate in a survey targeted for companies that are already estab-
lished in the UK, or regard this as an option. The survey gathers information about your
opinions related to the UK as a business location and the services of UK Trade and In-
vestment (UKTI). The research is conducted by a third party, student from HAAGA-
HELIA University of Applied Sciences, for UKTI in Helsinki.
The survey has been sent to present and past customers of UKTI. Through the survey,
UKTI is able to improve its service.
The answers are dealt confidentially with respect towards the respondent. The third party
publishes the results in a way that they cannot be identified with you or your company.
Each response is very highly appreciated!
UKTI hopes, you will take the time to complete this survey, and return it by Friday,
12.3.2010. The survey should take you about 10 minutes to complete. If you face technical
problems or you have any concerns related to the survey, please contact the author by
email: [email protected]
UK Trade and Investment appreciates your time and would like to thank you for taking
part in this survey. Link to the UK as a Business Location and Services of UK Trade and Invest-
ment survey can be found below.
Kind Regards,
Merituuli Iisalo
http://www.webropol.com/p.aspx?t=1&l=417212_b31953c4c0474ffd

74
Appendix 4. Survey reminder 1
Dear Respondent,
UK Trade and Investment has been assisting you in the UK related questions. You have
been sent earlier an invitation to take part in a survey concerning the UK as a market area
and the services of UK Trade and Investment (UKTI) in Helsinki.
This email reminds that as a current or past client of UKTI, receiving your opinions would
be extremely important and highly valued, as your opinions are in a very significant role in
the success of the whole research project. The project is the final work of student of
HAAGA-HELIA University of Applied Sciences.
By expressing opinions, the services of UKTI can be enhanced. I wish you would submit
the answers by this week.
I would like to thank you greatly from behalf of myself and UK Trade and Investment.
Best Regards,
Merituuli Iisalo
Please, follow the link to the survey:
http://www.webropol.com/p.aspx?t=1&l=417212_b31953c4c0474ffd

75
Appendix 5. Survey reminder 2
Good Morning,
UK Trade and Investment (UKTI) is conducting a survey at the moment, which gathers
UKTI's current and past clients' opinions about UK as a business location and UK Trade
and Investment services.
Unfortunately, we have not received a respond from You yet, but we hope that You would
click the link below and submit the response as soon as possible. The target group for the
survey is limited, thus Your individual opinion matters and is very highly appreciated. The
survey takes ~10 minutes to complete.
Providing Your answers enables UK Trade and Investment to improve their service focus-
ing on customer point of view.
I would like to thank You greatly from behalf of myself and UK Trade and Investment.
Best Regards,
Merituuli Iisalo,
Author of the survey
Please, follow the link to the survey:
http://www.webropol.com/p.aspx?t=1&l=417212_b31953c4c0474ffd

76
Appendix 6. Questionnaire
Survey page 1: Opinions about the UK as a business location
1) How favourable is the UK market in relation to the following factors when con-
sidering this from your company’s perspective?
Strongly unfavourable
Mostly unfa-vourable
Partially unfavourable
Neutral Partially favourable
Mostly favourable
Strongly favoura-
ble
Legal stability
Intellectual pro-perty rights
Economical stabi-lity
Tax system
Governmental financial incen-tives
Access to private capital
Labour law
Availability of qualifies workers
Productivity
Quality of life
Operating costs
Growth potential of the UK market
Gateway to other trade areas
Ease of market access
Ease of adapting to culture
Information, communications, and technology infrastructure

77
Transport infra-structure
Level of research and development
Proximity to in-dustry cluster
Proximity to cli-ents
Proximity to sup-pliers and re-sources
UK‟s experience and knowledge in business
UK‟s overall atti-tude toward your kind of business
2) Which factors in the UK market have been most challenging for your company
along the UK expansion process? (Please, choose 1-3 factors.)
Inconsistency or uncertainty in legislation
Financial issues such as obtaining loans/credit, banking and liquidity system, payment for goods
Inadequate information, communications and technology infrastructure or transport infra-structure
Labour related issues such as lack of needed workers, inflexibility of labour regulations,
Illegal activities such as crime, corruption, discrimination
Lack of accurate and helpful information
Barriers in establishing a business such as protectionism, complicated procedures
Other (please specify) 3) According to your opinion, what will happen to your company’s operations during the next five years?
Strongly disagree
Mostly disagree
Partially disagree
Neutral Partially agree
Mostly agree
Strongly agree
Most of the company‟s opera-tions increase.
Company‟s operations in-crease especially in the UK.
Most of the company‟s opera-tions decline.
Company‟s operations decline especially in the UK.
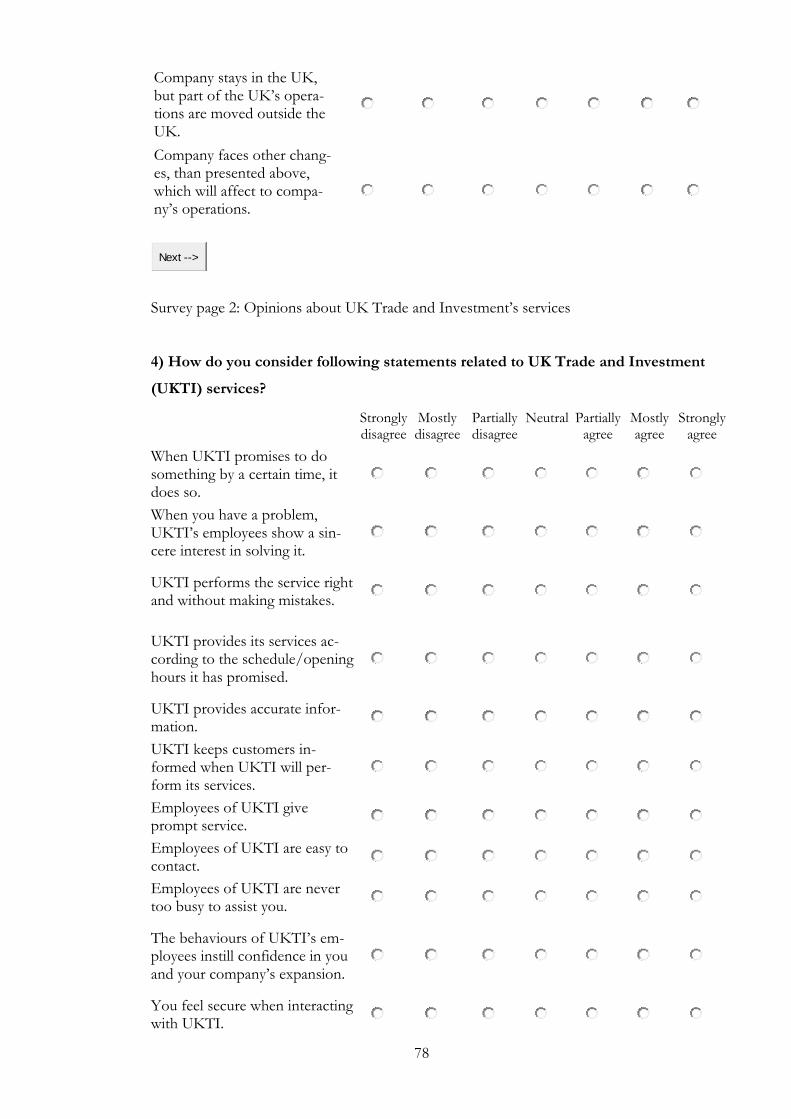
78
Company stays in the UK, but part of the UK‟s opera-tions are moved outside the UK.
Company faces other chang-es, than presented above, which will affect to compa-ny‟s operations.
Survey page 2: Opinions about UK Trade and Investment‟s services
4) How do you consider following statements related to UK Trade and Investment
(UKTI) services?
Strongly disagree
Mostly disagree
Partially disagree
Neutral Partially agree
Mostly agree
Strongly agree
When UKTI promises to do something by a certain time, it does so.
When you have a problem, UKTI‟s employees show a sin-cere interest in solving it.
UKTI performs the service right and without making mistakes.
UKTI provides its services ac-cording to the schedule/opening hours it has promised.
UKTI provides accurate infor-mation.
UKTI keeps customers in-formed when UKTI will per-form its services.
Employees of UKTI give prompt service.
Employees of UKTI are easy to contact.
Employees of UKTI are never too busy to assist you.
The behaviours of UKTI‟s em-ployees instill confidence in you and your company‟s expansion.
You feel secure when interacting with UKTI.
Next -->

79
The employees of UKTI are consistently courteous with you.
Employees of UKTI appear professional and skillful when they perform their tasks.
Employees of UKTI provide individual assistance according to your company‟s specific needs.
UKTI‟s employees deal clients in a caring fashion.
UKTI offers assistance keeping your company‟s best interests at heart.
Employees of UKTI understand your industry and business spe-cific needs.
UKTI‟s operating hours are convenient for clients.
Technological equipment is ap-propriate and modern.
The physical facilities of UKTI are visually appearing.
The employees of UKTI appear neat.
Materials associated with the service (e.g. reports, statements) are professional looking.
5) How significant the following service items are to you, when you are using
UKTI's services?
Very insig-nificant
Mostly in-significant
Partially insignificant
Neutral Partially significant
Mostly significant
Very sig-nificant
Ability to perform the promised ser-vice dependably and accurately
Willingness to help customers and provide prompt service

80
Employees‟ knowledge and courtesy and their ability to inspire trust and confi-dence
Caring, individual-ized attention given to clients
Appearance of physical facilities, equipment, per-sonnel, and writ-ten materials
Survey page 3
6) How do you consider following statements?
Strongly disagree
Mostly disagree
Partially disagree
Neutral Partially agree
Mostly agree
Strongly agree
I am satisfied with the perfor-mance of UK Trade and In-vestment.
I feel that UKTI‟s service pro-vides value for my company‟s investment in the UK in relation the time my company has spent with UKTI‟s services.
I would recommend UKTI‟s services for others.
Next -->

81
7) Which issues your company could be interested of receiving more information
from UKTI along the company’s UK expansion process. (You can choose several
options.)
Where and how business can be set up
Funding
Market entry data
Research and development
Taxation
Human resources
Administrative regulations, including legal and financial matters
Market research
Tackling cultural and language related issues to ease communication
Introducing important contacts for networking possibilities
Access to the UK Advisory Network list of professional service organizations (such as lawyers and accountants)
Identifying UK firms as for potential strategic business partners
Helping with practical things (such as selecting suitable trade fairs, making visits to important locations, assistance in accessing the financial incentives)
Finding new UK business opportunities, when the company is already established in the UK
Knowing about expanding in/from the UK or choosing a new location in the UK, when the company is already established in the UK
Growing industry networks in the UK, when the company is already established in the UK
Knowing how to have a say in the UK government, when the company is already es-tablished in the UK
Knowing about trading overseas to/from the UK, when the company is already estab-lished in the UK
Setting up headquarters to the UK, when the company is already established in the UK
No information is needed.
Other (please specify)
Next -->

82
Survey page 4: Background information of your company is needed for statistical analyses
only.
8) Which one best describes the main industry your company is currently operat-
ing?
Information and Communication Technology (includes telecommunications, software, creative and media)
Environmental (includes environmental technologies, renewable energies, energy, effi-cient technologies)
Healthcare (includes medical technologies, life sciences)
Other (please specify)
9) What is the number of your company’s employees?
Micro (1-9)
Small (10-50)
Medium (51-250)
Large (251-1000)
Macro (1001 or over)
10) What is the turnover of your company?
Less than EUR€ 2 million
EUR€ 2-10 million
EUR€ 11-20 million
EUR€ 21-30 millio
EUR€ 31-40 million
EUR€ 41-50 million
EUR€ 51 or more
11) How long has your company been in business approximately?
Less than 1 year
1-5 years
6-10 years

83
11-15 years
16 years or more
12) Which position best describes your position in the company?
Top management
Middle management
Employee
Survey page 5
13) Which of the following best describes the situation of your company?
Company is expanding to the UK at the moment, or it has expanded less than 1 year ago.
Company has expanded to the UK within 1-3 years.
Company was established in the UK more than 3 years ago.
Other (please specify)
14) How much money your company has approximately invested in the UK during
your company’s life cycle?
EUR€ 0
EUR€ 1-100 000
EUR€ 100 001-200 000
EUR€ 200 001- 300 000
EUR€ 300 001-400 000
EUR€ 400 001- 500 000
EUR€ 500 001- 600 000
EUR€ 600 001 or more
15) Which of the following business structure best describes your company’s in-vestment in the UK at the moment/Which of the following business structure it is most likely to take when investing to the UK at the first time?
Partnership
Next -->
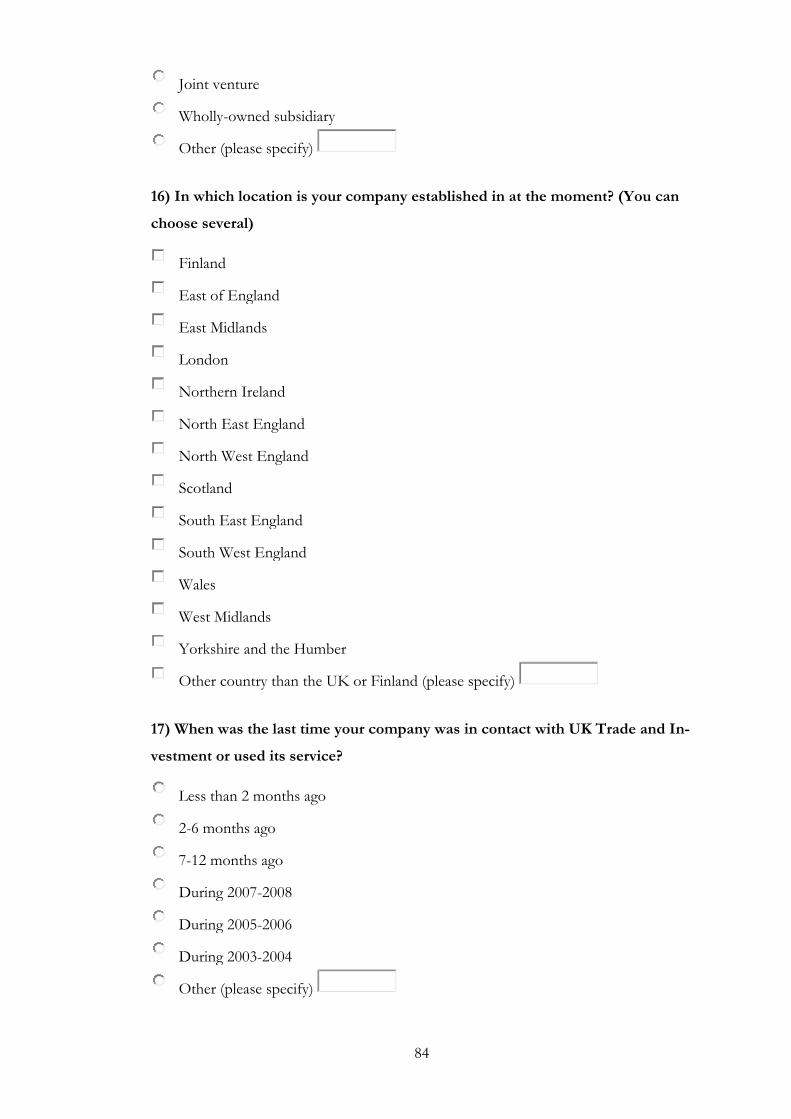
84
Joint venture
Wholly-owned subsidiary
Other (please specify)
16) In which location is your company established in at the moment? (You can
choose several)
Finland
East of England
East Midlands
London
Northern Ireland
North East England
North West England
Scotland
South East England
South West England
Wales
West Midlands
Yorkshire and the Humber
Other country than the UK or Finland (please specify)
17) When was the last time your company was in contact with UK Trade and In-
vestment or used its service?
Less than 2 months ago
2-6 months ago
7-12 months ago
During 2007-2008
During 2005-2006
During 2003-2004
Other (please specify)

85
Thank you; Your participation was important!
Submit

86
Appendix 7. Results of the questionnaire
Figure 29. Question 1: How favourable is the UK market in relation to the following fac-
tors when considering this from your company‟s perspective?
5,15
4,69
4,77
4,77
4,69
4,54
5,08
4,92
4,23
4,77
4,08
5,38
4,69
5,15
5,15
4,62
4,62
4,38
5,08
5,62
4,62
5,15
5,15
4,84
0 1 2 3 4 5 6 7
q1.1 Legal stability
q1.2 Intellectual property rights
q1.3 Economical stability
q1.4 Tax system
q1.5 Governmental financial incentives
q1.6 Access to private capital
q1.7 Labour law
q1.8 Availability of qualified workers
q1.9 Productivity
q1.10 Quality of life
q1.11 Operating costs
q1.12 Growth potential of the UK market
q1.13 Gateway to other trade areas
q1.14 Ease of market access
q1.15 Ease of adapting to culture
q1.16 Communications&technology
q1.17 Transport infrastructure
q1.18 Level of research and development
q1.19 Proximity to industry cluster
q1.20 Proximity to clients
q1.21 Proximity to suppliers and resources
q1.22 UK's business experience
q1.23 UK's attitude toward your business
Total
Mean

87
Table 9. Question 1
q1. How favourable is the UK market in relation to the following factors when considering this from your company's perspective? Mean Median Valid (N)
Mis-sing (N)
q1.1 Legal stability 5,15 5,00 13 0
q1.2 Intellectual property rights 4,69 5,00 13 0
q1.3 Economic stability 4,77 5,00 13 0
q1.4 Tax system 4,77 5,00 13 0
q1.5 Governmental financial incentives 4,69 5,00 13 0
q1.6 Access to private capital 4,54 4,00 13 0
q1.7 Labour law 5,08 5,00 13 0
q1.8 Availability of qualified workers 4,92 5,00 13 0
q1.9 Productivity 4,23 4,00 13 0
q1.10 Quality of life 4,77 5,00 13 0
q1.11 Operating costs 4,08 4,00 13 0
q1.12 Growth potential of the UK market 5,38 5,00 13 0
q1.13 Gateway to other trade areas 4,69 5,00 13 0
q1.14 Ease of market access 5,15 6,00 13 0
q1.15 Ease of adapting to culture 5,15 5,00 13 0
q1.16 Information, communications and technol-ogy infrastructure 4,62 5,00 13 0
q1.17 Transport infrastructure 4,62 5,00 13 0
q1.18 Level of research and development 4,38 4,00 13 0
q1.19 Proximity to industry cluster 5,08 5,00 13 0
q1.20 Proximity to clients 5,62 6,00 13 0
q1.21 Proximity to suppliers and resources 4,62 4,00 13 0
q1.22 UK's business experience 5,15 5,00 13 0
q1.23 UK's attitude toward your business 5,15 5,00 13 0
Total 4,84 4,84 13 0

88
Table 10: Questions 2 & 13
q13. Which of the following best describes the situation of your company?
q2. Which factors in the UK market have been most challenging for your company along the UK expansion process? (Choose 1-3 factors)
q13.1 Company is expand-ing to the UK at the moment, or it has expanded less than 1 year ago.
q13.2 Company has ex-panded to the UK within 1-3 years
q13.3 Company was estab-lished in the UK more than 3 years ago Total
q2.1 Inconsistency or uncertainty in the legislation
Count
1 0 0 1
% of Total 33,3% 0,0 % 0,0 % 7,7%
q2.2 Financial issues such as ob-taining loans/credit, banking and liquidity system, payment for goods
Count
0 2 3 5
% of Total 0,0 % 28,6% 100,0 % 38,5 %
q2.3 Inadequate information, communications and technology infrastructure or transport infra-structure
Count
1 0 0 1
% of Total 33,3 % 0,0 % 0,0 % 7,7%
q2.4 Labour related issues such as lack of needed workers, inflexibil-ity of labour regulations
Count
1 0 0 1
% of Total 33,3 % 0,0 % 0,0 % 7,7 %
q2.5 Illegal activities such as crime, corruption, discrimination
Count
0 1 0 1
% of Total 0,0 % 14,3% 0,0 % 7,7 %
q2.6 Lack of accurate and helpful information
Count
1 0 0 1
% of Total 33,3 % 0,0 % 0,0 % 7,7 %
q2.7 Barriers in establishing a business such as protectionism, complicated procedures
Count
0 2 0 2
% of Total 0,0 % 28,6% 0,0 % 15,4%
q2.8 Other* (please specify) Count
1 4 1 6
% of Total 33,3% 57,1% 33,3% 46,2%
Total
Count 5 9 4 18
Answers per re-spondent 1,67 1,29 1,33 1,39

89
* q2.9 Respondents‟ comments:
– There are no negative factors in the UK market, but we face challenges in our sales
work.
– Communication with HMRC regarding VAT registration
– Lack of customers
– Potential customers lack awareness about our product
– Tax increase
– Very conservative approach to new players in the market
Table 11. Question 3
q3. According to your opinion, what will happen to your company's operations during the next five years? Mean Median
Valid (N)
Missing (N)
q3.1 Most of the company's operations increase.
5,77 6,00 13 0
q3.2 Company's operations increase especially in the UK. 5,23 6,00 13 0
q3.3 Most of the company's operations decline.
1,62 1,00 13 0
q3.4 Company's operations decline especially in the UK. 2,00 1,00 13 0
q3.5 Company stays in the UK, but part of UK operations are moved outside. 3,38 4,00 13 0
q3.6 Company faces other changes, than present-ed above. 4,38 4,00 13 0
Total 3,73 3,67 13 0
Table 12. Question 4
q4. How do you consider following statements related to UK Trade and Investment (UKTI) services? Mean Median
Valid (N)
Missing (N)
q4.1 When UKTI promises to do something by a certain time, it does so.
5,69 6,00 13 0
q4.2 When you have a problem, UKTI's em-ployees show a sincere interest in solving it.
5,69 6,00 13 0
q4.3 UKTI performs the service right and with-out making mistakes.
5,23 6,00 13 0

90
q4.4 UKTI provides its services according to the schedule/opening hours it has promised.
5,69 6,00 13 0
q4.5 UKTI provides accurate information.
5,38 6,00 13 0
q4.6 UKTI keeps customers informed when UKTI will perform its services.
5,15 6,00 13 0
q4.7 Employees of UKTI give prompt service.
5,85 7,00 13 0
q4.8 Employees of UKTI are easy to contact.
5,92 6,00 13 0
q4.9 Employees of UKTI are never too busy to assist you.
5,46 6,00 13 0
q4.10 The behaviours of UKTI's employees in-stil confidence in you and your company's ex-pansion. 5,08 5,00 13 0
q4.11 You feel secure when interacting with UKTI.
5,69 6,00 13 0
q4.12 The employees of UKTI are consistently courteous with you.
5,92 6,00 13 0
q4.13 Employees of UKTI appear professional and skilful when they perform their tasks.
5,46 6,00 13 0
q4.14 Employees of UKTI provide individual assistance according to your company's specific needs. 5,23 5,00 13 0
q4.15 UKTI's employees deal clients in a caring fashion.
5,38 6,00 13 0
q4.16 UKTI offers assistance keeping your company's best interests at heart.
4,92 5,00 13 0
q4.17 Employees of UKTI understand your in-dustry and business specific needs.
4,38 4,00 13 0
q4.18 UKTI's operating hours are convenient for clients.
5,46 6,00 13 0
q4.19 Technological equipment is appropriate and modern.
4,54 4,00 13 0
q4.20 The physical facilities of UKTI are visually appearing.
5,00 5,00 13 0
q4.21 The employees of UKTI appear neat.
5,62 6,00 13 0
q4.22 Materials associated with the service (e.g. reports, statements) are professional looking.
5,54 6,00 13 0
Total 5,38 5,68 13 0

91
Figure 29. Question 5: Significance of the service items when using UKTI‟s services
Table 13. Question 5
q5. How significant the following service items are to you, when you are using UKTI's services? Mean Median
Valid (N)
Missing (N)
q5.1 Ability to perform the promised service dependably and accurately
6,15 6,00 13 0
q5.2 Willingness to help customers and provide prompt service
5,92 6,00 13 0
q5.3 Employees' knowledge and courtesy and their ability to inspire trust and confidence
5,77 6,00 13 0
q5.4 Caring, individualized attention given to clients
5,31 5,00 13 0
q5.5 Appearance of physical facilities, equipment, personnel, and written materials
4,38 5,00 13 0
Total 5,51 5,60 13 0
6,15
5,92
5,77
5,31
4,38
5,51
0 1 2 3 4 5 6 7
Ability to perform the promised servicedependably and accurately (Reliability)
Willingness to help customers and provide promptservice (Responsiveness)
Employees' knowledge and courtesy and theirability to inspire trust and confidence (Assurance)
Caring, individualized attention given to clients(Empathy)
Appearance of physical facilities, equipment,personnel, and written materials (Tangibles)
Total
Mean
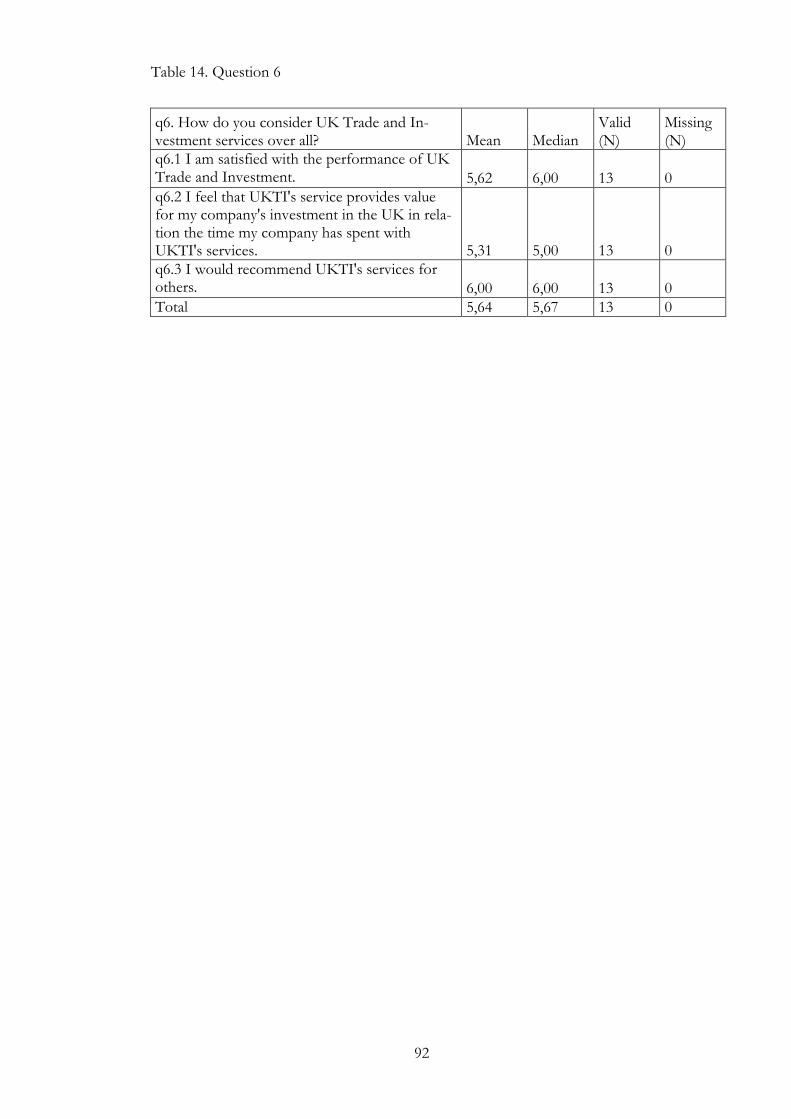
92
Table 14. Question 6
q6. How do you consider UK Trade and In-vestment services over all? Mean Median
Valid (N)
Missing (N)
q6.1 I am satisfied with the performance of UK Trade and Investment. 5,62 6,00 13 0
q6.2 I feel that UKTI's service provides value for my company's investment in the UK in rela-tion the time my company has spent with UKTI's services. 5,31 5,00 13 0
q6.3 I would recommend UKTI's services for others. 6,00 6,00 13 0
Total 5,64 5,67 13 0

93
Figure 30.Questions 7 & 13:Issues, companies could be interested in receiving more infor-
mation from UKTI (Choose several) *When the company is already established in the UK
66,7 %
33,3 %
33,3 %
33,3 %
66,7 %
33,3 %
33,3 %
66,7 %
33,3 %
33,3 %
33,3 %
66,7 %
33,3 %
33,3 %
28,6 %
57,1 %
57,1 %
0,0 %
14,3 %
57,1 %
14,3 %
57,1 %
14,3 %
57,1 %
42,9 %
42,9 %
42,9 %
42,9 %
14,3 %
14,3 %
14,3 %
14,3 %
0,0 %
33,3 %
33,3 %
66,7 %
66,7 %
33,3 %
33,3 %
33,3 %
0 % 20 % 40 % 60 % 80 % 100 %
q7.1 Where and how business can be set up
q7.2 Funding
q7.3 Market entry data
q7.4 Research and development
q7.5 Taxation
q7.6 Human resources
q7.7 Administrative regulations, including legaland financial matters
q7.8 Market research
q7.9 Tackling cultural and language related issuesto ease communication
q7.10 Introducing important contacts fornetworking possibilities
q7.11 Access to the UK Advisory Network list ofprofessional service organizations
q7.12 Identifying UK firms as for potentialstrategic business partners
q7.13 Helping with practical things
q7.14Finding new UK business opportunities*
q7.15 Knowing about expanding in/from theUK or choosing a new UK location*
q7.16 Growing industry networks in the UK*
q7.17 Knowing how to have a say in the UKgovernment*
q7.18 Knowing about trading overseas to/fromthe UK*
q7.19 Setting up headquarters to the UK*
q7.20 No information is needed.
q7.21Other (please specify)
q13.1 Company is expanding to the UK at the moment, or it has expanded less than 1 year ago.
q13.2 Company has expanded to the UK within 1-3 years.
q13.3 Company was established in the UK more than 3 years ago.

94
Table 15. Questions 7 & 13
q13. Which of the following best describes the situation of your company?
q7. Which issues your company could be interested in receiving more information from UKTI along the company's UK ex-pansion process. (You can choose several options.)
q13.1 Company is expand-ing to the UK at the moment, or it has expanded less than 1 year ago.
q13.2 Company has ex-panded to the UK with-in 1-3 years.
q13.3 Company was estab-lished in the UK more than 3 years ago. Total
q7.1 Where and how business can be set up
Count 2 2 0 4
% of Total 66,7% 28,6 % 0,0 % 30,8 %
q7.2 Funding Count 1 4 0 5
% of Total 33,3 % 57,1 % 0,0 % 38,5 %
q7.3 Market entry data Count 1 4 0 5
% of Total 33,3 % 57,1 % 0,0 % 38,5 %
q7.4 Research and development Count 0 0 0 0
% of Total 0,0 % 0,0 % 0,0 % 0,0 %
q7.5 Taxation Count 1 1 1 3
% of Total 33,3 % 14,3 % 33,3 % 23,1 %
q7.6 Human resources Count 2 0 0 2
% of Total 66,7 % 0,0 % 0,0 % 15,4 %
q7.7 Administrative regulations, including legal and financial matters
Count 1 0 0 1
% of Total 33,3 % 0,0 % 0,0 % 7,7 %
q7.8 Market research Count 1 4 1 6
% of Total 33,3 % 57,1 % 33,3 % 46,2 %
q7.9 Tackling cultural and lan-guage related issues to ease communication
Count 0 1 0 1
% of Total 0,0 % 14,3 % 0,0 % 7,7 %
q7.10 Introducing important contacts for networking possi-bilities
Count 2 4 2 8
% of Total 66,7 % 57,1 % 66,7 % 61,5 %
q7.11 Access to the UK Advi-sory Network list of profes-sional service organizations (such as lawyers and account-ants)
Count
0 1 0 1
% of Total
0,0 % 14,3 % 0,0 % 7,7 %
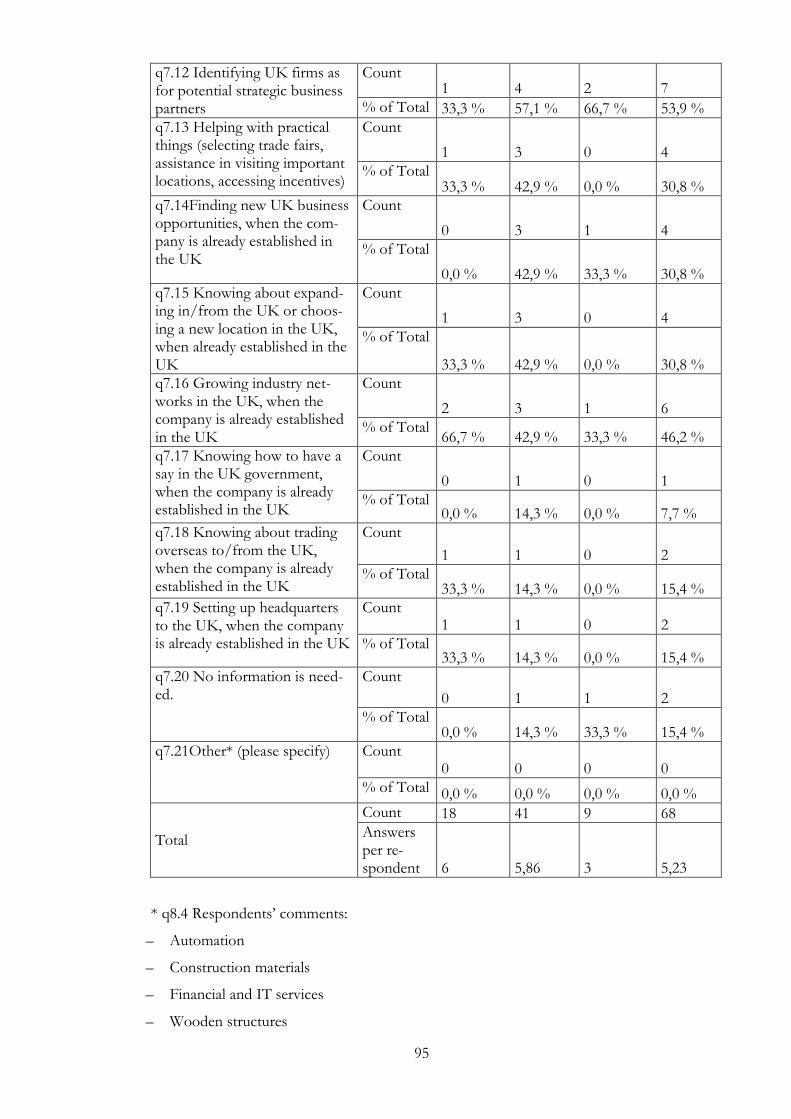
95
q7.12 Identifying UK firms as for potential strategic business partners
Count 1 4 2 7
% of Total 33,3 % 57,1 % 66,7 % 53,9 %
q7.13 Helping with practical things (selecting trade fairs, assistance in visiting important locations, accessing incentives)
Count
1 3 0 4
% of Total 33,3 % 42,9 % 0,0 % 30,8 %
q7.14Finding new UK business opportunities, when the com-pany is already established in the UK
Count
0 3 1 4
% of Total
0,0 % 42,9 % 33,3 % 30,8 %
q7.15 Knowing about expand-ing in/from the UK or choos-ing a new location in the UK, when already established in the UK
Count
1 3 0 4
% of Total
33,3 % 42,9 % 0,0 % 30,8 %
q7.16 Growing industry net-works in the UK, when the company is already established in the UK
Count
2 3 1 6
% of Total 66,7 % 42,9 % 33,3 % 46,2 %
q7.17 Knowing how to have a say in the UK government, when the company is already established in the UK
Count
0 1 0 1
% of Total 0,0 % 14,3 % 0,0 % 7,7 %
q7.18 Knowing about trading overseas to/from the UK, when the company is already established in the UK
Count
1 1 0 2
% of Total 33,3 % 14,3 % 0,0 % 15,4 %
q7.19 Setting up headquarters to the UK, when the company is already established in the UK
Count 1 1 0 2
% of Total 33,3 % 14,3 % 0,0 % 15,4 %
q7.20 No information is need-ed.
Count
0 1 1 2
% of Total 0,0 % 14,3 % 33,3 % 15,4 %
q7.21Other* (please specify) Count 0 0 0 0
% of Total 0,0 % 0,0 % 0,0 % 0,0 %
Total
Count 18 41 9 68
Answers per re-spondent 6 5,86 3 5,23
* q8.4 Respondents‟ comments:
– Automation
– Construction materials
– Financial and IT services
– Wooden structures
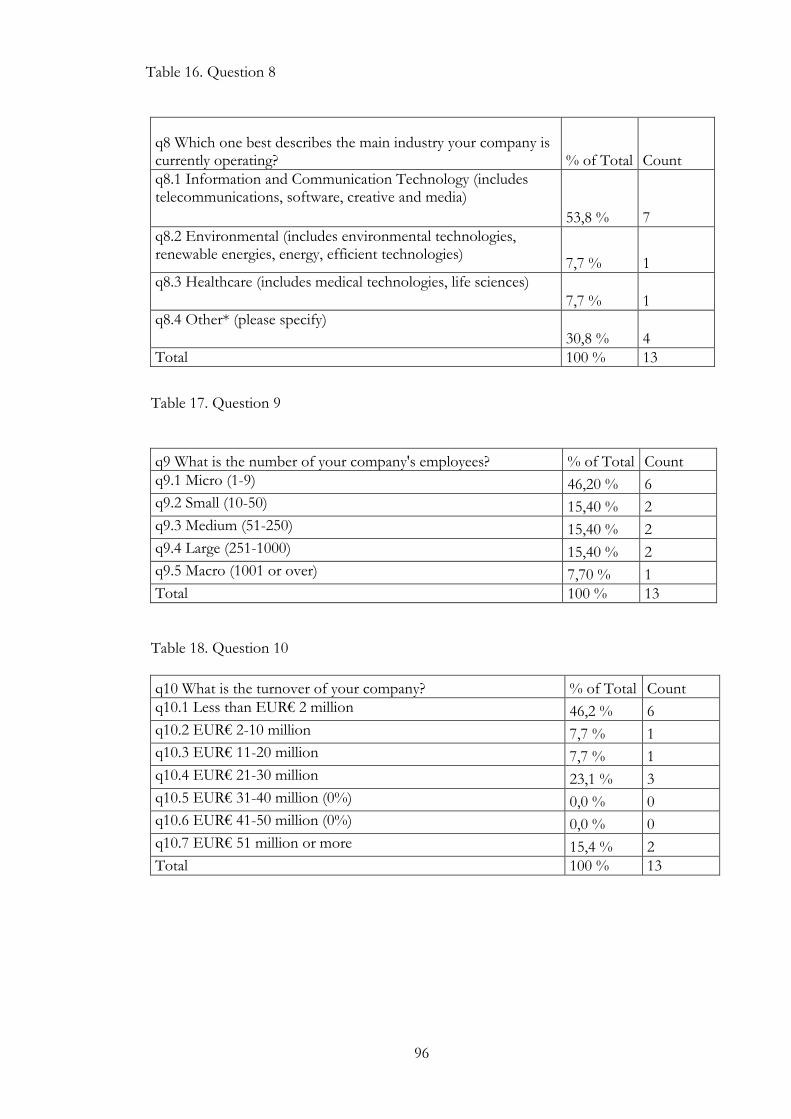
96
Table 16. Question 8
q8 Which one best describes the main industry your company is currently operating? % of Total Count
q8.1 Information and Communication Technology (includes telecommunications, software, creative and media)
53,8 % 7
q8.2 Environmental (includes environmental technologies, renewable energies, energy, efficient technologies)
7,7 % 1
q8.3 Healthcare (includes medical technologies, life sciences)
7,7 % 1
q8.4 Other* (please specify)
30,8 % 4
Total 100 % 13
Table 17. Question 9
q9 What is the number of your company's employees? % of Total Count
q9.1 Micro (1-9) 46,20 % 6
q9.2 Small (10-50) 15,40 % 2
q9.3 Medium (51-250) 15,40 % 2
q9.4 Large (251-1000) 15,40 % 2
q9.5 Macro (1001 or over) 7,70 % 1
Total 100 % 13
Table 18. Question 10
q10 What is the turnover of your company? % of Total Count
q10.1 Less than EUR€ 2 million 46,2 % 6
q10.2 EUR€ 2-10 million 7,7 % 1
q10.3 EUR€ 11-20 million 7,7 % 1
q10.4 EUR€ 21-30 million 23,1 % 3
q10.5 EUR€ 31-40 million (0%) 0,0 % 0
q10.6 EUR€ 41-50 million (0%) 0,0 % 0
q10.7 EUR€ 51 million or more 15,4 % 2
Total 100 % 13

97
Table 19. Question 11
q11 How long has your company been in business approximate-ly? % of Total Count
q11.1 Less than 1 year (0%) 0,0 % 0
q11.2 1-5 years 53,8 % 7
q11.3 6-10 years 7,7 % 1
q11.4 11-15 years 7,7 % 1
q11.5 16 years or more 30,8 % 4
Total 100 % 13
Table 20. Question 12
q12 Which position best describes your position in the compa-ny?
% of To-tal Count
q12.1 Top management 92,3 % 12
q12.2 Middle management 7,7 % 1
q12.3 Employee (0%) 0,0 % 0
Total 100 % 13
Table 21. Question 13
q13 Which of the following best describes the situation of your company? % of Total Count
q13.1 Company is expanding to the UK at the moment, or it has expanded <1yr ago 23,10 % 3
q13.2 Company has expanded to the UK within 1-3 yrs 53,80 % 7
q13.3 Company expanded to the UK >3yrs ago 23,10 % 3
Total 100 % 13

98
Table 22. Question 14
q14 How much money your company has approximately invested in the UK during your company's life cycle? % of Total Count
q14.1 EUR€ 0 0,0 % 0
q14.2 EUR€ 1-100 000 46,2 % 6
q14.3 EUR€ 100 001-200 000 15,4 % 2
q14.4 EUR€ 200 001-300 000 7,7 % 1
q14.5 EUR€ 300 001-400 000 7,7 % 1
q14.6 EUR€ 400 001-500 000 7,7 % 1
q14.7 EUR€ 500 001-600 000 (0%) 0,0 % 0
q14.8 EUR€ 600 001 or more 15,4 % 2
Total 100 % 13
Table 23. Question 15
q15 Which of the following business structures best describes your company's investment in the UK at the moment, or which business structure it is most likely to take when investing to the UK at the first time? % of Total Count
q15.1 Partnership 15,4 % 2
q15.2 Joint venture 7,7 % 1
q15.3 Wholly-owned subsidiary 53,8 % 7
q15.4 Other* (please specify) 23,1 % 3
Total 100 % 13
* q15.4 Respondents‟ comments:
– Branch office
– UK Ltd stand alone
– We started business in the UK in 2006, but we are still only importing
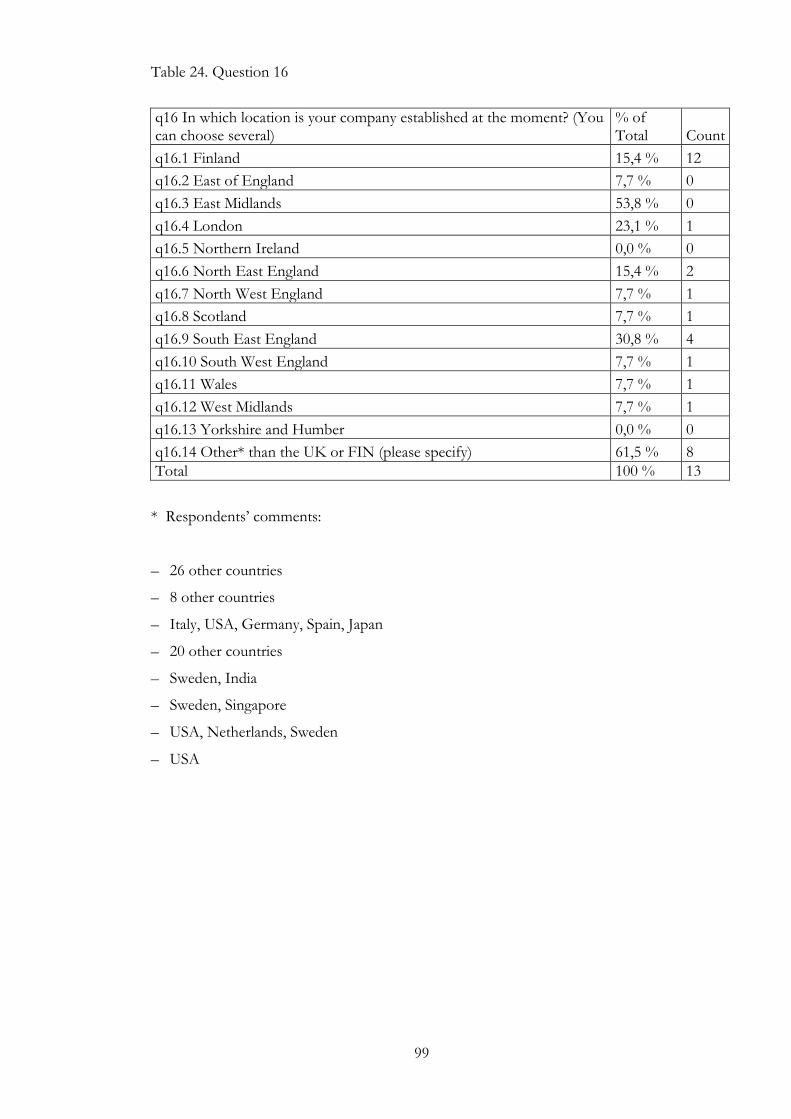
99
Table 24. Question 16
q16 In which location is your company established at the moment? (You can choose several)
% of Total Count
q16.1 Finland 15,4 % 12
q16.2 East of England 7,7 % 0
q16.3 East Midlands 53,8 % 0
q16.4 London 23,1 % 1
q16.5 Northern Ireland 0,0 % 0
q16.6 North East England 15,4 % 2
q16.7 North West England 7,7 % 1
q16.8 Scotland 7,7 % 1
q16.9 South East England 30,8 % 4
q16.10 South West England 7,7 % 1
q16.11 Wales 7,7 % 1
q16.12 West Midlands 7,7 % 1
q16.13 Yorkshire and Humber 0,0 % 0
q16.14 Other* than the UK or FIN (please specify) 61,5 % 8
Total 100 % 13
* Respondents‟ comments:
– 26 other countries
– 8 other countries
– Italy, USA, Germany, Spain, Japan
– 20 other countries
– Sweden, India
– Sweden, Singapore
– USA, Netherlands, Sweden
– USA

100
Table 25. Questions 17 & 13
q13. Which of the following best describes the situation of your company?
q17. When was the last time your company was in contact with UK Trade and Invest-ment or used its service?
q13.1 Company is ex-panding to the UK at the moment, or it has expanded less than 1 year ago.
q13.2 Compa-ny has expand-ed to the UK within 1-3 years.
q13.3 Company was estab-lished in the UK more than 3 years ago. Total
q17.1 Less than 2 months ago Count 0 2 0 2
% of Total
0,0 % 28,6 % 0,0 % 15,4 %
q17.2 2-6 months ago Count
1 2 1 4
% of Total
33,3 % 28,6 % 33,3 % 30,8 %
q17.3 7-12 months ago Count
1 1 1 3
% of Total
33,3 % 14,3 % 33,3 % 23,1 %
q17.4 During 2007-2008 Count
1 2 0 3
% of Total
33,3 % 28,6 % 0,0 % 23,1 %
q17.5 During 2005-2006 Count
0 0 0 0
% of Total
0,0 % 0,0 % 0,0 % 0,0 %
q17.6 During 2003-2004 Count
0 0 0 0
% of Total
0,0 % 0,0 % 0,0 % 0,0 %
q17.7 Other (please specify) Count
0 0 1 1
% of Total 0,0 % 0,0 % 33,3 % 7,7 %
The total amount of pages in Appendices: 30