Embed Size (px)
Citation preview
Nigel Tozer, Tim Pullen, Andy Saulter, Helen Kendall
HRPP575 1
The coastal wave and overtopping forecast service for Network Rail Scotland Nigel Tozer1, Tim Pullen1 Andy Saulter2, Helen Kendall2 1 HR Wallingford, Howbery Park, Wallingford, Oxfordshire OX10 8BA, UK 2 Met Office, Exeter, UK
Presented at the ICE Coasts, Marine Structures and Breakwaters conference, Edinburgh, September 2013
Abstract An operational coastal forecasting service has been provided to Network Rail in Scotland by the Met Office and HR Wallingford since 2004 for the management of sea defence inspections. This paper provides a background to the service, the modelling approach and some examples that illustrate the value of the service.
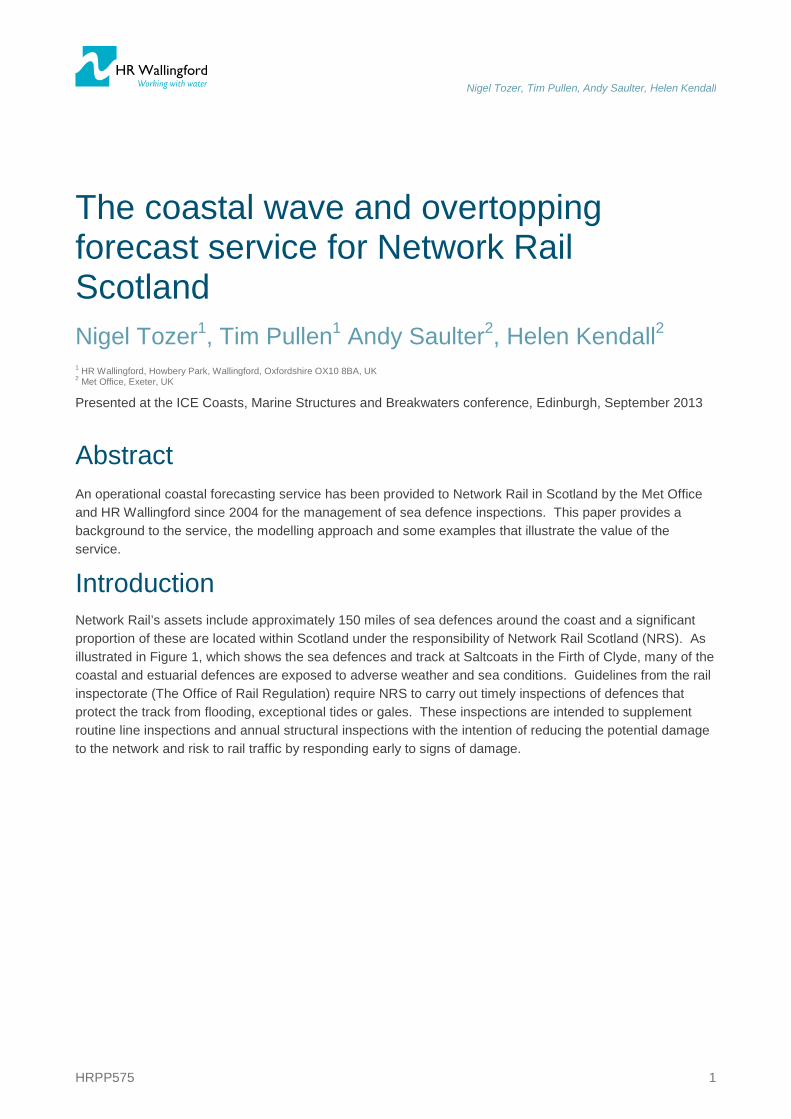
Introduction Network Rail’s assets include approximately 150 miles of sea defences around the coast and a significant proportion of these are located within Scotland under the responsibility of Network Rail Scotland (NRS). As illustrated in Figure 1, which shows the sea defences and track at Saltcoats in the Firth of Clyde, many of the coastal and estuarial defences are exposed to adverse weather and sea conditions. Guidelines from the rail inspectorate (The Office of Rail Regulation) require NRS to carry out timely inspections of defences that protect the track from flooding, exceptional tides or gales. These inspections are intended to supplement routine line inspections and annual structural inspections with the intention of reducing the potential damage to the network and risk to rail traffic by responding early to signs of damage.

Nigel Tozer, Tim Pullen, Andy Saulter, Helen Kendall
HRPP575 2
Figure 1 Rail line at Saltcoats showing heavy wave overtopping (Source Network Rail Scotland)
Since January 2004 the Met Office, in collaboration with HR Wallingford, have provided NRS with forecasts of severe weather conditions along sections of the Scottish network’s more exposed and highest priority sea defences. The forecasts sent to the NRS control room staff in Glasgow provide an indication of the severity of conditions at selected sections of track. The control room staff can then react to these warnings by planning inspections to be carried out during the storms. Depending on the level of severity and priority of site, these are carried out either in-house or by contract engineers. The early warnings allow the control room staff to plan inspections ahead rather than having to respond to local observations.
Forecast model and methodology The forecasts provided to NRS are based on the Met Office wave and storm tide forecasting service with further wave transformation inshore and response modelling configured and tuned by HR Wallingford. The general approach has been applied elsewhere at sites around the UK, Europe and in the Middle East. Quantitative validation of the general approach has been demonstrated elsewhere for several UK and Mediterranean sites including Sandown Bay on the Isle of Wight using waves published by the Channel Coast Observatory (see Tozer et al., 2005 ) and using waves published by WaveNet in the Outer Thames Estuary (see Tozer et al., 2009).
The service is built on a 36 hour forecast of offshore wave and water level conditions giving a lead time of up to 30 hours ahead and is updated once a day by the Met Office. Currently the service uses the Met Office North Atlantic European implementation of the WAVEWATCH III model and the Proudman Oceanographic Laboratory Coastal Ocean Modelling System (POLCOMS) storm surge/tide Continental Shelf model (CS3). (as summarised in the following section).
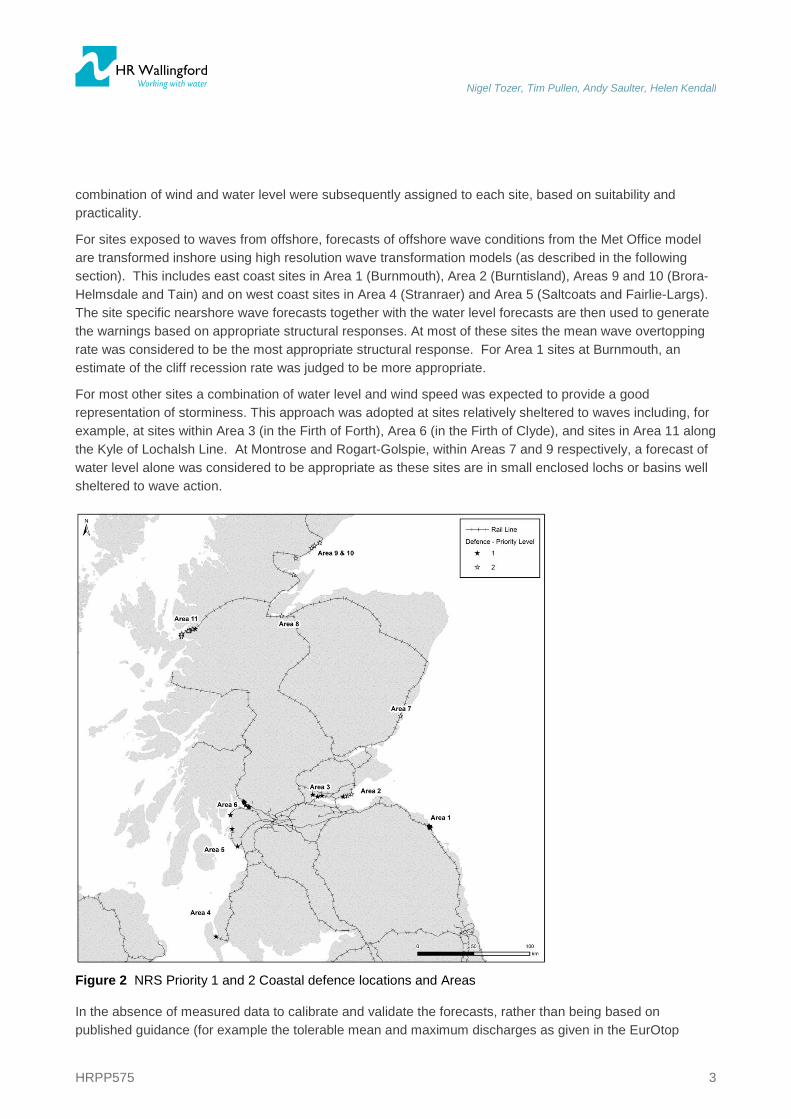
Because of the large number of sites, many of them in remote areas (as shown in Figure 2) and difficult to access, NRS carried out a manual assessment of the risk at each site using a risk rating based on the consequence of damage and the probability of occurrence and subsequently categorised them as Priority 1 and Priority 2 sites, respectively (as shown in Figure 2). Sites were then grouped in to 11 areas (also shown in Figure 2) based on location. Appropriate warning types: wave overtopping, cliff erosion, water level or a
Nigel Tozer, Tim Pullen, Andy Saulter, Helen Kendall
HRPP575 3
combination of wind and water level were subsequently assigned to each site, based on suitability and practicality.
For sites exposed to waves from offshore, forecasts of offshore wave conditions from the Met Office model are transformed inshore using high resolution wave transformation models (as described in the following section). This includes east coast sites in Area 1 (Burnmouth), Area 2 (Burntisland), Areas 9 and 10 (Brora-Helmsdale and Tain) and on west coast sites in Area 4 (Stranraer) and Area 5 (Saltcoats and Fairlie-Largs). The site specific nearshore wave forecasts together with the water level forecasts are then used to generate the warnings based on appropriate structural responses. At most of these sites the mean wave overtopping rate was considered to be the most appropriate structural response. For Area 1 sites at Burnmouth, an estimate of the cliff recession rate was judged to be more appropriate.
For most other sites a combination of water level and wind speed was expected to provide a good representation of storminess. This approach was adopted at sites relatively sheltered to waves including, for example, at sites within Area 3 (in the Firth of Forth), Area 6 (in the Firth of Clyde), and sites in Area 11 along the Kyle of Lochalsh Line. At Montrose and Rogart-Golspie, within Areas 7 and 9 respectively, a forecast of water level alone was considered to be appropriate as these sites are in small enclosed lochs or basins well sheltered to wave action.
Figure 2 NRS Priority 1 and 2 Coastal defence locations and Areas
In the absence of measured data to calibrate and validate the forecasts, rather than being based on published guidance (for example the tolerable mean and maximum discharges as given in the EurOtop

Nigel Tozer, Tim Pullen, Andy Saulter, Helen Kendall
HRPP575 4
Manual (2007)), the alert or warning thresholds were derived from historical predictions and tuned to produce, on average, a pre-arranged and approximately equal number of amber and red warnings per year at each site. This means that each site should, on average, have a similar number of inspections in any given year and only during relatively severe conditions when damage is most likely to occur. Over the course of time, feedback provided by NRS could be used to optimise alert thresholds to more appropriate values taking into account the exposure and vulnerability of each site.
Met Office wave and surge modelling forecasts Boundary conditions to the wave transformation models and, for some sites, the primary variables for the forecast service are provided by the Met Office operational forecast model suite. The Met Office operational forecast suite includes Numerical Weather Prediction (NWP) atmospheric, wave and surge models. The models provide predictions of wind and sea-state up to five days ahead, at regular times, every day on a year round basis.
The atmospheric models describe a three-dimensional grid field of atmospheric variables (wind, temperature, pressure, moisture) both as an estimate of the atmospheric conditions in the present (the ‘analysis’) and transported forward in time (the ‘forecast’). Since 1991 a Unified Model (UM) has been in use at the Met Office for both low-resolution climate modelling and high-resolution operational NWP. This system is regularly upgraded to take advantage of improvements in both NWP techniques and climate research.
The present operational wave model at the Met Office is a version of the third-generation spectral wave model WAVEWATCH III (Tolman 2009), which has been developed and released by the wave team at the US National Center for Environmental Prediction (NCEP). This model, at global and regional scales, describes the four key processes, namely: growth of waves due to wind forcing; dissipation of wave energy due to effects such as breaking and bottom friction; cascading of energy to lower frequencies through nonlinear interactions; propagation of unforced ‘swell’ energy.
Depth information for the model grid uses a representative average for each cell. This assumption may prove important in some near coastal grid cells where the average depth may mask bathymetric features affecting the local distribution of wave energy. Refraction in WAVEWATCH III is limited by use of a first order upwind scheme for intra-spectral propagation and a user-defined refraction timestep. Thus, the requirement for downscaling using e.g. the TELURAY model, as described later, to provide a more detailed representation of wave transformation in the coastal zone.
The operational wave models are configured with a spectral resolution of 25 frequency bins and 24 directional bins, representing waves with a range of periods between 25 seconds and 3 seconds. Wave conditions worldwide are forecast using the Global Wave Model, which adopted a 0.33 degree latitude by 0.4 degree longitude grid (approximately 35km square grid at mid-latitudes). This model is forced using the Met Office's Global UM 10m wind field (approximately 25km resolution) and runs twice daily based on 0000 and 1200 UTC analysis times to produce a 5 day forecast.
Forecasts for UK and European shelf seas are generated by applying boundary conditions from the Global Wave Model to a North Atlantic European Wave Model, which presently uses a rotated 1/9 degree latitude by 1/6 degree longitude grid (approximately 12km) covering a region from approximately 68°W to 30°E and 25°N to 65°N. For the forecast out to 36 hours ahead, as used in the NRS service, the model is forced by similarly scaled NAE NWP 10m winds and is run four times daily using analysis times 00:00, 06:00, 12:00 and 18:00 UTC. For NRS the forecast is based on the run using analysis time 00:00, providing NRS with one update per day. From mid-2013 higher resolution UK and European model domains forced with

Nigel Tozer, Tim Pullen, Andy Saulter, Helen Kendall
HRPP575 5
improved accuracy winds will be operational. For the NRS forecast service this will have a potential impact on the accuracy of the warning thresholds and therefore a recalibration of the warnings is recommended to account for these changes.
Data output from the Met Office wave models comprise of 2D wave spectra and integrated wave parameters including a total, swell and wind sea partitions. For the NRS service the total sea state parameters are used as input to the local wave transformation models described below, although forecast swell conditions are also provided in the accompanying information provided to NRS. Figure 3 shows the location of the Met Office model points used in the service.
Surge Storm surges are predicted by the Met Office by applying forecasts of 10m wind and sea-level pressure to the CS3 storm surge model (Flather, 2000). This provides a shallow-water depth-averaged hydrodynamic simulation of the entire northwest European continental shelf with a regular grid of 1/9 degrees in latitude and 1/6 degrees in longitude. Tidal input is supplied at the lateral open boundaries of the model to support tide-surge interaction (e.g. Horsburgh and Wilson, 2007). The model produces elevation and current outputs every 15 minutes out to T+48 hours. At coastal locations the model has a tendency to underestimate the tidal amplitude in comparison to tide-gauge observations, primarily due to a limited ability of the model to simulate the higher tidal harmonics which are generated by nonlinear processes in very shallow water. Therefore the Met Office operational flood warning system combines the modelled surge residual with a tidal projection based on harmonic analysis of past tide-gauge observations at the particular location of interest. The modelled surge is obtained by subtracting a tide-only model run from one forced by both tide and atmosphere.

Nigel Tozer, Tim Pullen, Andy Saulter, Helen Kendall
HRPP575 6
Figure 3 TELURAY model extents and Met Office model points

Nigel Tozer, Tim Pullen, Andy Saulter, Helen Kendall
HRPP575 7
Wave Transformation In order to provide a more detailed representation of the shallow water processes in the coastal zone i.e. from offshore to the sea defences, downscaling from the WAVEWATCH III was carried out using the HR Wallingford wave refraction model, TELURAY.
This model uses the concept of wave rays, which are lines perpendicular to the wave crests to transform a spectral description of offshore wave conditions. These rays are tracked seawards, from the selected nearshore point of interest to the offshore edge of the grid system using Snell's law to calculate changes in ray path due to refraction effects. Since the ray paths are reversible, each ray then gives information on how wave energy travels between the seaward edge of the grid system and the inshore point of interest. Computations in the TELURAY program can be split into two parts. The first stage involves considering a large number of ray paths, representing a wide range of offshore wave periods and directions, to generate a set of matrices, known as transfer functions. These transfer functions provide a description of the transformation of wave energy between the edge of the refraction grid and the inshore point of interest. The transfer function files relate components of the offshore wave spectrum to components of the nearshore wave spectrum, thus providing more detail than simple look up tables. The second stage uses these transfer functions to modify individual offshore wave spectra into corresponding inshore spectra at the specified inshore point. The model incorporates the non-linear effects of energy dissipation due to wave breaking using the empirical formulation for non-linear random wave shoaling and wave breaking given in Goda (1985). The model can also represent refraction effects due to currents and could be included to more accurately represent wave propagation in areas of strong currents. For the present service the effect on waves due to currents were neglected since it was expected that the worst conditions would occur at high water levels at slack tide.
For forecasting applications of TELURAY, the first stage of TELURAY i.e. the generation of the transfer functions is carried out offline as part of the configuration process. Only the second stage is carried out in real time using the appropriate forecast offshore wave conditions and water levels as boundary conditions. The model is very efficient, making it ideal for operational forecasting purposes, Over the course of the last 10 years models such as SWAN (Booij et al., 1996) have become increasingly popular for such applications, and could be considered for future enhancements of the service.
The TELURAY model requires a digital description of the seabed bathymetry in the area being modelled. Five TELURAY wave models covering the six main areas of interest were set up. The associated meshes were aligned with North and the bathymetry data at each grid point was interpolated from the most up to date Admiralty Charts available at the time. Figure 3 shows the five TELURAY extents.
Following initial feedback from NRS regarding the accuracy of forecasts at Graigendoran within Area 6 (in the Upper Firth of Clyde), the alert threshold parameter was amended from warnings based on a combination of water level and wind forecast to warnings based on wave overtopping rates using estimates of locally generated wave conditions. Similarly, at Burntisland within Area 2 the initial wave overtopping forecast based solely on waves transformed from offshore was enhanced to include the locally generated wind wave component, where the locally generated wave conditions are computed using the parametric Sverdrup-Munk and Bretschneider (SMB) method (described in the Shore Protection Manual, 1977) using winds from the Met Office model.

Nigel Tozer, Tim Pullen, Andy Saulter, Helen Kendall
HRPP575 8
Overtopping and Erosion Response Forecasts The sea defences of concern are exposed differently to wave action caused by waves propagating from offshore, waves generated locally, or a combination of both. The other main hazard is high water levels. Water levels are driven by astronomical tides with local and distant surge components, potentially leading to locally increased wave heights and increased risk of structural damage.
The service covers many different structural types including soft cliffs, natural rock, rock armoured slopes and battered vertical seawalls, with a corresponding range of failure modes. An assessment of each structure was carried out, based on cross-sectional profiles provided by NRS. This analysis was used to determine the expected key threats and issues, and to identify primary indicators of potential failure.
At Burnmouth on the East Coast Mainline, for example, the track sits high above a soft cliff typically 60-70m high, which is exposed to the full force of the North Sea. Here, the primary concern is erosion by waves at the cliff toe that may cause rotational failure of the cliff, and warnings are based on recession rates (R) given by Kamphuis (1987) as:
R = KHb
134� T3
2� ,
where K is a constant incorporating the angle of wave attack, Hb is the breaker wave height and T is the mean wave period.
At locations where the main threats were considered to be wave overtopping and structural stability, the warnings are based on wave overtopping estimates. Wave overtopping may be predicted by empirical or numerical models depending on the form of wave at the structure and the output required. The simplest prediction methods are empirical equations relating the mean dimensionless overtopping discharge (q/(gH3)0.5) to the seawall / structure dimensionless crest freeboard (Rc/H). These are generally categorised into sloping structures and vertical walls, and may incorporate adjustments for roughness (r), berm size, water depth at the toe (h) and crest geometry.
For the NRS service, mean overtopping rates for structure slopes of between 1:1 to 1:6, have been predicted by the exponential method of Owen (1980) using roughness coefficients and empirical slope coefficients, as also given by Besley (1999). For vertical wall structures, where the front face is battered, the correction method described by Bruce et al. (2002) has been applied. These methods have now been compiled together into the EurOtop manual (Pullen et al., 2007), and so the prediction methods used are expected to be generally similar, as the EurOtop methods have been modified only marginally from those used.
Daily Warnings Every day at approximately 03:00AM, an updated forecast is issued to NRS as an email containing a warning status file (as an excel spreadsheet) which summarises the times when warning thresholds are forecast to be exceeded. Warnings are classified and presented graphically on a single worksheet using a Red / Amber / Green traffic light system (an example is shown in Figure 4), where Red (labelled R) warnings indicate high or highest risk of structural damage, Amber (labelled A) lower risk of structural damage and Green (labelled G), no expected risk to structures.

Nigel Tozer, Tim Pullen, Andy Saulter, Helen Kendall
HRPP575 9
Figure 4 Forecast Issued: 14 December 2012.
This provides NRS with a quick view from 06:00hrs on the day of issue up to 12:00hrs on the next day, i.e. up to approximately 30hours ahead over all the coastal sites of concern. The underlying wind, wave and water level parameters used as input to generate the warnings are also quoted, thus providing more detailed background information that could be of use in the decision process.
The email is accompanied with Met Office forecaster commentary on the perceived reliability of the warnings issued in the forecast, occasionally down or upgrading warnings accordingly. These comments are based on the forecaster’s knowledge and experience of the accuracy of the wave and surge model forecasts, together with observations within the sea area of interest, World Meteorological Organisation (WMO) approved nomograms and fetch calculations for the sites of interest. The Met Office also provide 24/7 support to NRS in case of queries in relation to the issued forecast.
Case study: “The Perfect Storm” Figure 4 shows the forecast issued on the 14 December 2012 showing Red warnings at many of the east coast sites for a storm on 15 December which according to the BBC was nicknamed “The Perfect Storm” by the Scottish Government. The BBC report describes “Strong winds, huge waves and high tides caused damage from Shetland down to North Berwick” and “Sea defences were swept away in North Berwick harbour in East Lothian, a 15m (49ft) section of the harbour wall collapsed in Lossiemouth and residents of a sheltered housing complex were evacuated in Stonehaven” amongst many reports of damage and human impact, not least the tragic death of a crew member of the Standby Safety Vessel Vos Sailor. Reports of the breach to the harbour wall at North Berwick were also reported in the East Lothian Courier (20th December).
Network Rail Scotland (Ref: MO43) Forecast issued on Friday 14/12/2012 at 02:51 UTCTel: 0870 900 0100 www.metoffice.gov.uk
Summary of Forecast Status for 45 defence locationsDate: 14 14 14 15 15 15
AreaLocation
CodeName Priority Threshold Type
06 07 08 09 10 11 12 13 14 15 16 17 18 19 20 21 22 23 00 01 02 03 04 05 06 07 08 09 10 11 12
1 200/126 Burnmouth - Catcairn Bushes 1 Erosion G G G G G G G G G A A G G G G G G G G A R R R G G G G G G G G
1 200/127 Burnmouth - Hilton Bay 1 Erosion G G G G G G G G G A A G G G G G G G G A R R R G G G G G G G G
1 200/128 Burnmouth - Lamberton Shiels 1 Erosion G G G G G G G G G A A G G G G G G G G A R R R G G G G G G G G
1 200/129 Burnmouth - Lamberton Beach 1 Erosion G G G G G G G G G A A G G G G G G G G A R R R G G G G G G G G
1 200/130 Burnmouth - Tods Loup 1 Erosion G G G G G G G G G A A G G G G G G G G A R R R G G G G G G G G1 200/131 Burnmouth - Meg’s Dub 1 Erosion G G G G G G G G G A A G G G G G G G G A R R R G G G G G G G G
2 200/564 Burntisland (4) 1 Overtopping G G G G G G G A A R A G G G G G G G G A A A A A G G G G G G G
2 200/492 Burntisland (1) 2 Overtopping G G G G G G G G G A G G G G G G G G A R R R R A G G G G G G G
2 200/493 Burntisland (2) 2 Overtopping G G G G G G G A R R R G G G G G G G G A R A A G G G G G G G G2 200/494 Burntisland (3) 2 Overtopping G G G G G G G G G A A G G G G G G G G A A R A G G G G G G G G
3 200/561 Kincardine on Forth 1 Wind+WL G G G G G G G G G G G G G G G G G G G G G G G G G G G G G G G
3 200/562 Culross 1 Wind+WL G G G G G G G G G G G G G G G G G G G G G G G G G G G G G G G3 200/563 Newmills / Torryburn 1 Wind+WL G G G G G G G G G A G G G G G G G G G G G G G G G G G G G G G
4 200/432 Stranraer Harbour 1 Overtopping G G G G G G G G G G G G G G G G G G G G G G G G G G G G G G G
5 200/433 Saltcoats 1 Overtopping G G G G G G G G G G G G G G G G G G G G G G G G G G G G G G G5 200/436 Fairlie-Largs (3) 1 Overtopping G G G G G G G G G G G G G G G G G G G G G G G G G G G G G G G
6 200/550 Wemyss Bay Sidings 1 Wind+WL G G G G G G G G G G G G G G G G G G G G G G G G G G G G G G G
6 200/551 Gourock Station 1 Wind+WL G G G G G G G G G G G G G G G G G G G G G G G G G G G G G G G
6 200/552 Ardoch 1 Wind+WL G G G G G G G G G G G G G G G G G G G G G G G G G G G G G G G
6 200/553 Cardross 1 Wind+WL G G G G G G G G G G G G G G G G G G G G G G G G G G G G G G G
6 200/554 Brook’s Crossing, Cardross 1 Wind+WL G G G G G G G G G G G G G G G G G G G G G G G G G G G G G G G
6 200/555 Colgrain 1 Wind+WL G G G G G G G G G G G G G G G G G G G G G G G G G G G G G G G
6 200/556 Craigendoran (1) 1 Overtopping G G G G G G G G G G G G G G G G G G G G G G G G G G G G G G G6 200/557 Craigendoran (2) 1 Wind+WL G G G G G G G G G G G G G G G G G G G G G G G G G G G G G G G
7 200/902 Montrose 2 WL G G G G G G G G A G G G G G G G G G G G A G G G G G G G G G G8 200/478 Inverness - Muir of Ord (1) 2 Wind+WL G G G G G G G G G G G G G G G G G G G G G G G G G G G G G G G
9 200/482 Tain - Ardgay (2) 2 Overtopping G G G G G G G G G G G G G G G A R R R R R R G G G G G A R R R9 200/488 Rogart - Golspie 2 WL G G G G A R A G G G G G G G G G G A R A G G G G G G G G G A R
10 200/495 Brora - Helmsdale (1) 2 Overtopping G G G G G G A G G G G G G G G A R R R R R A G G G G G A R R R10 200/498 Brora - Helmsdale (4) 2 Overtopping G G G G G G A G G G G G G G G A R R R R R A G G G G G A R R R10 200/499 Brora - Helmsdale (5) 2 Overtopping G G G G G G A G G G G G G G G A R R R R R A G G G G G A R R R10 200/500 Brora - Helmsdale (6) 2 Overtopping G G G G G G A G G G G G G G G A R R R R R A G G G G G A R R R
11 200/465 Duirnish - Kyle (6) 1 Wind+WL G G G G G G G G G G G G G G G G G G G G G G G G G G G G G G G
11 200/472 Duirnish - Kyle (13) 1 Wind+WL G G G G G G G G G G G G G G G G G G G G G G G G G G G G G G G
11 200/474 Duirnish - Kyle (15) 1 Wind+WL G G G G G G G G G G G G G G G G G G G G G G G G G G G G G G G
11 200/517 Attadale - Stromeferry (7) 1 Wind+WL G G G G G G G G G G G G G G G G G G G G G G G G G G G G G G G
11 200/901 Duirnish - Kyle (16) 2 Wind+WL G G G G G G G G G G G G G G G G G G G G G G G G G G G G G G G
11 200/458 Duncraig - Plockton (1) 2 Wind+WL A A G G G G G G G G G G G A A G G G G G G G G G G A A G G G G
11 200/461 Duirnish - Kyle (2) 2 Wind+WL G G G G G G G G G G G G G G G G G G G G G G G G G G G G G G G
11 200/464 Duirnish - Kyle (5) 2 Wind+WL G G G G G G G G G G G G G G G G G G G G G G G G G G G G G G G
11 200/518 Attadale - Stromeferry (8) 2 Wind+WL G G G G G G G G G G G G G G G G G G G G G G G G G G G G G G G
11 200/519 Stromeferry - Duncraig (1) 2 Wind+WL G G G G G G G G G G G G G G G G G G G G G G G G G G G G G G G
11 200/522 Stromeferry - Duncraig (4) 2 Wind+WL G G G G G G G G G G G G G G G G G G G G G G G G G G G G G G G
11 200/524 Stromeferry - Duncraig (6) 2 Wind+WL G G G G G G G G G G G G G G G G G G G G G G G G G G G G G G G11 200/525 Stromeferry - Duncraig (7) 2 Wind+WL G G G G G G G G G G G G G G G G G G G G G G G G G G G G G G G

Nigel Tozer, Tim Pullen, Andy Saulter, Helen Kendall
HRPP575 10
Advance warning of the impending storm was provided to NRS in the forecast issued on the 14 December, although early signs appeared in the forecast issued on the 13 December. Figure 5 provides graphs of the significant wave height, water level and mean overtopping rate for this storm forecast for the sea defence at Tain within the Dornoch Firth (in Area 9). Each graph shows the predicted conditions superimposed for the forecasts issued on the 13th, 14th and 15th of December. The mean wave overtopping rate Amber and Red thresholds used for the warnings are also shown. The graphs show that the forecast issued on the 13th December gives an Amber warning for the high tide in the morning of the 14 December.
Figure 5 Forecast Wave heights, Water levels and Mean Wave Overtopping Rates: 14 December 2012 at Tain (in the Dornoch Firth).
This is confirmed in the forecast issued on the 14th December, that also shows the forecast for the following two high tides, both with Red warnings and associated inshore significant wave heights of approximately 1m and water levels of approximately 5m Above Chart Datum (mACD). The anecdotal reports of extreme conditions, reported by NRS and the press, agree well with the forecasts provided. The timely notification of such storms allows NRS to plan inspections at the appropriate times and demonstrates the value of the service. Further validation of the accuracy of the service could be achieved through measurement of the source parameters i.e. water levels and nearshore wave conditions and ultimately, the response parameters, e.g. overtopping.
Service Experience The forecast warnings provide guidance to NRS as a basis for management of the inspections which are carried out both in-house and by their framework consulting engineers. For Priority 1 sites given red warnings, site inspections are carried out by a structural engineering contractor. For Priority 2 sites, with red warnings, Network Rail engineers carry out the inspections. The warnings provide advance warning of severe conditions and potential structural damage, allowing engineers to be mobilised across the broad network.
Inspection reports written by the contract engineers provide NRS with information regarding the status of the sea defences to act upon when required. These reports also provide vital feedback on service performance

Nigel Tozer, Tim Pullen, Andy Saulter, Helen Kendall
HRPP575 11
and can sometimes illustrate the value of the service. For example Figure 6 shows two examples where such inspections have identified possible recent storm damage. The photograph on the left shows possible wash out of the ballast possibly caused by heavy wave overtopping, exposing the base of a sea wall, requiring further monitoring or remedial action.
Figure 6 Examples of possible storm damage
The photograph on the right shows a general view of the sea defences along the Duirnish & Kyle Line (Area 11) consisting of “loose to medium dense coarse gravels and boulders” as quoted in the engineer’s report for an inspection carried out on the 18 January 2005. The insert photograph shows an “8m wide 1.5m deep shallow embankment failure” with the “back face of slippage 3m from near side rail”. This particular defence was previously inspected on the 29 June 2004 when “very poor crest, slope and toe condition” was reported at this location. The structural engineer’s recommendations were to “re-grade slope with displaced material in the short term, to place rock armour along the defence to stabilise and protect embankments from failure” in the medium to long term and also to “Inspect monthly after high tides”. Smaller “(<2m deep)” embankment failures were also observed elsewhere along this section of track with similar recommendations for remedial measures and increased monitoring. Although the damage that was observed may have occurred over a period of time, the additional inspection notified NRS of a problem that they could resolve earlier than waiting for the next routine annual inspection when defence conditions may have deteriorated further.
Conclusions and Recommendations A long term coastal warning service has been provided to Network Rail in Scotland since 2004. The service provides timely and reliable forecasts of severe conditions at a wide range of coastal sites around Scotland. The service is used by NRS to supplement routine annual inspections with additional inspections at times when extreme weather conditions may be causing damage to the sea defences that the lines depend so greatly upon. In the absence of in-situ measurements, feedback in the form of the engineers’ inspections have provided an invaluable qualitative source, to measure performance and to improve service reliability. Further improvement and optimisation of the service could be achieved through ongoing analysis of the engineering reports and inspection statistics e.g. by reviewing the number of inspections by site in order to

Nigel Tozer, Tim Pullen, Andy Saulter, Helen Kendall
HRPP575 12
optimise alert thresholds to more appropriate values taking into account the exposure and vulnerability of each site.
Acknowledgments The service described in this paper has been implemented and improved with the cooperation of Network Rail Scotland to whom we gratefully acknowledge their valuable feedback on the service performance. We also gratefully acknowledge the support from colleagues at HR Wallingford including William Allsop, Nigel Bunn, Steve Grey and Michael Wallis and the Met Office including Peter Murkin and Stewart Wortley who all played a role in delivering the service.
References BBC News (2012). Available at http://www.bbc.co.uk/news/uk-scotland-20750940. (Accessed 18 June 2013).
Besley, P. (1999) Overtopping of seawalls – design and assessment manual. R&D Technical Report W178, ISBN 1 85705 069 X, Environment Agency, Bristol.
Booij, N., L.H. Holthuijsen and R.C. Ris, 1996, The "SWAN" wave model for shallow water, Proc. 25th Int. Conf. Coastal Engineering., Orlando, pp. 668-676.
Bruce T., Allsop N. W. H. and Pearson J. Violent overtopping of seawalls—extended prediction methods. Proceedings of the ICE Conference on Shorelines, Structures and Breakwaters, September 2001. Thomas Telford, London.
East Lothian Courier (2012). Available at: http://www.eastlothiancourier.com/news/northberwick/articles/2012/12/20/442126-devastation-at-north-berwick. (Accessed: 18 June 2013)
Flather, R.A. (2000) Existing operational oceanography. Coastal Eng. 41: 13–40.
Goda, S. (1985) Random seas and design of maritime structures, University of Tokyo Press.
Horsburgh, K.J., Wilson, C. (2007) Tide–surge interaction and its role in the distribution of surge residuals in the North Sea. J. Geophys. Res. 112: C08003, DOI: 10.1029/2006JC004033.
Kamphuis, J.W. (1987) Recession rate of glacial till bluffs. Journal of Waterway, Port, Coastal and Ocean Engineering, Vol 113, No 1.
Owen, M.W. (1980) Design of seawalls allowing for overtopping Report EX924, Hydraulics Research, Wallingford.
Pullen, T., Allsop, N.W.H., Bruce, T., Kortenhaus, A, Schuttrumpf, H. & van der Meer, J.W. 2007 EurOtop: European Overtopping Manual. Available at: www.overtopping-manual.com (Accessed 18 June 2013).
(1977) Shore Protection Manual. 3rd ed., Vols. I, II, and III. U. S. Army Corps of Engineers, Coastal Engineering Research Center, U. S. Government Printing Office, Washington, D. C.
Tolman, H. L. (2009). User manual and system documentation of WAVEWATCH III version 3.14. Tech. Note 276, NOAA/NWS/NCEP/MMAB.
Tozer, N.P, Millard, K. Saulter, A. (2005) Validation issues for a global coastal wave forecasting service. Proc. Waves 05, COPRI, Madrid.
Tozer, N.P. Saulter, A. Pryor, S. Coates, T. (2009). Marine forecasts for the safe construction and maintenance of coastal structures. Proc. ICE Breakwaters Conference Edinburgh.