Embed Size (px)
Citation preview

The Cobalt Market 2021-2030F
CRUX Investor | January 2021
i CRUX Investor
The Cobalt Market
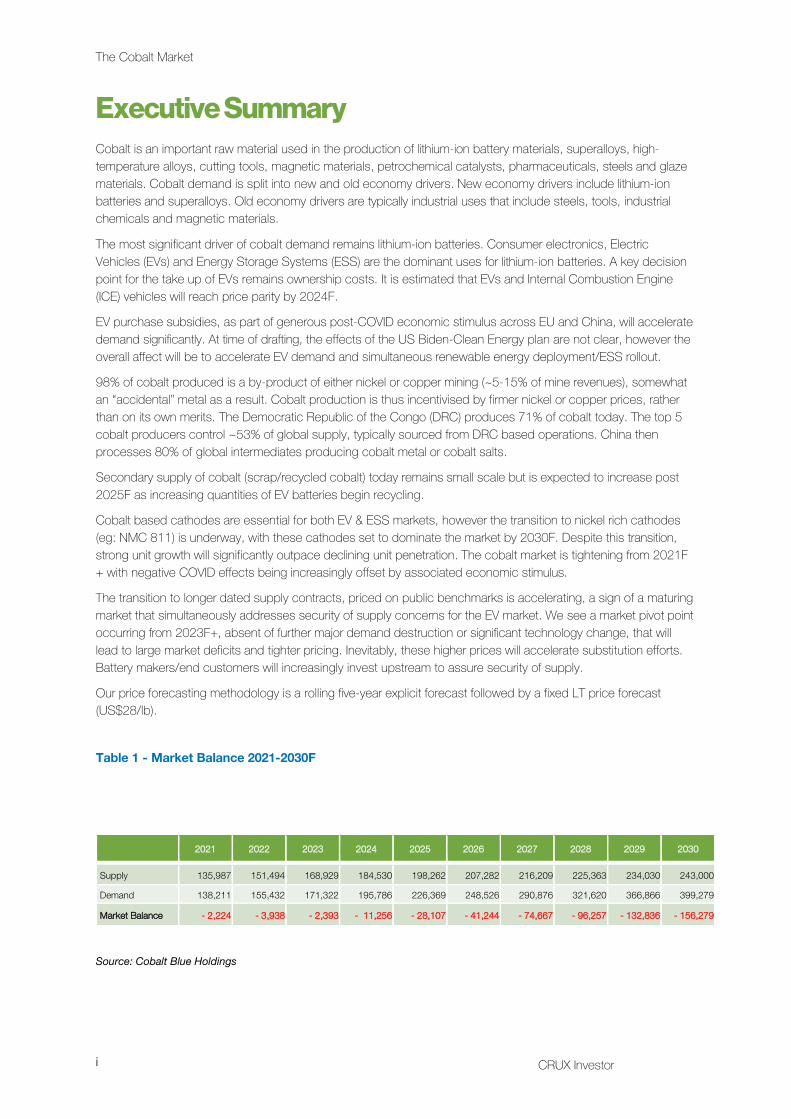
Executive Summary Cobalt is an important raw material used in the production of lithium-ion battery materials, superalloys, high-temperature alloys, cutting tools, magnetic materials, petrochemical catalysts, pharmaceuticals, steels and glaze materials. Cobalt demand is split into new and old economy drivers. New economy drivers include lithium-ion batteries and superalloys. Old economy drivers are typically industrial uses that include steels, tools, industrial chemicals and magnetic materials.
The most significant driver of cobalt demand remains lithium-ion batteries. Consumer electronics, Electric Vehicles (EVs) and Energy Storage Systems (ESS) are the dominant uses for lithium-ion batteries. A key decision point for the take up of EVs remains ownership costs. It is estimated that EVs and Internal Combustion Engine (ICE) vehicles will reach price parity by 2024F.
EV purchase subsidies, as part of generous post-COVID economic stimulus across EU and China, will accelerate demand significantly. At time of drafting, the effects of the US Biden-Clean Energy plan are not clear, however the overall affect will be to accelerate EV demand and simultaneous renewable energy deployment/ESS rollout.
98% of cobalt produced is a by-product of either nickel or copper mining (~5-15% of mine revenues), somewhat an “accidental” metal as a result. Cobalt production is thus incentivised by firmer nickel or copper prices, rather than on its own merits. The Democratic Republic of the Congo (DRC) produces 71% of cobalt today. The top 5 cobalt producers control ~53% of global supply, typically sourced from DRC based operations. China then processes 80% of global intermediates producing cobalt metal or cobalt salts.
Secondary supply of cobalt (scrap/recycled cobalt) today remains small scale but is expected to increase post 2025F as increasing quantities of EV batteries begin recycling.
Cobalt based cathodes are essential for both EV & ESS markets, however the transition to nickel rich cathodes (eg: NMC 811) is underway, with these cathodes set to dominate the market by 2030F. Despite this transition, strong unit growth will significantly outpace declining unit penetration. The cobalt market is tightening from 2021F+ with negative COVID effects being increasingly offset by associated economic stimulus.
The transition to longer dated supply contracts, priced on public benchmarks is accelerating, a sign of a maturing market that simultaneously addresses security of supply concerns for the EV market. We see a market pivot point occurring from 2023F+, absent of further major demand destruction or significant technology change, that will lead to large market deficits and tighter pricing. Inevitably, these higher prices will accelerate substitution efforts. Battery makers/end customers will increasingly invest upstream to assure security of supply.
Our price forecasting methodology is a rolling five-year explicit forecast followed by a fixed LT price forecast (US$28/lb).
Table 1 - Market Balance 2021-2030F
2021 2022 2023 2024 2025 2026 2027 2028 2029 2030
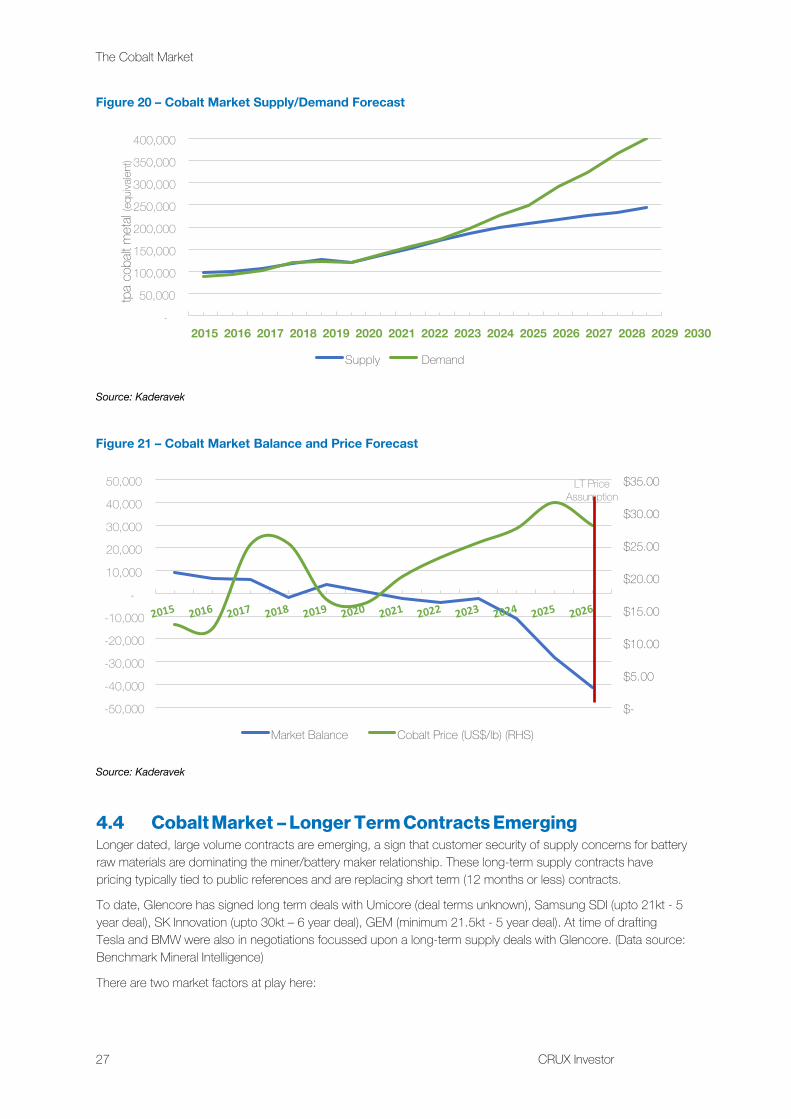
Supply 135,987 151,494 168,929 184,530 198,262 207,282 216,209 225,363 234,030 243,000
Demand 138,211 155,432 171,322 195,786 226,369 248,526 290,876 321,620 366,866 399,279
Market Balance - 2,224 - 3,938 - 2,393 - 11,256 - 28,107 - 41,244 - 74,667 - 96,257 - 132,836 - 156,279
Source: Cobalt Blue Holdings
CRUX Investor ii
Contents 1 Background ................................................................................................................................................. 4
1.1 Metal Properties ..................................................................................................................................... 4 1.2 Cobalt Production Chain ........................................................................................................................ 4
2 Demand ...................................................................................................................................................... 5 2.1 Overview ............................................................................................................................................... 5 2.2 Lithium-ion Batteries .............................................................................................................................. 5
2.2.1 Cobalt Based Battery Technologies .............................................................................................. 5 2.2.2 Non-Cobalt Based Battery Technologies ...................................................................................... 6 2.2.3 Cathode Market Share ................................................................................................................. 9 2.2.4 Cathode Market Growth ................................................................................................................ 13
2.3 Cobalt Demand for Industrial Applications .............................................................................................. 13 2.3.1 Hard Alloys .................................................................................................................................... 13 2.3.2 Magnetic Materials ........................................................................................................................ 14
2.4 Superalloys............................................................................................................................................ 14 3 Supply: ....................................................................................................................................................... 16
3.1 Cobalt Sources ..................................................................................................................................... 16 3.2 The Democratic Republic of the Congo ................................................................................................. 17 3.3 By-product of Copper/Nickel Mining....................................................................................................... 18 3.4 Cobalt Production by Region ................................................................................................................. 18 3.5 Cobalt Trade Flows. ............................................................................................................................... 19 3.6 Cobalt Supply by Company ....................................................................................................................20 3.7 Cobalt Scrap (Secondary supply) ............................................................................................................20
4 Market Balance: ...........................................................................................................................................22 4.1 Cobalt Substitution .................................................................................................................................22 4.2 Cobalt Market Segments - Forecast ........................................................................................................23 4.3 Cobalt Market & Price Forecast ............................................................................................................. .24 4.4 Cobalt Market – Longer Term Contracts Emerging ..................................................................................27 4.5 Cobalt Pricing – A word of caution using LME pricing ............................................................................ 28
5 Conclusion: ................................................................................................................................................ 30 5.1 Key Conclusions ................................................................................................................................... 30 5.2 Risks ..................................................................................................................................................... 30
5.2.1 Upside Risks ................................................................................................................................. 30 5.2.2 Downside Risks ........................................................................................................................... . 30
iii CRUX Investor
The Cobalt Market
Figures Figure 1 - Global Cobalt Industry Chain .............................................................................................................. 4 Figure 2 - Cobalt Demand 2021 .........................................................................................................................5 Figure 3 – Lithium-ion Contract Cell Price US$/kWh .......................................................................................... 7 Figure 4 – International Bans on ICE Vehicles. .................................................................................................... 8 Figure 5 – Renewable Energy and ESS Forecasts .............................................................................................. 9 Figure 6 – BEV vs PHEV - Market Share Forecast ............................................................................................ 10 Figure 7 – Cathode Chemistry Comparison ...................................................................................................... 11 Figure 8 – Cathode Chemistry Trends – EVs .................................................................................................... 11 Figure 9 – Timeline of Strategic OEM Targets for EVs ...................................................................................... 12 Figure 10 – Battery Market Growth (GWh) ........................................................................................................ 13 Figure 11 – Cobalt Based Superalloy Applications ........................................................................................... 15 Figure 12– Global Cobalt Reserves – 2019 Estimates ...................................................................................... 16 Figure 13 – Global Cobalt Production by Resource Type (%) ........................................................................... 17 Figure 14 – DRC Cobalt Supply Concentration ................................................................................................ 18 Figure 15 – Global Cobalt Production– 2019 Estimates ................................................................................... 19 Figure 16 – Global Cobalt Trade Flows ............................................................................................................. 19 Figure 17 – Leading Cobalt Producers 2020 .................................................................................................... 20 Figure 18 – Cobalt Secondary Supply (Scrap) (tpa) Forecast ........................................................................... 21 Figure 19 – Cobalt Market Segment Forecast - CAGR (%pa)........................................................................... 24 Figure 20 – Cobalt Market Supply/Demand Forecast ....................................................................................... 27 Figure 21 – Cobalt Market Balance and Price Forecast .................................................................................... 27
Tables Table 1 - Market Balance 2021-2030F ............................................................................................................. i Table 2 - Classification of Cobalt Based Hard Alloys ........................................................................................ 14 Table 3 – Cobalt - a Critical Material ................................................................................................................. 23 Table 4 – Cobalt Market Balance (t) and Pricing (US$/lb) ................................................................................. 26 Table 5 – LME Cobalt – Contract Specifications............................................................................................... 28
CRUX Investor 4
1 Background
1.1 Metal Properties Cobalt (chemical symbol Co) is a magnetic and lustrous steel grey metal possessing similar properties to iron and nickel in terms of hardness, tensile strength, machinability, thermodynamic properties, and electrochemistry. Cobalt is one of only three naturally occurring magnetic metals (with iron and nickel). The melting point of cobalt metal is 1,493°C (2,719°F) with the boiling point 3,100°C (5,600°F). The density is 8.9 grams per cubic centimetre.
Cobalt is an important raw material for the production of battery materials, superalloys, high-temperature alloys, cutting tools, magnetic materials, petrochemical catalysts, pharmaceuticals and glaze materials. When used as an alloy, cobalt improves the high temperature strength and corrosion resistance of more common metals, especially nickel and chromium.
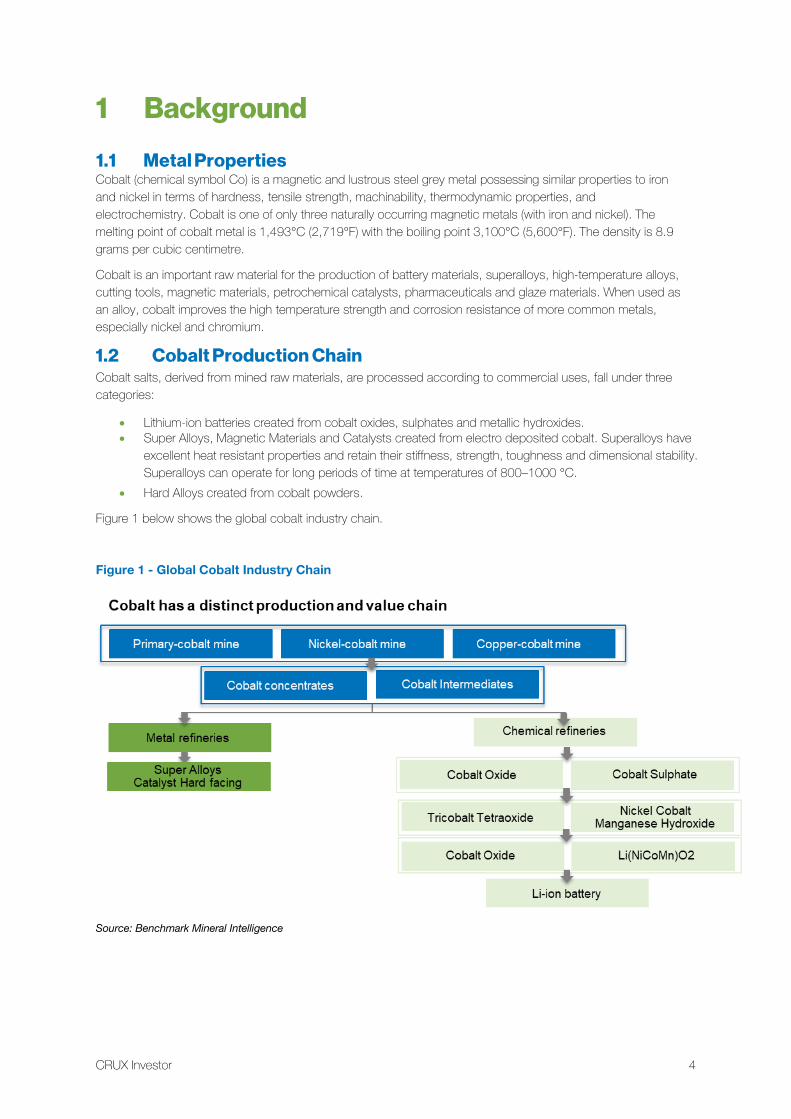
1.2 Cobalt Production Chain Cobalt salts, derived from mined raw materials, are processed according to commercial uses, fall under three categories:
• Lithium-ion batteries created from cobalt oxides, sulphates and metallic hydroxides.• Super Alloys, Magnetic Materials and Catalysts created from electro deposited cobalt. Superalloys have
excellent heat resistant properties and retain their stiffness, strength, toughness and dimensional stability.Superalloys can operate for long periods of time at temperatures of 800–1000 °C.
• Hard Alloys created from cobalt powders.
Figure 1 below shows the global cobalt industry chain.
Figure 1 - Global Cobalt Industry Chain
Source: Benchmark Mineral Intelligence
5 CRUX Investor
The Cobalt Market
2 Demand
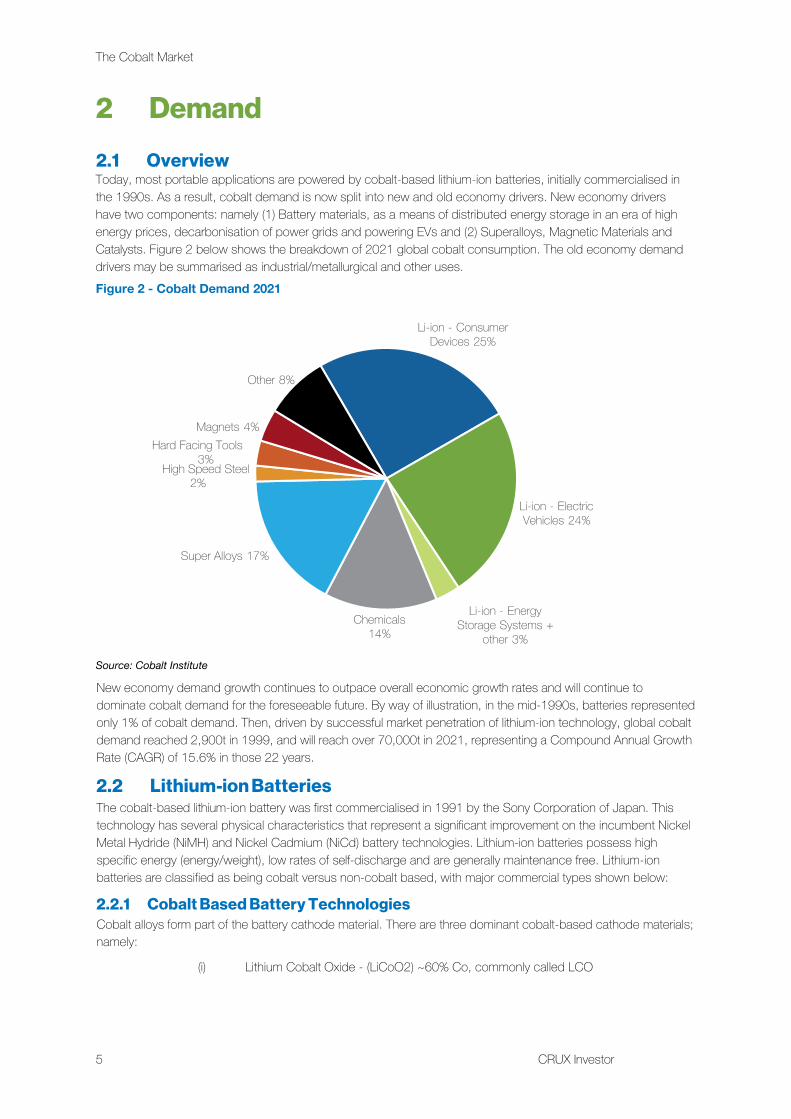
2.1 Overview Today, most portable applications are powered by cobalt-based lithium-ion batteries, initially commercialised in the 1990s. As a result, cobalt demand is now split into new and old economy drivers. New economy drivers have two components: namely (1) Battery materials, as a means of distributed energy storage in an era of high energy prices, decarbonisation of power grids and powering EVs and (2) Superalloys, Magnetic Materials and Catalysts. Figure 2 below shows the breakdown of 2021 global cobalt consumption. The old economy demand drivers may be summarised as industrial/metallurgical and other uses. Figure 2 - Cobalt Demand 2021
Source: Cobalt Institute
New economy demand growth continues to outpace overall economic growth rates and will continue to dominate cobalt demand for the foreseeable future. By way of illustration, in the mid-1990s, batteries represented only 1% of cobalt demand. Then, driven by successful market penetration of lithium-ion technology, global cobalt demand reached 2,900t in 1999, and will reach over 70,000t in 2021, representing a Compound Annual Growth Rate (CAGR) of 15.6% in those 22 years.
2.2 Lithium-ion Batteries The cobalt-based lithium-ion battery was first commercialised in 1991 by the Sony Corporation of Japan. This technology has several physical characteristics that represent a significant improvement on the incumbent Nickel Metal Hydride (NiMH) and Nickel Cadmium (NiCd) battery technologies. Lithium-ion batteries possess high specific energy (energy/weight), low rates of self-discharge and are generally maintenance free. Lithium-ion batteries are classified as being cobalt versus non-cobalt based, with major commercial types shown below:
2.2.1 Cobalt Based Battery Technologies Cobalt alloys form part of the battery cathode material. There are three dominant cobalt-based cathode materials; namely:
(i) Lithium Cobalt Oxide - (LiCoO2) ~60% Co, commonly called LCO
Li-ion - Consumer Devices 25%
Li-ion - Electric Vehicles 24%
Li-ion - Energy Storage Systems +
other 3%Chemicals
14%
Super Alloys 17%
2%
Magnets 4%Hard Facing Tools
3%High Speed Steel
Other 8%
CRUX Investor 6
LCO batteries were developed as an early generation lithium-ion battery and have subsequently taken mass market share, particularly for small portable devices. The drawback of LCO is a relatively short life span, low thermal stability, and limited load capabilities (specific power). LCO is maturing and newer systems include nickel, manganese and/or aluminium to improve longevity, loading capability and cost. Uses include mobile phones, tablets, laptops, and cameras.
(ii) Lithium Nickel Manganese Cobalt Oxide: (LiNiMnCoO2) up to 15% Co, commonlycalled NMC
NMC batteries have improved lifespan and specific energy relative to LCO batteries. Uses include medical devices, EVs and industrial applications.
(iii) Lithium Nickel Cobalt Aluminium Oxide (LiNiCoAlO2) ~9% Co, commonly calledNCA
NCA batteries are a more recent development and possess even higher energy densities than NMC batteries. However, they have lower life spans. Uses include medical devices, industrial and electric powertrains, specifically for Tesla motor vehicles.
2.2.2 Non-Cobalt Based Battery Technologies (iv) Lithium Manganese Oxide (LiMn2O4) (no cobalt), commonly called LMO
LMO batteries possess specific energies that are typically lower than LCO. However, the technology has greater design flexibility that allows for batteries to be optimised for longevity (life span), power or specific energy. Uses include power tools, medical devices and electric powertrains.
(v) Lithium Iron Phosphate (LiFePO4) (no cobalt), commonly called LFP
LFP batteries possess good power characteristics, high current ratings and a long-life span. The chemistry also provides thermal stability and enhanced safety for high temperature or demanding conditions. The drawback of LFP batteries are the relatively low energy density and poor performance at lower temperatures. LFP batteries are predominantly a Chinese market technology and remain suitable for low range EVs.
Apart from lithium-ion batteries, the other dominant rechargeable chemistries remain NiMH and NiCd. NiMH batteries contain nickel (50%), rare earths (30%) and cobalt (6-10%) while NiCd batteries similarly include nickel but also use the toxic heavy metal, cadmium. They are a potential source of pollution/contamination and the European Union has taken legislative steps to ban these batteries.
Lithium-ion battery demand is driven by three broad categories of end use:
2.2.2.1 Electric Vehicles Electric vehicles include Battery Electric Vehicles (BEVs) and Plug in Hybrid Vehicles (PHEVs), Hybrid Electric Vehicles (HEVs), commercial trucks, buses, and electric bikes. Global growth in the EV market remains robust, spurred by significant Government policy support. These policies are, in effect, direct subsidies typically designed to deliver energy security, improve air quality, and reduce Greenhouse Gas (GHG) emissions. The EU, US, Japan, and China have continuously raised standards during the last 15 years for vehicle fuel economy and GHG emissions by incentivising automotive manufacturers to develop electric alternatives to traditional internal combustion engine designs. EV demand, coupled with the increased battery sizes required by the shift from smaller (~1kWh) HEV batteries, used in vehicles such as the Toyota Prius to larger EV batteries (~85kWh) used in the Tesla Model S, is driving significant cobalt demand growth.
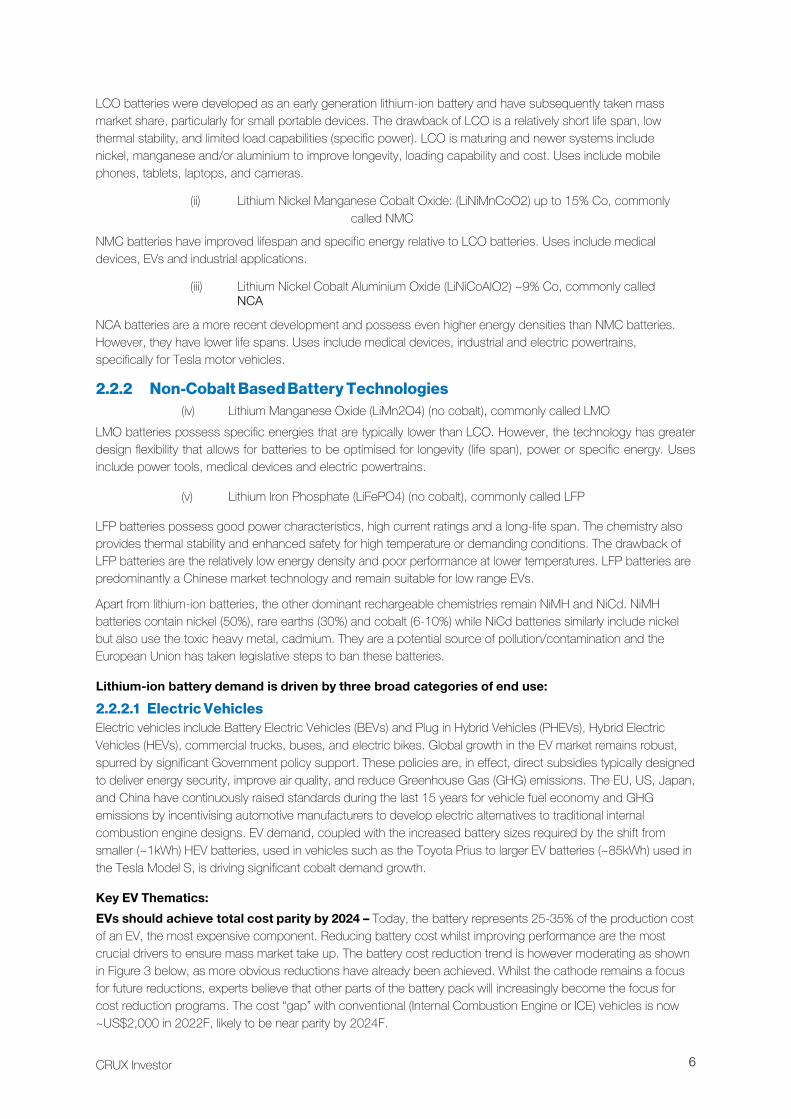
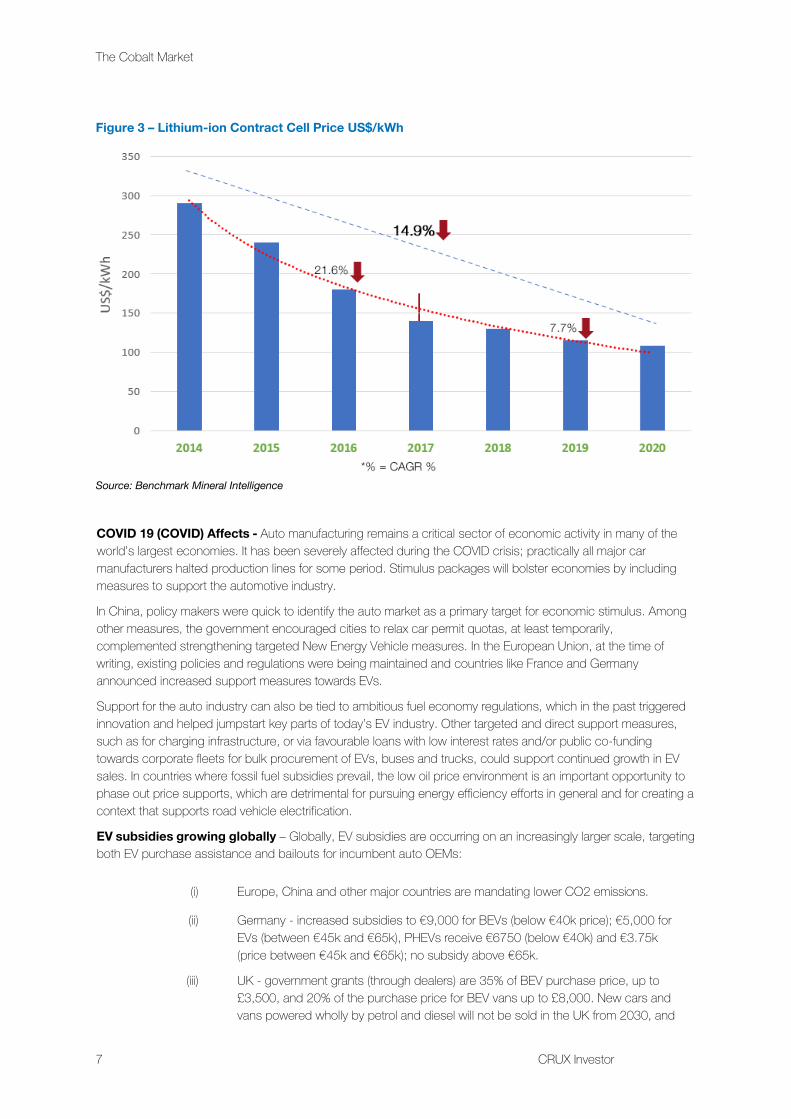
Key EV Thematics: EVs should achieve total cost parity by 2024 – Today, the battery represents 25-35% of the production cost of an EV, the most expensive component. Reducing battery cost whilst improving performance are the most crucial drivers to ensure mass market take up. The battery cost reduction trend is however moderating as shown in Figure 3 below, as more obvious reductions have already been achieved. Whilst the cathode remains a focus for future reductions, experts believe that other parts of the battery pack will increasingly become the focus for cost reduction programs. The cost “gap” with conventional (Internal Combustion Engine or ICE) vehicles is now ~US$2,000 in 2022F, likely to be near parity by 2024F.
The Cobalt Market
7 CRUX Investor
Figure 3 – Lithium-ion Contract Cell Price US$/kWh
Source: Benchmark Mineral Intelligence
COVID 19 (COVID) Affects - Auto manufacturing remains a critical sector of economic activity in many of the world’s largest economies. It has been severely affected during the COVID crisis; practically all major car manufacturers halted production lines for some period. Stimulus packages will bolster economies by including measures to support the automotive industry.
In China, policy makers were quick to identify the auto market as a primary target for economic stimulus. Among other measures, the government encouraged cities to relax car permit quotas, at least temporarily, complemented strengthening targeted New Energy Vehicle measures. In the European Union, at the time of writing, existing policies and regulations were being maintained and countries like France and Germany announced increased support measures towards EVs.
Support for the auto industry can also be tied to ambitious fuel economy regulations, which in the past triggered innovation and helped jumpstart key parts of today’s EV industry. Other targeted and direct support measures, such as for charging infrastructure, or via favourable loans with low interest rates and/or public co-funding towards corporate fleets for bulk procurement of EVs, buses and trucks, could support continued growth in EV sales. In countries where fossil fuel subsidies prevail, the low oil price environment is an important opportunity to phase out price supports, which are detrimental for pursuing energy efficiency efforts in general and for creating a context that supports road vehicle electrification.
EV subsidies growing globally – Globally, EV subsidies are occurring on an increasingly larger scale, targeting both EV purchase assistance and bailouts for incumbent auto OEMs:
(i) Europe, China and other major countries are mandating lower CO2 emissions.
(ii) Germany - increased subsidies to €9,000 for BEVs (below €40k price); €5,000 forEVs (between €45k and €65k), PHEVs receive €6750 (below €40k) and €3.75k(price between €45k and €65k); no subsidy above €65k.
(iii) UK - government grants (through dealers) are 35% of BEV purchase price, up to£3,500, and 20% of the purchase price for BEV vans up to £8,000. New cars andvans powered wholly by petrol and diesel will not be sold in the UK from 2030, and
8
(iv) California - Governor has announced the ban the sale of ICE vehicles from 2035,mandating that all new cars sold from that point will be emissions-free.
US policy changes - The cobalt implications of Biden - Clean Energy Plan will become clearer during 2021. The scope of the plan includes US$400Bn over 10 years targeting the creation of 10 million US jobs, and at present includes the targeted installation of 500,000 EV charging stations and will support an estimated 25 million EVs. The plan is part of a broader strategy that seeks mobilisation of public investment to fight climate change, including:
(i) A net zero carbon emissions target for the US from 2050.
(ii) Build the US into a “clean energy superpower”.(iii) Create/support a domestic supply chain for strategic materials (including cobalt) that
the US currently imports.
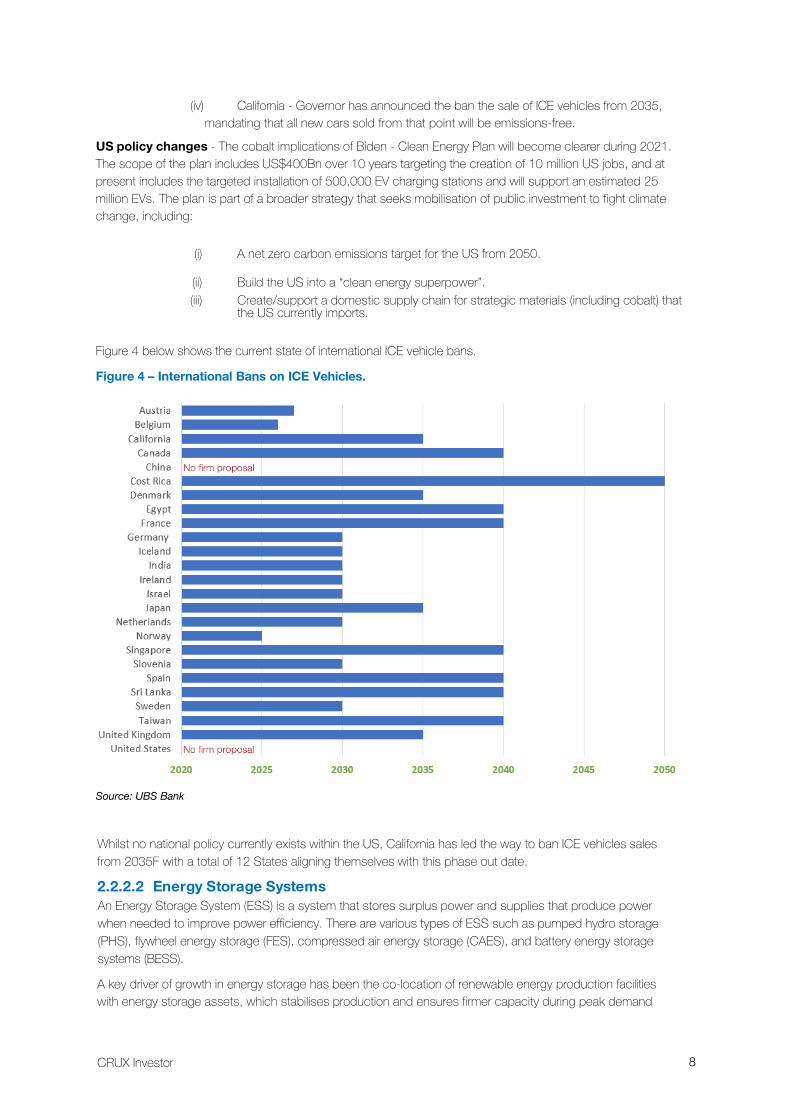
Figure 4 below shows the current state of international ICE vehicle bans.
Figure 4 – International Bans on ICE Vehicles.
Source: UBS Bank
Whilst no national policy currently exists within the US, California has led the way to ban ICE vehicles sales from 2035F with a total of 12 States aligning themselves with this phase out date.
2.2.2.2 Energy Storage Systems An Energy Storage System (ESS) is a system that stores surplus power and supplies that produce power when needed to improve power efficiency. There are various types of ESS such as pumped hydro storage (PHS), flywheel energy storage (FES), compressed air energy storage (CAES), and battery energy storage systems (BESS).
A key driver of growth in energy storage has been the co-location of renewable energy production facilities with energy storage assets, which stabilises production and ensures firmer capacity during peak demand
CRUX Investor
9 CRUX Investor
The Cobalt Market
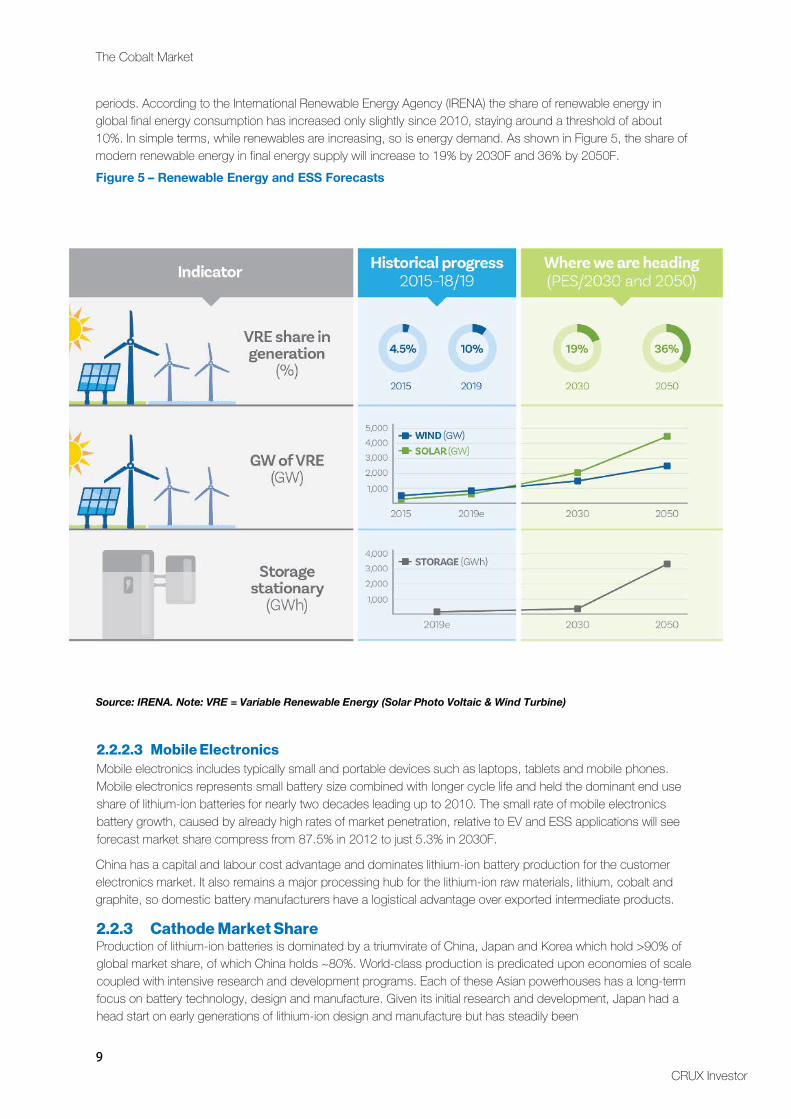
periods. According to the International Renewable Energy Agency (IRENA) the share of renewable energy in global final energy consumption has increased only slightly since 2010, staying around a threshold of about 10%. In simple terms, while renewables are increasing, so is energy demand. As shown in Figure 5, the share of modern renewable energy in final energy supply will increase to 19% by 2030F and 36% by 2050F. Figure 5 – Renewable Energy and ESS Forecasts
Source: IRENA. Note: VRE = Variable Renewable Energy (Solar Photo Voltaic & Wind Turbine)
2.2.2.3 Mobile ElectronicsMobile electronics includes typically small and portable devices such as laptops, tablets and mobile phones. Mobile electronics represents small battery size combined with longer cycle life and held the dominant end use share of lithium-ion batteries for nearly two decades leading up to 2010. The small rate of mobile electronics battery growth, caused by already high rates of market penetration, relative to EV and ESS applications will see forecast market share compress from 87.5% in 2012 to just 5.3% in 2030F.
China has a capital and labour cost advantage and dominates lithium-ion battery production for the customer electronics market. It also remains a major processing hub for the lithium-ion raw materials, lithium, cobalt and graphite, so domestic battery manufacturers have a logistical advantage over exported intermediate products.
2.2.3 Cathode Market Share Production of lithium-ion batteries is dominated by a triumvirate of China, Japan and Korea which hold >90% of global market share, of which China holds ~80%. World-class production is predicated upon economies of scale coupled with intensive research and development programs. Each of these Asian powerhouses has a long-term focus on battery technology, design and manufacture. Given its initial research and development, Japan had a head start on early generations of lithium-ion design and manufacture but has steadily been
CRUX Investor 10
losing share as lower cost centres in Korea and China gain share. More recently, active commitments from EU nations have triggered an arms race to install battery factories (“Giga Factories”), aimed to primarily service the EU, today the largest regional EV market in the world.
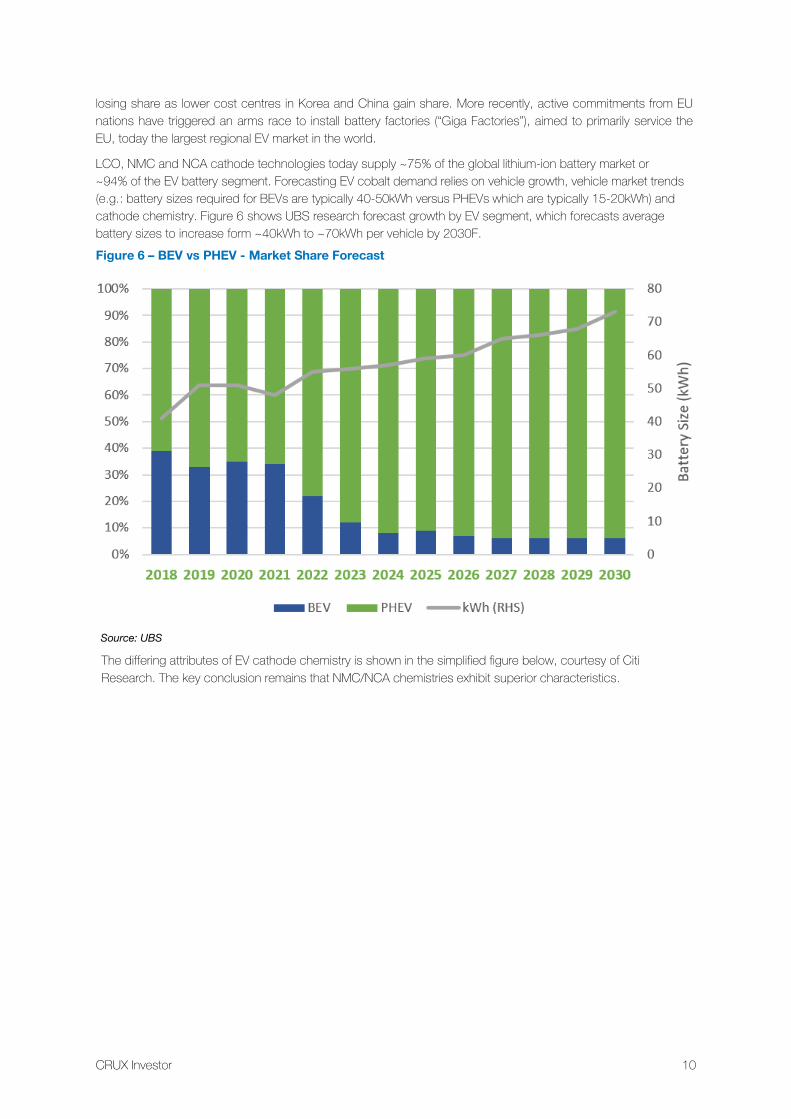
LCO, NMC and NCA cathode technologies today supply ~75% of the global lithium-ion battery market or ~94% of the EV battery segment. Forecasting EV cobalt demand relies on vehicle growth, vehicle market trends (e.g.: battery sizes required for BEVs are typically 40-50kWh versus PHEVs which are typically 15-20kWh) and cathode chemistry. Figure 6 shows UBS research forecast growth by EV segment, which forecasts average battery sizes to increase form ~40kWh to ~70kWh per vehicle by 2030F. Figure 6 – BEV vs PHEV - Market Share Forecast
Source: UBS
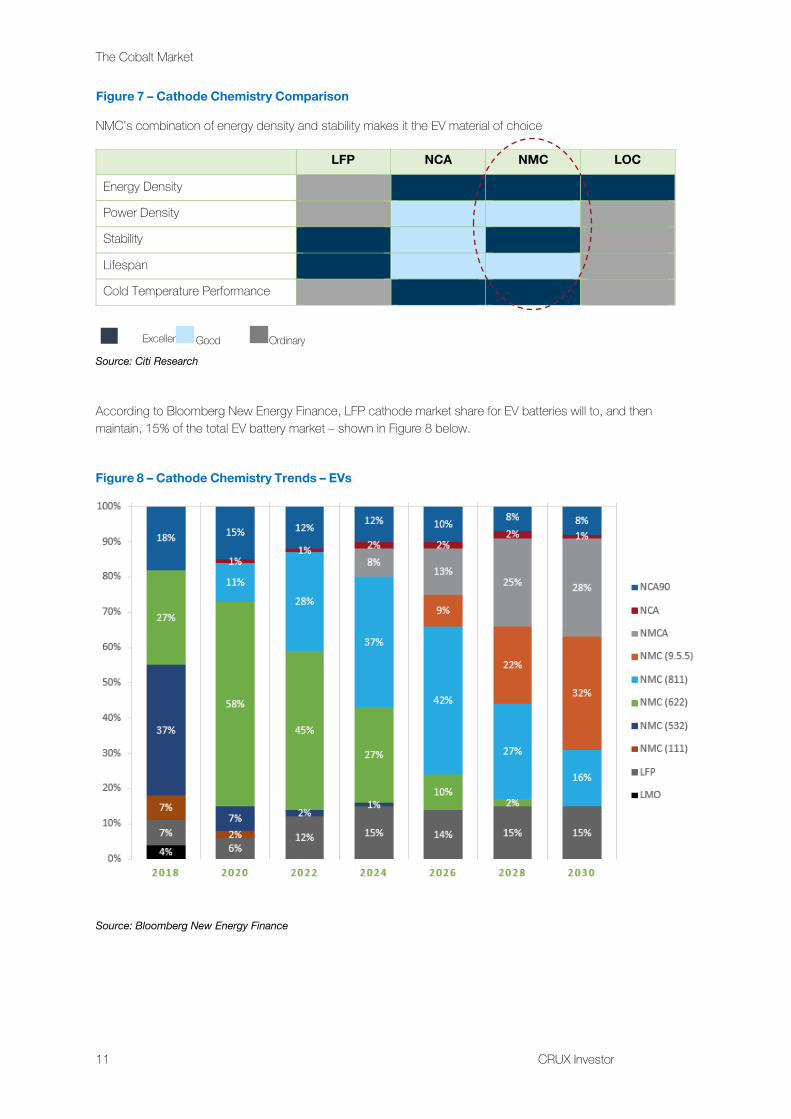
The differing attributes of EV cathode chemistry is shown in the simplified figure below, courtesy of Citi Research. The key conclusion remains that NMC/NCA chemistries exhibit superior characteristics.
11 CRUX Investor
The Cobalt Market
Figure 7 – Cathode Chemistry Comparison
NMC’s combination of energy density and stability makes it the EV material of choice
LFP NCA NMC LOC
Energy Density
Power Density
Stability
Lifespan
Cold Temperature Performance
Good Ordinary Excellent
Source: Citi Research
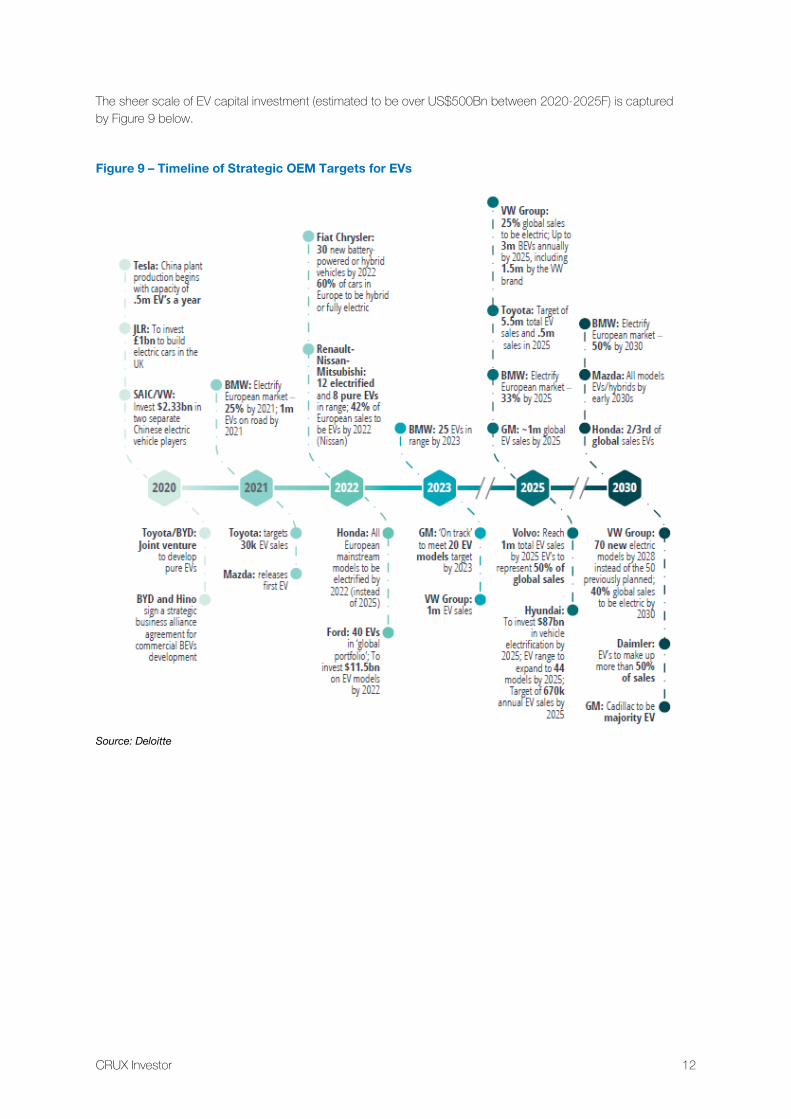
According to Bloomberg New Energy Finance, LFP cathode market share for EV batteries will to, and then maintain, 15% of the total EV battery market – shown in Figure 8 below.
Figure 8 – Cathode Chemistry Trends – EVs
Source: Bloomberg New Energy Finance
CRUX Investor 12
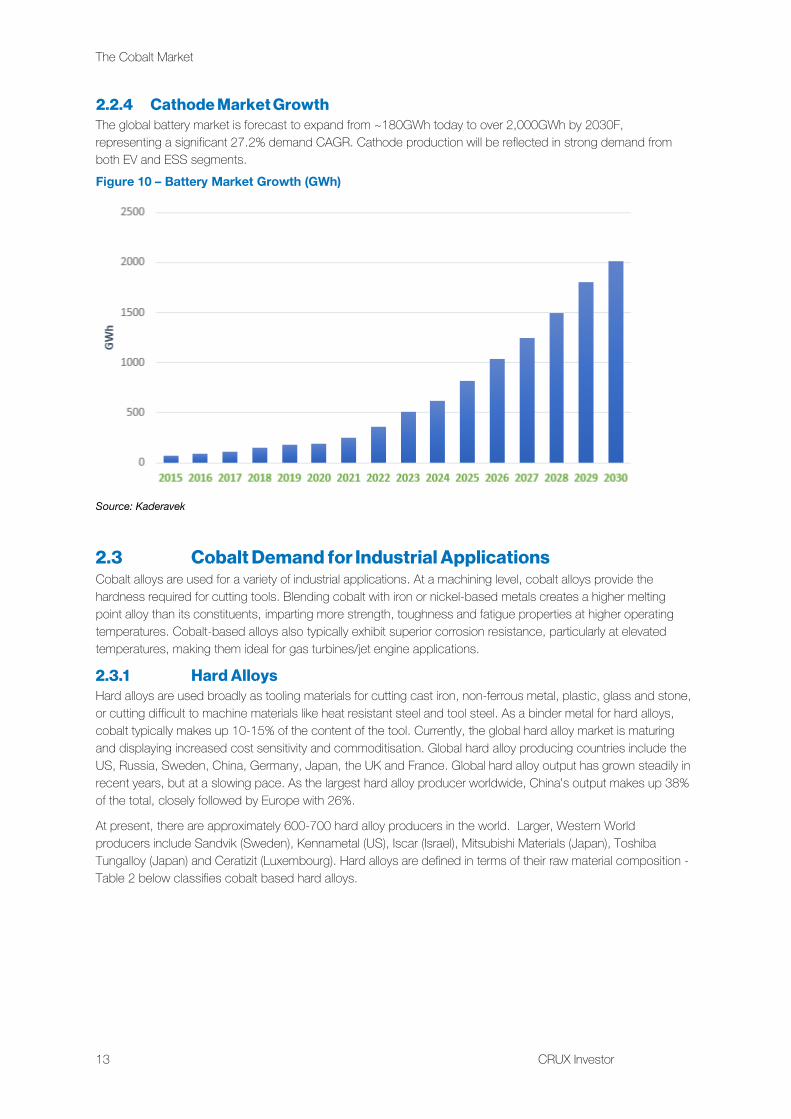
The sheer scale of EV capital investment (estimated to be over US$500Bn between 2020-2025F) is captured by Figure 9 below.
Figure 9 – Timeline of Strategic OEM Targets for EVs
Source: Deloitte
13 CRUX Investor
The Cobalt Market
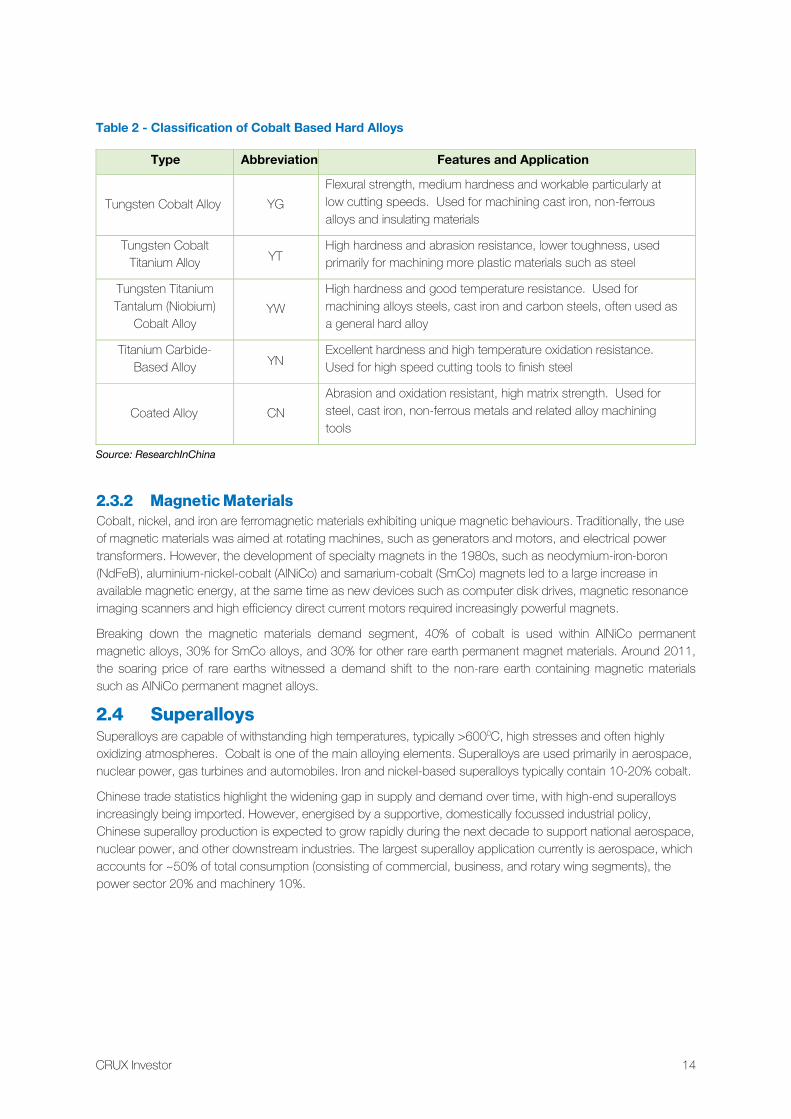
2.2.4 Cathode Market Growth The global battery market is forecast to expand from ~180GWh today to over 2,000GWh by 2030F, representing a significant 27.2% demand CAGR. Cathode production will be reflected in strong demand from both EV and ESS segments. Figure 10 – Battery Market Growth (GWh)
Source: Kaderavek
2.3 Cobalt Demand for Industrial Applications Cobalt alloys are used for a variety of industrial applications. At a machining level, cobalt alloys provide the hardness required for cutting tools. Blending cobalt with iron or nickel-based metals creates a higher melting point alloy than its constituents, imparting more strength, toughness and fatigue properties at higher operating temperatures. Cobalt-based alloys also typically exhibit superior corrosion resistance, particularly at elevated temperatures, making them ideal for gas turbines/jet engine applications.
2.3.1 Hard Alloys Hard alloys are used broadly as tooling materials for cutting cast iron, non-ferrous metal, plastic, glass and stone, or cutting difficult to machine materials like heat resistant steel and tool steel. As a binder metal for hard alloys, cobalt typically makes up 10-15% of the content of the tool. Currently, the global hard alloy market is maturing and displaying increased cost sensitivity and commoditisation. Global hard alloy producing countries include the US, Russia, Sweden, China, Germany, Japan, the UK and France. Global hard alloy output has grown steadily in recent years, but at a slowing pace. As the largest hard alloy producer worldwide, China’s output makes up 38% of the total, closely followed by Europe with 26%.
At present, there are approximately 600-700 hard alloy producers in the world. Larger, Western World producers include Sandvik (Sweden), Kennametal (US), Iscar (Israel), Mitsubishi Materials (Japan), Toshiba Tungalloy (Japan) and Ceratizit (Luxembourg). Hard alloys are defined in terms of their raw material composition - Table 2 below classifies cobalt based hard alloys.
CRUX Investor 14
Table 2 - Classification of Cobalt Based Hard Alloys
Type Abbreviation Features and Application
Tungsten Cobalt Alloy YG Flexural strength, medium hardness and workable particularly at low cutting speeds. Used for machining cast iron, non-ferrous alloys and insulating materials
Tungsten Cobalt Titanium Alloy YT
High hardness and abrasion resistance, lower toughness, used primarily for machining more plastic materials such as steel
Tungsten Titanium Tantalum (Niobium)
Cobalt Alloy YW
High hardness and good temperature resistance. Used for machining alloys steels, cast iron and carbon steels, often used as a general hard alloy
Titanium Carbide-Based Alloy YN
Excellent hardness and high temperature oxidation resistance. Used for high speed cutting tools to finish steel
Coated Alloy CN Abrasion and oxidation resistant, high matrix strength. Used for steel, cast iron, non-ferrous metals and related alloy machining tools
Source: ResearchInChina
2.3.2 Magnetic Materials Cobalt, nickel, and iron are ferromagnetic materials exhibiting unique magnetic behaviours. Traditionally, the use of magnetic materials was aimed at rotating machines, such as generators and motors, and electrical power transformers. However, the development of specialty magnets in the 1980s, such as neodymium-iron-boron (NdFeB), aluminium-nickel-cobalt (AlNiCo) and samarium-cobalt (SmCo) magnets led to a large increase in available magnetic energy, at the same time as new devices such as computer disk drives, magnetic resonance imaging scanners and high efficiency direct current motors required increasingly powerful magnets.
Breaking down the magnetic materials demand segment, 40% of cobalt is used within AlNiCo permanent magnetic alloys, 30% for SmCo alloys, and 30% for other rare earth permanent magnet materials. Around 2011, the soaring price of rare earths witnessed a demand shift to the non-rare earth containing magnetic materials such as AlNiCo permanent magnet alloys.
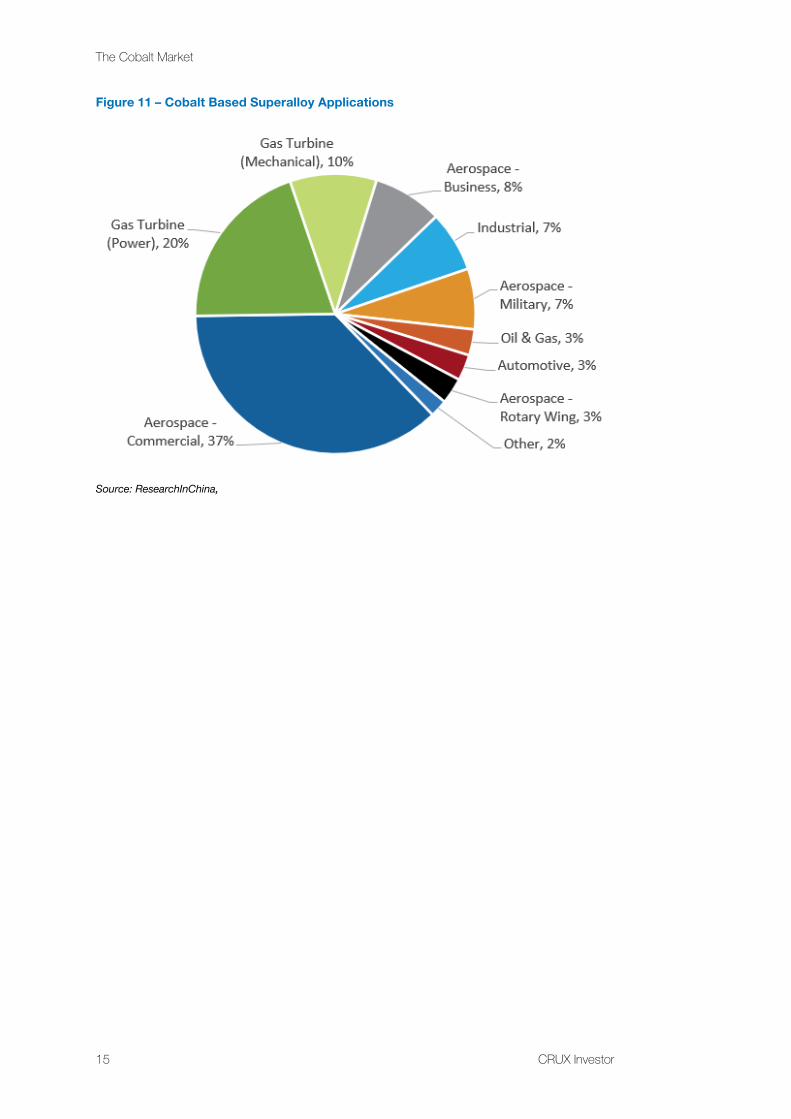
2.4 Superalloys Superalloys are capable of withstanding high temperatures, typically >6000C, high stresses and often highly oxidizing atmospheres. Cobalt is one of the main alloying elements. Superalloys are used primarily in aerospace, nuclear power, gas turbines and automobiles. Iron and nickel-based superalloys typically contain 10-20% cobalt.
Chinese trade statistics highlight the widening gap in supply and demand over time, with high-end superalloys increasingly being imported. However, energised by a supportive, domestically focussed industrial policy, Chinese superalloy production is expected to grow rapidly during the next decade to support national aerospace, nuclear power, and other downstream industries. The largest superalloy application currently is aerospace, which accounts for ~50% of total consumption (consisting of commercial, business, and rotary wing segments), the power sector 20% and machinery 10%.
The Cobalt Market
15 CRUX Investor
Figure 11 – Cobalt Based Superalloy Applications
Source: ResearchInChina,
CRUX Investor 16
3 Supply:
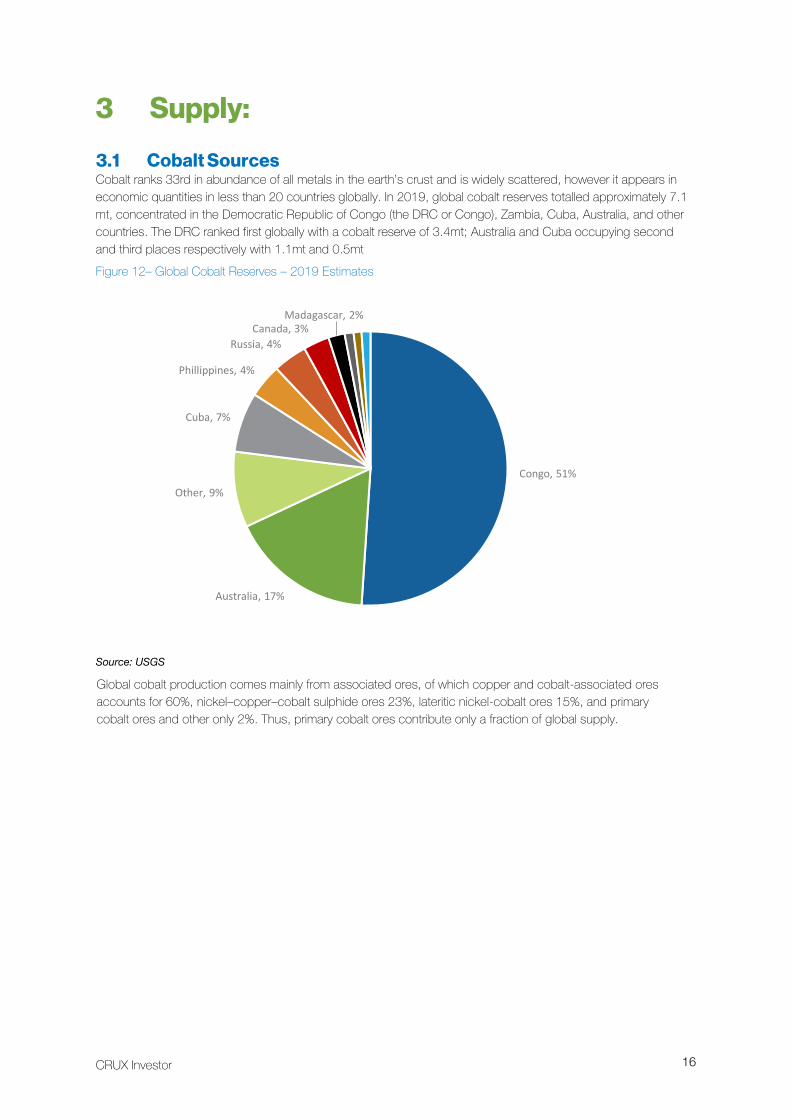
3.1 Cobalt Sources Cobalt ranks 33rd in abundance of all metals in the earth’s crust and is widely scattered, however it appears in economic quantities in less than 20 countries globally. In 2019, global cobalt reserves totalled approximately 7.1 mt, concentrated in the Democratic Republic of Congo (the DRC or Congo), Zambia, Cuba, Australia, and other countries. The DRC ranked first globally with a cobalt reserve of 3.4mt; Australia and Cuba occupying second and third places respectively with 1.1mt and 0.5mt Figure 12– Global Cobalt Reserves – 2019 Estimates
Source: USGS
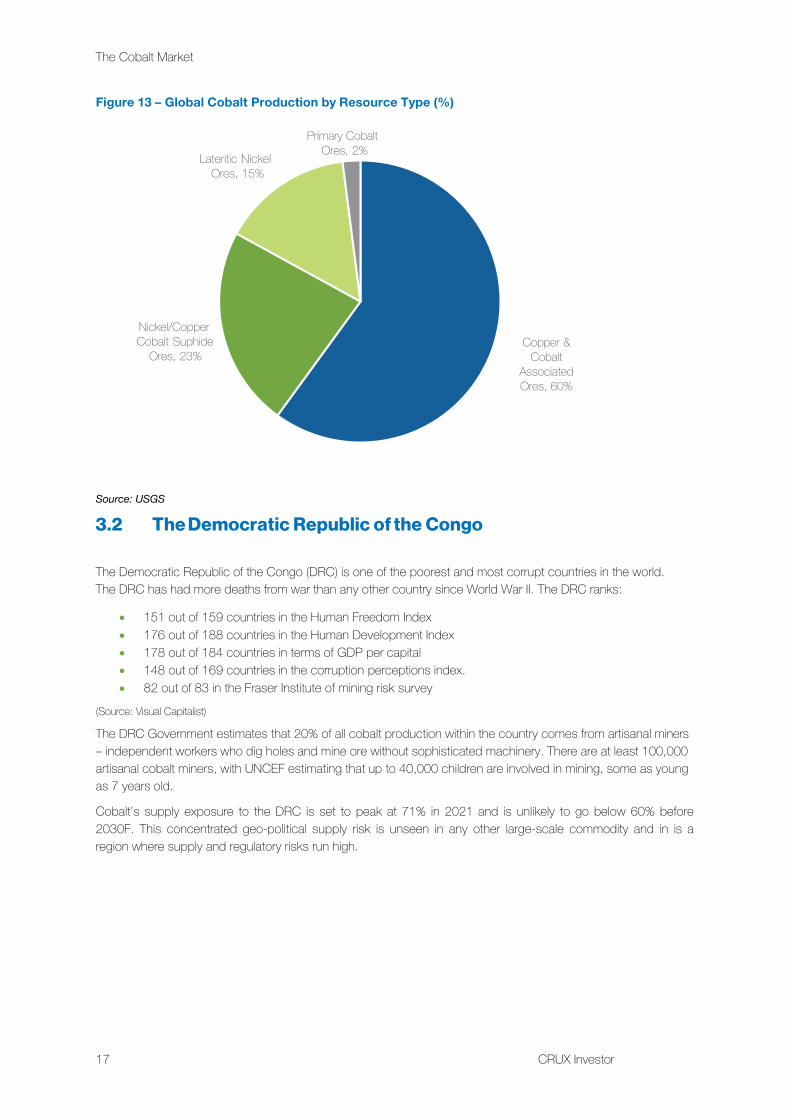
Global cobalt production comes mainly from associated ores, of which copper and cobalt-associated ores accounts for 60%, nickel–copper–cobalt sulphide ores 23%, lateritic nickel-cobalt ores 15%, and primary cobalt ores and other only 2%. Thus, primary cobalt ores contribute only a fraction of global supply.
Congo, 51%
Australia, 17%
Other, 9%
Cuba, 7%
Phillippines, 4%
Russia, 4%Canada, 3%
Madagascar, 2%
The Cobalt Market
17 CRUX Investor
Figure 13 – Global Cobalt Production by Resource Type (%)
Source: USGS
3.2 The Democratic Republic of the Congo
The Democratic Republic of the Congo (DRC) is one of the poorest and most corrupt countries in the world. The DRC has had more deaths from war than any other country since World War II. The DRC ranks:
• 151 out of 159 countries in the Human Freedom Index• 176 out of 188 countries in the Human Development Index• 178 out of 184 countries in terms of GDP per capital• 148 out of 169 countries in the corruption perceptions index.• 82 out of 83 in the Fraser Institute of mining risk survey
(Source: Visual Capitalist)
The DRC Government estimates that 20% of all cobalt production within the country comes from artisanal miners – independent workers who dig holes and mine ore without sophisticated machinery. There are at least 100,000artisanal cobalt miners, with UNCEF estimating that up to 40,000 children are involved in mining, some as youngas 7 years old.
Cobalt’s supply exposure to the DRC is set to peak at 71% in 2021 and is unlikely to go below 60% before 2030F. This concentrated geo-political supply risk is unseen in any other large-scale commodity and in is a region where supply and regulatory risks run high.
Copper & Cobalt
Associated Ores, 60%
Nickel/Copper Cobalt Suphide
Ores, 23%
Lateritic Nickel Ores, 15%
Primary Cobalt Ores, 2%
CRUX Investor 18
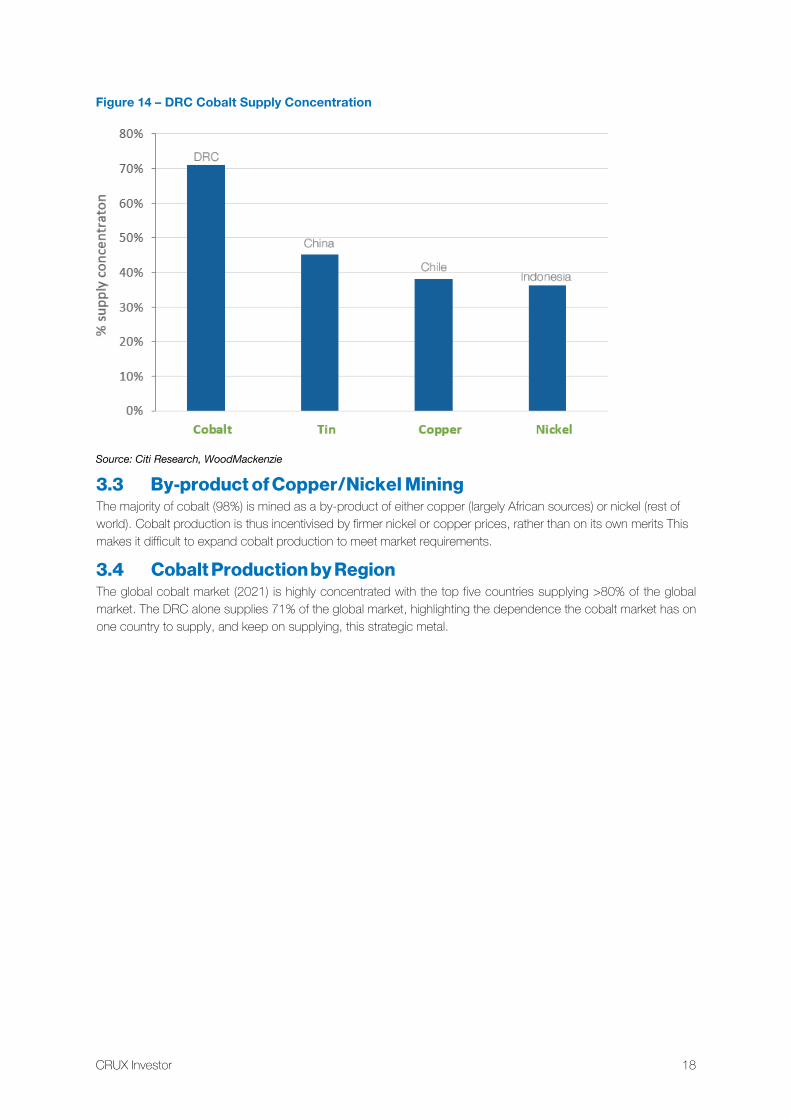
Figure 14 – DRC Cobalt Supply Concentration
Source: Citi Research, WoodMackenzie
3.3 By-product of Copper/Nickel Mining The majority of cobalt (98%) is mined as a by-product of either copper (largely African sources) or nickel (rest of world). Cobalt production is thus incentivised by firmer nickel or copper prices, rather than on its own merits This makes it difficult to expand cobalt production to meet market requirements.
3.4 Cobalt Production by Region The global cobalt market (2021) is highly concentrated with the top five countries supplying >80% of the global market. The DRC alone supplies 71% of the global market, highlighting the dependence the cobalt market has on one country to supply, and keep on supplying, this strategic metal.
The Cobalt Market
19 CRUX Investor
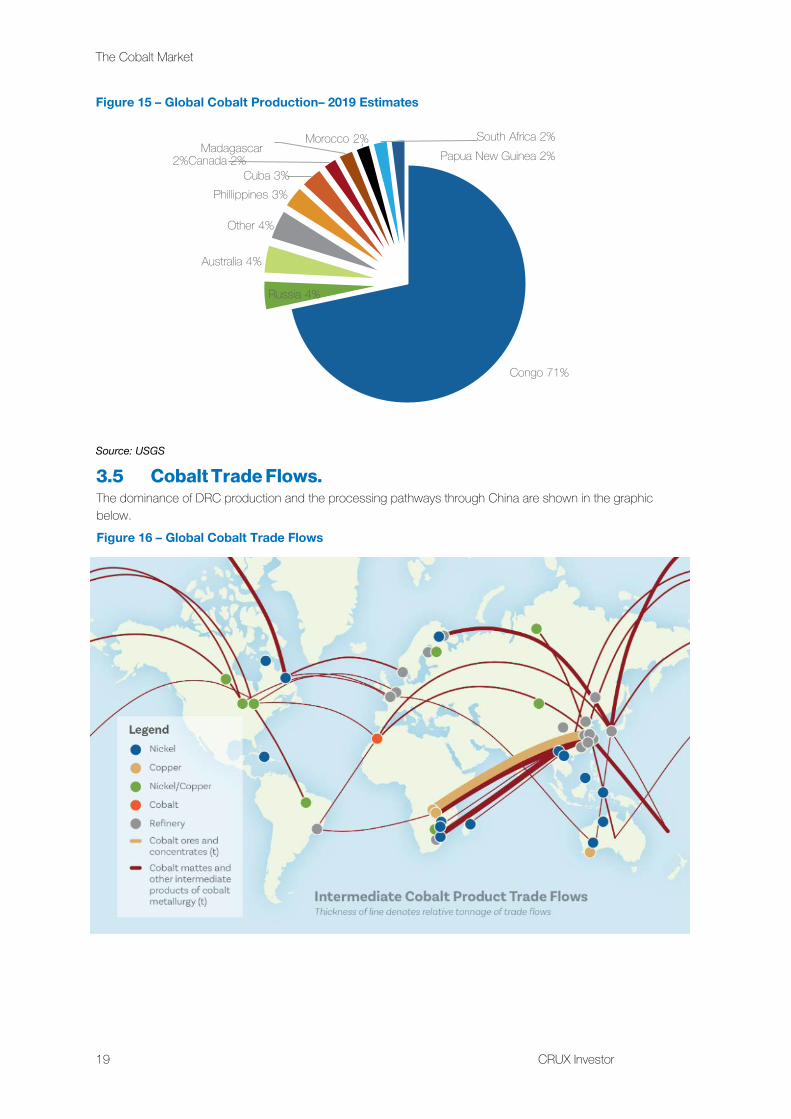
Figure 15 – Global Cobalt Production– 2019 Estimates
Source: USGS
3.5 Cobalt Trade Flows. The dominance of DRC production and the processing pathways through China are shown in the graphic below. Figure 16 – Global Cobalt Trade Flows
Congo 71%
Russia 4%
Australia 4%
Other 4%
Phillippines 3%Cuba 3%
Madagascar 2%Canada 2%
Morocco 2% South Africa 2%Papua New Guinea 2%
CRUX Investor 20
Source: Cobalt Institute
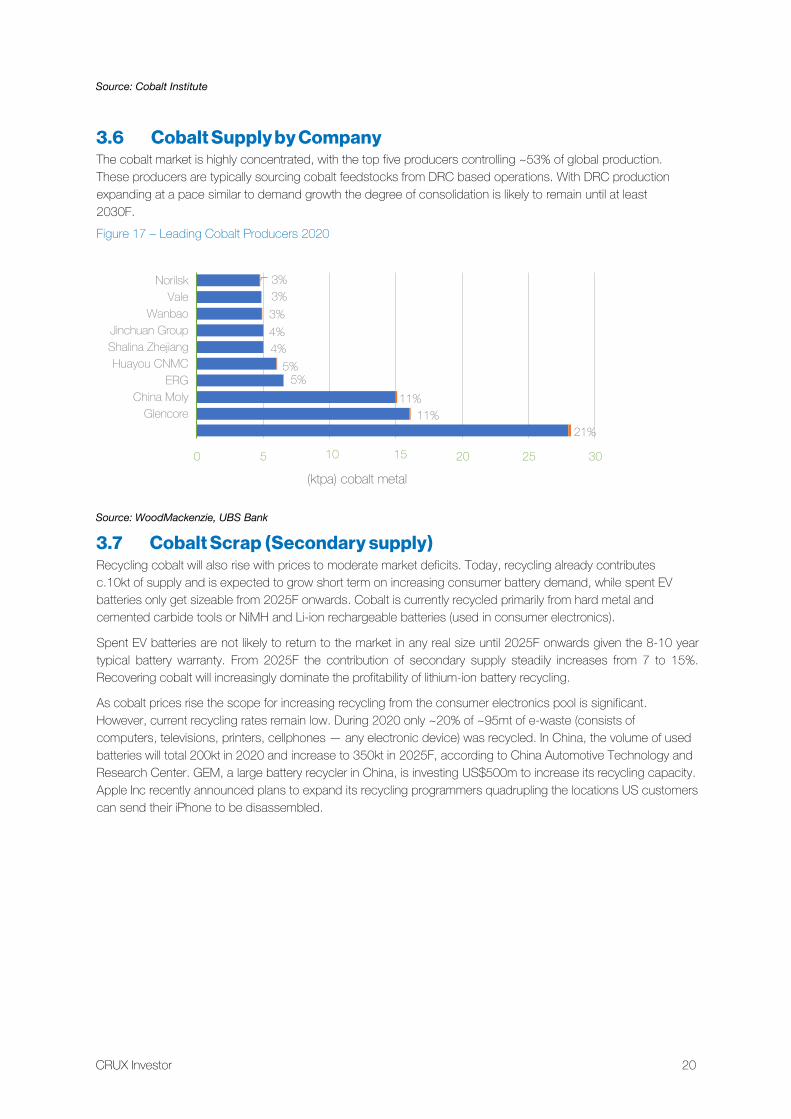
3.6 Cobalt Supply by Company The cobalt market is highly concentrated, with the top five producers controlling ~53% of global production. These producers are typically sourcing cobalt feedstocks from DRC based operations. With DRC production expanding at a pace similar to demand growth the degree of consolidation is likely to remain until at least 2030F. Figure 17 – Leading Cobalt Producers 2020
Source: WoodMackenzie, UBS Bank
3.7 Cobalt Scrap (Secondary supply) Recycling cobalt will also rise with prices to moderate market deficits. Today, recycling already contributes c.10kt of supply and is expected to grow short term on increasing consumer battery demand, while spent EVbatteries only get sizeable from 2025F onwards. Cobalt is currently recycled primarily from hard metal andcemented carbide tools or NiMH and Li-ion rechargeable batteries (used in consumer electronics).
Spent EV batteries are not likely to return to the market in any real size until 2025F onwards given the 8-10 year typical battery warranty. From 2025F the contribution of secondary supply steadily increases from 7 to 15%. Recovering cobalt will increasingly dominate the profitability of lithium-ion battery recycling.
As cobalt prices rise the scope for increasing recycling from the consumer electronics pool is significant. However, current recycling rates remain low. During 2020 only ~20% of ~95mt of e-waste (consists of computers, televisions, printers, cellphones — any electronic device) was recycled. In China, the volume of used batteries will total 200kt in 2020 and increase to 350kt in 2025F, according to China Automotive Technology and Research Center. GEM, a large battery recycler in China, is investing US$500m to increase its recycling capacity. Apple Inc recently announced plans to expand its recycling programmers quadrupling the locations US customers can send their iPhone to be disassembled.
21%11%
11%5%
5%4%4%3%3%3%
0 5 20 25 30
NorilskVale
Wanbao Jinchuan Group Shalina Zhejiang Huayou CNMC
ERGChina Moly
Glencore
10 15
(ktpa) cobalt metal
21 CRUX Investor
The Cobalt Market
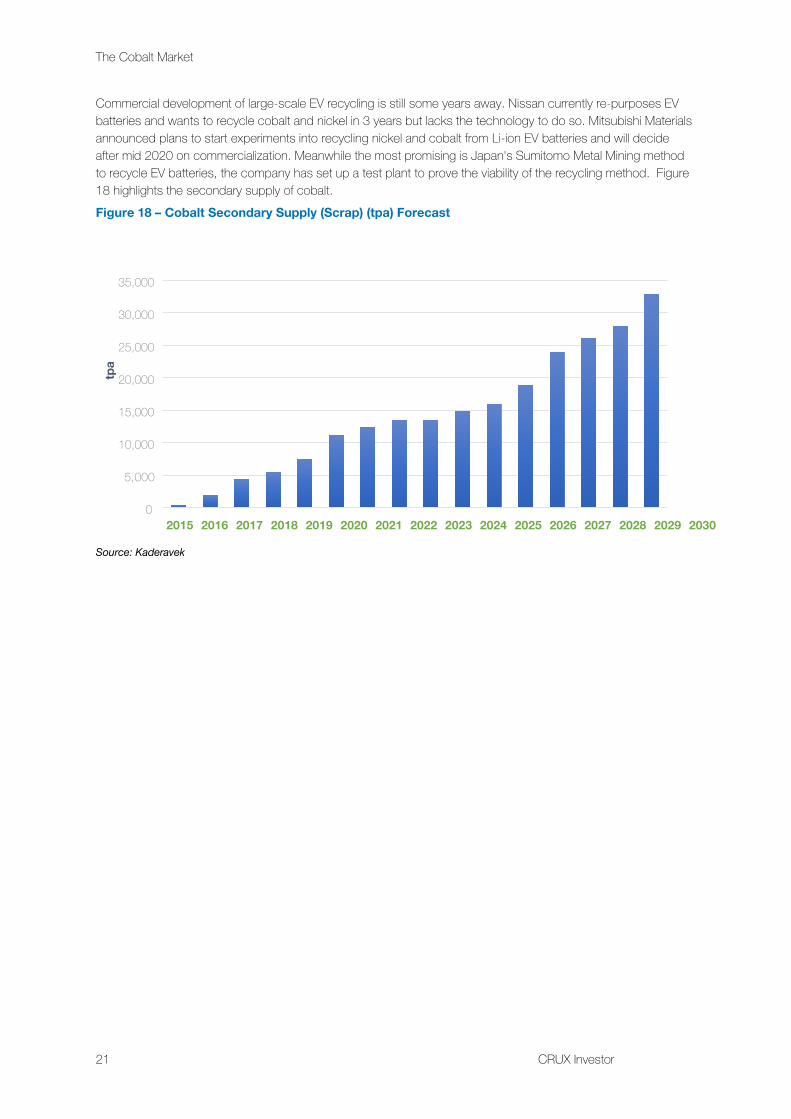
Commercial development of large-scale EV recycling is still some years away. Nissan currently re-purposes EV batteries and wants to recycle cobalt and nickel in 3 years but lacks the technology to do so. Mitsubishi Materials announced plans to start experiments into recycling nickel and cobalt from Li-ion EV batteries and will decide after mid 2020 on commercialization. Meanwhile the most promising is Japan's Sumitomo Metal Mining method to recycle EV batteries, the company has set up a test plant to prove the viability of the recycling method. Figure 18 highlights the secondary supply of cobalt. Figure 18 – Cobalt Secondary Supply (Scrap) (tpa) Forecast
Source: Kaderavek
0
5,000
10,000
15,000
20,000
25,000
30,000
35,000
2015 2016 2017 2018 2019 2020 2021 2022 2023 2024 2025 2026 2027 2028 2029 2030
tpa
CRUX Investor 22
4 Market Balance:
4.1 Cobalt Substitution As cobalt prices rise, substitution of cobalt will become inevitable. The simplest substitution is in chemical applications (approx 15-18% of demand) within the non-battery sectors. Next, more moderate substitution will take place in permanent magnets and superalloys.
Higher cobalt prices and the need for EVs to reach cost parity with ICE vehicles will put lower cobalt weighting as a key target. We expect significant reduction of cobalt content in cathodes but not for full demand destruction or a “cobalt free” chemistry.
Nickel will increasingly take share of the cathode built, but a “cobalt free” solution is not an immediate risk. A lot of research and development is ongoing to build a battery with lower costs, higher energy density, improved safety but commercialization remains elusive. Lithium-ion battery designs with cobalt cathodes are still likely to dominate the battery market at least for the next 10+ years given the delays to commercialisation and ongoing technical challenges.
Our forecast incorporates an aggressive 70% penetration of EV cathodes will be nickel heavy NMC 811 by 2030F). BYD, one of the largest battery makers, is planning to push out an LFP battery design (aka “Blade technology”). The low energy density of LFP (NMC 811 has approximately 1.5x the energy density of LFP) makes weight a significant barrier as demands rise. LFP cathodes will tend to dominate low range and low cost vehicles, typically focussed on a segment of the Chinese market. As pack costs of NMC 811 are only 8-9% higher than LFP, a mature market share of ~15% will be difficult to increase without substantial breakthroughs in energy density. For PHEVs where energy density is less restrictive, cobalt- nickel free LFP batteries are expected to remain more dominant.
23 CRUX Investor
The Cobalt Market
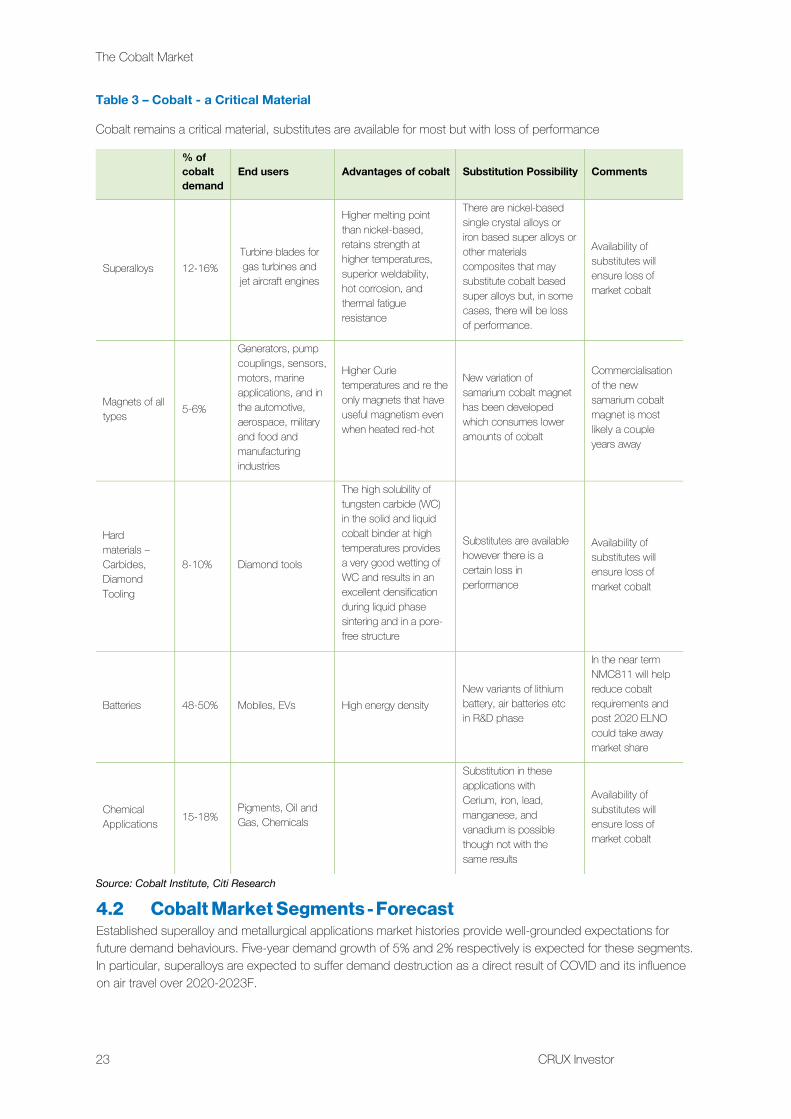
Table 3 – Cobalt - a Critical Material
Cobalt remains a critical material, substitutes are available for most but with loss of performance
% of cobalt demand
End users Advantages of cobalt Substitution Possibility Comments
Superalloys 12-16%Turbine blades for gas turbines and jet aircraft engines
Higher melting point than nickel-based, retains strength at higher temperatures, superior weldability, hot corrosion, and thermal fatigue resistance
There are nickel-based single crystal alloys or iron based super alloys or other materials composites that may substitute cobalt based super alloys but, in some cases, there will be loss of performance.
Availability of substitutes will ensure loss of market cobalt
Magnets of all types 5-6%
Generators, pump couplings, sensors, motors, marine applications, and in the automotive, aerospace, military and food and manufacturing industries
Higher Curie temperatures and re the only magnets that have useful magnetism even when heated red-hot
New variation of samarium cobalt magnet has been developed which consumes lower amounts of cobalt
Commercialisation of the new samarium cobalt magnet is most likely a couple years away
Hard materials – Carbides, Diamond Tooling
8-10% Diamond tools
The high solubility of tungsten carbide (WC) in the solid and liquid cobalt binder at high temperatures provides a very good wetting of WC and results in an excellent densification during liquid phase sintering and in a pore-free structure
Substitutes are available however there is a certain loss in performance
Availability of substitutes will ensure loss of market cobalt
Batteries 48-50% Mobiles, EVs High energy density New variants of lithium battery, air batteries etc in R&D phase
In the near term NMC811 will help reduce cobalt requirements and post 2020 ELNO could take away market share
Chemical Applications 15-18%
Pigments, Oil and Gas, Chemicals
Substitution in these applications with Cerium, iron, lead, manganese, and vanadium is possible though not with the same results
Availability of substitutes will ensure loss of market cobalt
Source: Cobalt Institute, Citi Research
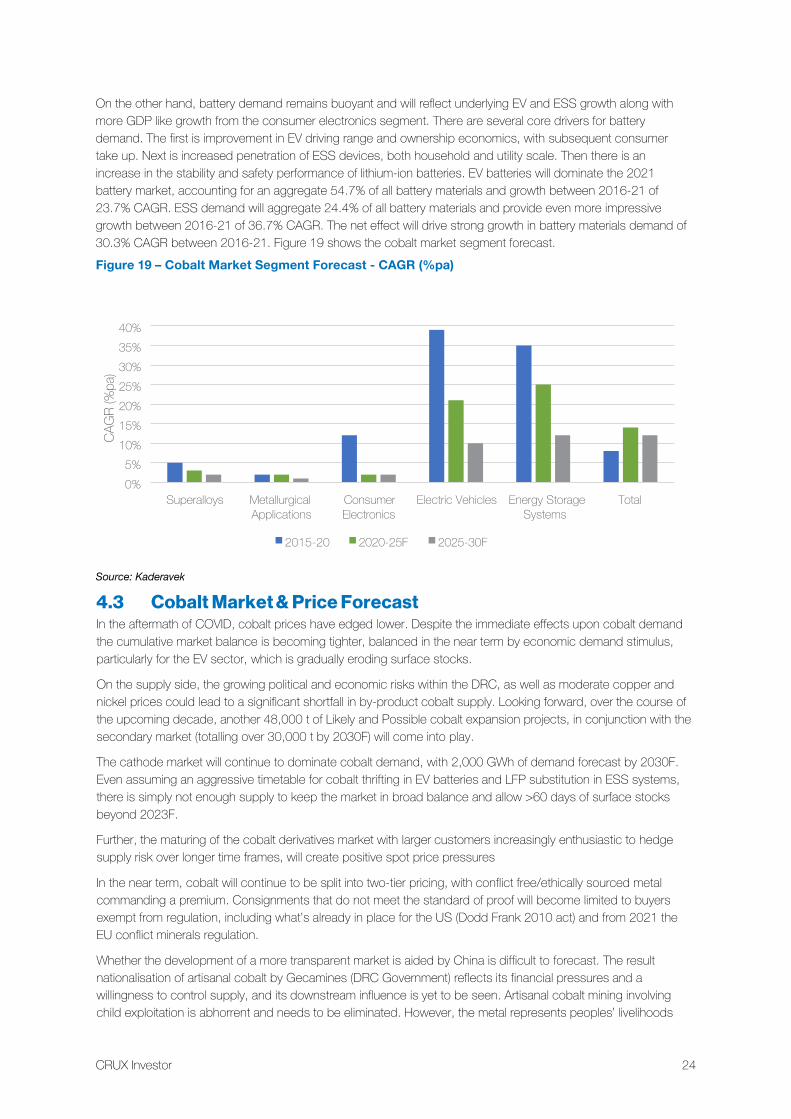
4.2 Cobalt Market Segments - Forecast Established superalloy and metallurgical applications market histories provide well-grounded expectations for future demand behaviours. Five-year demand growth of 5% and 2% respectively is expected for these segments. In particular, superalloys are expected to suffer demand destruction as a direct result of COVID and its influence on air travel over 2020-2023F.
CRUX Investor 24
On the other hand, battery demand remains buoyant and will reflect underlying EV and ESS growth along with more GDP like growth from the consumer electronics segment. There are several core drivers for battery demand. The first is improvement in EV driving range and ownership economics, with subsequent consumer take up. Next is increased penetration of ESS devices, both household and utility scale. Then there is an increase in the stability and safety performance of lithium-ion batteries. EV batteries will dominate the 2021 battery market, accounting for an aggregate 54.7% of all battery materials and growth between 2016-21 of 23.7% CAGR. ESS demand will aggregate 24.4% of all battery materials and provide even more impressive growth between 2016-21 of 36.7% CAGR. The net effect will drive strong growth in battery materials demand of 30.3% CAGR between 2016-21. Figure 19 shows the cobalt market segment forecast. Figure 19 – Cobalt Market Segment Forecast - CAGR (%pa)
Source: Kaderavek
4.3 Cobalt Market & Price Forecast In the aftermath of COVID, cobalt prices have edged lower. Despite the immediate effects upon cobalt demand the cumulative market balance is becoming tighter, balanced in the near term by economic demand stimulus, particularly for the EV sector, which is gradually eroding surface stocks.
On the supply side, the growing political and economic risks within the DRC, as well as moderate copper and nickel prices could lead to a significant shortfall in by-product cobalt supply. Looking forward, over the course of the upcoming decade, another 48,000 t of Likely and Possible cobalt expansion projects, in conjunction with the secondary market (totalling over 30,000 t by 2030F) will come into play.
The cathode market will continue to dominate cobalt demand, with 2,000 GWh of demand forecast by 2030F. Even assuming an aggressive timetable for cobalt thrifting in EV batteries and LFP substitution in ESS systems, there is simply not enough supply to keep the market in broad balance and allow >60 days of surface stocks beyond 2023F.
Further, the maturing of the cobalt derivatives market with larger customers increasingly enthusiastic to hedge supply risk over longer time frames, will create positive spot price pressures
In the near term, cobalt will continue to be split into two-tier pricing, with conflict free/ethically sourced metal commanding a premium. Consignments that do not meet the standard of proof will become limited to buyers exempt from regulation, including what’s already in place for the US (Dodd Frank 2010 act) and from 2021 the EU conflict minerals regulation.
Whether the development of a more transparent market is aided by China is difficult to forecast. The result nationalisation of artisanal cobalt by Gecamines (DRC Government) reflects its financial pressures and a willingness to control supply, and its downstream influence is yet to be seen. Artisanal cobalt mining involving child exploitation is abhorrent and needs to be eliminated. However, the metal represents peoples’ livelihoods
0%5%
10%15%20%25%30%35%40%
Superalloys MetallurgicalApplications
ConsumerElectronics
Electric Vehicles Energy StorageSystems
Total
CAG
R (%
pa)
2015-20 2020-25F 2025-30F
25 CRUX Investor
The Cobalt Market
and those legitimately involved in mining cobalt deserve a living wage and a safe working environment. With the assistance of Western consumer industries these objectives will be met, and thus ethical artisanal supply will continue to flow.
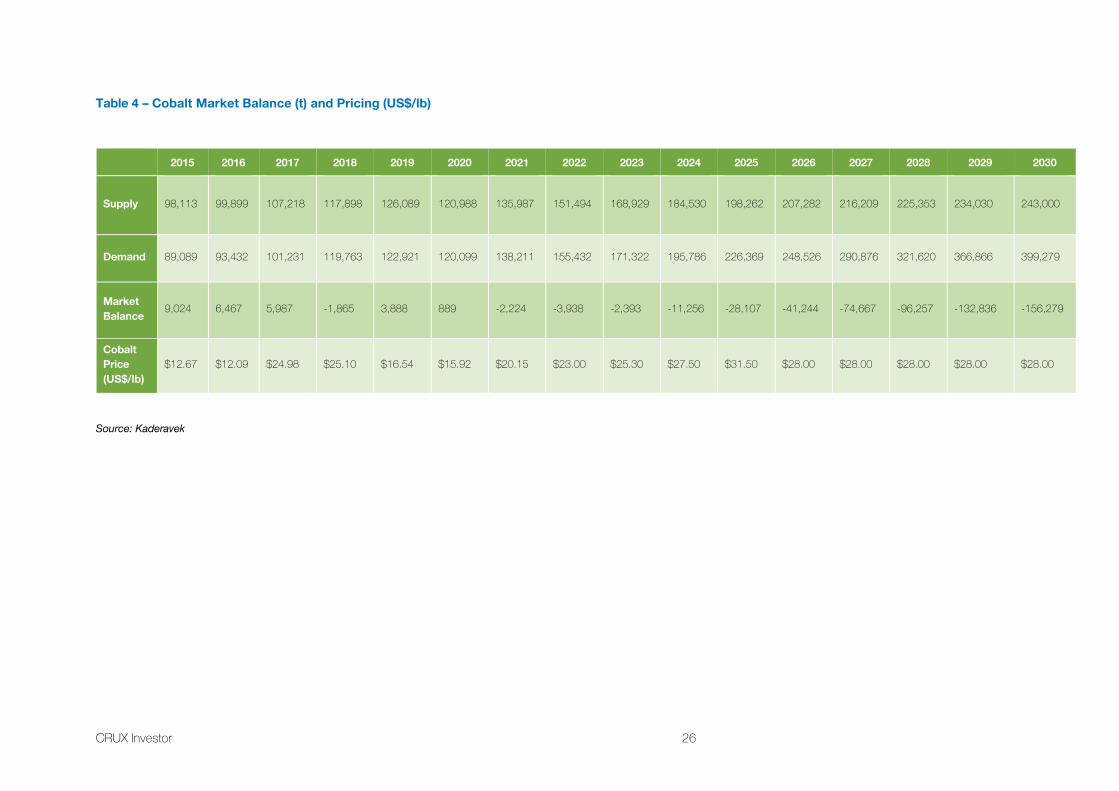
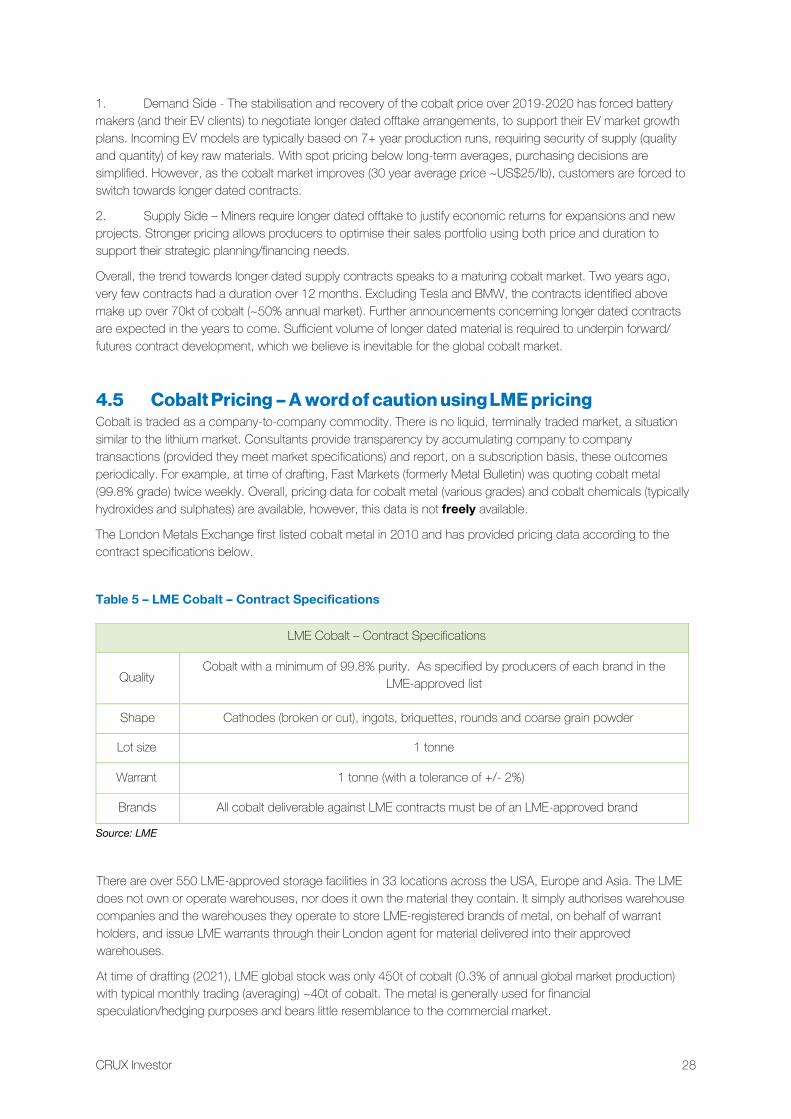
The cobalt market forecast shown below is in real $2020 dollars. The market balance and associated inventory drawdown can certainly justify higher forward pricing, however our view is to impose a long term price outcome (US$28/lb) at (t + 5) years or 2026F at time of drafting. For perspective, the long term real average price is around US$25/lb, supporting this forecast, particularly when considering growing EV battery demand. This rapid demand growth against a backdrop of concentrated supply, risk in the DRC is a situation unlike any other base metal.
CRUX Investor 26
Table 4 – Cobalt Market Balance (t) and Pricing (US$/lb)
Source: Kaderavek
2015 2016 2017 2018 2019 2020 2021 2022 2023 2024 2025 2026 2027 2028 2029 2030
Supply 98,113 99,899 107,218 117,898 126,089 120,988 135,987 151,494 168,929 184,530 198,262 207,282 216,209 225,353 234,030 243,000
Demand 89,089 93,432 101,231 119,763 122,921 120,099 138,211 155,432 171,322 195,786 226,369 248,526 290,876 321,620 366,866 399,279
Market Balance 9,024 6,467 5,987 -1,865 3,888 889 -2,224 -3,938 -2,393 -11,256 -28,107 -41,244 -74,667 -96,257 -132,836 -156,279
Cobalt Price (US$/lb)
$12.67 $12.09 $24.98 $25.10 $16.54 $15.92 $20.15 $23.00 $25.30 $27.50 $31.50 $28.00 $28.00 $28.00 $28.00 $28.00
The Cobalt Market
27 CRUX Investor
Figure 20 – Cobalt Market Supply/Demand Forecast
Source: Kaderavek
Figure 21 – Cobalt Market Balance and Price Forecast
Source: Kaderavek
4.4 Cobalt Market – Longer Term Contracts Emerging Longer dated, large volume contracts are emerging, a sign that customer security of supply concerns for battery raw materials are dominating the miner/battery maker relationship. These long-term supply contracts have pricing typically tied to public references and are replacing short term (12 months or less) contracts.
To date, Glencore has signed long term deals with Umicore (deal terms unknown), Samsung SDI (upto 21kt - 5 year deal), SK Innovation (upto 30kt – 6 year deal), GEM (minimum 21.5kt - 5 year deal). At time of drafting Tesla and BMW were also in negotiations focussed upon a long-term supply deals with Glencore. (Data source: Benchmark Mineral Intelligence)
There are two market factors at play here:
-
50,000
100,000
150,000
200,000
250,000
300,000
350,000
400,000
2015 2016 2017 2018 2019 2020 2021 2022 2023 2024 2025 2026 2027 2028 2029 2030
tpa
coba
lt met
al (e
quiva
lent)
Supply Demand
$-
$5.00
$10.00
$15.00
$20.00
$25.00
$30.00
$35.00
-50,000
-40,000
-30,000
-20,000
-10,000
-
10,000
20,000
30,000
40,000
50,000
Market Balance Cobalt Price (US$/lb) (RHS)
LT Price Assumption
CRUX Investor 28
1. Demand Side - The stabilisation and recovery of the cobalt price over 2019-2020 has forced battery makers (and their EV clients) to negotiate longer dated offtake arrangements, to support their EV market growth plans. Incoming EV models are typically based on 7+ year production runs, requiring security of supply (quality and quantity) of key raw materials. With spot pricing below long-term averages, purchasing decisions are simplified. However, as the cobalt market improves (30 year average price ~US$25/lb), customers are forced to switch towards longer dated contracts.
2. Supply Side – Miners require longer dated offtake to justify economic returns for expansions and new projects. Stronger pricing allows producers to optimise their sales portfolio using both price and duration to support their strategic planning/financing needs.
Overall, the trend towards longer dated supply contracts speaks to a maturing cobalt market. Two years ago, very few contracts had a duration over 12 months. Excluding Tesla and BMW, the contracts identified above make up over 70kt of cobalt (~50% annual market). Further announcements concerning longer dated contracts are expected in the years to come. Sufficient volume of longer dated material is required to underpin forward/futures contract development, which we believe is inevitable for the global cobalt market.
4.5 Cobalt Pricing – A word of caution using LME pricing Cobalt is traded as a company-to-company commodity. There is no liquid, terminally traded market, a situation similar to the lithium market. Consultants provide transparency by accumulating company to company transactions (provided they meet market specifications) and report, on a subscription basis, these outcomes periodically. For example, at time of drafting, Fast Markets (formerly Metal Bulletin) was quoting cobalt metal (99.8% grade) twice weekly. Overall, pricing data for cobalt metal (various grades) and cobalt chemicals (typically hydroxides and sulphates) are available, however, this data is not freely available.
The London Metals Exchange first listed cobalt metal in 2010 and has provided pricing data according to the contract specifications below.
Table 5 – LME Cobalt – Contract Specifications
LME Cobalt – Contract Specifications
Quality Cobalt with a minimum of 99.8% purity. As specified by producers of each brand in the
LME-approved list
Shape Cathodes (broken or cut), ingots, briquettes, rounds and coarse grain powder
Lot size 1 tonne
Warrant 1 tonne (with a tolerance of +/- 2%)
Brands All cobalt deliverable against LME contracts must be of an LME-approved brand
Source: LME
There are over 550 LME-approved storage facilities in 33 locations across the USA, Europe and Asia. The LME does not own or operate warehouses, nor does it own the material they contain. It simply authorises warehouse companies and the warehouses they operate to store LME-registered brands of metal, on behalf of warrant holders, and issue LME warrants through their London agent for material delivered into their approved warehouses.
At time of drafting (2021), LME global stock was only 450t of cobalt (0.3% of annual global market production) with typical monthly trading (averaging) ~40t of cobalt. The metal is generally used for financial speculation/hedging purposes and bears little resemblance to the commercial market.
29 CRUX Investor
The Cobalt Market
We therefore recommend investors avoid using LME price data as a proxy for cobalt pricing, however, acknowledge the direction of the LME pricing will mimic the broader commercial market. The LME recognises the shortcoming of this market and are examining solutions, including listing cobalt chemical products.
CRUX Investor 30
5 Conclusion:
5.1 Key Conclusions • The cobalt market is tightening 2021+. Post COVID demand is firming aided by significant government
sponsored subsidies.• A cobalt market inflection point from 2023F+ is likely unless further demand destruction occurs.• The EV market will drive strong demand for cobalt across 2021-2030F• Lithium-ion battery designs with cobalt cathodes are likely to dominate the battery market for at least
next 10+ years.• Battery makers/end customers will increasingly invest upstream to assure security of supply
5.2 Risks
5.2.1 Upside Risks Increasing popularity of EVs is the single greatest upside risk to prices. If new battery manufacturing facilities (e.g., Panasonic-Tesla, Samsung SDI and LG Chem) reach their slated capacities, EV demand could increase to nearly double base-case expectations.
DRC production irregularities caused by political and/or fiscal constraints. The latter would involve unilateral revision to the country’s Mining Code by adjusting cobalt royalty, operating taxes, or project equity ownership by Gecamines (DRC State Mining Company).
Moderate copper and nickel prices could lead to a significant shortfall in by-product cobalt supply. Unless additional primary cobalt projects or high-grade mixed sulphide projects are bought online, cobalt mine supply will lag chemical demand growth.
Increasing popularity of NMC batteries in the ESS sector could add considerable sulphate demand over the next ten years. We have modelled conservative demand for this sector and believe that spent EV batteries could be reused as storage devices.
5.2.2 Downside Risks If there is a sustained improvement in nickel and copper prices, we could see a number of existing mines and metal refineries increase their utilisation rates, leading to additional by-product supply growth. Improving cobalt concentrate prices could also incentivise an increase in artisanal supply growth in the DRC.
The substitution of cobalt-rich batteries for less cobalt intensive technologies could lead to a drop in demand. The substitution of LCO batteries with NMC in portable devices and the potential dominance of LFP batteries in the EV sector could lead to stagnation in demand growth.
Increasing recycle rates for superalloys, carbides, catalysts and batteries could negatively impact primary demand.
For investors: "It's clear that the Cobalt market is more than just a little opaque, we hope this article helps to make a very key part of the future of batteries more clear. Understanding the macro drivers for Cobalt can inform your own investment thesis, and where it fits into your own investment strategy for 2021.
There are few public players, some will make it and some will not - they will need to know how to navigate, not just the difficulties of mining, but also marketing the product in this brave new world of green and ethical investing.
With battery technologies evolving, new customers being created and relationships needing to be established, companies and their management will need to articulate how they will navigate these choppy waters.
We've seen only a few cobalt companies who seem capable, and we look forward to sharing our thoughts on that in the near future." - Matthew Gordon, CRUX Investor