Embed Size (px)
Citation preview
1
1
All the numbers are represented are masked considering business confidentiality
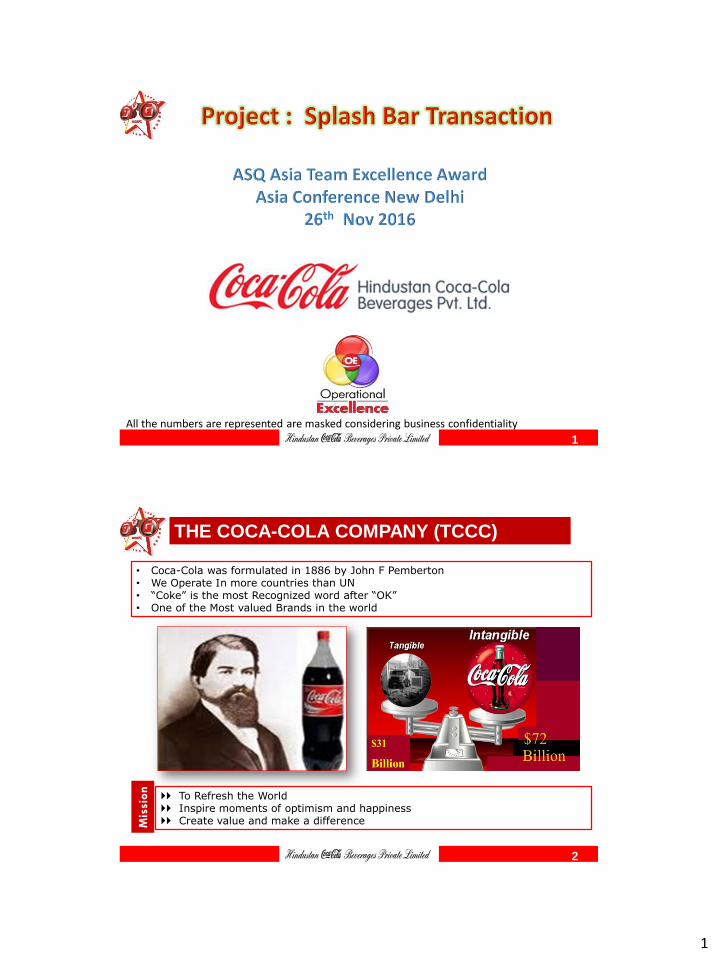
THE COCA-COLA COMPANY (TCCC)
• Coca-Cola was formulated in 1886 by John F Pemberton • We Operate In more countries than UN • “Coke” is the most Recognized word after “OK” • One of the Most valued Brands in the world
To Refresh the World Inspire moments of optimism and happiness Create value and make a difference M
issi
on
2
2
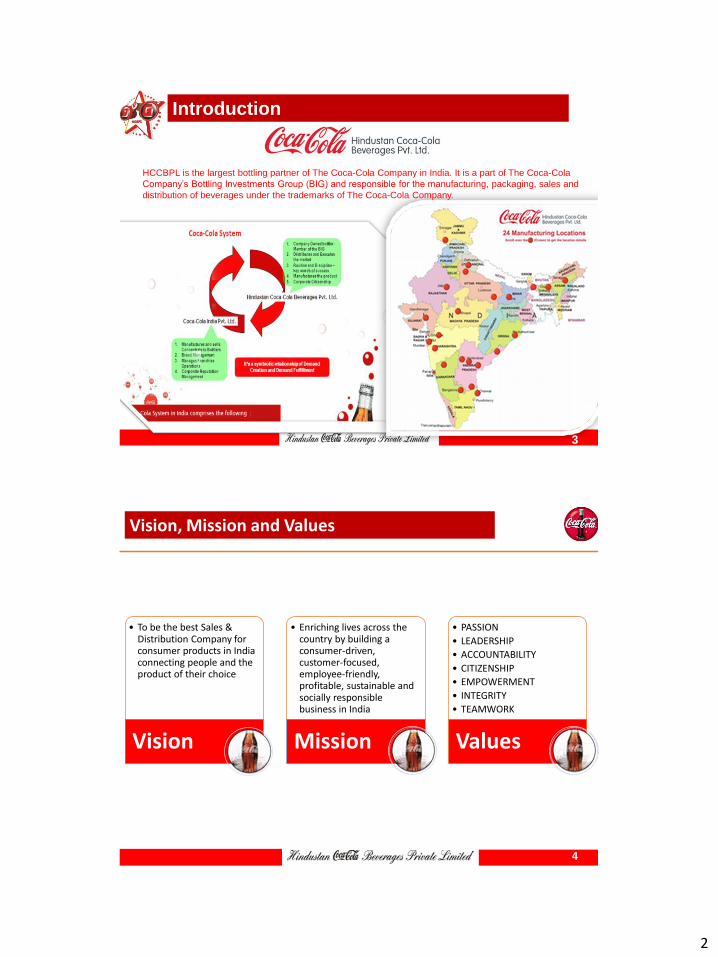
HCCBPL is the largest bottling partner of The Coca-Cola Company in India. It is a part of The Coca-Cola
Company’s Bottling Investments Group (BIG) and responsible for the manufacturing, packaging, sales and
distribution of beverages under the trademarks of The Coca-Cola Company.
Introduction… Introduction
3
• To be the best Sales & Distribution Company for consumer products in India connecting people and the product of their choice
Vision
• Enriching lives across the country by building a consumer-driven, customer-focused, employee-friendly, profitable, sustainable and socially responsible business in India
Mission
• PASSION
• LEADERSHIP
• ACCOUNTABILITY
• CITIZENSHIP
• EMPOWERMENT
• INTEGRITY
• TEAMWORK
Values
Vision, Mission and Values
4
3
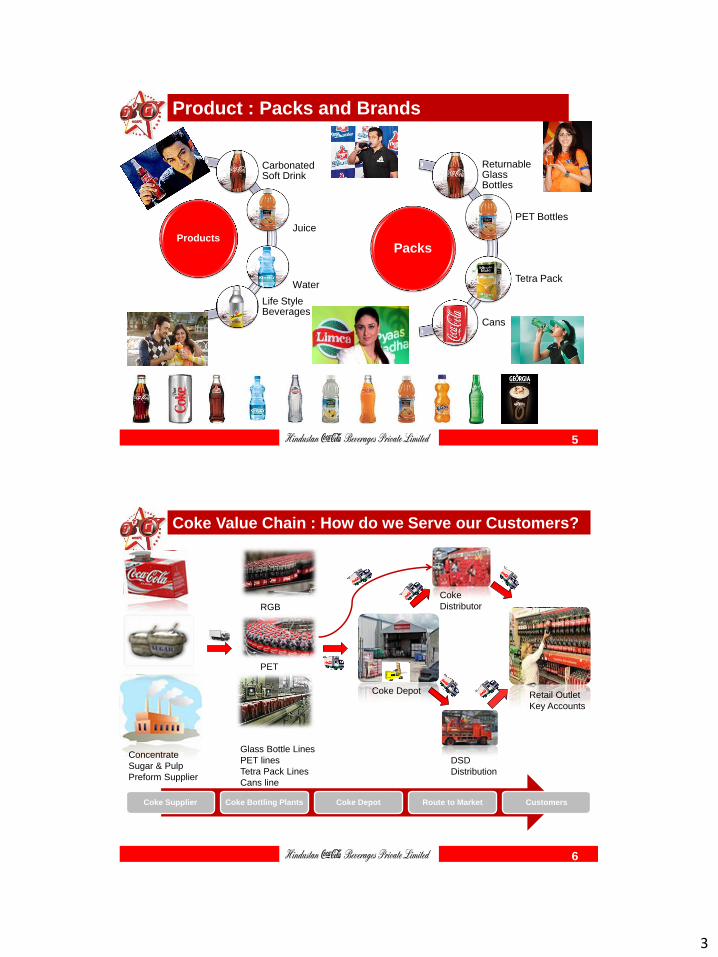
Packs
Returnable Glass Bottles
PET Bottles
Tetra Pack
Cans
Products
Carbonated Soft Drink
Juice
Water
Life Style Beverages
Product : Packs and Brands
5
Concentrate
Sugar & Pulp
Preform Supplier
Coke Depot
Glass Bottle Lines
PET lines
Tetra Pack Lines
Cans line
RGB
PET
Coke
Distributor
DSD
Distribution
Retail Outlet
Key Accounts
Coke Supplier Coke Bottling Plants Coke Depot Route to Market Customers
Coke Value Chain : How do we Serve our Customers?
6
4
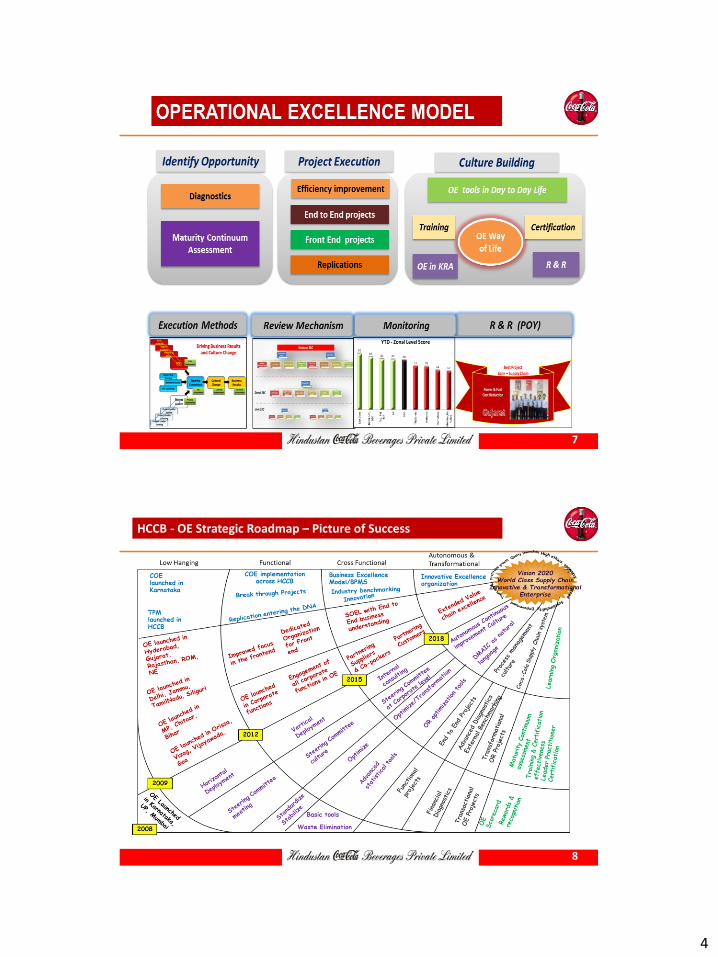
7
HCCB - OE Strategic Roadmap – Picture of Success
8
5
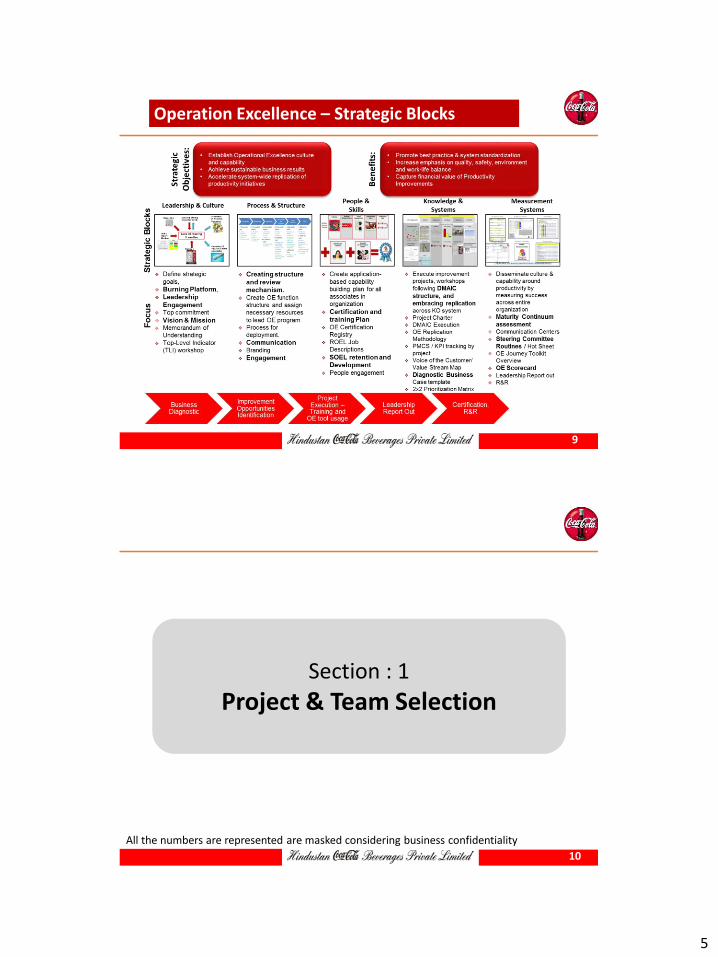
Operation Excellence – Strategic Blocks
9
Section : 1
Project & Team Selection
10
All the numbers are represented are masked considering business confidentiality
6
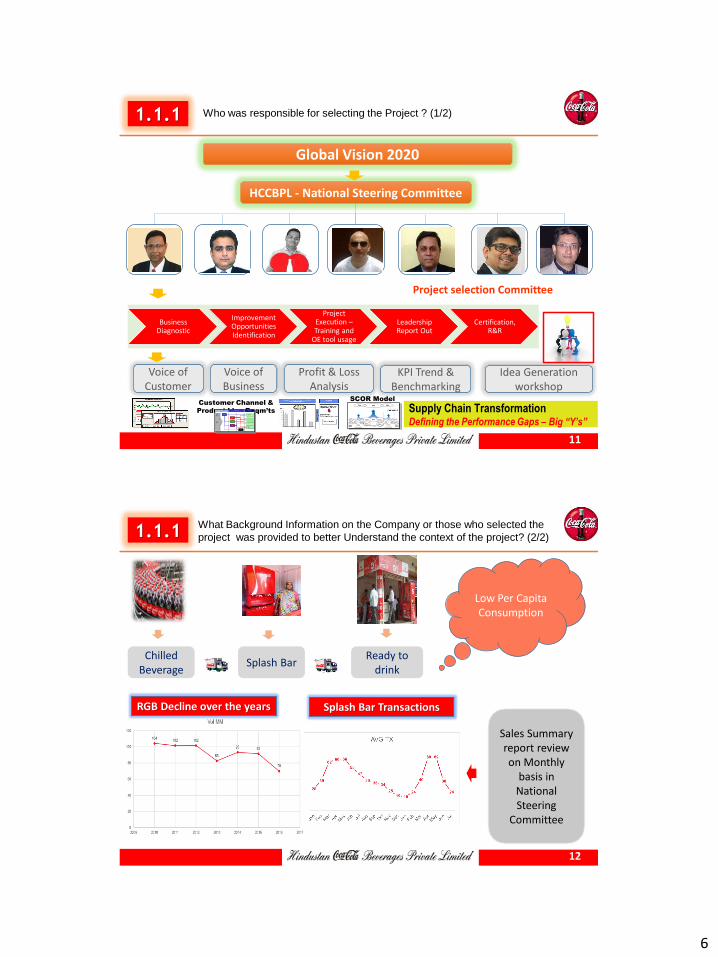
1.1.1 Who was responsible for selecting the Project ? (1/2)
HCCBPL - National Steering Committee
Global Vision 2020
Business Diagnostic
Improvement Opportunities Identification
Project Execution – Training and
OE tool usage
Leadership Report Out
Certification, R&R
Voice of Customer
Voice of Business
Profit & Loss Analysis
KPI Trend & Benchmarking
Project selection Committee
Supply Chain Transformation Defining the Performance Gaps – Big “Y’s”
Idea Generation workshop
SCOR Model
PlanPlan PlanCustomer Channel &
Product Line Reqm’ts ComponentsComponents
Components
Laurel, MS
Components
Laurel, MS
Interior Doors:
Haleyville, AL
Interior Doors:
Haleyville, AL
Specialty:
Brampton, Ont.
Specialty:
Brampton, Ont.
Exterior Doors
Dickson, TN
Exterior Doors
Dickson, TN
DorFab:
Lawrenceville, GA
DorFab:
Lawrenceville, GA
Door GroupDoor GroupSuppliersSuppliers CustomersCustomers
Cohesive Supply Chain View Eliminates Disconnects
Retail• Home Depot
• Lowes
Competitors• ??
• ??
Distribution: 1-Stepper• ??
• ??
Distribution: 2-Stepper• ??
• ??
Internal
Suppliers• ??
• ??
External
Suppliers• ??
• ??
11
1.1.1 What Background Information on the Company or those who selected the
project was provided to better Understand the context of the project? (2/2)
Chilled Beverage
Splash Bar Ready to
drink
Sales Summary report review on Monthly
basis in National Steering
Committee
Low Per Capita Consumption
RGB Decline over the years Splash Bar Transactions
12
7
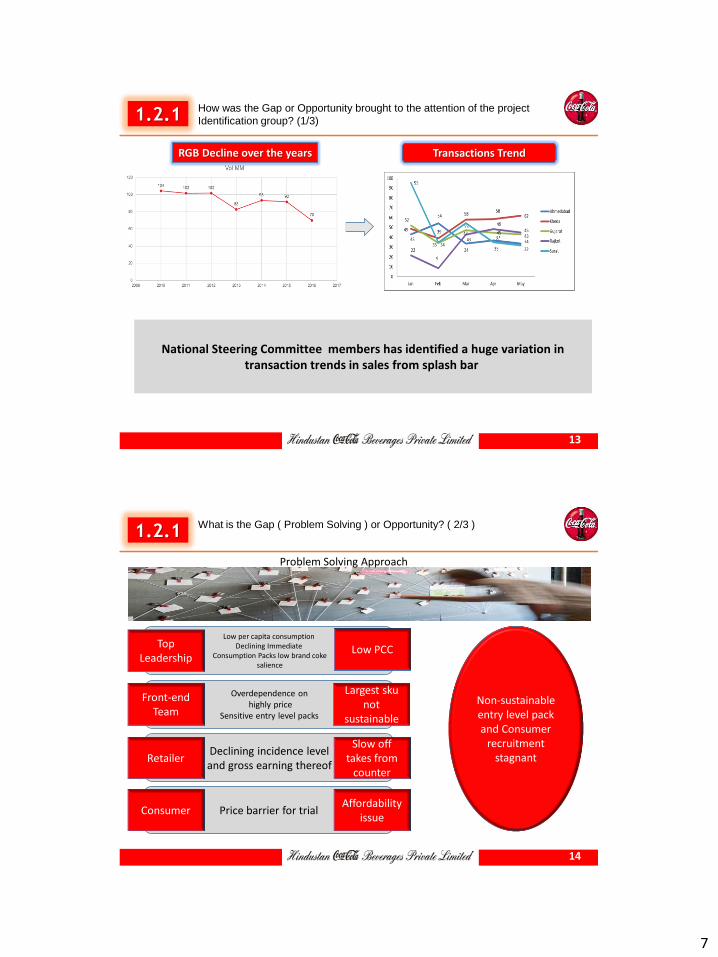
1.2.1 How was the Gap or Opportunity brought to the attention of the project
Identification group? (1/3)
Transactions Trend
National Steering Committee members has identified a huge variation in transaction trends in sales from splash bar
RGB Decline over the years
13
1.2.1 What is the Gap ( Problem Solving ) or Opportunity? ( 2/3 )
Problem Solving Approach
Low per capita consumption Declining Immediate
Consumption Packs low brand coke salience
Overdependence on highly price
Sensitive entry level packs
Declining incidence level and gross earning thereof
Price barrier for trial
Front-end Team
Top Leadership
Low PCC
Largest sku not
sustainable
Slow off takes from
counter Retailer
Affordability issue
Consumer
Non-sustainable entry level pack and Consumer
recruitment stagnant
14
8
1.2.1 What area of the organization had the gap or the opportunity? ( 3/3 )
Business process
Gap Impact
Sales
Distribution
Finance
Commercial
• No Focus on retailer retention
• No dedicated task force for SB
• Limited availability of flavors
• Retailer margin is not communicated properly
• Focus SB outlet visit plan
• No specific scheme for SB
• Availability and handling of SB
Low Per Capita
Consumption
HIGH Impact Medium Impact
Low Impact
H M L
H
H
H
L
M
H
H
H
H
15
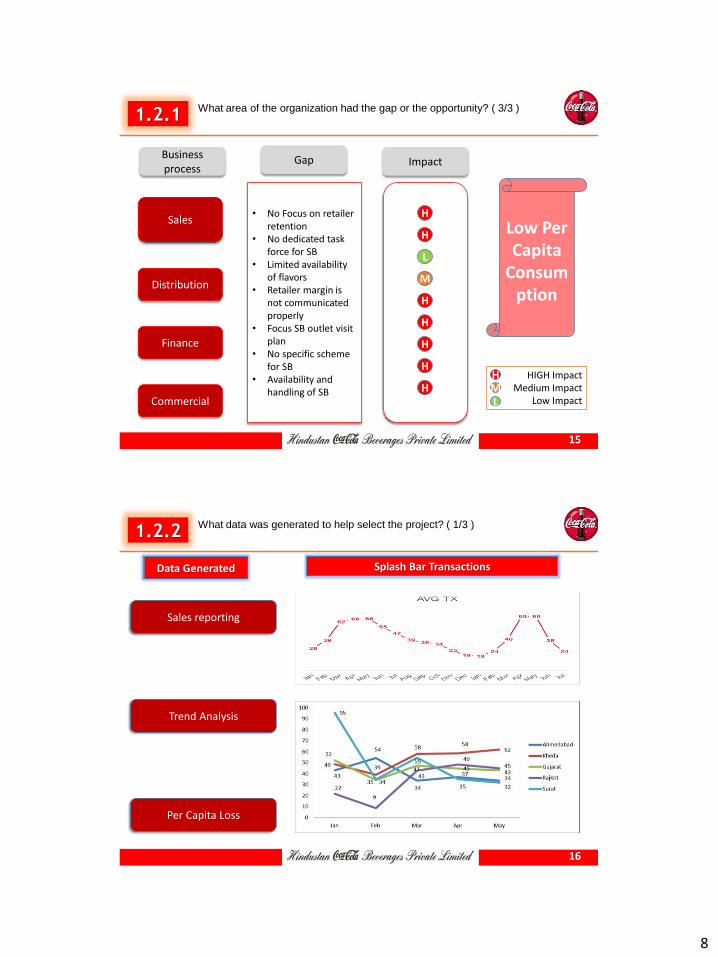
1.2.2 What data was generated to help select the project? ( 1/3 )
Sales reporting
Trend Analysis
Per Capita Loss
Data Generated Splash Bar Transactions
16
9
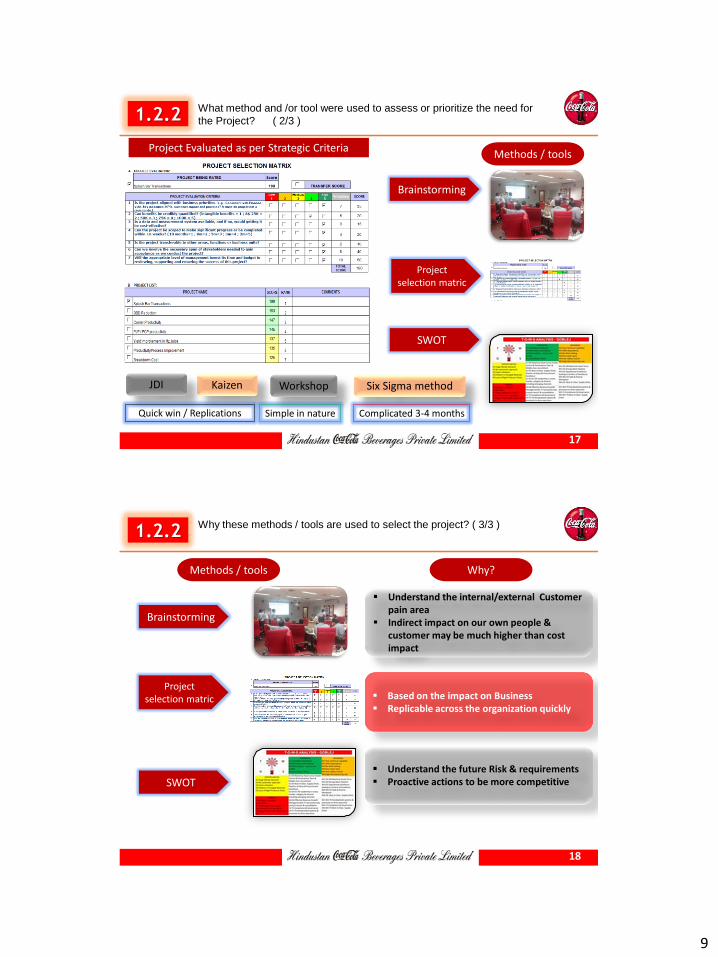
1.2.2 What method and /or tool were used to assess or prioritize the need for
the Project? ( 2/3 )
Kaizen JDI Workshop Six Sigma method
Project Evaluated as per Strategic Criteria Methods / tools
Brainstorming
Project selection matric
SWOT
Quick win / Replications Simple in nature Complicated 3-4 months
17
1.2.2 Why these methods / tools are used to select the project? ( 3/3 )
Methods / tools
Brainstorming
SWOT
Understand the internal/external Customer pain area
Indirect impact on our own people & customer may be much higher than cost impact
Why?
Based on the impact on Business Replicable across the organization quickly
Understand the future Risk & requirements Proactive actions to be more competitive
Project selection matric
18
10
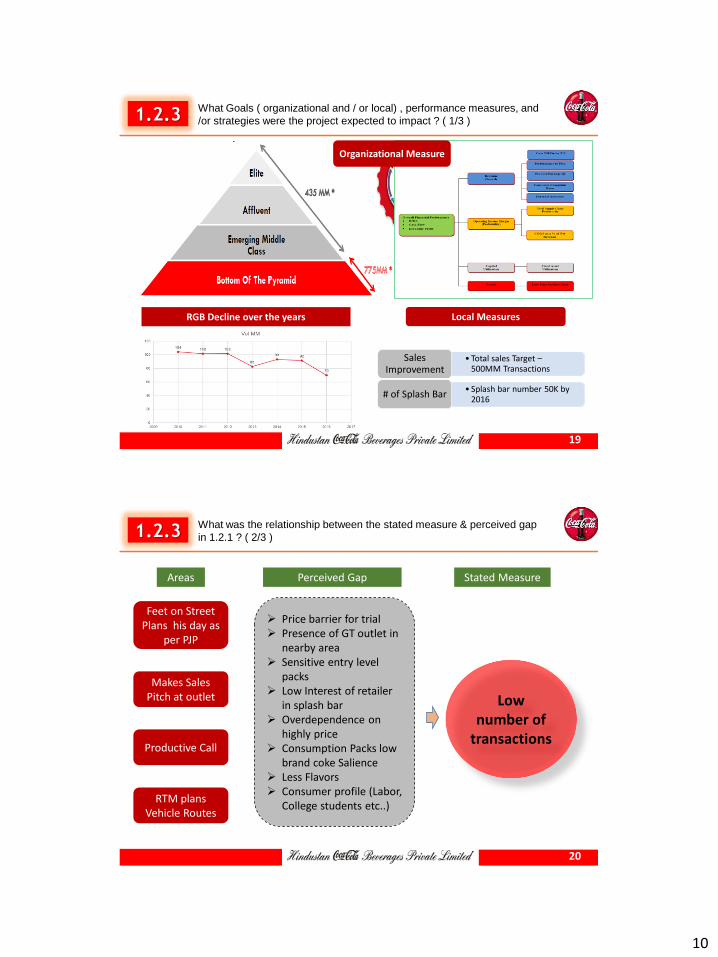
1.2.3 What Goals ( organizational and / or local) , performance measures, and
/or strategies were the project expected to impact ? ( 1/3 )
Organizational Measure
Local Measures
• Total sales Target – 500MM Transactions
Sales Improvement
• Splash bar number 50K by 2016
# of Splash Bar
RGB Decline over the years
19
1.2.3 What was the relationship between the stated measure & perceived gap
in 1.2.1 ? ( 2/3 )
Feet on Street Plans his day as
per PJP
Makes Sales Pitch at outlet
Productive Call
RTM plans Vehicle Routes
Areas Perceived Gap Stated Measure
Low number of
transactions
Price barrier for trial Presence of GT outlet in
nearby area Sensitive entry level
packs Low Interest of retailer
in splash bar Overdependence on
highly price Consumption Packs low
brand coke Salience Less Flavors Consumer profile (Labor,
College students etc..)
20
11
1.2.3 What was the problem / project objective statement that express where
the organization want to be at the end of the project ( 3/3 )
21
1.3.1 How were the stakeholder groups identified? ( 1/2 )
Stakeholder Group
Core Team
Commercial
Sales
OE
CDE
Corporate OE
Capability Developm
ent
Team
OEM
Zonal Leadership
Team
22
12
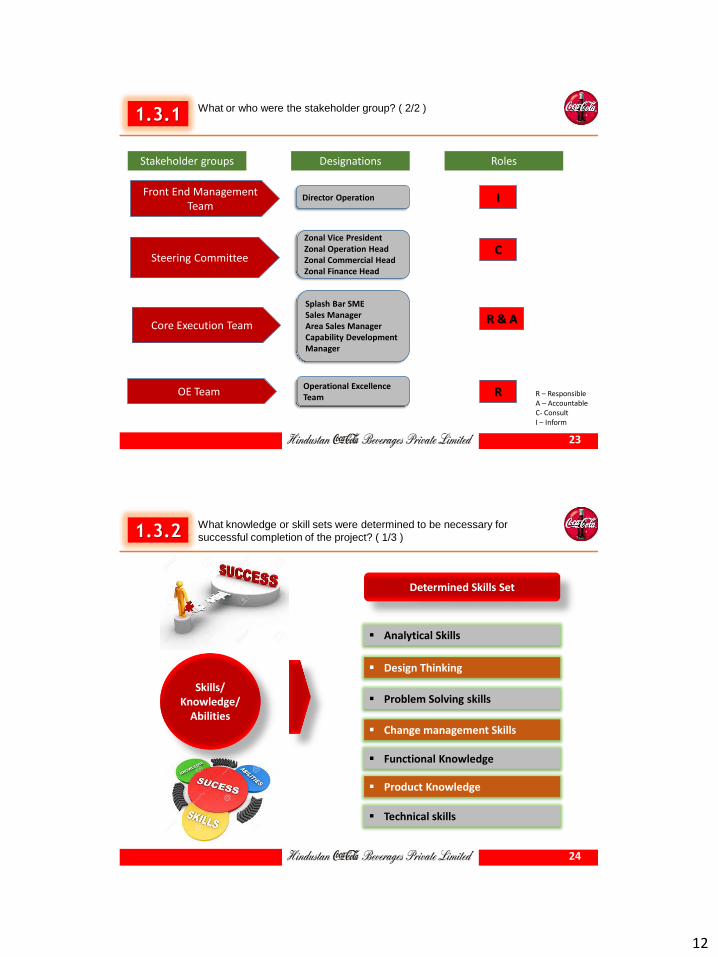
1.3.1 What or who were the stakeholder group? ( 2/2 )
Director Operation Front End Management
Team
Core Execution Team
Steering Committee
Stakeholder groups Designations Roles
Zonal Vice President Zonal Operation Head Zonal Commercial Head Zonal Finance Head
Splash Bar SME Sales Manager Area Sales Manager Capability Development Manager
OE Team Operational Excellence Team
C
R & A
I
R R – Responsible A – Accountable C- Consult I – Inform
23
1.3.2 What knowledge or skill sets were determined to be necessary for
successful completion of the project? ( 1/3 )
Skills/ Knowledge/
Abilities
Determined Skills Set
Analytical Skills
Design Thinking
Problem Solving skills
Change management Skills
Functional Knowledge
Product Knowledge
Technical skills
24
13
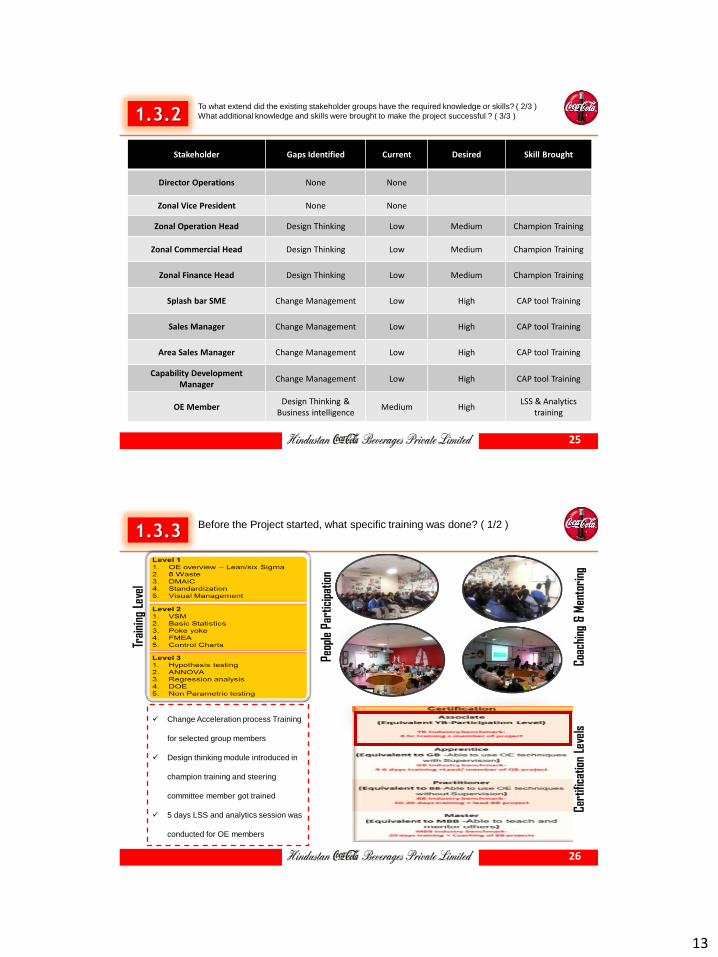
1.3.2 To what extend did the existing stakeholder groups have the required knowledge or skills? ( 2/3 )
What additional knowledge and skills were brought to make the project successful ? ( 3/3 )
Stakeholder Gaps Identified Current Desired Skill Brought
Director Operations None None
Zonal Vice President None None
Zonal Operation Head Design Thinking Low Medium Champion Training
Zonal Commercial Head Design Thinking Low Medium Champion Training
Zonal Finance Head Design Thinking Low Medium Champion Training
Splash bar SME Change Management Low High CAP tool Training
Sales Manager Change Management Low High CAP tool Training
Area Sales Manager Change Management Low High CAP tool Training
Capability Development Manager
Change Management Low High CAP tool Training
OE Member Design Thinking &
Business intelligence Medium High
LSS & Analytics training
25
1.3.3 Before the Project started, what specific training was done? ( 1/2 )
Trai
ning
Lev
el
Peop
le P
artic
ipat
ion
Coac
hing
& M
ento
ring
Ce
rtifi
catio
n Le
vels
Change Acceleration process Training
for selected group members
Design thinking module introduced in
champion training and steering
committee member got trained
5 days LSS and analytics session was
conducted for OE members
26
14
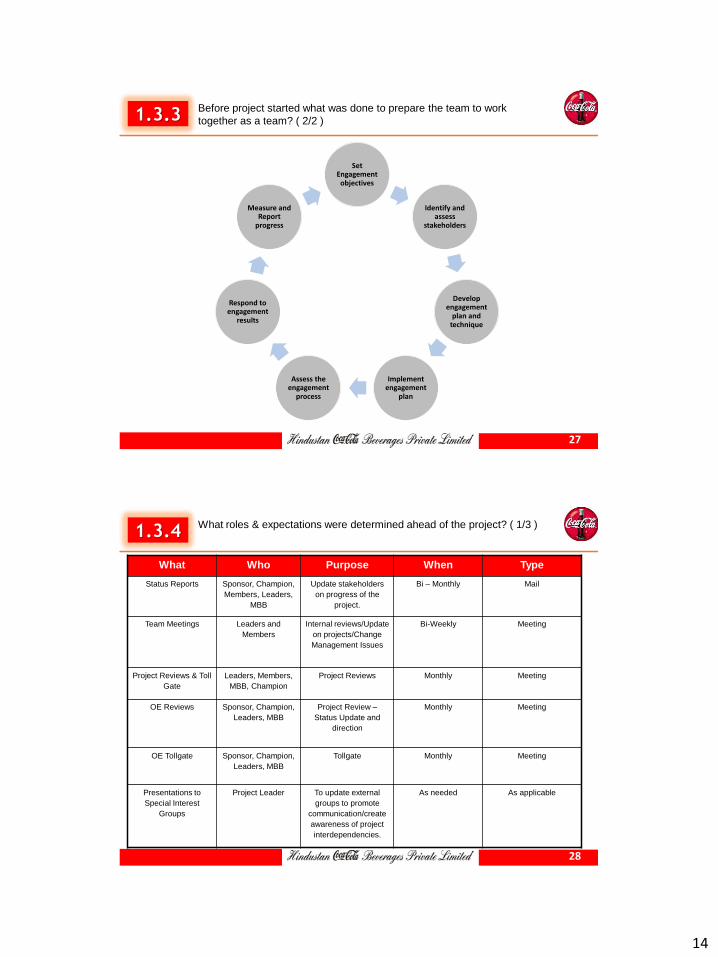
1.3.3 Before project started what was done to prepare the team to work
together as a team? ( 2/2 )
Set Engagement
objectives
Identify and assess
stakeholders
Develop engagement
plan and technique
Implement engagement
plan
Assess the engagement
process
Respond to engagement
results
Measure and Report
progress
27
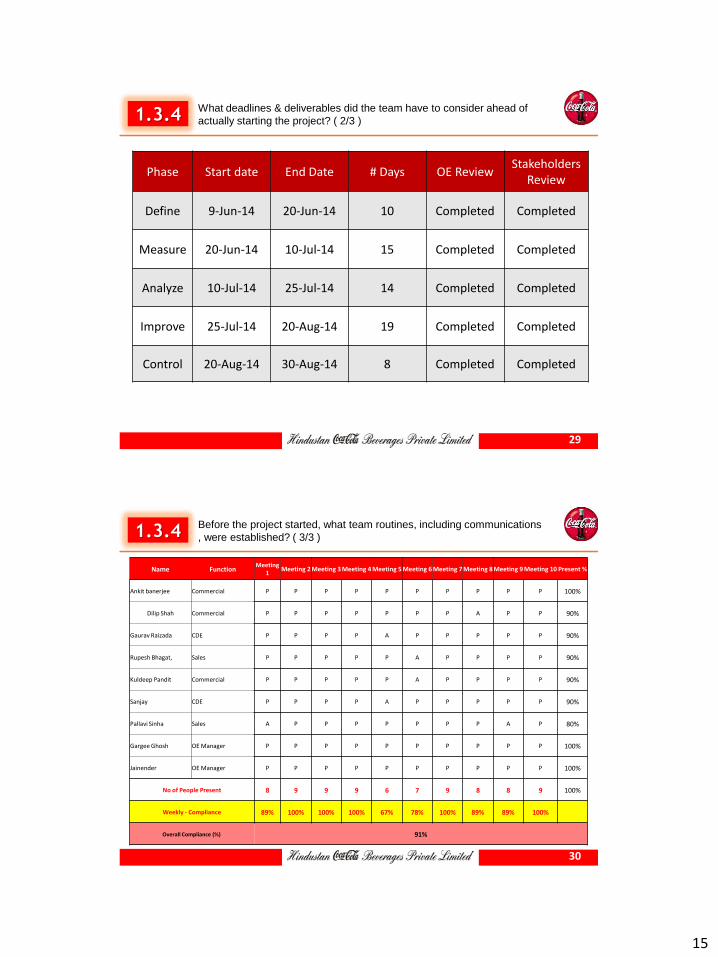
1.3.4 What roles & expectations were determined ahead of the project? ( 1/3 )
What Who Purpose When Type
Status Reports Sponsor, Champion,
Members, Leaders,
MBB
Update stakeholders
on progress of the
project.
Bi – Monthly Mail
Team Meetings Leaders and
Members
Internal reviews/Update
on projects/Change
Management Issues
Bi-Weekly
Meeting
Project Reviews & Toll
Gate
Leaders, Members,
MBB, Champion
Project Reviews Monthly Meeting
OE Reviews Sponsor, Champion,
Leaders, MBB
Project Review –
Status Update and
direction
Monthly Meeting
OE Tollgate Sponsor, Champion,
Leaders, MBB
Tollgate Monthly Meeting
Presentations to
Special Interest
Groups
Project Leader To update external
groups to promote
communication/create
awareness of project
interdependencies.
As needed As applicable
28
15
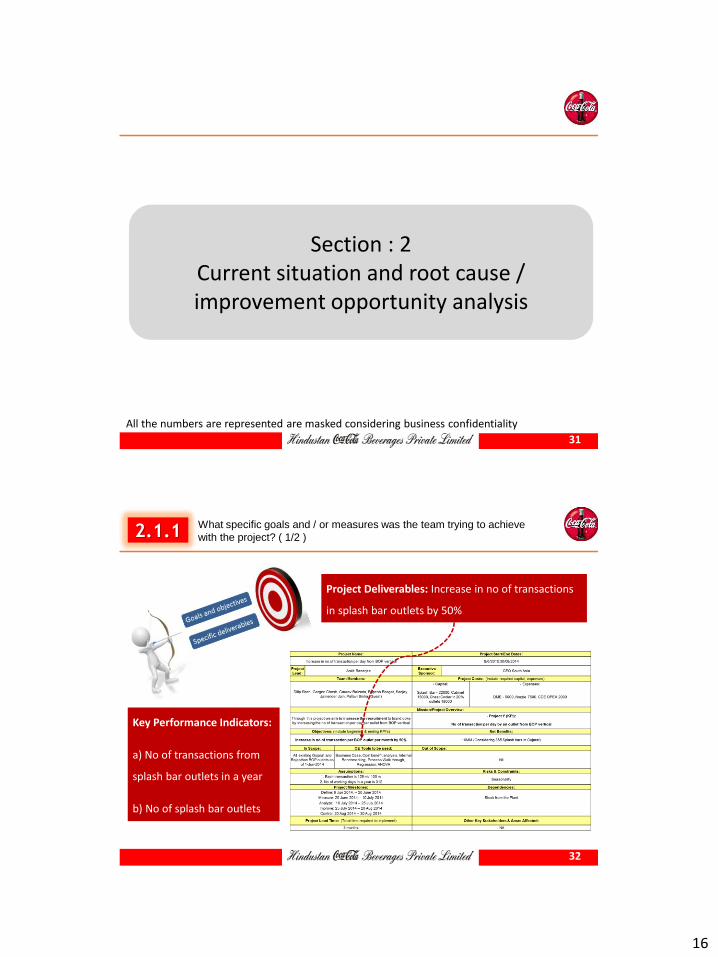
1.3.4 What deadlines & deliverables did the team have to consider ahead of
actually starting the project? ( 2/3 )
Phase Start date End Date # Days OE Review Stakeholders
Review
Define 9-Jun-14 20-Jun-14 10 Completed Completed
Measure 20-Jun-14 10-Jul-14 15 Completed Completed
Analyze 10-Jul-14 25-Jul-14 14 Completed Completed
Improve 25-Jul-14 20-Aug-14 19 Completed Completed
Control 20-Aug-14 30-Aug-14 8 Completed Completed
29
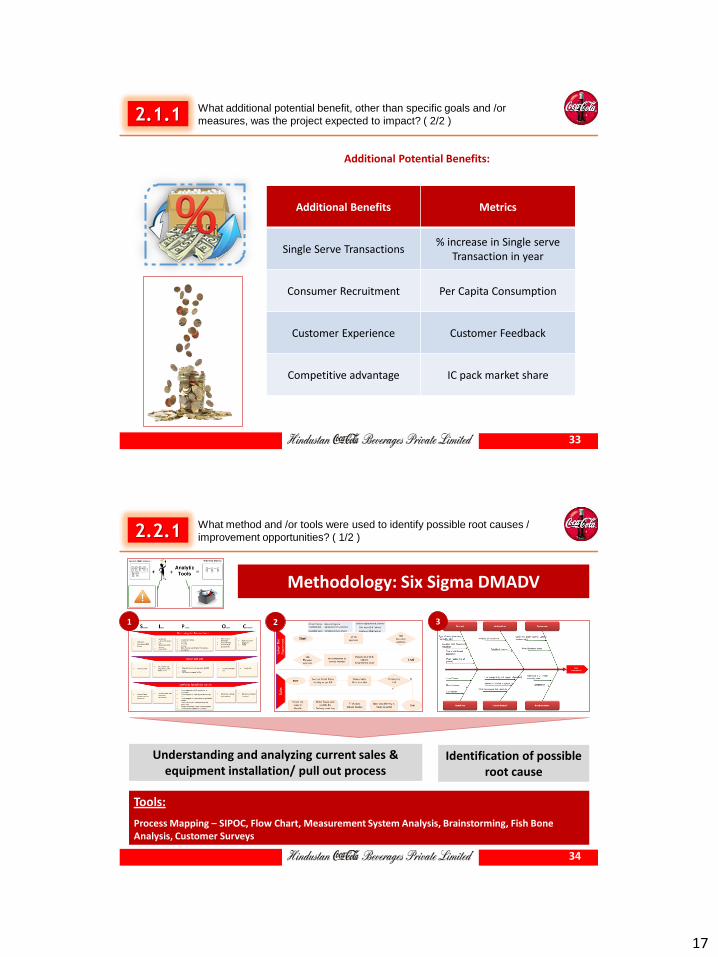
1.3.4 Before the project started, what team routines, including communications
, were established? ( 3/3 )
Name Function Meeting
1 Meeting 2 Meeting 3 Meeting 4 Meeting 5 Meeting 6 Meeting 7 Meeting 8 Meeting 9 Meeting 10 Present %
Ankit banerjee Commercial P P P P P P P P P P 100%
Dilip Shah Commercial P P P P P P P A P P 90%
Gaurav Raizada CDE P P P P A P P P P P 90%
Rupesh Bhagat, Sales P P P P P A P P P P 90%
Kuldeep Pandit Commercial P P P P P A P P P P 90%
Sanjay CDE P P P P A P P P P P 90%
Pallavi Sinha Sales A P P P P P P P A P 80%
Gargee Ghosh OE Manager P P P P P P P P P P 100%
Jainender OE Manager P P P P P P P P P P 100%
No of People Present 8 9 9 9 6 7 9 8 8 9 100%
Weekly - Compliance 89% 100% 100% 100% 67% 78% 100% 89% 89% 100%
Overall Compliance (%) 91%
30
16
Section : 2 Current situation and root cause / improvement opportunity analysis
31
All the numbers are represented are masked considering business confidentiality
2.1.1 What specific goals and / or measures was the team trying to achieve
with the project? ( 1/2 )
Project Deliverables: Increase in no of transactions
in splash bar outlets by 50%
Key Performance Indicators:
a) No of transactions from
splash bar outlets in a year
b) No of splash bar outlets
32
17
2.1.1 What additional potential benefit, other than specific goals and /or
measures, was the project expected to impact? ( 2/2 )
Additional Potential Benefits:
Additional Benefits Metrics
Single Serve Transactions % increase in Single serve
Transaction in year
Consumer Recruitment Per Capita Consumption
Customer Experience Customer Feedback
Competitive advantage IC pack market share
33
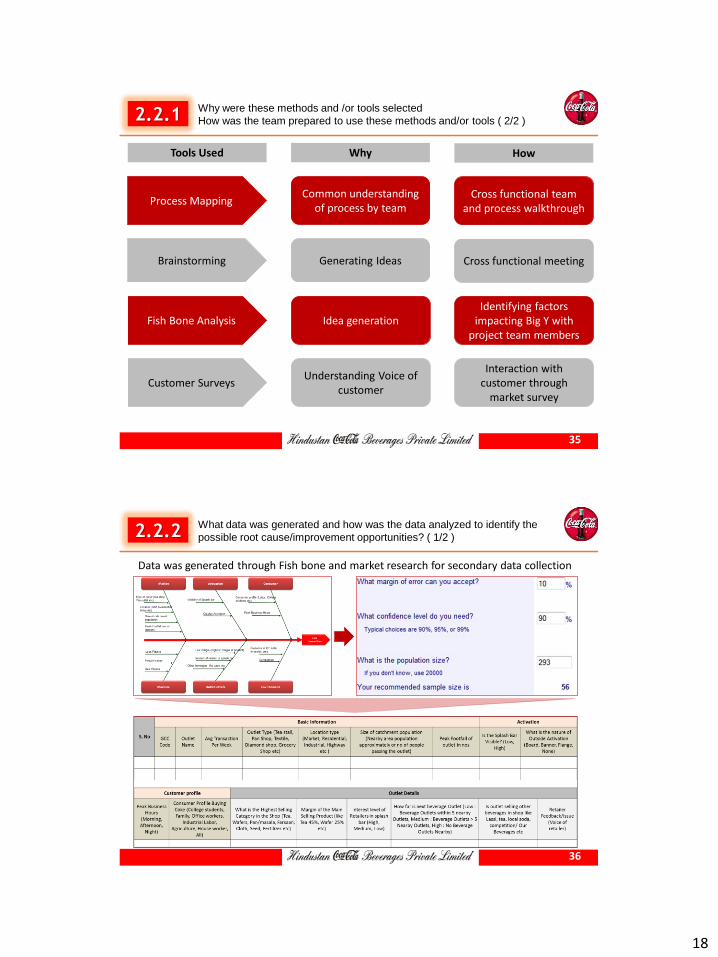
Tools:
Process Mapping – SIPOC, Flow Chart, Measurement System Analysis, Brainstorming, Fish Bone Analysis, Customer Surveys
2.2.1 What method and /or tools were used to identify possible root causes /
improvement opportunities? ( 1/2 )
Methodology: Six Sigma DMADV
1 2 3
Understanding and analyzing current sales & equipment installation/ pull out process
Identification of possible root cause
34
18
2.2.1 Why were these methods and /or tools selected
How was the team prepared to use these methods and/or tools ( 2/2 )
Tools Used Why How
Process Mapping Common understanding
of process by team Cross functional team
and process walkthrough
Brainstorming Generating Ideas Cross functional meeting
Fish Bone Analysis Idea generation Identifying factors
impacting Big Y with project team members
Customer Surveys Understanding Voice of
customer
Interaction with customer through
market survey
35
2.2.2 What data was generated and how was the data analyzed to identify the
possible root cause/improvement opportunities? ( 1/2 )
Data was generated through Fish bone and market research for secondary data collection
36
19
2.2.2 What were possible root cause/improvement opportunities? ( 2/2 )
S. N Root Cause
1 Low RED
2 Retailer interest
3 PJP / PCP frequency for splash bar outlet
4 Activation of outlets
5 Consumer preference of brand
6 Temporary closed
7 Factors within channel impacting transaction
8 Wrong PJP
9 Poor Visibility
10 Consumer profile
11 GT Product Presence
12 Stock availability
13 Cup availability
14 Pull Out & Right Sizing
15 Sub reasons within Pop strata
16 Channel split of splash bar out
17 Activation status of all splash bar outlet
18 Pop Strata impact on transaction
19 Sales Awareness /compliance
20 Product Stock Out
Classification of X’s
Geographical / population related
Process / Policy Related
Product & Channel
Equipment
Market Visibility
Consumer Related
All identified reasons are classified in broad 6 categories
37
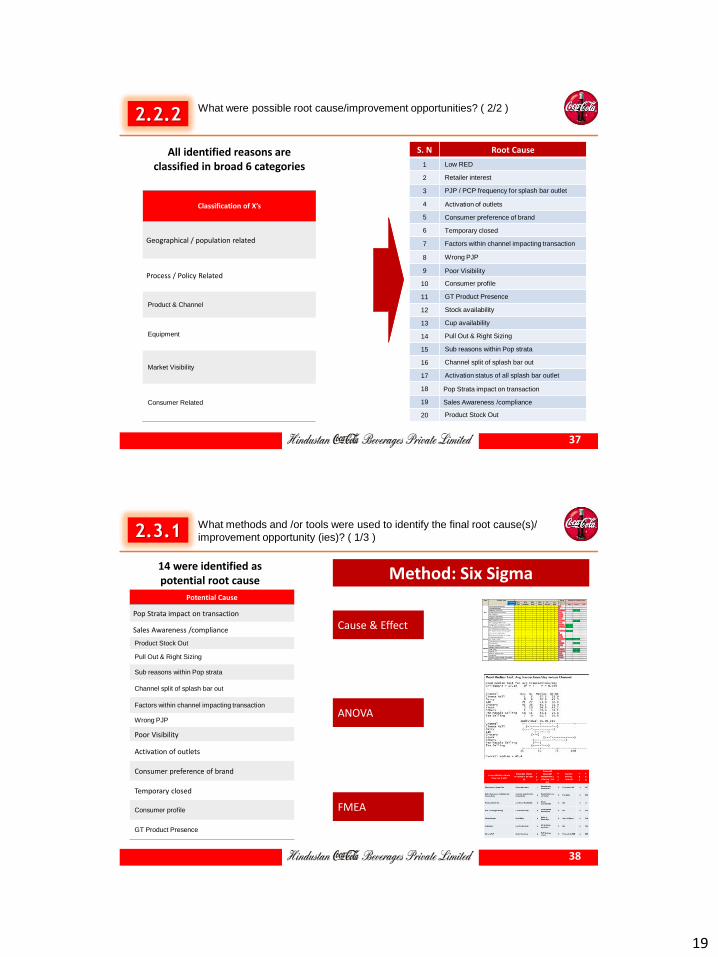
2.3.1 What methods and /or tools were used to identify the final root cause(s)/
improvement opportunity (ies)? ( 1/3 )
Potential Cause
Pop Strata impact on transaction
Sales Awareness /compliance
Product Stock Out
Pull Out & Right Sizing
Sub reasons within Pop strata
Channel split of splash bar out
Factors within channel impacting transaction
Wrong PJP
Poor Visibility
Activation of outlets
Consumer preference of brand
Temporary closed
Consumer profile
GT Product Presence
14 were identified as potential root cause Method: Six Sigma
Cause & Effect
ANOVA
FMEA
38
20
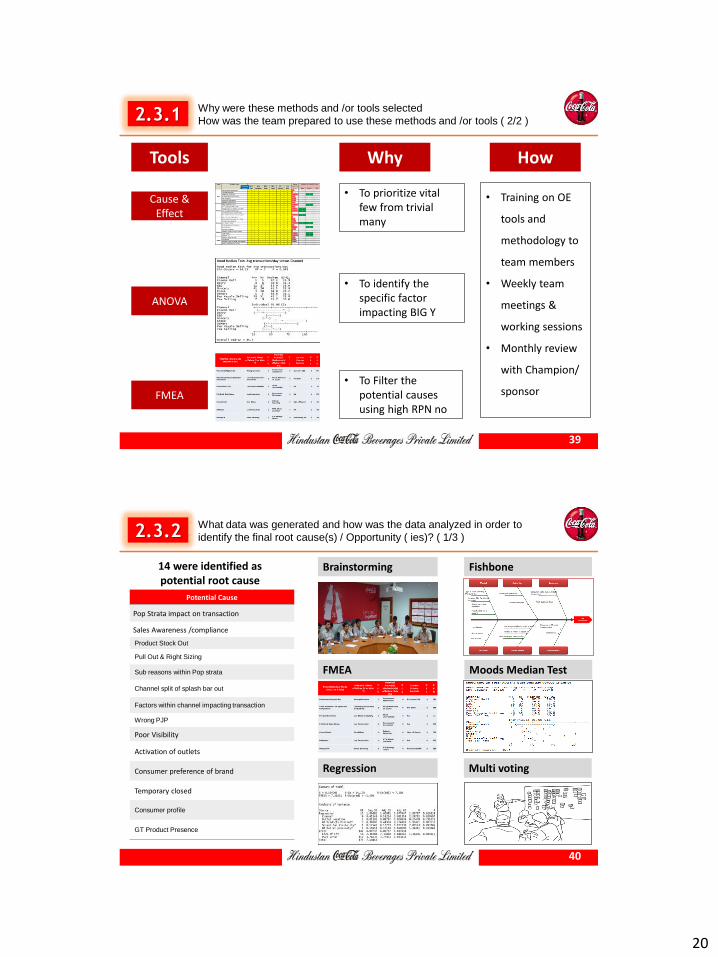
2.3.1 Why were these methods and /or tools selected
How was the team prepared to use these methods and /or tools ( 2/2 )
Tools
Cause & Effect
ANOVA
FMEA
Why How
• To prioritize vital few from trivial many
• Training on OE
tools and
methodology to
team members
• Weekly team
meetings &
working sessions
• Monthly review
with Champion/
sponsor
• To identify the specific factor impacting BIG Y
• To Filter the potential causes using high RPN no
39
2.3.2 What data was generated and how was the data analyzed in order to
identify the final root cause(s) / Opportunity ( ies)? ( 1/3 )
Potential Cause
Pop Strata impact on transaction
Sales Awareness /compliance
Product Stock Out
Pull Out & Right Sizing
Sub reasons within Pop strata
Channel split of splash bar out
Factors within channel impacting transaction
Wrong PJP
Poor Visibility
Activation of outlets
Consumer preference of brand
Temporary closed
Consumer profile
GT Product Presence
14 were identified as potential root cause
Brainstorming Fishbone
FMEA Moods Median Test
Regression Multi voting
40
21
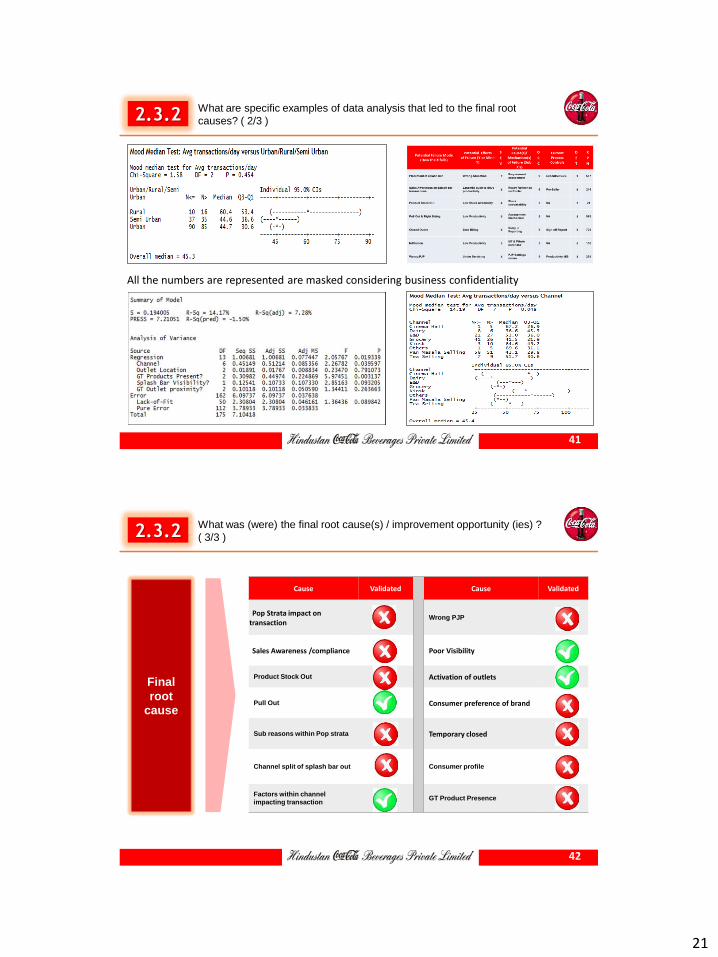
2.3.2 What are specific examples of data analysis that led to the final root
causes? ( 2/3 )
All the numbers are represented are masked considering business confidentiality
41
2.3.2 What was (were) the final root cause(s) / improvement opportunity (ies) ?
( 3/3 )
Cause Validated Cause Validated
Pop Strata impact on transaction
Wrong PJP
Sales Awareness /compliance Poor Visibility
Product Stock Out Activation of outlets
Pull Out Consumer preference of brand
Sub reasons within Pop strata Temporary closed
Channel split of splash bar out Consumer profile
Factors within channel
impacting transaction GT Product Presence
Final
root
cause
42
22
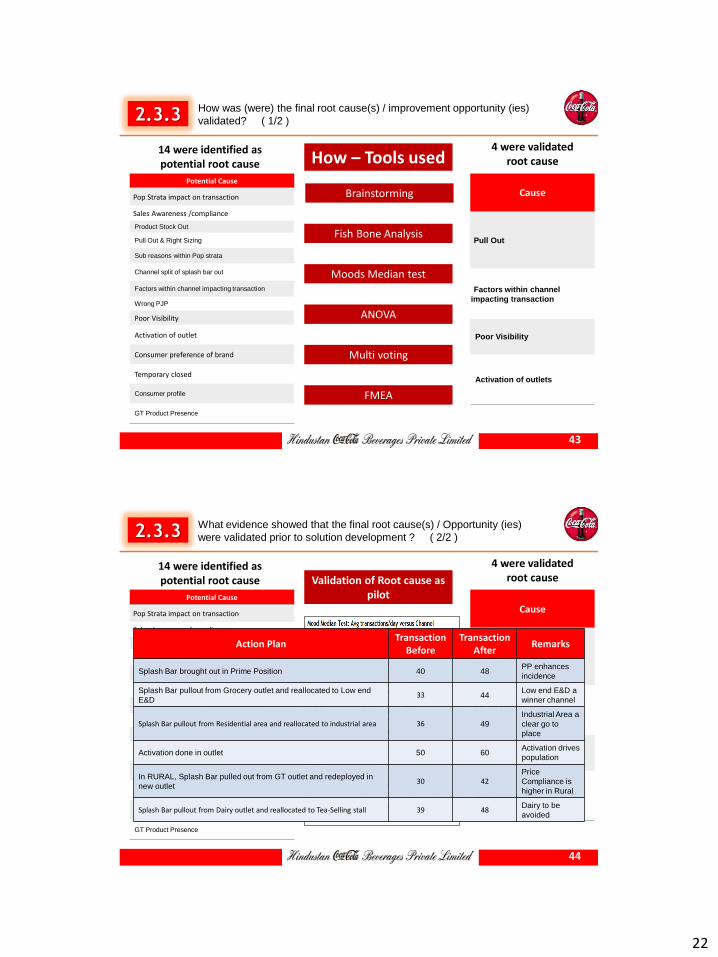
2.3.3 How was (were) the final root cause(s) / improvement opportunity (ies)
validated? ( 1/2 )
Potential Cause
Pop Strata impact on transaction
Sales Awareness /compliance
Product Stock Out
Pull Out & Right Sizing
Sub reasons within Pop strata
Channel split of splash bar out
Factors within channel impacting transaction
Wrong PJP
Poor Visibility
Activation of outlet
Consumer preference of brand
Temporary closed
Consumer profile
GT Product Presence
14 were identified as potential root cause How – Tools used
Moods Median test
ANOVA
FMEA
Cause
Pull Out
Factors within channel
impacting transaction
Poor Visibility
Activation of outlets
4 were validated root cause
Brainstorming
Multi voting
Fish Bone Analysis
43
2.3.3 What evidence showed that the final root cause(s) / Opportunity (ies)
were validated prior to solution development ? ( 2/2 )
Potential Cause
Pop Strata impact on transaction
Sales Awareness /compliance
Product Stock Out
Pull Out & Right Sizing
Sub reasons within Pop strata
Channel split of splash bar out
Factors within channel impacting transaction
Wrong PJP
Poor Visibility
Activation of outlets
Consumer preference of brand
Temporary closed
Consumer profile
GT Product Presence
14 were identified as potential root cause Validation of Root cause as
pilot
4 were validated root cause
Cause
Pull Out
Factors within channel
impacting transaction
Poor Visibility
Activation of outlets
Action Plan Transaction
Before Transaction
After Remarks
Splash Bar brought out in Prime Position 40 48 PP enhances
incidence
Splash Bar pullout from Grocery outlet and reallocated to Low end
E&D 33 44
Low end E&D a
winner channel
Splash Bar pullout from Residential area and reallocated to industrial area 36 49
Industrial Area a
clear go to
place
Activation done in outlet 50 60 Activation drives
population
In RURAL, Splash Bar pulled out from GT outlet and redeployed in
new outlet 30 42
Price
Compliance is
higher in Rural
Splash Bar pullout from Dairy outlet and reallocated to Tea-Selling stall 39 48 Dairy to be
avoided
44
23
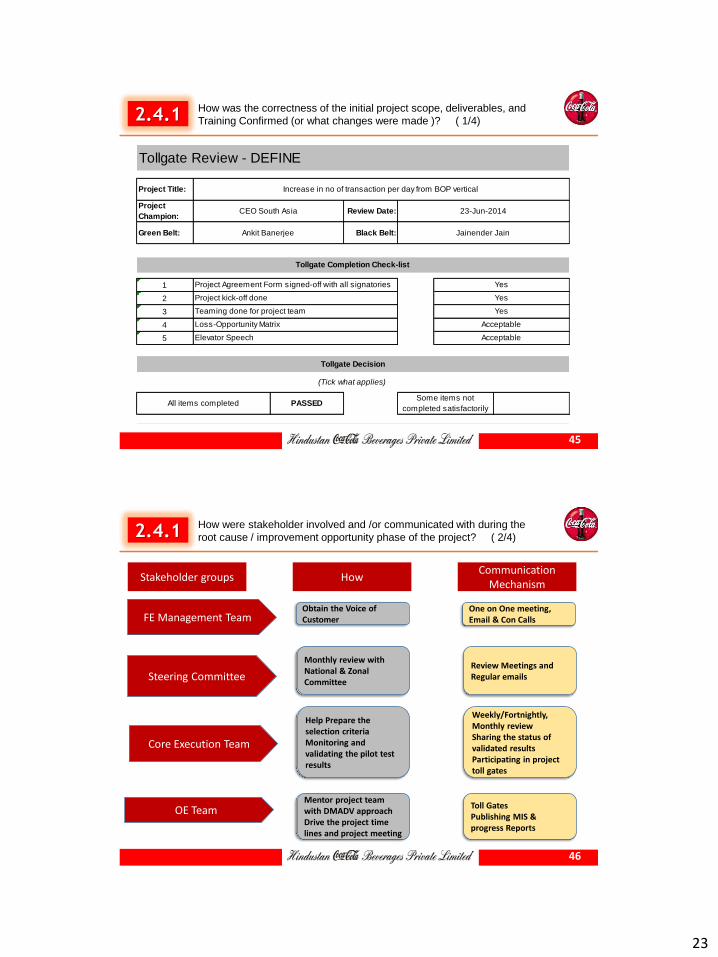
2.4.1 How was the correctness of the initial project scope, deliverables, and
Training Confirmed (or what changes were made )? ( 1/4)
Project Title:
Project
Champion:Review Date:
Green Belt: Black Belt:
1
2
3
4
5
PASSED
Tollgate Decision
All items completed
(Tick what applies)
Some items not
completed satisfactorily
Yes
Tollgate Completion Check-list
Loss-Opportunity Matrix
Elevator Speech Acceptable
Acceptable
Project Agreement Form signed-off with all signatories Yes
Teaming done for project team Yes
Project kick-off done
Ankit Banerjee Jainender Jain
Tollgate Review - DEFINE
Increase in no of transaction per day from BOP vertical
CEO South Asia 23-Jun-2014
45
2.4.1 How were stakeholder involved and /or communicated with during the
root cause / improvement opportunity phase of the project? ( 2/4)
Obtain the Voice of Customer FE Management Team
Core Execution Team
Steering Committee
Stakeholder groups How
Monthly review with National & Zonal Committee
Help Prepare the selection criteria Monitoring and validating the pilot test results
OE Team Mentor project team with DMADV approach Drive the project time lines and project meeting
One on One meeting, Email & Con Calls
Communication Mechanism
Review Meetings and Regular emails
Weekly/Fortnightly, Monthly review Sharing the status of validated results Participating in project toll gates
Toll Gates Publishing MIS & progress Reports
46
24
2.4.1
01
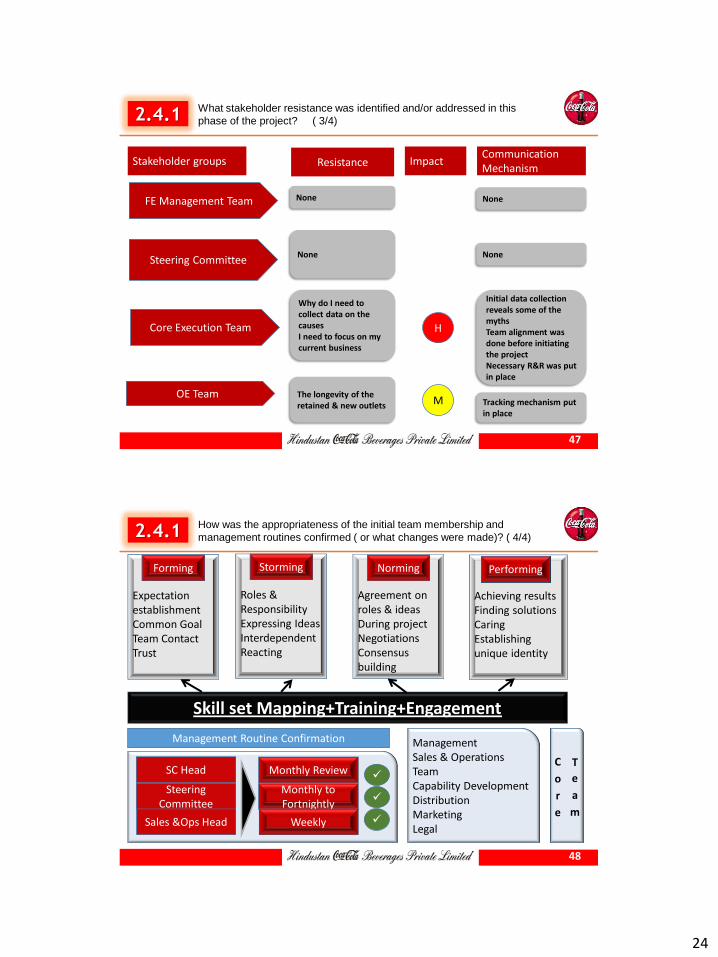
What stakeholder resistance was identified and/or addressed in this
phase of the project? ( 3/4)
None FE Management Team
Core Execution Team
Steering Committee
Stakeholder groups Resistance
None
Why do I need to collect data on the causes I need to focus on my current business
OE Team The longevity of the retained & new outlets
Impact
H
M
None
None
Initial data collection reveals some of the myths Team alignment was done before initiating the project Necessary R&R was put in place
Tracking mechanism put in place
Communication Mechanism
47
2.4.1 How was the appropriateness of the initial team membership and
management routines confirmed ( or what changes were made)? ( 4/4)
Expectation establishment Common Goal Team Contact Trust
Achieving results Finding solutions Caring Establishing unique identity
Agreement on roles & ideas During project Negotiations Consensus building
Roles & Responsibility Expressing Ideas Interdependent Reacting
Skill set Mapping+Training+Engagement
Forming Performing Norming Storming
Management Sales & Operations Team Capability Development Distribution Marketing Legal
C
o
r
e
T
e
a
m
Management Routine Confirmation
SC Head
Steering Committee
Sales &Ops Head
Monthly Review
Monthly to Fortnightly
Weekly
48
25
Section : 3 Solution / Improvement Development
49
All the numbers are represented are masked considering business confidentiality
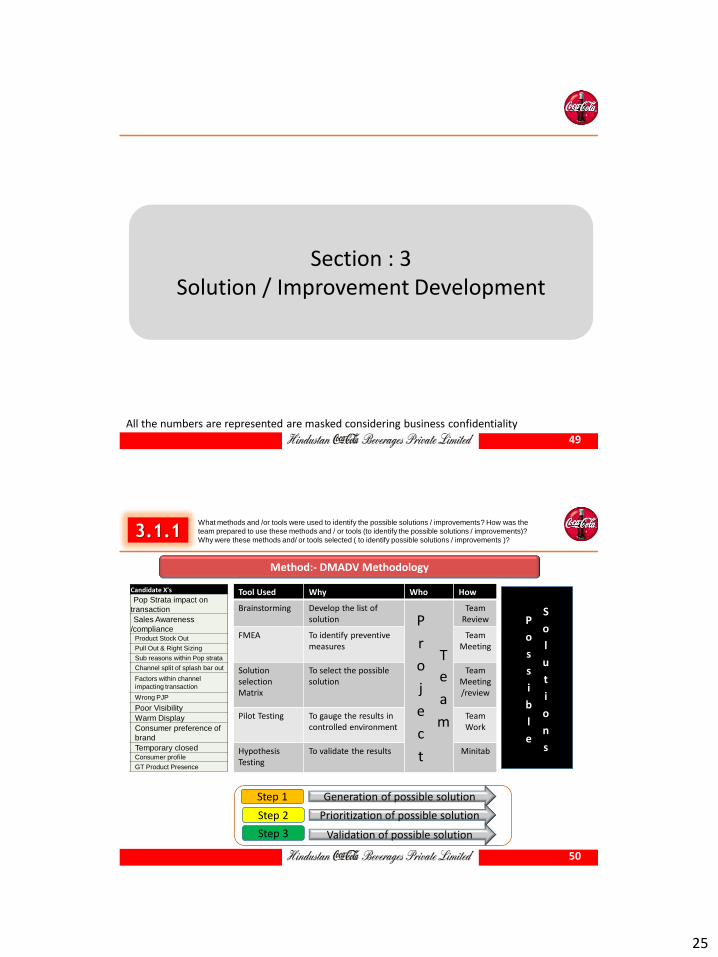
3.1.1 What methods and /or tools were used to identify the possible solutions / improvements? How was the
team prepared to use these methods and / or tools (to identify the possible solutions / improvements)?
Why were these methods and/ or tools selected ( to identify possible solutions / improvements )?
Method:- DMADV Methodology
Candidate X's
Pop Strata impact on
transaction
Sales Awareness
/compliance Product Stock Out
Pull Out & Right Sizing
Sub reasons within Pop strata
Channel split of splash bar out
Factors within channel
impacting transaction
Wrong PJP
Poor Visibility
Warm Display
Consumer preference of
brand
Temporary closed Consumer profile
GT Product Presence
Tool Used Why Who How
Brainstorming Develop the list of solution P
r
o
j
e
c
t
T
e
a
m
Team Review
FMEA To identify preventive measures
Team Meeting
Solution selection Matrix
To select the possible solution
Team Meeting/review
Pilot Testing To gauge the results in controlled environment
Team Work
Hypothesis Testing
To validate the results Minitab
P
o
s
s
i
b
l
e
S
o
l
u
t
i
o
n
s
Step 1
Step 2
Step 3
Generation of possible solution
Prioritization of possible solution
Validation of possible solution
50
26
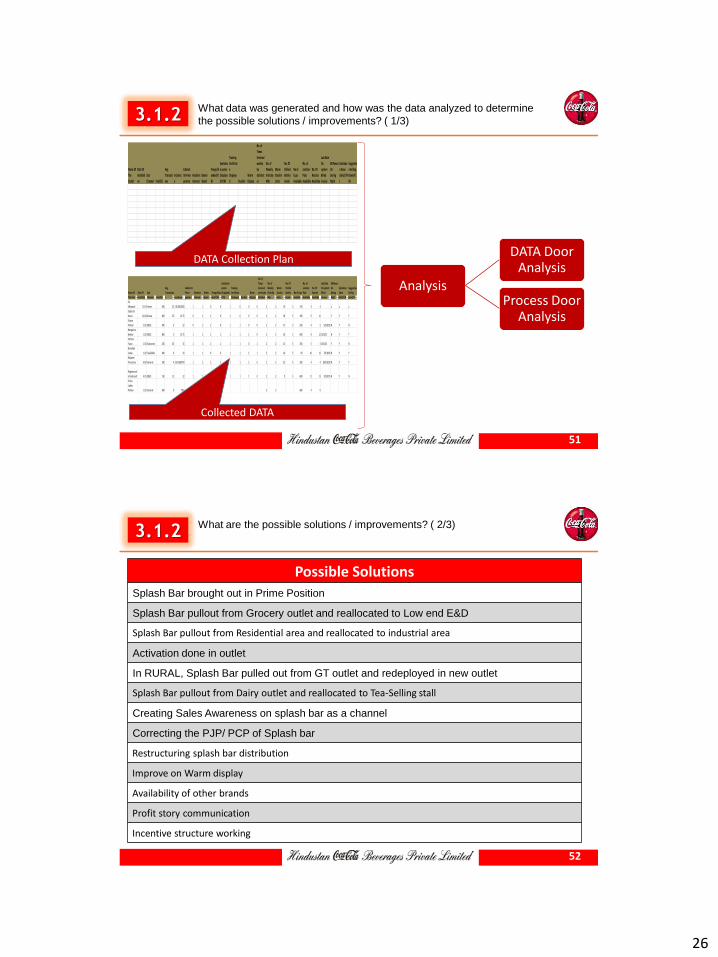
3.1.2 What data was generated and how was the data analyzed to determine
the possible solutions / improvements? ( 1/3)
Name Of
The
Outlet
Date Of
Installati
on
Sub
Channel Footfall
Avg
Transacti
ons
Incidenc
e
Cabinet
In Prime
postion
Retailers
Interest
Dealer
Board
Flange/St
andee(Y/
N)
Sanitatio
n poster
Displaye
d(Y/N)
Training
Certificat
e
Displaye
d Dustbin
Warm
Display
No. of
Times
Serviced
weekly
by
distribut
or
No. of
Weekly
Visits By
Mds
Warm
Stock In
Units
No. Of
Chilled
Bottles
Inside
No of
Cups
Available
No. of
sanitizer
Pack
Available
No. Of
Nozzles
Available
Last Date
On
system
Billed
invoice
SB Power
On
During
Night
Sanitatio
n Done
daily(Y/N
)
Suggestiv
e Selling
Done(Y/
N)
Name Of
The Outlet
Date Of
Installation
Sub
Channel Footfall
Avg
Transaction
s Incidence
Cabinet In
Prime
postion
Retailers
Interest
Dealer
Board
Flange/Stan
dee(Y/N)
Sanitation
poster
Displayed(
Y/N)
Training
Certificate
Displayed Dustbin
Warm
Display
No. of
Times
Serviced
weekly by
distributor
No. of
Weekly
Visits By
Mds
Warm
Stock In
Units
No. Of
Chilled
Bottles
Inside
No of Cups
Available
No. of
sanitizer
Pack
Available
No. Of
Nozzles
Available
Last Date
On system
Billed
invoice
SB Power
On
During
Night
Sanitation
Done
daily(Y/N)
Suggestive
Selling
Done(Y/N)
Sk
Mirjawali 12/14 Home 300 2.5 18.33333333 1 1 0 0 1 0 0 0 2 2 19 5 150 4 4 y y y
Satya Sai
Xerox 12/14 Kirana 400 2.5 13.75 0 1 1 0 1 0 0 0 2 2 18 5 100 9 11 Y Y Y
Vijaya
Parlour 2/15 E&D1 300 3 22 0 1 1 0 1 1 0 0 2 2 17 5 350 4 5 5/5/2015 N Y N
Bengaluru
Bakery 1/15 E&D1 800 5 13.75 1 1 1 1 1 1 1 0 2 2 16 5 600 8 12 13/5/15 N Y Y
Nellore
Fancy 1/15 Stationery 250 3.5 15 1 1 1 1 1 1 0 1 2 2 15 5 350 5 4 13/5/15 Y Y N
Bismillah
Cakes 1/15 Tea/E&D1 400 6 33 1 1 0 0 1 1 1 1 2 2 16 5 50 10 13 7/5/2015 N Y Y
Rajlaxmi
Provisions 8/14 General 350 4 25.14285714 1 1 1 1 1 1 1 0 2 2 32 5 350 4 4 10/5/2015 N Y Y
Raghavendr
a Foodcourt 4/15 E&D1 150 1.5 22 1 1 1 0 1 1 1 0 2 2 9 5 600 11 13 7/5/2015 N Y N
Vishu
Ladies
Parlour 1/15 General 500 9 39.6 3 3 600 4 6
DATA Collection Plan
Collected DATA
Analysis
DATA Door Analysis
Process Door Analysis
51
3.1.2 What are the possible solutions / improvements? ( 2/3)
Possible Solutions
Splash Bar brought out in Prime Position
Splash Bar pullout from Grocery outlet and reallocated to Low end E&D
Splash Bar pullout from Residential area and reallocated to industrial area
Activation done in outlet
In RURAL, Splash Bar pulled out from GT outlet and redeployed in new outlet
Splash Bar pullout from Dairy outlet and reallocated to Tea-Selling stall
Creating Sales Awareness on splash bar as a channel
Correcting the PJP/ PCP of Splash bar
Restructuring splash bar distribution
Improve on Warm display
Availability of other brands
Profit story communication
Incentive structure working
52
27
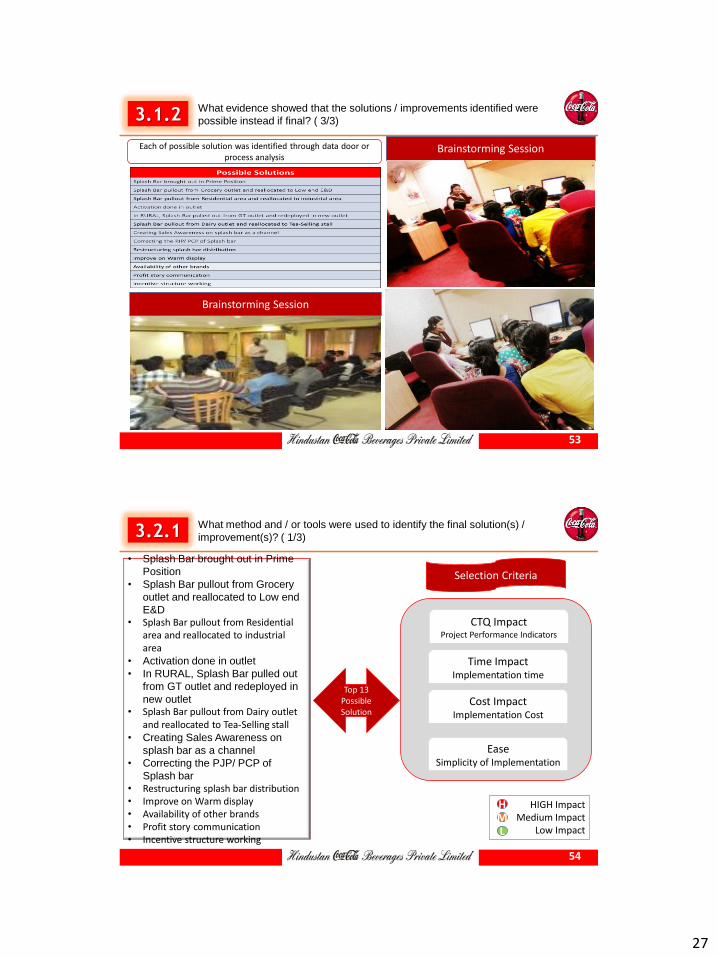
3.1.2 What evidence showed that the solutions / improvements identified were
possible instead if final? ( 3/3)
Each of possible solution was identified through data door or process analysis
Brainstorming Session
Brainstorming Session
53
3.2.1
01
What method and / or tools were used to identify the final solution(s) /
improvement(s)? ( 1/3)
• Splash Bar brought out in Prime
Position
• Splash Bar pullout from Grocery
outlet and reallocated to Low end
E&D • Splash Bar pullout from Residential
area and reallocated to industrial area
• Activation done in outlet
• In RURAL, Splash Bar pulled out
from GT outlet and redeployed in
new outlet • Splash Bar pullout from Dairy outlet
and reallocated to Tea-Selling stall • Creating Sales Awareness on
splash bar as a channel
• Correcting the PJP/ PCP of
Splash bar • Restructuring splash bar distribution
• Improve on Warm display
• Availability of other brands • Profit story communication
• Incentive structure working
Selection Criteria
CTQ Impact Project Performance Indicators
Time Impact Implementation time
Cost Impact Implementation Cost
Ease Simplicity of Implementation
Top 13 Possible Solution
HIGH Impact Medium Impact
Low Impact
H M L
54
28
3.2.1 Why were these method and / or tools were selected (to identify the final solution(s) /
improvement(s)? ( 2/3) How was the team prepared to use these method and / or tools (to identify
the final solution(s) / improvement(s)? ( 3/3)
13 Possible Solutions How
Refresher Training on the tool utilization Highlighting benefit of the tool in identifying the root cause Team meeting and brainstorming session Analysis of stakeholders Matrix Expert opinion of champion & Sponsor War room setup for free flow discussion
Sigma Impact
Maximum Impact on CTQ
Time Impact
Cost Impact
Ease Implementation &
replication
To meet budges
To meet deadlines
Why
55
3.2.2 How were the methods and / or tools used to determine the final
solution(s) / Improvement(s)? ( 1/2)
13 Possible Solutions
Step 2 Prioritization of possible solution
CTQ Impact
Ease Cost
Impact Time
Impact
Solution Selection Priority Number
Final Solutions
All the numbers are represented are masked considering business confidentiality
56
29
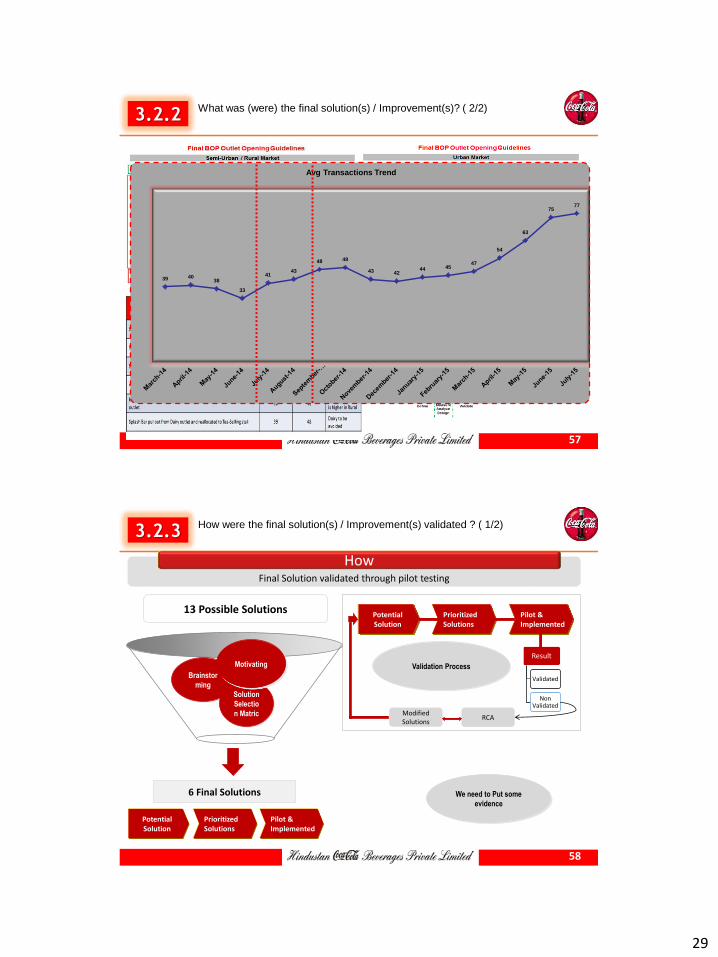
3.2.2 What was (were) the final solution(s) / Improvement(s)? ( 2/2)
39 40 38
33
41 43
48 49
43 42 44 45
47
54
63
75 77
Avg Transactions Trend
57
3.2.3 How were the final solution(s) / Improvement(s) validated ? ( 1/2)
Final Solution validated through pilot testing
How
13 Possible Solutions
Brainstor
ming
Solution
Selectio
n Matric
Motivating
Potential Solution
Prioritized Solutions
Pilot & Implemented
6 Final Solutions
Potential Solution
Prioritized Solutions
Pilot & Implemented
Result
Validated
Non Validated
RCA Modified Solutions
Validation Process
We need to Put some
evidence
58
30
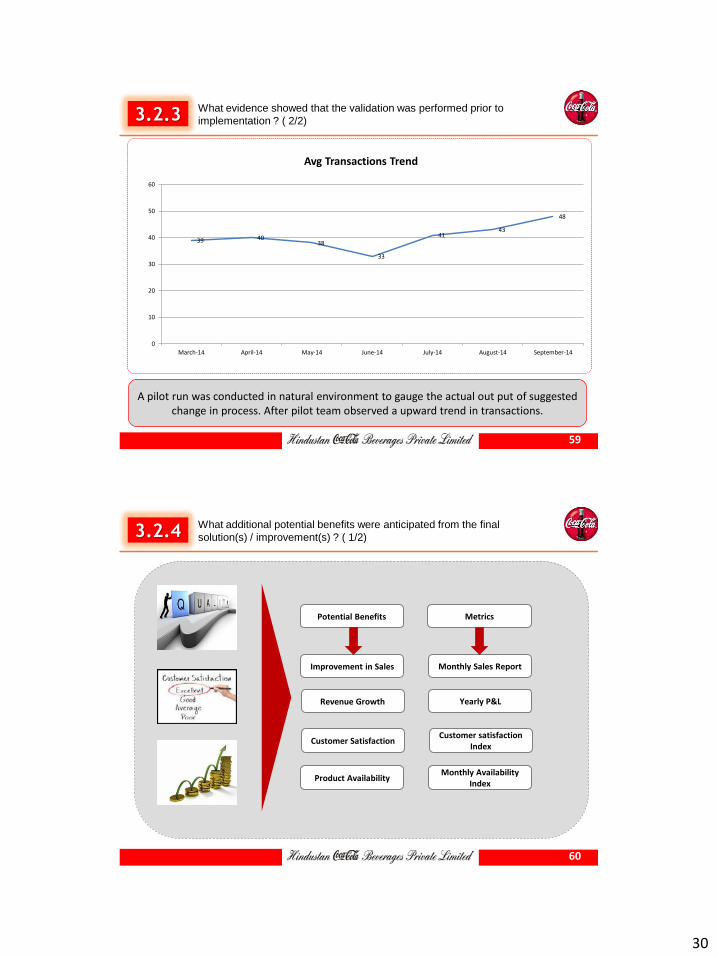
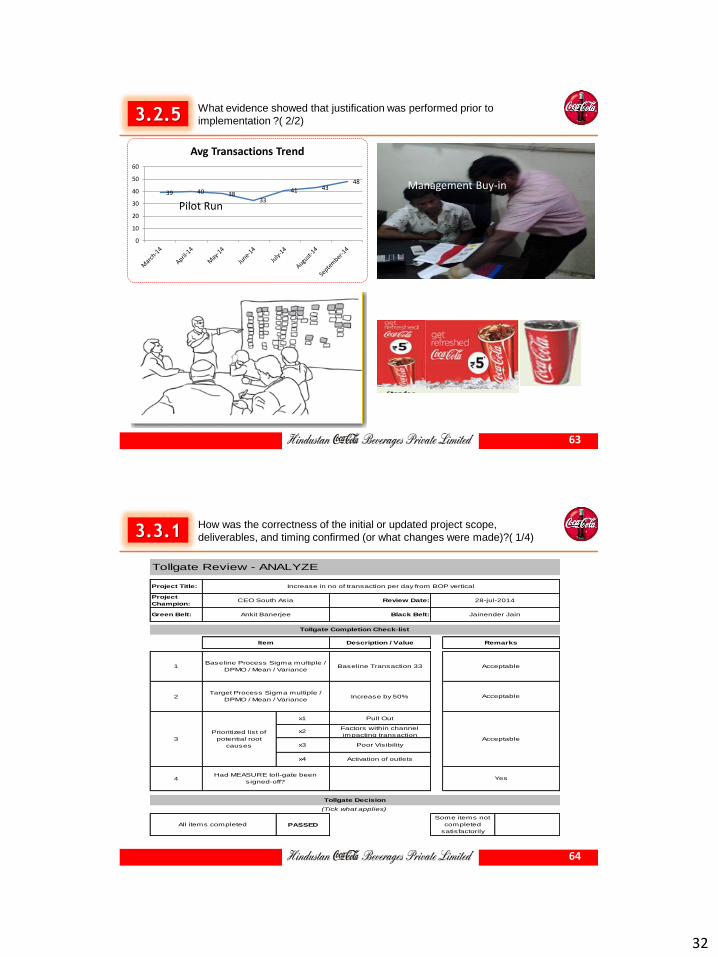
3.2.3 What evidence showed that the validation was performed prior to
implementation ? ( 2/2)
39 40 38
33
41 43
48
0
10
20
30
40
50
60
March-14 April-14 May-14 June-14 July-14 August-14 September-14
Avg Transactions Trend
A pilot run was conducted in natural environment to gauge the actual out put of suggested change in process. After pilot team observed a upward trend in transactions.
59
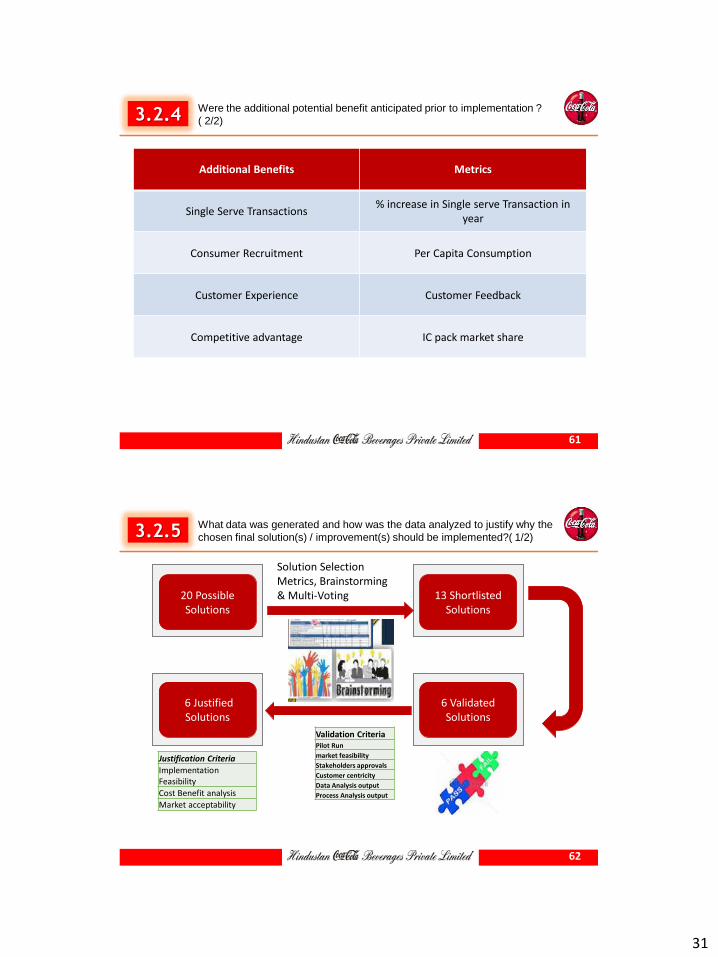
3.2.4 What additional potential benefits were anticipated from the final
solution(s) / improvement(s) ? ( 1/2)
Monthly Availability Index
Customer satisfaction Index
Yearly P&L
Monthly Sales Report
Product Availability
Customer Satisfaction
Revenue Growth
Improvement in Sales
Metrics Potential Benefits
60
31
3.2.4 Were the additional potential benefit anticipated prior to implementation ?
( 2/2)
Additional Benefits Metrics
Single Serve Transactions % increase in Single serve Transaction in
year
Consumer Recruitment Per Capita Consumption
Customer Experience Customer Feedback
Competitive advantage IC pack market share
61
3.2.5 What data was generated and how was the data analyzed to justify why the
chosen final solution(s) / improvement(s) should be implemented?( 1/2)
20 Possible Solutions
6 Justified Solutions
6 Validated Solutions
13 Shortlisted Solutions
Solution Selection Metrics, Brainstorming & Multi-Voting
Validation Criteria Pilot Run
market feasibility
Stakeholders approvals
Customer centricity
Data Analysis output
Process Analysis output
Justification Criteria
Implementation Feasibility
Cost Benefit analysis
Market acceptability
62
32
3.2.5 What evidence showed that justification was performed prior to
implementation ?( 2/2)
39 40 38 33
41 43 48
0
10
20
30
40
50
60
Avg Transactions Trend
Pilot Run
Management Buy-in
63
3.3.1 How was the correctness of the initial or updated project scope,
deliverables, and timing confirmed (or what changes were made)?( 1/4)
Project Title:
Project
Champion:Review Date:
Green Belt: Black Belt:
Description / Value
1 Baseline Transaction 33
2 Increase by 50%
x1 Pull Out
x2Factors within channel
impacting transaction
x3 Poor Visibility
x4 Activation of outlets
4
PASSED
Yes
3
Prioritized list of
potential root
causes
Had MEASURE toll-gate been
signed-off?
Tollgate Decision
All items completed
(Tick what applies)
Some items not
completed
satisfactorily
Tollgate Review - ANALYZE
Increase in no of transaction per day from BOP vertical
CEO South Asia 28-jul-2014
Acceptable
Ankit Banerjee Jainender Jain
Tollgate Completion Check-list
Acceptable
Acceptable
Item
Baseline Process Sigma multiple /
DPMO / Mean / Variance
Target Process Sigma multiple /
DPMO / Mean / Variance
Remarks
64
33
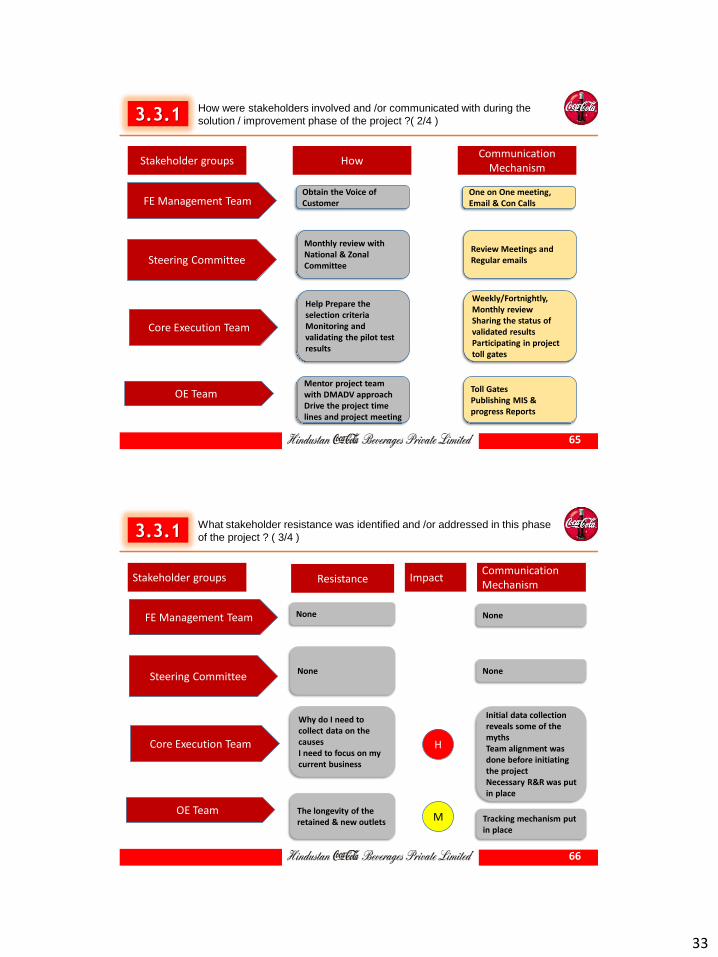
3.3.1 How were stakeholders involved and /or communicated with during the
solution / improvement phase of the project ?( 2/4 )
Obtain the Voice of Customer FE Management Team
Core Execution Team
Steering Committee
Stakeholder groups How
Monthly review with National & Zonal Committee
Help Prepare the selection criteria Monitoring and validating the pilot test results
OE Team Mentor project team with DMADV approach Drive the project time lines and project meeting
One on One meeting, Email & Con Calls
Communication Mechanism
Review Meetings and Regular emails
Weekly/Fortnightly, Monthly review Sharing the status of validated results Participating in project toll gates
Toll Gates Publishing MIS & progress Reports
65
3.3.1 What stakeholder resistance was identified and /or addressed in this phase
of the project ? ( 3/4 )
01
None FE Management Team
Core Execution Team
Steering Committee
Stakeholder groups Resistance
None
Why do I need to collect data on the causes I need to focus on my current business
OE Team The longevity of the retained & new outlets
Impact
H
M
None
None
Initial data collection reveals some of the myths Team alignment was done before initiating the project Necessary R&R was put in place
Tracking mechanism put in place
Communication Mechanism
66

34
3.3.1 How was the appropriateness of the initial or updated team membership
and management routines confirmed (or what changes were made)? ( 4/4 )
Expectation establishment Common Goal Team Contact Trust
Achieving results Finding solutions Caring Establishing unique identity
Agreement on roles & ideas During project Negotiations Consensus building
Roles & Responsibility Expressing Ideas Interdependent Reacting
Skill set Mapping+Training+Engagement
Forming Performing Norming Storming
Management Sales & Operations Team Capability Development Distribution Marketing Legal
C
o
r
e
T
e
a
m
Management Routine Confirmation
SC Head
Steering Committee
Sales &Ops Head
Monthly Review
Monthly to Fortnightly
Weekly
67
Section : 4 Implementation and Result Verification
68
All the numbers are represented are masked considering business confidentiality
35
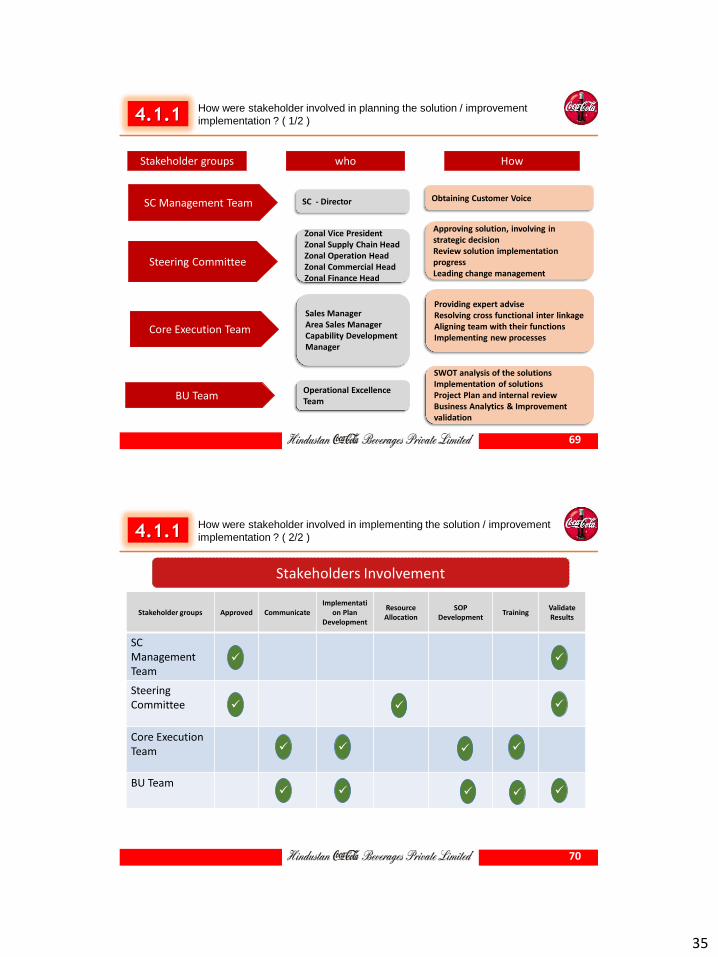
4.1.1 How were stakeholder involved in planning the solution / improvement
implementation ? ( 1/2 )
SC - Director SC Management Team
Core Execution Team
Steering Committee
Stakeholder groups who How
Zonal Vice President Zonal Supply Chain Head Zonal Operation Head Zonal Commercial Head Zonal Finance Head
Sales Manager Area Sales Manager Capability Development Manager
BU Team Operational Excellence Team
Obtaining Customer Voice
Approving solution, involving in strategic decision Review solution implementation progress Leading change management
Providing expert advise Resolving cross functional inter linkage Aligning team with their functions Implementing new processes
SWOT analysis of the solutions Implementation of solutions Project Plan and internal review Business Analytics & Improvement validation
69
4.1.1 How were stakeholder involved in implementing the solution / improvement
implementation ? ( 2/2 )
Stakeholder groups Approved Communicate Implementati
on Plan Development
Resource Allocation
SOP Development
Training Validate Results
SC Management Team
Steering Committee
Core Execution Team
BU Team
Stakeholders Involvement
70
36
4.1.2 What was done to anticipate resistance before it occurred ? ( 1/3 )
What types of resistance were actually encountered during the course of solution /
improvement implementation? ( 2/3 )
Stakeholders WHO Allegiance Impact Resistance
Encountered
SC Management Team
SC - Director
None None
Steering Committee
Zonal Vice President Zonal Supply Chain Head Zonal Operation Head Zonal Commercial Head Zonal Finance Head
None None
Core Execution Team
Sales Manager Area Sales Manager Capability Development Manager
Will cost benefit analysis justify I need to focus on my current business
OE Team Operational Excellence Team The longevity of the retained & new outlets
H
M
Happy
Neutral
Puzzled
71
4.1.2 What types of resistance were actually encountered during the course of
solution / improvement implementation? ( 2/3 )
01
None FE Management Team
Core Execution Team
Steering Committee
Stakeholder groups Resistance
None
What are the benefits from this I need to focus on my current business
OE Team The longevity of the retained & new outlets
Impact
H
M
None
None
Pilot implementation helped in taking care of identified resistance Team alignment was done before initiating the project Necessary R&R was put in place
Tracking mechanism put in place
Communication Mechanism
72
37
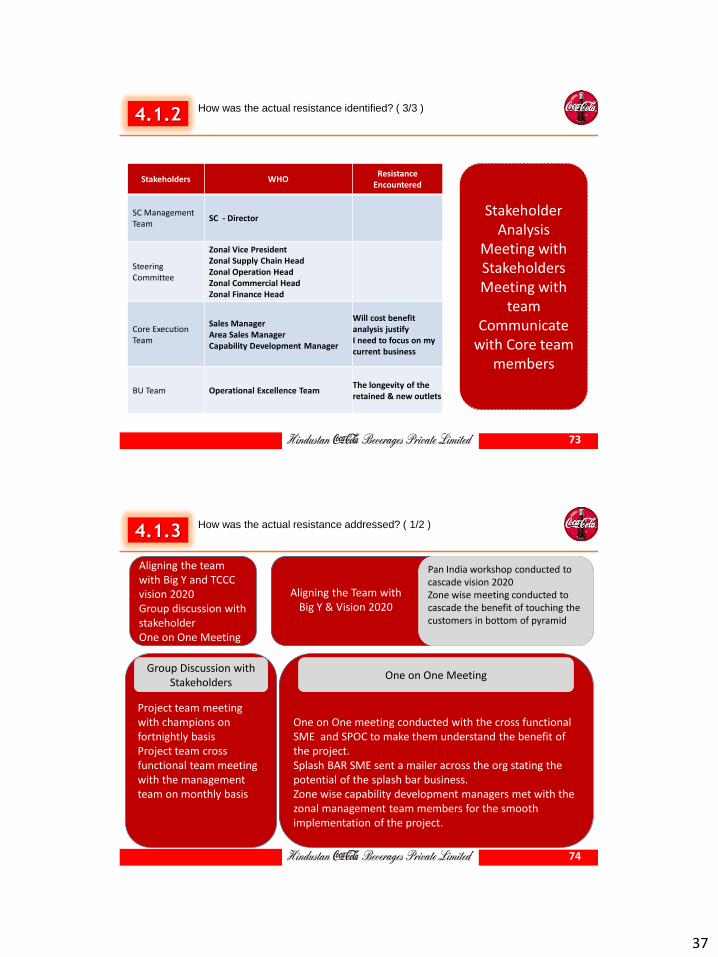
4.1.2 How was the actual resistance identified? ( 3/3 )
Stakeholders WHO Resistance
Encountered
SC Management Team
SC - Director
Steering Committee
Zonal Vice President Zonal Supply Chain Head Zonal Operation Head Zonal Commercial Head Zonal Finance Head
Core Execution Team
Sales Manager Area Sales Manager Capability Development Manager
Will cost benefit analysis justify I need to focus on my current business
BU Team Operational Excellence Team The longevity of the retained & new outlets
Stakeholder Analysis
Meeting with Stakeholders Meeting with
team Communicate
with Core team members
73
4.1.3 How was the actual resistance addressed? ( 1/2 )
Aligning the team with Big Y and TCCC vision 2020 Group discussion with stakeholder One on One Meeting
One on One meeting conducted with the cross functional SME and SPOC to make them understand the benefit of the project. Splash BAR SME sent a mailer across the org stating the potential of the splash bar business. Zone wise capability development managers met with the zonal management team members for the smooth implementation of the project.
Project team meeting with champions on fortnightly basis Project team cross functional team meeting with the management team on monthly basis
Aligning the Team with Big Y & Vision 2020
Pan India workshop conducted to cascade vision 2020 Zone wise meeting conducted to cascade the benefit of touching the customers in bottom of pyramid
Group Discussion with Stakeholders
One on One Meeting
74
38
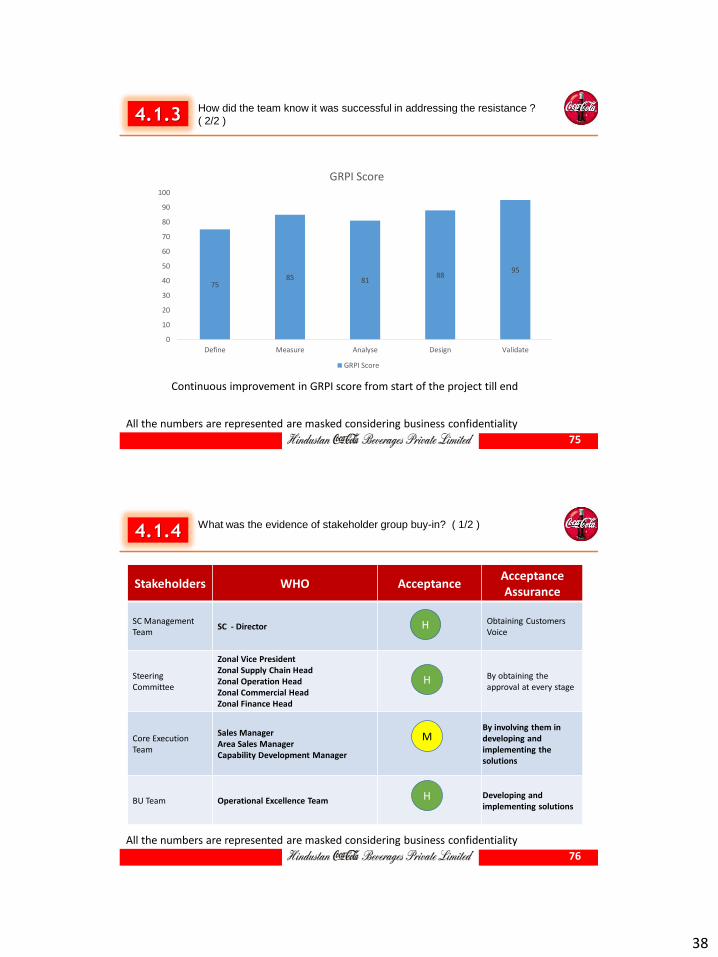
4.1.3 How did the team know it was successful in addressing the resistance ?
( 2/2 )
75 85 81
88 95
0
10
20
30
40
50
60
70
80
90
100
Define Measure Analyse Design Validate
GRPI Score
GRPI Score
Continuous improvement in GRPI score from start of the project till end
All the numbers are represented are masked considering business confidentiality
75
4.1.4 What was the evidence of stakeholder group buy-in? ( 1/2 )
Stakeholders WHO Acceptance Acceptance Assurance
SC Management Team
SC - Director Obtaining Customers Voice
Steering Committee
Zonal Vice President Zonal Supply Chain Head Zonal Operation Head Zonal Commercial Head Zonal Finance Head
By obtaining the approval at every stage
Core Execution Team
Sales Manager Area Sales Manager Capability Development Manager
By involving them in developing and implementing the solutions
BU Team Operational Excellence Team Developing and implementing solutions
H
M
H
H
All the numbers are represented are masked considering business confidentiality
76
39
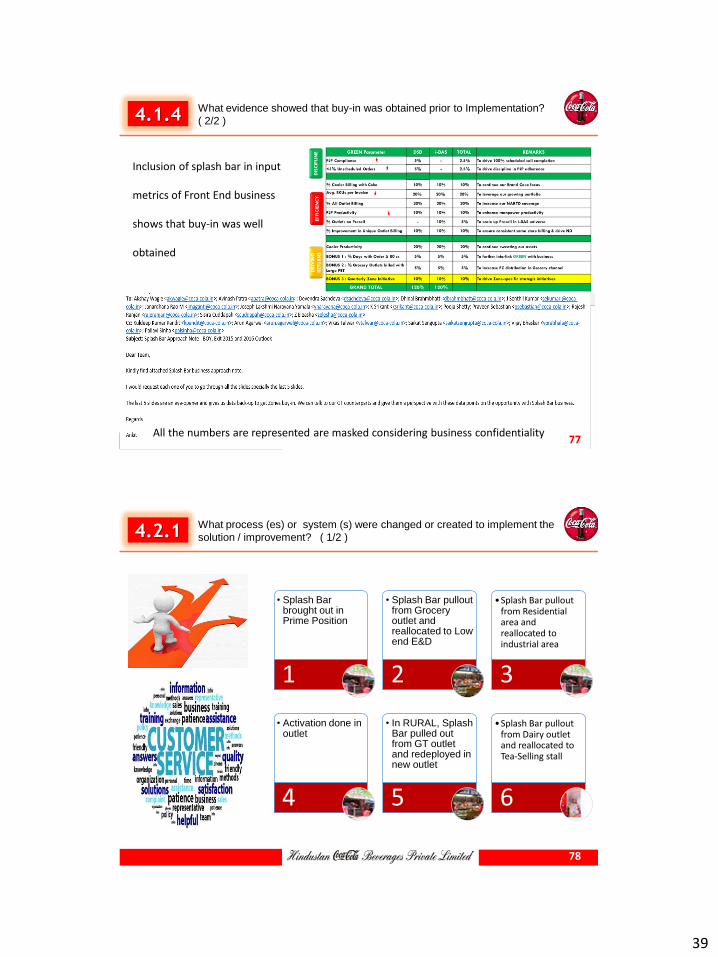
4.1.4 What evidence showed that buy-in was obtained prior to Implementation?
( 2/2 )
Inclusion of splash bar in input
metrics of Front End business
shows that buy-in was well
obtained
All the numbers are represented are masked considering business confidentiality 77
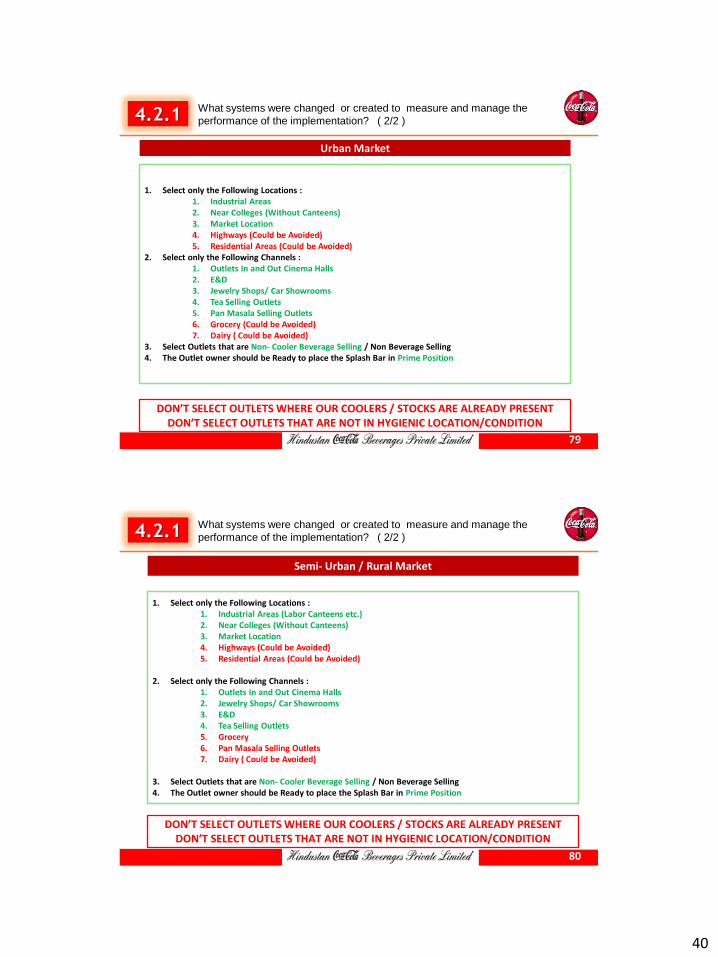
4.2.1 What process (es) or system (s) were changed or created to implement the
solution / improvement? ( 1/2 )
• Splash Bar brought out in Prime Position
1
• Splash Bar pullout from Grocery outlet and reallocated to Low end E&D
2
•Splash Bar pullout from Residential area and reallocated to industrial area
3
• Activation done in outlet
4
• In RURAL, Splash Bar pulled out from GT outlet and redeployed in new outlet
5
•Splash Bar pullout from Dairy outlet and reallocated to Tea-Selling stall
6
78
40
4.2.1 What systems were changed or created to measure and manage the
performance of the implementation? ( 2/2 )
Urban Market
1. Select only the Following Locations : 1. Industrial Areas 2. Near Colleges (Without Canteens) 3. Market Location 4. Highways (Could be Avoided) 5. Residential Areas (Could be Avoided)
2. Select only the Following Channels : 1. Outlets In and Out Cinema Halls 2. E&D 3. Jewelry Shops/ Car Showrooms 4. Tea Selling Outlets 5. Pan Masala Selling Outlets 6. Grocery (Could be Avoided) 7. Dairy ( Could be Avoided)
3. Select Outlets that are Non- Cooler Beverage Selling / Non Beverage Selling 4. The Outlet owner should be Ready to place the Splash Bar in Prime Position
DON’T SELECT OUTLETS WHERE OUR COOLERS / STOCKS ARE ALREADY PRESENT DON’T SELECT OUTLETS THAT ARE NOT IN HYGIENIC LOCATION/CONDITION
79
4.2.1 What systems were changed or created to measure and manage the
performance of the implementation? ( 2/2 )
Semi- Urban / Rural Market
1. Select only the Following Locations : 1. Industrial Areas (Labor Canteens etc.) 2. Near Colleges (Without Canteens) 3. Market Location 4. Highways (Could be Avoided) 5. Residential Areas (Could be Avoided)
2. Select only the Following Channels :
1. Outlets In and Out Cinema Halls 2. Jewelry Shops/ Car Showrooms 3. E&D 4. Tea Selling Outlets 5. Grocery 6. Pan Masala Selling Outlets 7. Dairy ( Could be Avoided)
3. Select Outlets that are Non- Cooler Beverage Selling / Non Beverage Selling 4. The Outlet owner should be Ready to place the Splash Bar in Prime Position
DON’T SELECT OUTLETS WHERE OUR COOLERS / STOCKS ARE ALREADY PRESENT DON’T SELECT OUTLETS THAT ARE NOT IN HYGIENIC LOCATION/CONDITION
80
41
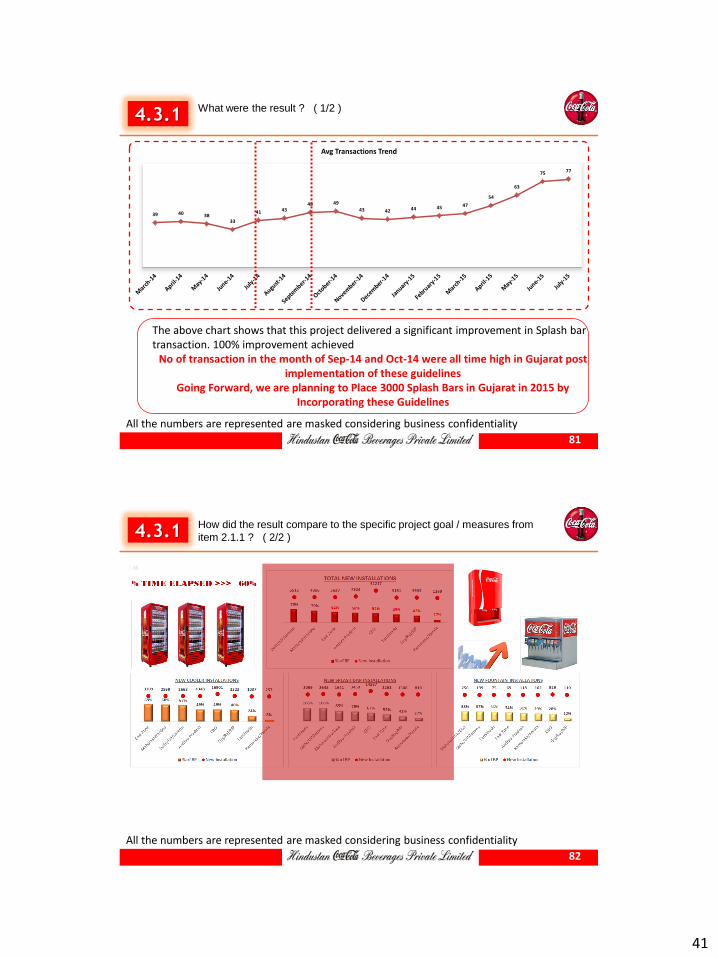
4.3.1 What were the result ? ( 1/2 )
39 40 38 33
41 43 48 49
43 42 44 45 47
54
63
75 77
Avg Transactions Trend
The above chart shows that this project delivered a significant improvement in Splash bar transaction. 100% improvement achieved
No of transaction in the month of Sep-14 and Oct-14 were all time high in Gujarat post implementation of these guidelines
Going Forward, we are planning to Place 3000 Splash Bars in Gujarat in 2015 by Incorporating these Guidelines
All the numbers are represented are masked considering business confidentiality
81
4.3.1 How did the result compare to the specific project goal / measures from
item 2.1.1 ? ( 2/2 )
All the numbers are represented are masked considering business confidentiality
82
42
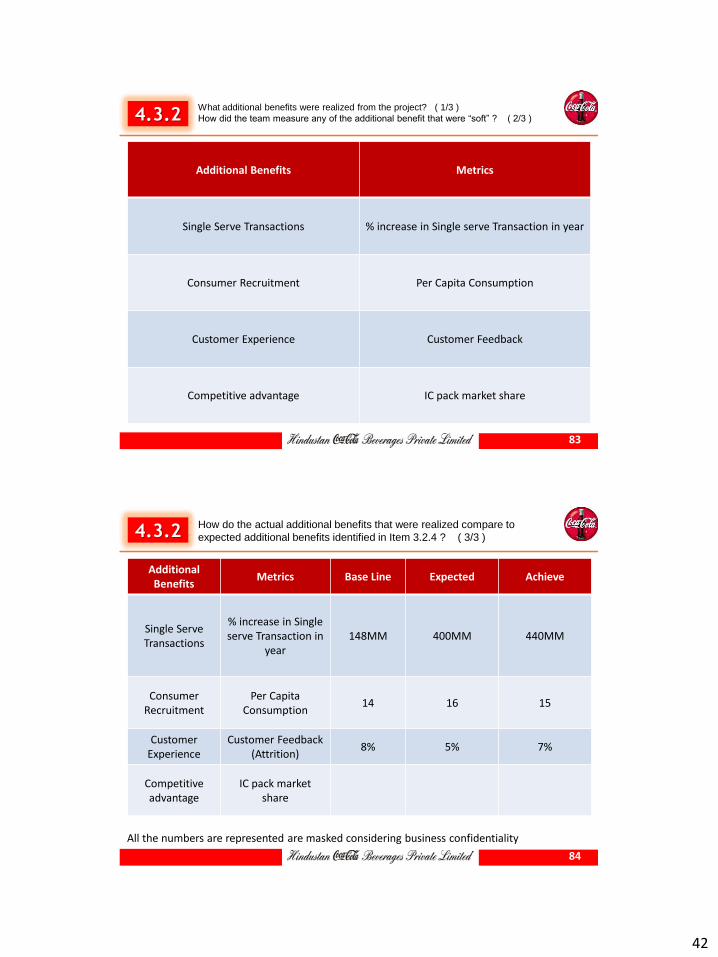
4.3.2 What additional benefits were realized from the project? ( 1/3 )
How did the team measure any of the additional benefit that were “soft” ? ( 2/3 )
Additional Benefits Metrics
Single Serve Transactions % increase in Single serve Transaction in year
Consumer Recruitment Per Capita Consumption
Customer Experience Customer Feedback
Competitive advantage IC pack market share
83
4.3.2 How do the actual additional benefits that were realized compare to
expected additional benefits identified in Item 3.2.4 ? ( 3/3 )
Additional Benefits
Metrics Base Line Expected Achieve
Single Serve Transactions
% increase in Single serve Transaction in
year 148MM 400MM 440MM
Consumer Recruitment
Per Capita Consumption
14 16 15
Customer Experience
Customer Feedback (Attrition)
8% 5% 7%
Competitive advantage
IC pack market share
All the numbers are represented are masked considering business confidentiality
84
43
Section : 5 Sustaining and Communicating Result
85
All the numbers are represented are masked considering business confidentiality
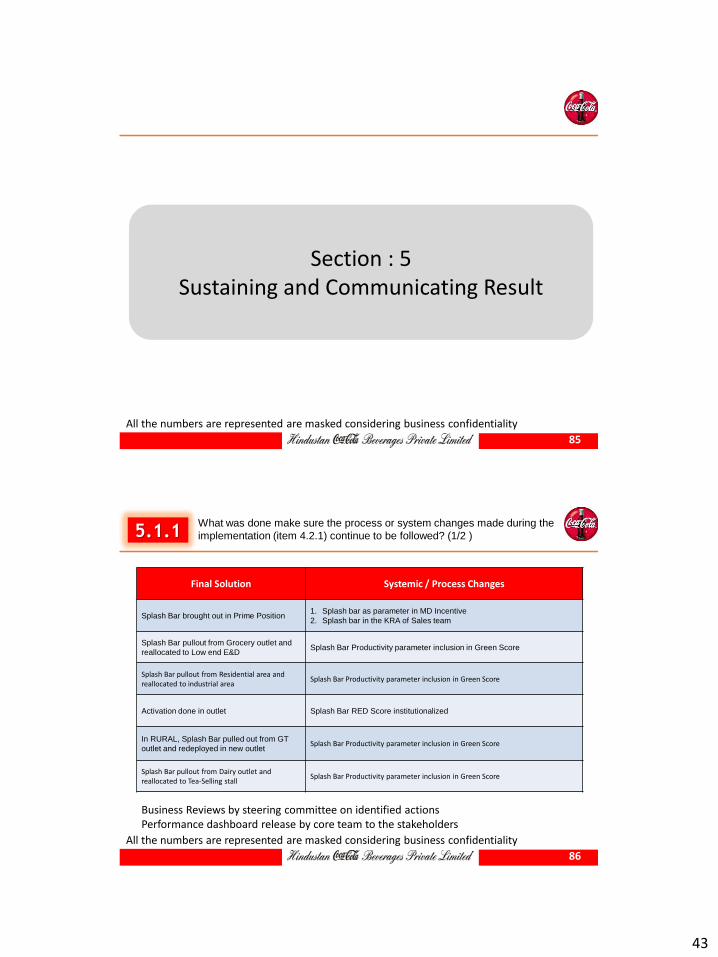
5.1.1 What was done make sure the process or system changes made during the
implementation (item 4.2.1) continue to be followed? (1/2 )
Final Solution Systemic / Process Changes
Splash Bar brought out in Prime Position 1. Splash bar as parameter in MD Incentive
2. Splash bar in the KRA of Sales team
Splash Bar pullout from Grocery outlet and
reallocated to Low end E&D Splash Bar Productivity parameter inclusion in Green Score
Splash Bar pullout from Residential area and reallocated to industrial area
Splash Bar Productivity parameter inclusion in Green Score
Activation done in outlet Splash Bar RED Score institutionalized
In RURAL, Splash Bar pulled out from GT
outlet and redeployed in new outlet Splash Bar Productivity parameter inclusion in Green Score
Splash Bar pullout from Dairy outlet and reallocated to Tea-Selling stall
Splash Bar Productivity parameter inclusion in Green Score
Business Reviews by steering committee on identified actions Performance dashboard release by core team to the stakeholders
All the numbers are represented are masked considering business confidentiality
86
44
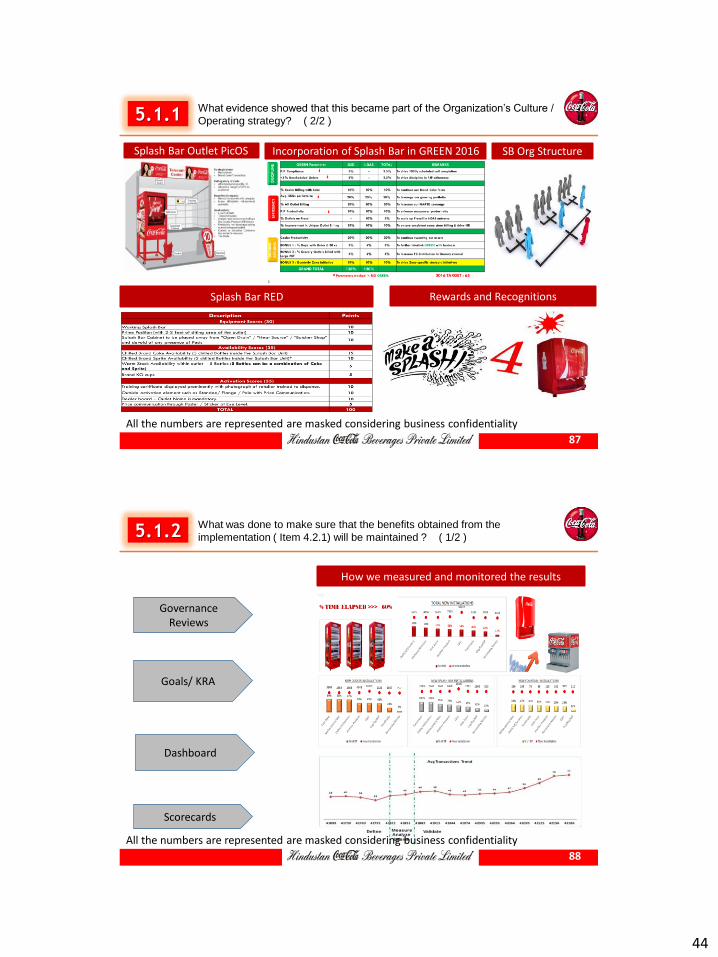
5.1.1 What evidence showed that this became part of the Organization’s Culture /
Operating strategy? ( 2/2 )
Splash Bar Outlet PicOS Incorporation of Splash Bar in GREEN 2016 SB Org Structure
Splash Bar RED Rewards and Recognitions
All the numbers are represented are masked considering business confidentiality
87
5.1.2 What was done to make sure that the benefits obtained from the
implementation ( Item 4.2.1) will be maintained ? ( 1/2 )
Governance Reviews
Dashboard
Goals/ KRA
Scorecards
How we measured and monitored the results
All the numbers are represented are masked considering business confidentiality
88
45
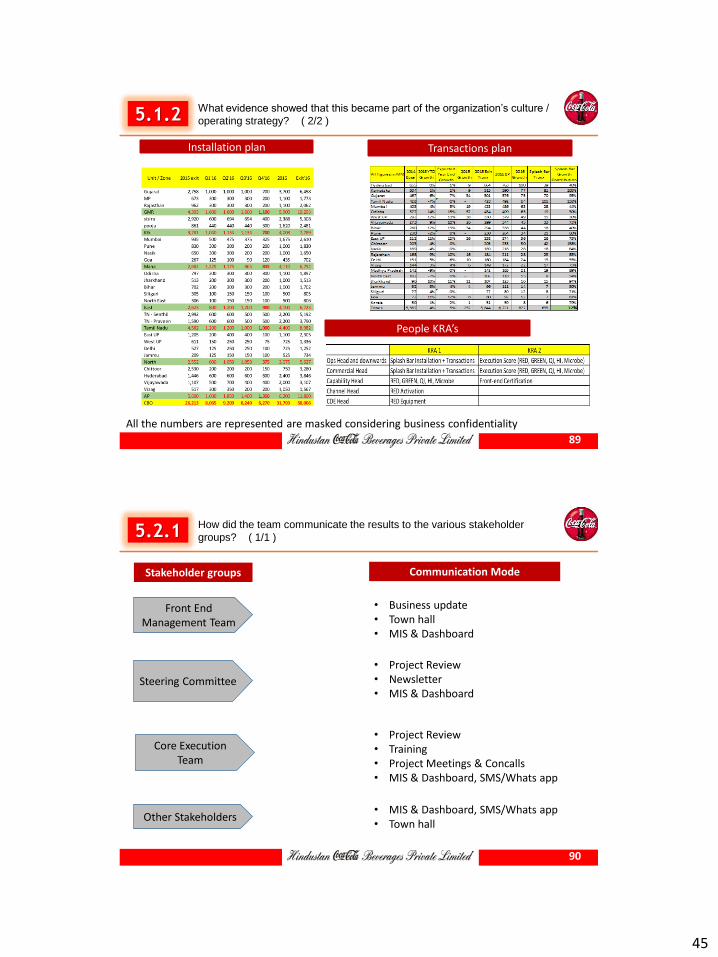
5.1.2 What evidence showed that this became part of the organization’s culture /
operating strategy? ( 2/2 )
Transactions plan Installation plan
People KRA’s
All the numbers are represented are masked considering business confidentiality
89
5.2.1 How did the team communicate the results to the various stakeholder
groups? ( 1/1 )
Front End Management Team
Core Execution Team
Steering Committee
Stakeholder groups
Other Stakeholders
Communication Mode
• Business update • Town hall • MIS & Dashboard
• Project Review • Newsletter • MIS & Dashboard
• Project Review • Training • Project Meetings & Concalls • MIS & Dashboard, SMS/Whats app
• MIS & Dashboard, SMS/Whats app • Town hall
90
46
Powered by
Thank You
91