Embed Size (px)
Citation preview
The Coefficient of DeterminationLecture 46
Section 13.9
Robb T. Koether
Hampden-Sydney College
Tue, Apr 13, 2010
Robb T. Koether (Hampden-Sydney College) The Coefficient of Determination Tue, Apr 13, 2010 1 / 48
Outline
1 The Regression Identity
2 Sums of Squares on the TI-83
3 Explaining Variation
4 TI-83 - The Coefficient of Determination
5 Assignment
Robb T. Koether (Hampden-Sydney College) The Coefficient of Determination Tue, Apr 13, 2010 2 / 48
Outline
1 The Regression Identity
2 Sums of Squares on the TI-83
3 Explaining Variation
4 TI-83 - The Coefficient of Determination
5 Assignment
Robb T. Koether (Hampden-Sydney College) The Coefficient of Determination Tue, Apr 13, 2010 3 / 48
Explaining the Variation in y
Statisticians use regression models to “explain” y .More specifically, through the model they use variation in x toexplain variation in y .
Robb T. Koether (Hampden-Sydney College) The Coefficient of Determination Tue, Apr 13, 2010 4 / 48
Explaining the Variation in y
For example, why do some people weigh more than other people?One explanation is that some people weigh more than othersbecause they are taller.That is, there is variation in weight because their is variation inheight and because weight and height are correlated.But that is only a partial explanation.
Robb T. Koether (Hampden-Sydney College) The Coefficient of Determination Tue, Apr 13, 2010 5 / 48
Explaining the Variation in y
Statisticians want to quantify how much of the variation in y isexplained by the variation in x .
Robb T. Koether (Hampden-Sydney College) The Coefficient of Determination Tue, Apr 13, 2010 6 / 48
The Regression Identity
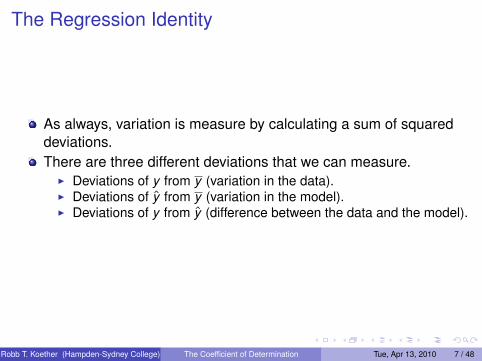
As always, variation is measure by calculating a sum of squareddeviations.There are three different deviations that we can measure.
I Deviations of y from y (variation in the data).I Deviations of y from y (variation in the model).I Deviations of y from y (difference between the data and the model).
Robb T. Koether (Hampden-Sydney College) The Coefficient of Determination Tue, Apr 13, 2010 7 / 48
The Regression Identity
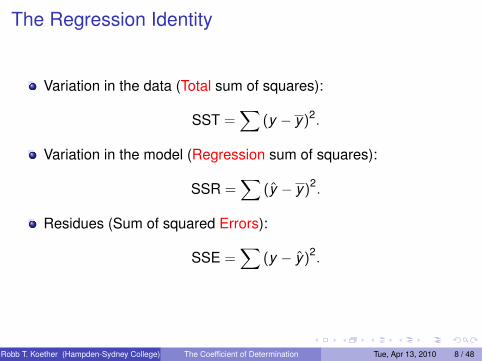
Variation in the data (Total sum of squares):
SST =∑
(y − y)2.
Variation in the model (Regression sum of squares):
SSR =∑
(y − y)2.
Residues (Sum of squared Errors):
SSE =∑
(y − y)2.
Robb T. Koether (Hampden-Sydney College) The Coefficient of Determination Tue, Apr 13, 2010 8 / 48
Example - SST, SSR, and SSE
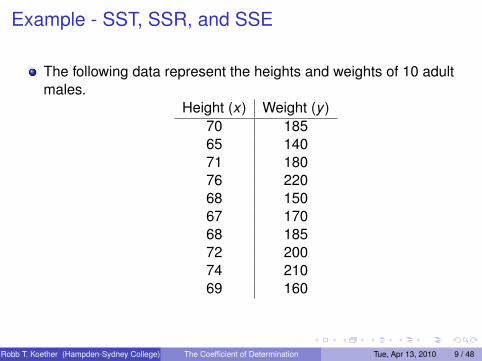
The following data represent the heights and weights of 10 adultmales.
Height (x) Weight (y )70 18565 14071 18076 22068 15067 17068 18572 20074 21069 160
Robb T. Koether (Hampden-Sydney College) The Coefficient of Determination Tue, Apr 13, 2010 9 / 48
Example - SST, SSR, and SSE
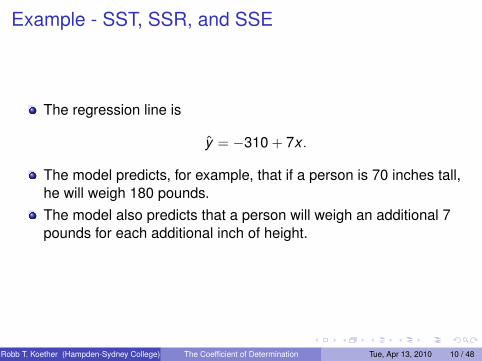
The regression line is
y = −310 + 7x .
The model predicts, for example, that if a person is 70 inches tall,he will weigh 180 pounds.The model also predicts that a person will weigh an additional 7pounds for each additional inch of height.
Robb T. Koether (Hampden-Sydney College) The Coefficient of Determination Tue, Apr 13, 2010 10 / 48
Example - SST, SSR, and SSE
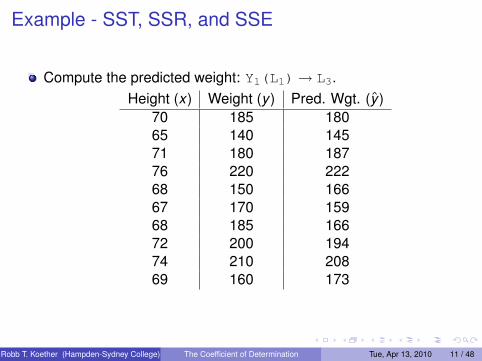
Compute the predicted weight: Y1(L1)→ L3.Height (x) Weight (y ) Pred. Wgt. (y )
70 185 18065 140 14571 180 18776 220 22268 150 16667 170 15968 185 16672 200 19474 210 20869 160 173
Robb T. Koether (Hampden-Sydney College) The Coefficient of Determination Tue, Apr 13, 2010 11 / 48
Example - SST, SSR, and SSE
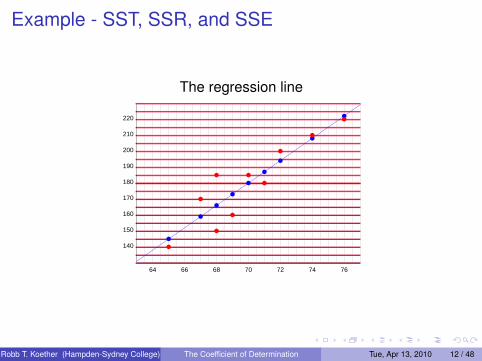
The regression line
64 66 68 70 72 74 76
140
160
220
200
180
150
170
210
190
Robb T. Koether (Hampden-Sydney College) The Coefficient of Determination Tue, Apr 13, 2010 12 / 48
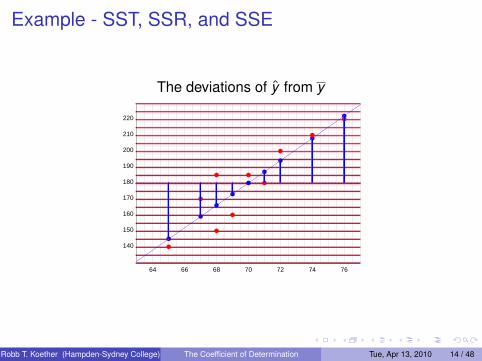
Example - SST, SSR, and SSE
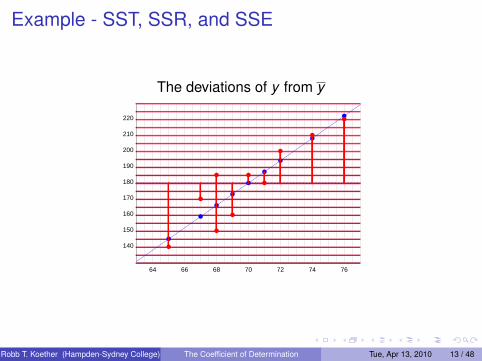
The deviations of y from y
64 66 68 70 72 74 76
140
160
220
200
180
150
170
210
190
Robb T. Koether (Hampden-Sydney College) The Coefficient of Determination Tue, Apr 13, 2010 13 / 48
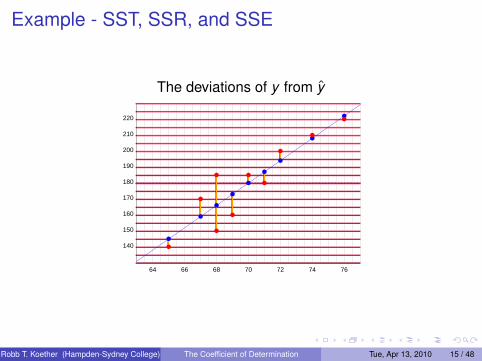
Example - SST, SSR, and SSE
The deviations of y from y
64 66 68 70 72 74 76
140
160
220
200
180
150
170
210
190
Robb T. Koether (Hampden-Sydney College) The Coefficient of Determination Tue, Apr 13, 2010 14 / 48
Example - SST, SSR, and SSE
The deviations of y from y
64 66 68 70 72 74 76
140
160
220
200
180
150
170
210
190
Robb T. Koether (Hampden-Sydney College) The Coefficient of Determination Tue, Apr 13, 2010 15 / 48
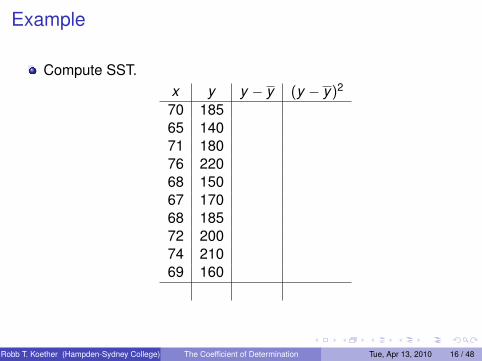
Example
Compute SST.x y y − y (y − y)2
70 18565 14071 18076 22068 15067 17068 18572 20074 21069 160
Robb T. Koether (Hampden-Sydney College) The Coefficient of Determination Tue, Apr 13, 2010 16 / 48
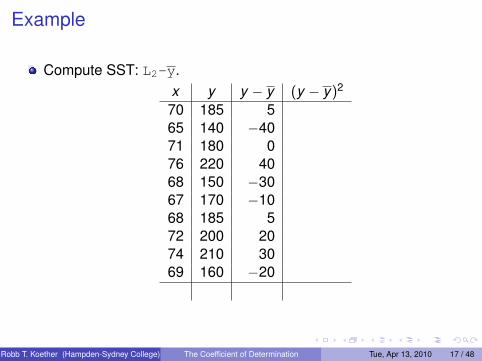
Example
Compute SST: L2-y.x y y − y (y − y)2
70 185 565 140 −4071 180 076 220 4068 150 −3067 170 −1068 185 572 200 2074 210 3069 160 −20
Robb T. Koether (Hampden-Sydney College) The Coefficient of Determination Tue, Apr 13, 2010 17 / 48

Example
Compute SST: Ans2.x y y − y (y − y)2
70 185 5 2565 140 −40 160071 180 0 076 220 40 160068 150 −30 90067 170 −10 10068 185 5 2572 200 20 40074 210 30 90069 160 −20 400
Robb T. Koether (Hampden-Sydney College) The Coefficient of Determination Tue, Apr 13, 2010 18 / 48
Example
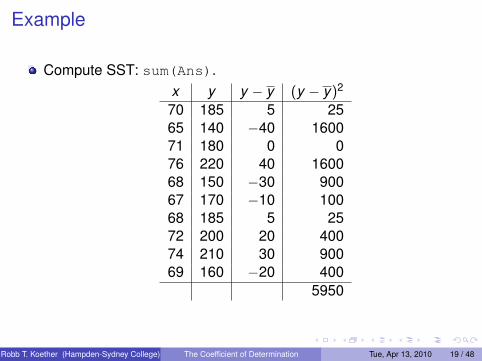
Compute SST: sum(Ans).x y y − y (y − y)2
70 185 5 2565 140 −40 160071 180 0 076 220 40 160068 150 −30 90067 170 −10 10068 185 5 2572 200 20 40074 210 30 90069 160 −20 400
5950
Robb T. Koether (Hampden-Sydney College) The Coefficient of Determination Tue, Apr 13, 2010 19 / 48

Example
Compute SSR.x y y y − y (y − y)2
70 18565 14071 18076 22068 15067 17068 18572 20074 21069 160
Robb T. Koether (Hampden-Sydney College) The Coefficient of Determination Tue, Apr 13, 2010 20 / 48
Example
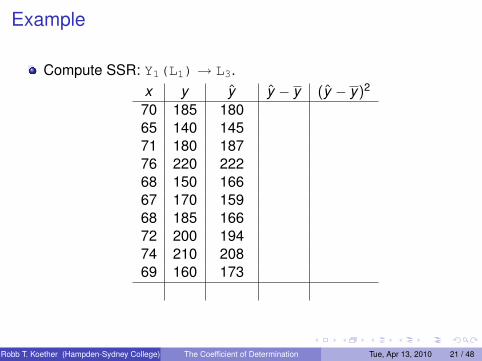
Compute SSR: Y1(L1)→ L3.x y y y − y (y − y)2
70 185 18065 140 14571 180 18776 220 22268 150 16667 170 15968 185 16672 200 19474 210 20869 160 173
Robb T. Koether (Hampden-Sydney College) The Coefficient of Determination Tue, Apr 13, 2010 21 / 48

Example
Compute SSR: L3-y.x y y y − y (y − y)2
70 185 180 065 140 145 −3571 180 187 776 220 222 4268 150 166 −1467 170 159 −2168 185 166 −1472 200 194 1474 210 208 2869 160 173 −7
Robb T. Koether (Hampden-Sydney College) The Coefficient of Determination Tue, Apr 13, 2010 22 / 48
Example
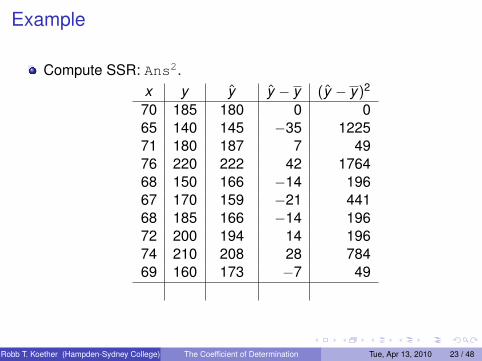
Compute SSR: Ans2.x y y y − y (y − y)2
70 185 180 0 065 140 145 −35 122571 180 187 7 4976 220 222 42 176468 150 166 −14 19667 170 159 −21 44168 185 166 −14 19672 200 194 14 19674 210 208 28 78469 160 173 −7 49
Robb T. Koether (Hampden-Sydney College) The Coefficient of Determination Tue, Apr 13, 2010 23 / 48
Example
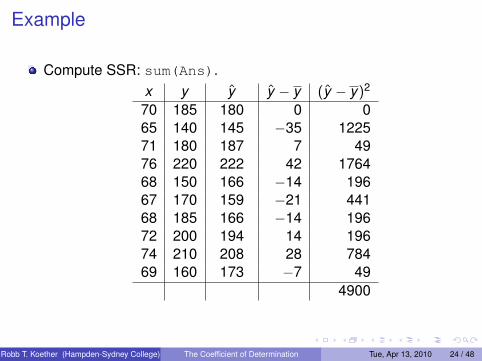
Compute SSR: sum(Ans).x y y y − y (y − y)2
70 185 180 0 065 140 145 −35 122571 180 187 7 4976 220 222 42 176468 150 166 −14 19667 170 159 −21 44168 185 166 −14 19672 200 194 14 19674 210 208 28 78469 160 173 −7 49
4900
Robb T. Koether (Hampden-Sydney College) The Coefficient of Determination Tue, Apr 13, 2010 24 / 48
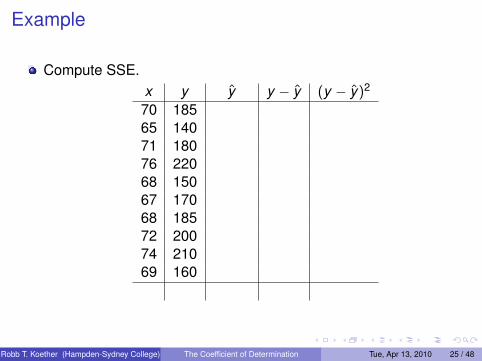
Example
Compute SSE.x y y y − y (y − y)2
70 18565 14071 18076 22068 15067 17068 18572 20074 21069 160
Robb T. Koether (Hampden-Sydney College) The Coefficient of Determination Tue, Apr 13, 2010 25 / 48

Example
Compute SSE: Y1(L1)→ L3.x y y y − y (y − y)2
70 185 18065 140 14571 180 18776 220 22268 150 16667 170 15968 185 16672 200 19474 210 20869 160 173
Robb T. Koether (Hampden-Sydney College) The Coefficient of Determination Tue, Apr 13, 2010 26 / 48
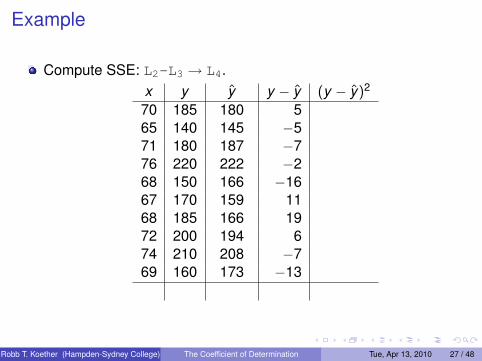
Example
Compute SSE: L2-L3 → L4.x y y y − y (y − y)2
70 185 180 565 140 145 −571 180 187 −776 220 222 −268 150 166 −1667 170 159 1168 185 166 1972 200 194 674 210 208 −769 160 173 −13
Robb T. Koether (Hampden-Sydney College) The Coefficient of Determination Tue, Apr 13, 2010 27 / 48
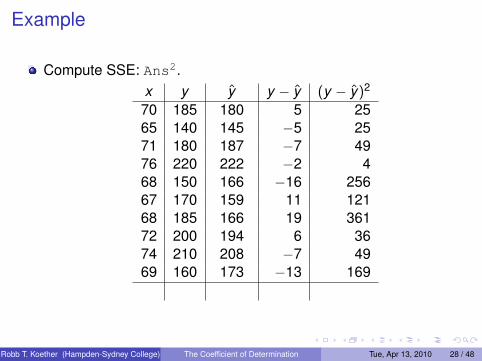
Example
Compute SSE: Ans2.x y y y − y (y − y)2
70 185 180 5 2565 140 145 −5 2571 180 187 −7 4976 220 222 −2 468 150 166 −16 25667 170 159 11 12168 185 166 19 36172 200 194 6 3674 210 208 −7 4969 160 173 −13 169
Robb T. Koether (Hampden-Sydney College) The Coefficient of Determination Tue, Apr 13, 2010 28 / 48
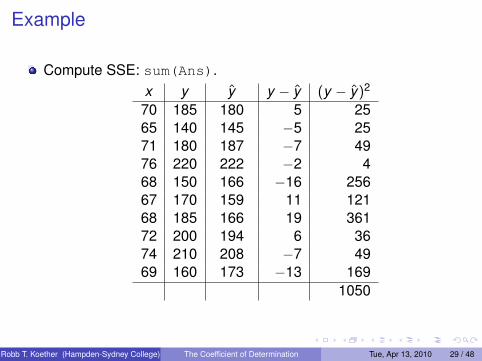
Example
Compute SSE: sum(Ans).x y y y − y (y − y)2
70 185 180 5 2565 140 145 −5 2571 180 187 −7 4976 220 222 −2 468 150 166 −16 25667 170 159 11 12168 185 166 19 36172 200 194 6 3674 210 208 −7 4969 160 173 −13 169
1050
Robb T. Koether (Hampden-Sydney College) The Coefficient of Determination Tue, Apr 13, 2010 29 / 48
Example
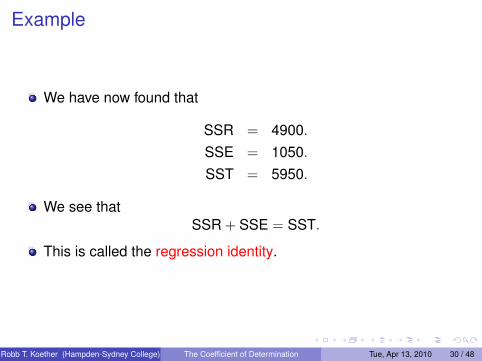
We have now found that
SSR = 4900.
SSE = 1050.
SST = 5950.
We see thatSSR + SSE = SST.
This is called the regression identity.
Robb T. Koether (Hampden-Sydney College) The Coefficient of Determination Tue, Apr 13, 2010 30 / 48
Outline
1 The Regression Identity
2 Sums of Squares on the TI-83
3 Explaining Variation
4 TI-83 - The Coefficient of Determination
5 Assignment
Robb T. Koether (Hampden-Sydney College) The Coefficient of Determination Tue, Apr 13, 2010 31 / 48
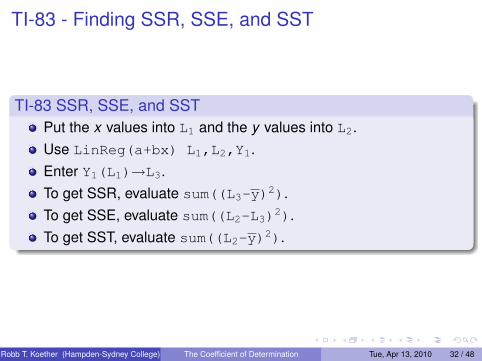
TI-83 - Finding SSR, SSE, and SST
TI-83 SSR, SSE, and SSTPut the x values into L1 and the y values into L2.Use LinReg(a+bx) L1,L2,Y1.Enter Y1(L1)→L3.To get SSR, evaluate sum((L3-y)2).To get SSE, evaluate sum((L2-L3)2).To get SST, evaluate sum((L2-y)2).
Robb T. Koether (Hampden-Sydney College) The Coefficient of Determination Tue, Apr 13, 2010 32 / 48
Outline
1 The Regression Identity
2 Sums of Squares on the TI-83
3 Explaining Variation
4 TI-83 - The Coefficient of Determination
5 Assignment
Robb T. Koether (Hampden-Sydney College) The Coefficient of Determination Tue, Apr 13, 2010 33 / 48
Explaining Variation
One goal of regression is to “explain” the variation in y .For example, if y were weight, how would we explain the variationin weight?That is, why do some people weigh more than others?A partial answer is that some people weigh more because theyare taller.That is, an explanatory variable is height x .What are some other partial answers?
Robb T. Koether (Hampden-Sydney College) The Coefficient of Determination Tue, Apr 13, 2010 34 / 48

Explaining Variation
How much of the variation in weight is explained by variation inheight?The total variation in weight is SST.The linear model (the regression line) explains some of thevariation.The model predicts the variation SSR.The remainder is SSE, the variation not predicted by the model.
Robb T. Koether (Hampden-Sydney College) The Coefficient of Determination Tue, Apr 13, 2010 35 / 48
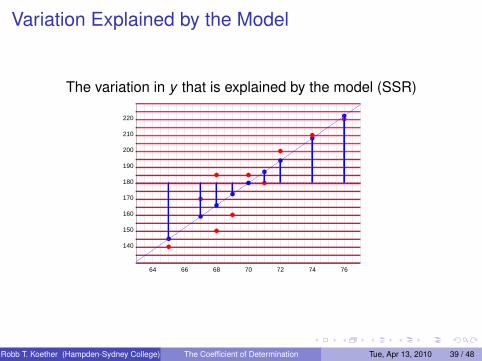
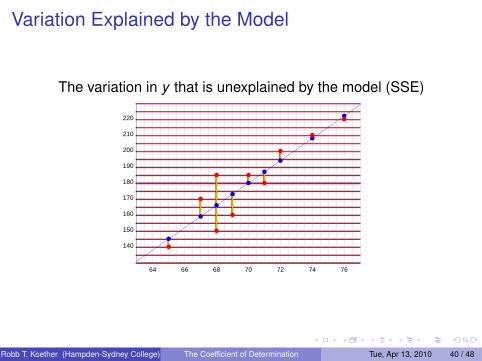
Explaining Variation
Statisticians consider the predicted variation SSR to be theamount of variation in y that is explained by the model.The residual variation SSE is the remaining variation in y that isnot explained by the model.It all checks out because SST = SSR + SSE.
Robb T. Koether (Hampden-Sydney College) The Coefficient of Determination Tue, Apr 13, 2010 36 / 48
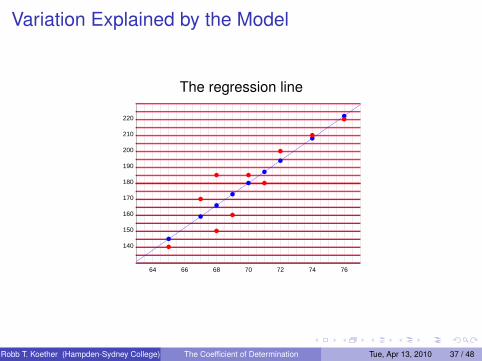
Variation Explained by the Model
The regression line
64 66 68 70 72 74 76
140
160
220
200
180
150
170
210
190
Robb T. Koether (Hampden-Sydney College) The Coefficient of Determination Tue, Apr 13, 2010 37 / 48
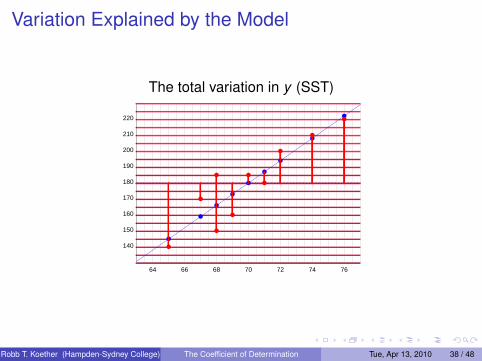
Variation Explained by the Model
The total variation in y (SST)
64 66 68 70 72 74 76
140
160
220
200
180
150
170
210
190
Robb T. Koether (Hampden-Sydney College) The Coefficient of Determination Tue, Apr 13, 2010 38 / 48
Variation Explained by the Model
The variation in y that is explained by the model (SSR)
64 66 68 70 72 74 76
140
160
220
200
180
150
170
210
190
Robb T. Koether (Hampden-Sydney College) The Coefficient of Determination Tue, Apr 13, 2010 39 / 48
Variation Explained by the Model
The variation in y that is unexplained by the model (SSE)
64 66 68 70 72 74 76
140
160
220
200
180
150
170
210
190
Robb T. Koether (Hampden-Sydney College) The Coefficient of Determination Tue, Apr 13, 2010 40 / 48
Explaining Variation
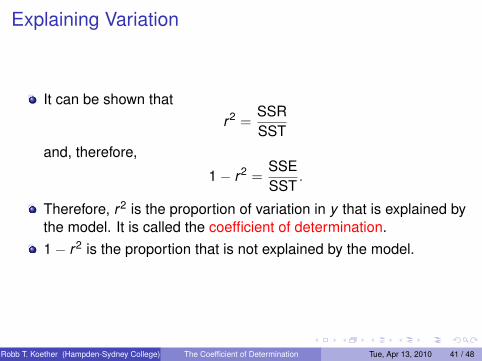
It can be shown thatr2 =
SSRSST
and, therefore,
1− r2 =SSESST
.
Therefore, r2 is the proportion of variation in y that is explained bythe model. It is called the coefficient of determination.1− r2 is the proportion that is not explained by the model.
Robb T. Koether (Hampden-Sydney College) The Coefficient of Determination Tue, Apr 13, 2010 41 / 48
Outline
1 The Regression Identity
2 Sums of Squares on the TI-83
3 Explaining Variation
4 TI-83 - The Coefficient of Determination
5 Assignment
Robb T. Koether (Hampden-Sydney College) The Coefficient of Determination Tue, Apr 13, 2010 42 / 48
TI-83 - Coefficient of Determination
TI-83 Coefficient of DeterminationTo calculate r2 on the TI-83, follow the procedure that producesthe regression line and r .In the same window, the TI-83 reports the value of r2.
Robb T. Koether (Hampden-Sydney College) The Coefficient of Determination Tue, Apr 13, 2010 43 / 48
TI-83 - Finding SSR, SSE, and SST
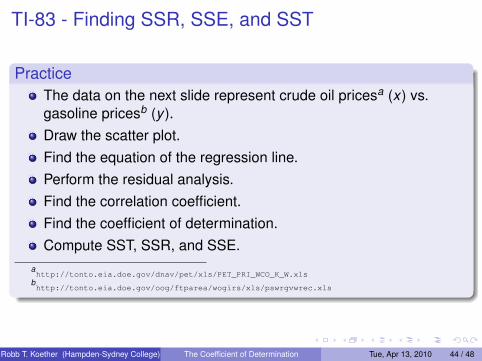
PracticeThe data on the next slide represent crude oil pricesa (x) vs.gasoline pricesb (y ).Draw the scatter plot.Find the equation of the regression line.Perform the residual analysis.Find the correlation coefficient.Find the coefficient of determination.Compute SST, SSR, and SSE.
ahttp://tonto.eia.doe.gov/dnav/pet/xls/PET_PRI_WCO_K_W.xls
bhttp://tonto.eia.doe.gov/oog/ftparea/wogirs/xls/pswrgvwrec.xls
Robb T. Koether (Hampden-Sydney College) The Coefficient of Determination Tue, Apr 13, 2010 44 / 48
TI-83 - Finding SSR, SSE, and SSTPractice
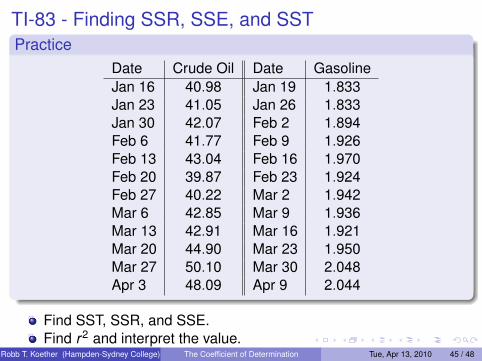
Date Crude Oil Date GasolineJan 16 40.98 Jan 19 1.833Jan 23 41.05 Jan 26 1.833Jan 30 42.07 Feb 2 1.894Feb 6 41.77 Feb 9 1.926Feb 13 43.04 Feb 16 1.970Feb 20 39.87 Feb 23 1.924Feb 27 40.22 Mar 2 1.942Mar 6 42.85 Mar 9 1.936Mar 13 42.91 Mar 16 1.921Mar 20 44.90 Mar 23 1.950Mar 27 50.10 Mar 30 2.048Apr 3 48.09 Apr 9 2.044
Find SST, SSR, and SSE.Find r2 and interpret the value.
Robb T. Koether (Hampden-Sydney College) The Coefficient of Determination Tue, Apr 13, 2010 45 / 48
Outline
1 The Regression Identity
2 Sums of Squares on the TI-83
3 Explaining Variation
4 TI-83 - The Coefficient of Determination
5 Assignment
Robb T. Koether (Hampden-Sydney College) The Coefficient of Determination Tue, Apr 13, 2010 46 / 48
Assignment
HomeworkRead Section 13.9, pages 868 - 869.Work the practice problem on the previous slide.
Robb T. Koether (Hampden-Sydney College) The Coefficient of Determination Tue, Apr 13, 2010 47 / 48
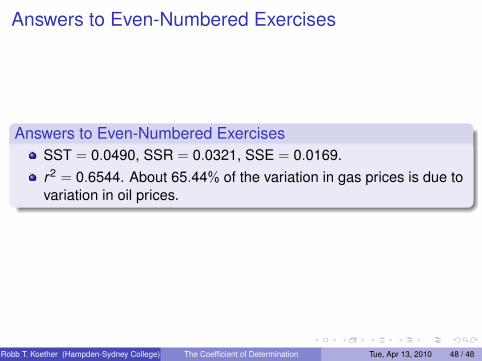
Answers to Even-Numbered Exercises
Answers to Even-Numbered ExercisesSST = 0.0490, SSR = 0.0321, SSE = 0.0169.r2 = 0.6544. About 65.44% of the variation in gas prices is due tovariation in oil prices.
Robb T. Koether (Hampden-Sydney College) The Coefficient of Determination Tue, Apr 13, 2010 48 / 48
![Predicting the coefficient of restitution of impacting ... the coefficient of... · Predicting the coefficient of restitution of impacting elastic-perfectly plastic spheres [23]](https://img.pdfslide.net/doc/110x75/5ee3db26ad6a402d666d6c2d/predicting-the-coeficient-of-restitution-of-impacting-the-coefficient-of.jpg)


![Multidisciplinary design and aerodynamic assessment of an agile … · 2017. 12. 8. · mx Body-fixed X-moment coefficient [–] C my Body-fixed Y-moment coefficient ... Sect](https://img.pdfslide.net/doc/110x75/6072c02dd8518542c820b143/multidisciplinary-design-and-aerodynamic-assessment-of-an-agile-2017-12-8-mx.jpg)