Embed Size (px)
Citation preview

Atmospheric and Climate Sciences, 2012, 2, 510-517 http://dx.doi.org/10.4236/acs.2012.24045 Published Online October 2012 (http://www.SciRP.org/journal/acs)
The Color of the Sky
Frederic Zagury Department of the History of Science, Harvard University, Cambridge, USA
Email: [email protected]
Received June 9, 2012; revised June 30, 2012; accepted July 9, 2012
ABSTRACT
The color of the sky in day-time and at twilight is studied by means of spectroscopy, which provides an unambiguous way to understand and quantify why a sky is blue, pink, or red. The colors a daylight sky can take primarily owe to Rayleigh extinction and ozone absorption. Spectra of the sky illuminated by the sun can generally be represented by a
generic analytical expression which involves the Rayleigh function 41
ea
R4
, ozone absorption, and, to a lesser
extend, aerosol extinction. This study is based on a representative sample of spectra selected from a few hundred ob- servations taken in different places, times, and dates, with a portable fiber spectrometer. Keywords: Sky Color; Rayleigh Extinction; Ozone; Aerosols; Radiative Transfer; Spectral Analysis
1. Introduction
Two major causes of the extinction of light by the at- mosphere, extinction by air molecules (nitrogen mainly) and ozone absorption, were discovered in the second half of the XIXth century when scientists1 questioned why the sky is blue. A third important cause of atmospheric ex- tinction, extinction by aerosols, has been observed for centuries to affect sky color, for instance the reddish hazes after a volcanic eruption or sand-winds [7,8]. Aerosol science also developed in the XIXth century al- though the theoretical understanding of how these parti- cles extinguish light had to wait for Mie theory in 1908 [9]. Today, information about the atmosphere is primari- ly derived from spectral analysis. Occultation spectra of stars or of the sun are inverted to give the exact column densities of nitrogen, ozone, and aerosols, along the path of light (Figure 1).
Surprisingly, no equivalent method has been used for scattered sunlight. Despite a large number of investiga- tions on the color of the sky2, little effort has been made to relate a color to its spectrum in order to understand why is a sky red, the difference between day-time and twilight blues, or the reason for a green-flash. Since about sixty years investigations on the color of the sky are based on models of the atmosphere [10]. These models
agree that the blue color of the sky in day-time is due to Rayleigh scattering and that blue nuances at twilight, when the sun is low on the horizon, require an additional ozone absorption [11-16]. A conclusion that Wulf, Moore, and Melvin [17] had already reached in 1934 from what may be considered as the very first published spectral observation of a twilight sky. Recently, Lee, Meyer, and Hoeppe [10] have also addressed the ques- tion of the influence of ozone on the blue of the sky from a calorimetric analysis of digital images of the sky.
At the other end of the visible spectrum the reason for the red color of the horizon at sunrise or sunset is still an open question. Rayleigh extinction is often thought to explain red skies3, but models find that an additional contribution of either multiple scattering or aerosol ex- tinction is needed [13,16].
A first attempt to analyze the spectrum of a red horizon was made in 2001-2003 by M. Fujii and myself [19]. The spectra observed by M. Fujii had exactly the shape of occultation spectra of the sun (which I knew from [20]) multiplied by 1/λ4. They should simply be interpreted as sunlight extinguished by the atmosphere Rayleigh-scat- tered by air-molecules in the direction of the observer. The spectra were slightly (a few degrees) above the red- 3“Scattering decreases, in fact, as 1/λ4. Blue and violet light are thus scattered much more than red and orange, which is why the sky looks blue. At sunset, the Sun’s rays pass through a maximum length of atmosphere. Much of the blue has been taken out by the scattering. The light that reaches the surface of the Earth, and reflects off clouds and haze, is thus lacking in blue which is why sunsets appear reddish.”([18], p. 945). See also: http://www.sciencedaily.com/releases/2007/11/ 071108135522.html
1Physicists and chemists, starting with Clausius and Rayleigh ([1,2] and references therein) followed by Lallemand, Hartley, Chappuis [3-6]. 2See for instance the 2005 issue of Applied Optics, 44 (No. 27, Sept. 20), and references therein.
on
Copyright © 2012 SciRes. ACS
F. ZAGURY 511
dest part of the horizon, but the article nevertheless sug- gests that ozone, which absorbs the orange-green part of the spectrum, plays a role in the red color of the sky as central as for blue twilights. The article also proved that contrary to widespread opinion observed spectra of scat- tered sunlight can indeed be analyzed and quantified in the same way as extinguished sunlight is, independently from a modeling of the atmosphere. The obvious advan- tage is to free the conclusions from arbitrary inputs, either parameters such as column densities of nitrogen or ozone along the path of light, which are precisely the quantities observation should retrieve, or the specific geometry of the scattering and the structure of the atmosphere, which are always difficult to ascertain.
Few such studies exist. Twilight spectra observed at the Mount Paranal ESO Observatory (Chile) by Patat et al. [21] highlight the importance of ozone, but the au- thors made no attempt to retrieve quantitative informa- tion from their spectra. A more consistent analysis of sky spectra observed with an Ocean Optics portable spec- trometer was recently published by D. Fosbury, G. Koch, and J. Koch [22].
Occultation observations of stars (Figure 1), or the early blue sky observations by Wulf, Moore, and Melvin [17], show how powerful a tool spectral observations can be in the analysis of sunlight (extinguished or scattered) viewed from the earth. The present study furthers the work initiated in [19,20] to characterize extinguished and scattered sunlight from their spectrum. The observa- tions are described in Section 2. Basic properties of ex- tinguished sunlight are recalled in Section 3. Sections 4-6 analyze the properties of spectra of blue and red skies. These results are discussed in Section 7.
2. Observations
The spectrometer used is a miniature Ocean Optics USB2000 VIS-NIR portable fiber spectrometer. On several occasions between June 2010 and March 2011, spectra were re- corded on a portable computer. Sunsets, sunrises, blue day- time and twilight skies, were repeatedly observed from different locations in New England (USA). For sunsets and sunrises I focused on the variations with time of the spectrum, which provided the reasons of the change of color in the sky and the best fit to apply to the spectra. The consistency of the red spectra was checked against sunrise spectra (with a 1.2" spatial resolution) observed with the 1.5 m telescope of the Fred Whipple Observa- tory (USA). Blue skies were observed at several dis- tances from the sun and different elevations. The spectra selected for the article are representative of different sky colors and offer a consistent picture of the reasons why a sky turns from blue to red.
The spectral resolution is 2 Å. The instrument sensi-
tivity is limited compared to more sophisticated models but proved to be sufficient for the sky observations, as long as they were not too bright (no direct light from the sun) and not too dimmed (no night sky). The fiber’s aper- ture is given to be 25˚; in practice the fiber is reactive to direction of a source of light which contrasts with its surrounding, which is the case at sunrise or sunset. Ex- posure time varied from 0.1 s (blue skies) to 60 s (first twilit spectra at sunrise).
Plots are limited to the 400 - 900 nm (1.1 - 2.5 μm−1) region. The spectra are presented on an arbitrary scale set to be 1 at 2.5 μm−1 (400 nm) for the blue zenith sky spec- trum of Figure 2.
3. Extinction of Direct Sunlight
At visible wavelengths a beam of light crossing a clear (no cloud) atmosphere experiences three major sources of extinction (Figure 1): Rayleigh and aerosol extinc- tions and ozone absorption. The spectrum S0 of sunlight observed through a layer of atmosphere is attenuated by a factor
43 3
0
e e ep
O O
a bNS
TS
TS
(1)
and the spectrum of the sun in any location in the atmo- sphere must be 0 . In Equation (1) the exponentials stand for Rayleigh extinction by nitrogen, aerosol extinc- tion, and ozone absorption.
3O is the ozone column density along the path of sunlight,
3O
N is the wave-
length dependent ozone absorption cross-section.
Aerosols provide the ep
b
term of Equation (1), b being proportionate to the column density of aerosols along the path of sunlight, from outside the atmosphere to the point of observation. Aerosols scatter and extin- guish light as 1/λp, with p close to 1 (p ≈ 1.3, [24,25]); scattering by aerosols is strongly oriented in the forward direction.
In 1871 Rayleigh [1] first attributed the blue of the sky to scattering of sunlight by small (compared to the visible wavelengths) particles and showed that the scattering law must vary as 1/λ4. Rayleigh also established that the ir-radiance of scattered (by small particles) and direct lights from the sun should be in the ratio
4
40
1e
aI
RI
2
35N / 2.45 10N a
(2)
In 1899 Rayleigh finally concluded the small particles were air molecules [2]. In contradistinction with aerosol scattering, Rayleigh scattering is quasi-isotropic. Coef- ficient a in Equations (1) and (2) can be converted to ni-trogen column density by cm−2 [23].
Copyright © 2012 SciRes. ACS

F. ZAGURY 512
Hartley, and Chappuis to a lesser extent, suggested an alternative to Rayleigh’s theory, absorption by ozone. Chappuis in his 1882 memoir [6] identifies a quasi-con- tinum of ozone absorption between 500 nm and 660 nm, now known as the Chappuis bands (Figure 1). He notes that “la couleur bleue caractérise l’ozone aussi sûrement que son odeur... La couleur que possède alors le gaz rap- pelle la couleur bleue du ciel”4. Low resolution spectro- scopic observations by Wulf, Moore, and Melvin in 1934 [17] confirmed the presence of the Chappuis bands in blue twilight skies but not, or too weakly to be detected, in blue daylight.
The occultation spectrum of Figure 1 was observed under a much larger air-mass than sun-rays experience when the sun is above the horizon. In day-time and in the visible wavelength range the extinction of sunlight in the atmosphere is much weaker: the Chappuis bands, with column densities between 5.1018 cm−2 and a few 1019 cm−2,
Figure 1. A GOMOS (Global Ozone Monitoring by Occul- tation of Stars) occultation spectrum of star Sirius at a tangent altitude of 14780 m (courtesy of J.-P. Bertaux and L. Blanot, Service d’Aéronomie, Verrières-le-Buisson, France). Bottom dotted spectrum is the ratio F ★ /F0 (
are imperceptible5; the modification of the spectrum’s slope by Rayleigh extinction is also small, must not exceed a few 1032 cm−2.
2NN
It is only when the sun is close to the horizon that ozone absorption is large enough to produce the large depression between 1.4 and 2.2 μm−1 on Figure 1. The column density of ozone along the optical path of sun- rays can rise to a few 1020 cm−2 [20]. The other important
effect is Rayleigh extinction (4
ea
2
3N
3 21.2 10 cmN
in Equation (1)) which bends the blue side of the spectrum (green trace of Figure 1). Aerosol extinction acts as a lever and changes the average slope of the spectrum (black exponential trace on Figure 1). This change is however marginal in that it does not modify, as shown by the comparison of the green and red-dotted traces of Figure 1, the spectrum of the sun as much as Rayleigh extinction or ozone ab- sorption do. In practice and from consideration of a spec- trum alone aerosol extinction is difficult to disentangle from Rayleigh extinction unless it is large enough to modify the slope of the spectrum at low wave-numbers.
4. Blue Sky
Figure 2, left frame, plots spectra of different types of blue skies: three blue day-time spectra (traces (1)) in dif- ferent directions observed in the mid-afternoon (3~P.M. local time, observations of August 28, 2010), the sun is then well above the horizon; and two twilight blue sky spectra, one on the horizon 180˚ from the sun and one at the zenith observed 5 minutes later (observations of Oc- tober 11, 2010). As found by Wulf, Moore, and Melvin [17] the major difference between daylight and twilight blue skies is the presence of ozone in the latter spectra.
Analytically the blue sky spectra of Figure 2 deduce one from the other by a T-transformation of Equation (1) (Figure 2, right plot), and differ by the amount of Rayleigh extinction, ozone absorption, and aerosol exitinc- tion, sun-rays have experienced on their way through the atmosphere. Zenith spectrum (1) (upper trace) is well fitted (yellow spectrum of Figure 2) by the spectrum of the sun6 times a Rayleigh function R (Equation (2)) with exponent a = 0.005 ( ). The generic
analytical expression of a blue sky spectrum is therefore
T in Equation (1)) of the spectrum of Sirius observed through and outside of the atmosphere. The red plain curve is the fit (ozone + Rayleigh + aerosol extinction) of the occultation.
Aerosol extinction ( , 1.3, .p
b
p b
2 , 0.075a 2010
0 45
3ON
e ) changes (slightly) the slope of the spectrum (upper black trace). The green dotted trace shows the effect of Rayleigh extinction alone
). The dotted red trace is F★/F0
corrected for ozone absorption ( cm−2
2
3N
4cm2.10N
3.9
1.4 × 10⁴ D.U.).
04
1TS
.
Ozone and nitrogen column densities for each spec- trum are given in Table 1. Aerosol extinction could not be separated from Rayleigh extinction and aerosol co- lumn densities are omitted. Ozone is undetectable in the zenith daylight spectrum and must be less than 1019 cm−2. The two following daylight spectra observed in the counter direction of the sun at about 45˚ and 60˚ from the 4“Blue color characterizes ozone as certainly as its odor... The color of
the gas then reminds one of the blue color of the sky.” 5Typical zenithal ozone column densities are of order 1019 cm−2, 370 D.U.
6The spectrum of the sun was provided by G. Thuillier [26].
Copyright © 2012 SciRes. ACS

F. ZAGURY
Copyright © 2012 SciRes. ACS
513
zenith have comparable nitrogen column densities and a light ozone absorption (≈ 2.1019 cm−2, 750 D.U.). For the horizon and zenith twilight spectra ozone column den- sities are about a factor of ten higher.
in the reddest region of the horizon. There is an average of 20 minutes interval between the three observations, start- ing with spectrum (6), when sunlight first appears. The sun is below the horizon. The steepness of the spectra, given by the relative weight of their red and blue parts, decreases as sun rises and is due to Rayleigh extinction. The simultaneous diminution of ozone absorption in the
5. The Red Color of the Sky
Spectra (4)-(6), of Figure 3 are sunrise spectra observed
Table 1. Spectra characteristics (ozone absorption, rayleigh extinction).
R(d) (b )
3ON (c )
2NN
a (1/λ)max λmax
n˚(a) Sky type
1019 cm−2 102 D.U. 1032 cm−2 μm4 μm−1 nm
(1) Blue day-time 1 4 12 0.005 3.76 270
(2) Blue horizon (twilight) 16 60 130 0.053 2.08 480
(3) Blue zenith (twilight) 14 52 44 0.018 2.73 370
(4)(e) Pink horizon (twilight) 18 66 320 0.130 1.66 600
(5)(e) Reddish horizon (twilight) 30 110 460 0.190 1.51 660
(6)(e) Red horizon (twilight) 34 126 500 0.200 1.46 670
(a) Spectrum number in the figures. (b) Approximate ozone column density along the path of sunrays from outside the atmosphere to the observer. (c) Approximate nitrogen column density along the path of sunrays from outside the atmosphere to the observer. (d) Parameters of the rayleigh function R (Equation (2)): value of a, of 1/λ and λ at maximum. FWHM are 0.59(1/λ)max and 0.66λmax for R(1/λ) and R(λ) respec-
tively. (e) Spectra (4)-(6) are part of a series of over fifty consecutive spectra observed between 6 and 7 A.M. on October 11, 2010. Exact times of observations are:
6:12, 6:29, 6:50 for spectra (6), (5), and (4). Exposure times are 60s, 10s, 0.2s.
Figure 2. Blue sky. Left: three mid-afternoon blue sky spectra (top traces (1)), a twilight blue horizon in the direction oppo-site to the sun (2) and a zenith spectrum observed a few minutes later (3). The top trace is a zenith spectrum, the two dotted spectra were observed in the anti-solar direction at 60˚ and 30˚ elevation. The top red dashed line is a fit of the zenith blue
sky spectrum by Rayleigh scattering of sunlight (40.005
4
1e λ
λ S0). Right: blue spectra deduce one from the other (here spec-
tra (1) and (2) are fitted by spectrum (3) corrected for ozone absorption and Rayleigh scattering, in blue) by a transformation T, Equation (1). The two dashed blue spectra are spectrum (3) which has been re-scaled. Ozone column densities for spectra 2) and (3) are of order (see Table 1) 1.5 × 1020 cm−2 (5.5 × 10³ D.U.). (
F. ZAGURY 514
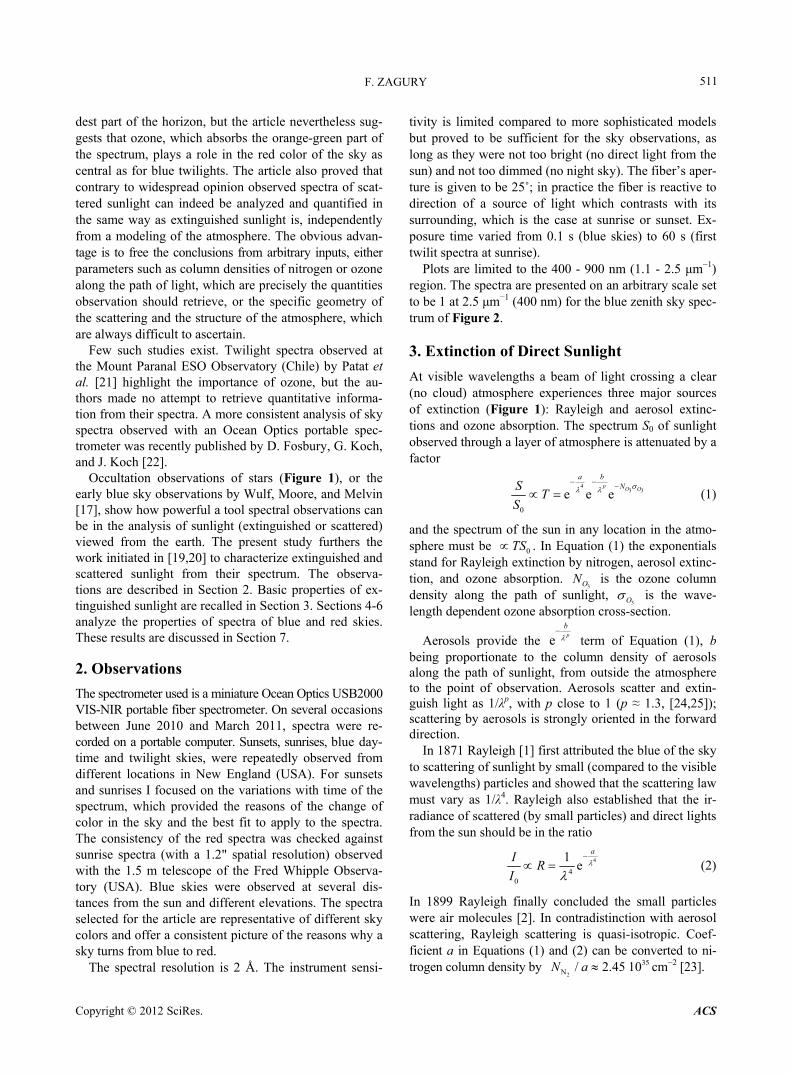
Figure 3. Sunrise spectra. Three sunrise spectra from very red (6) to pink (4). The two dotted red spectra are spectrum (6) which has been re-scaled to be compared to spectra (5) and (4). Chappuis bands enlarges the red bump and moves its central wave-number towards the blue (right plot of Figure 4). In the same time the color of the horizon turned from red (spec- trum 6) to pink (spectrum 4). The red color of the sky in these observations results from Rayleigh extinction which diminishes the blue part of the spectrum, and from ozone absorption which isolates the red bump on its blue side and shifts its central wavelength towards the red. As for blue skies all red horizons deduce one from the other by a T-transformation (Figure 4). The associated Rayleigh and ozone column densities along the path of light are given in Table 1.
6. From Blue to Red Skies
Figure 5 is a summary of typical sky spectra that can be observed during a clear day. They are ordered by de- creasing average slope and have been arbitrarily rescaled. The progressive change of color of the sky from blue daylight (spectrum (1)) to blue twilight (spectra (2) and (3)), pink (spectrum (4)), and red (spectrum (6)), is mainly due to Rayleigh extinction and ozone absorption.
The blue color of the sky in day-time (top spectrum (1) on Figure 5) is Rayleigh scattering by nitrogen of weakly attenuated sunlight. It is modified at twilight, when the sun is close to the horizon, because of ozone absorption which separates the red and blue sides of the spectrum (Figure 5, spectra (2) and (3)).
The much larger path of sunrays along the horizon at sunset or sunrise dramatically increases ozone absorption and Rayleigh extinction. The maximum of the Rayleigh function R (Equation (2)), which was in the UV or in the near-UV for blue skies (Table 1), is moved to the longer wavelengths (smaller wave-numbers). For spectrum (6) this maximum is close to 1.65 μm−1 (600 nm, spectrum (7) in Figure 6). Without ozone the color of the sky would be that of spectrum (7), in the orange, as antici- pated by Bohren and Fraser [16], and cannot alone ex- plain the red color of the sky. Ozone provokes the large depression between spectra (6) and (7) which isolates the red bump centered at 1.3 μm−1 (770 nm) and is responsi- ble for the red color of the sky.
The ozone Chappuis bands absorb the green-orange part of the spectrum and have two roles in the color of the sky. For not too high optical depths they turn blue daylight into blue twilights, as it has generally been
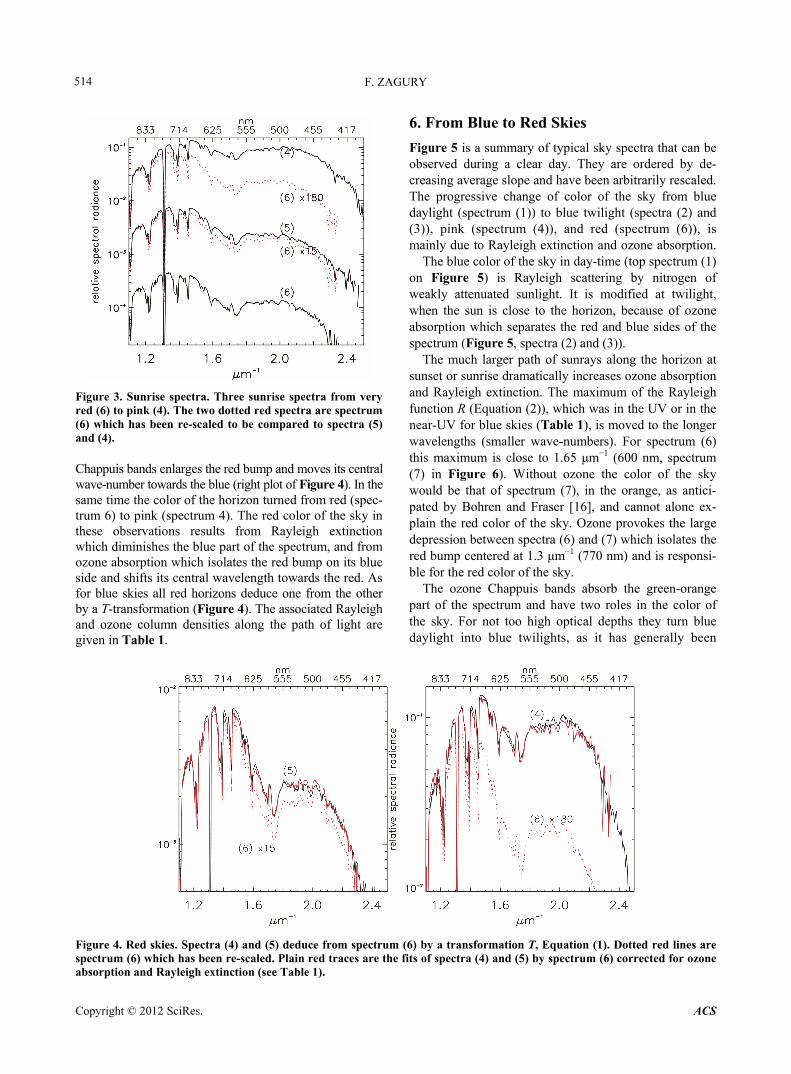
Figure 4. Red skies. Spectra (4) and (5) deduce from spectrum (6) by a transformation T, Equation (1). Dotted red lines are spectrum (6) which has been re-scaled. Plain red traces are the fits of spectra (4) and (5) by spectrum (6) corrected for ozone absorption and Rayleigh extinction (see Table 1).
Copyright © 2012 SciRes. ACS

F. ZAGURY 515
Figure 5. From blue to red skies. Spectra of blue daylight (1), blue twilight ((2) and (3)), pink (4), and red (6), colors of the sky. The spectra have been arbitrarily re-scaled and ordered by decreasing slope from top to bottom. They de- duce one from the other by a transformation T (Equation
(1)), and are 4
1
λ TS0. The red bump moves to the left
(thus to the red) as ozone column density and Rayleigh ex- inction increase. t
Figure 6. Spectrum (7) is spectrum (1) (blue afternoon sky) with an additional Rayleigh extinction ( 5 × 1034 cm−2).
Absorption between spectra (7) and (6) in the Chappuis
bands ( cm−2 12.6 × 10³ D.U.) gives the
red color of the horizon.
N 2N
20103O
N
3.4 N
foreseen. But when Rayleigh extinction is large enough to inverse the slope of the spectrum in the blue, ozone
absorption also isolates the red bump of spectrum (6) and gives a major contribution to the red color of the sky.
7. Discussion
The purpose of these investigations was to provide a comprehensive understanding of the color of the sky. Spectral observations keep the signature of the media crossed by light. Spectroscopy of the sky at different times of the day shows that the relevant parameters that describe the color of a clear sky are the same that deter-mine the extinction of sunlight: the exponents a, b,
3O which enter in the expression of the T function of Equa- tion (1). The large variety of spectra that can be observed indicates that the color of the sky is far more nuanced than what the eye perceives. This panoply of colors is however limited by the presence of ozone which sup- presses the orange-green part of the spectrum, when the sun is low on the horizon.
The Rayleigh function R of Equation (2) has a bump- like shape resembling that of spectrum (7) (Figure 6). As long as blue wavelengths lay on the low column density side (the 1/λ4 low optical depth rise) of R the sky is blue, with nuances that depend on the mean slope of the spec- trum (due to Rayleigh and aerosol extinction) and on the column density of ozone along the path of light. The sky turns to red colors when Rayleigh extinction becomes large enough to shift the maximum of R (Table 1) in the visible wavelength range and the blue wavelengths on
the exponentially (the 4
ea
term in R) decreasing side of the spectrum. The increase of Rayleigh extinction is accompanied by an increase of ozone absorption which isolates the red part of the spectrum and shifts its maxi- mum to the red. Without ozone the sky on the horizon would take orange to green colors (depending on where the maximum of R falls). One must therefore conclude that ozone, because of the critical position of the Chap- puis bands in between the blue and the red wavelengths, gives the final red color of the sky at sunset or sunrise.
The generic analytical expression of the spectrum of a
clear daylight sky is4
1
TS0. Scattered sunlight re-
ceived by an observer on earth can be considered as the result of two operations, extinction of sunlight across the atmosphere and single Rayleigh scattering. It may hap- pen that two components are necessary to represent spe- cific observations, for instance a blue component may need to be added to a red spectrum in transition direc- tions between red and blue skies [19]. But a red horizon spectrum like spectrum (6) of Figure 5 is not the sum of two components as its appearance might suggest.
Ozone absorption and Rayleigh extinction are the two major processes involved in the color of a sky illumi- nated by the sun. These observations did not highlight a significant role of aerosols in common daylight colors.
Copyright © 2012 SciRes. ACS

F. ZAGURY 516
The aerosol extinction term e in Equation (1) is probably small and could not be disentangled, in these observations, from the change of slope due to Rayleigh extinction. It can only diminish the steepness of the 1/λ4 rise of Rayleigh scattering, and the impression of red with it, which is not what is observed. But the analysis of sun occultation spectra [20] proves that before the sun completely sets its light is progressively replaced by sunlight forward-scattered by aerosols. If this light was in turn scattered by nitrogen in the direction of the observer, the wavelength dependence of the spectrum at small wave-numbers would be 1/λ5 instead of 1/λ4. The red side of the spectrum would be steepened, and the im- presssion of red increased. In a cloudy sunrise or sunset aerosol scattering that follows Rayleigh extinction would have the same effect. Therefore the possibility that aero- sols contribute to the red color of the sky at the very be- ginning of a sunrise, in the latest part of a sunset, or under a cloudy sky, cannot be ruled out. Evidence of this phe- nomenon would require observations with a larger wave- length coverage of the near-infrared spectrum.
p
b
The analytical representation of the spectra and the way they transform one into the other excludes any sig- nificant participation of multiple scattering in the color of the sky. This is not surprising given that Rayleigh scat- tering is, in contradistinction with forward scattering by aerosols, nearly isotropic. The lost of photons over all directions after each scattering renders multiple Rayleigh scattering a particularly inefficient process.
Molecular absorption by molecules other than ozone consists in local interruptions of the spectra, is marginal except for the strong water bands, and was neglected. Water vapors are important at sunrise (spectra (4)-(6)) but do not appear to influence significantly the color of the sky.
These observations could be improved in several ways, especially by extending the wavelength coverage in the infrared. By combining photography with spectral ob- servations of the sky and a more systematic planning of observations, the link between spectra and the palette of colors of the sky would be better captured. Finally a long lasting and controversial issue, the green-flash, which is also observed when the sun is low on the horizon, could hopefully be solved with spectroscopy. All these issues suggest interesting research projects that can be studied from the college level on with a relatively inexpensive equipment.
REFERENCES [1] L. Rayleigh, “On the Light from the Sky, Its Polarization
and Color,” Philosophical Magazine, Vol. 41, 1871, pp. 107-120.
[2] L. Rayleigh, “On the Transmission of Light through an Atmosphere Containing Small Particles in Suspension
and on the Origin of the Blue of the Sky,” Philosophical Magazine, Vol. 47, 1899, pp. 375-384.
[3] A. Lallemand, “Sur la Polarisation et la Fluorescence de I’Atmosphère,” Comptes Rendus de I’Académie des Sci-ences, Vol. 75, 1872, pp. 707-711.
[4] W. N. Hartley, “On the Absorption of Solar Rays by At-mospheric Ozone,” Journal of the Chemical Society, Vol. 39, 1881, pp. 111-128.
[5] J. Chappuis, “Sur le Spectre d’Absorption de I’Ozone,” Comptes Rendus de I’Académie des Sciences, Vol. 91, 1880, pp. 985-986.
[6] J. Chappuis, “Etude Spectroscopique de I’Ozone,” Com- ptes Rendus de I’Académie des Sciences, Vol. 11, No. 2, 1882, pp. 137-186.
[7] P. Brimblecombe, “Aerosols and Air Pollution in Art,” Proceedings of the Symposium on the History of Aerosol Science, Wien, 31 August-2 September 2000, pp. 11-24.
[8] R. B. Husar, “Atmospheric Aerosol Science before 1900,” Proceedings of the Symposium on the History of Aerosol Science, Wien, 31 August-2 September 2000, pp. 25-36.
[9] H. C. van de Hulst, “A Historical Sketch of Light Scat-tering by Small Particle,” Proceedings of the Symposium on the History of Aerosol Science, Wien, 31 August-2 September 2000, pp. 69-76.
[10] R. L. Lee, W. Meyer and G. Hoeppe, “Atmospheric Ozone and Colors of the Antarctic Twilight Sky,” Applied Optics, Vol. 50, No. 28, 2011, pp. 162-171. doi:10.1364/AO.50.00F162
[11] E. O. Hulburt, “Explanation of the Brightness and Color of the Sky, Particularly the Twilight Sky,” Journal of the Optical Society of America, Vol. 43, No. 2, 1953, pp. 113-118. doi:10.1364/JOSA.43.000113
[12] G. V. Rozenberg, “Twilight: A Study in Atmospheric Optics,” Plenum Press, New York, 1966.
[13] J. V. Dave and C. L. Mateer, “The Effect of Stratospheric Dust on the Color of the Twilight Sky,” Journal of Geo-physical Research, Vol. 73, No. 22, 1968, pp. 6897-6913. doi:10.1029/JB073i022p06897
[14] C. N. Adams, G. N. Plass and G. W. Kattawar, “The In-fluence of Ozone and Aerosols on the Brightness and Color of the Twilight Sky,” Journal of Atmospheric Sci-ence, Vol. 31, No. 6, 1974, pp. 1662-1674. doi:10.1175/1520-0469(1974)031<1662:TIOOAA>2.0.CO;2
[15] E. J. McCartney, “Optics of the Atmosphere,” John Wiley and Sons, New York, 1976.
[16] C. F. Bohren and A. B. Fraser, “Color of the Sky,” Phys- ics Teacher, Vol. 23, No. 5, 1985, pp. 267-272. doi:10.1119/1.2341808
[17] O. R. Wulf, A. F. Moore and E. H. Melvin, “Note: The Atmospheric Ozone Absorption in the Visible Spectrum,” Astrophysical Journal, Vol. 79, 1934, pp. 270-272. doi:10.1086/143534
[18] D. C. Giancoli, “Physics for Scientists and Engineers Upper Saddle River,” Pearson Prentice Hall, Upper Sad- dle River, 2008.
Copyright © 2012 SciRes. ACS

F. ZAGURY
Copyright © 2012 SciRes. ACS
517
[19] F. Zagury and M. Fujii, “Spectral Analysis of Red Scat- tered Sunlight at Sunrise,” New Astronomy, Vol. 8, No. 6, 2003, pp. 549-556. doi:10.1016/S1384-1076(03)00048-4
[20] F. Zagury and F. Goutail, “Spectral Analysis of Extin- guished Sunlight,” New Astronomy, Vol. 8, No. 6, 2003, pp. 537-548. doi:10.1016/S1384-1076(03)00047-2
[21] F. Patat, O. S. Ugolnikov and O. V. Postylyakov, “TUB- VRI Twilight Sky Brightness at ESO-Paranal,” Astron- omy and Astrophysics, Vol. 455, No. 1, 2006, pp. 385- 393. doi:10.1051/0004-6361:20064992
[22] R. Fosbury, G. Koch and J. Koch, “Ozone: Twilit Skies, and (exo-)Planet Transits,” The Messenger, Vol. 143, 2011, pp. 27-31.
[23] M. Sneep and W. Ubachs, “Direct Measurement of the Rayleigh Scattering Cross Section in Various Gases,” Journal of Quantitative and Spectroscopic Radiative Transfer, Vol. 92, No. 3, 2005, pp. 293-310.
doi:10.1016/j.jqsrt.2004.07.025
[24] A. Ångström, “Techniques of Determining the Turbidity of the Atmosphere,” Tellus, Vol. 13, No. 2, 1961, pp. 214-223. doi:10.1111/j.2153-3490.1961.tb00078.x
[25] G. E. Shaw, J. A. Reagan and B. M. Herman, “Investiga- tions of Atmospheric Extinction Using Direct Solar Ra- diation Measurements Made with a Multiple Wavelength Radiometer,” Journal of Applied Meteorology, Vol. 12, No. 2, 1973, pp. 374-380. doi:10.1175/1520-0450(1973)012<0374:IOAEUD>2.0.CO;2
[26] G. Thuillier, et al., “The Solar Spectral Irradiance from 200 to 2400 nm as Measured by the SOLSPEC Spec- trometer from the ATLAS and EURECA Missions,” So- lar Physics, Vol. 214, No. 1, 2003, pp. 1-22. doi:10.1023/A:1024048429145


![Osprey - Colour Series - Sky Truck 2 [Osprey Color]](https://img.pdfslide.net/doc/110x75/545d6543b0af9fb32c8b5093/osprey-colour-series-sky-truck-2-osprey-color.jpg)