Embed Size (px)
Citation preview
A Matter of BalanceHave you mastered the analytical balance?
2 Incognito A Matter of Balance
Incognito continues with his “back to basics” focus. This time is the turn of the analytical balance.
Cover Story
Features
18 Extending the Compatible Analyte Volatility Range for Indoor Air Quality and Material Emissions Testing Using Multi-Bed Thermal Desorption Tubes Caroline Widdowson and David Barden, Markes International This article describes sampling methodology for thermal desorption–gas
chromatography (TD–GC) that can extend the compatible analyte range of tests used to determine chemicals released from materials, as well as associated indoor air quality measurements.
9 Emerging Trends in Pharmaceutical Analysis Benedetto Natalini of the University of Perugia, Italy, spoke to Bethany Degg of The Column about the driving forces in pharmaceutical analysis, including the importance of regulation, chirality, and miniaturization.
Regulars7 News
Prof ling PBDEs in Baltic Sea f sh, detecting bromethalin poisoning in animals, and ensuring the safety of New Zealand shellf sh are featured this week.
13 GC Troubleshooting in Petrochemical Analysis Stephen Harrison, Linde Gases A guide to simple troubleshooting steps in gas chromatography (GC) with an emphasis on petrochemical analysis.
22 CHROMacademy
Find out what’s new on the professional learning site for chromatographers.
23 Training Courses and Events
24 Staff
30 March 2015 Volume 11 Issue 5
� � � � � � � ���� � � � ���� � �� � ��
�:%81��/%−��)(−� ∋−)1∋)��%0386
�/%175−6%17����!��������∃���∀�
� �� � ������ �������� ����� ������ �����������
� � � � � � � ���� � � � ���� � � � ����
��������)1:22(��2%(���−1∋−11%7−
����������∀ �
� � ����������72//�∗5)) ���� ����������
� � � � � � � ���� � � � ���� � �� ��
∋,/)8661)5675%66)������������)8��6)1&85+
�5%1.∗857���)50%1;
� � �� ��� ������� ���� �� ��� ���������
#25/(�/)%()56�−1�−1129%7−9)�!���� ∗25����%1(���<��
�)/−9)5−1+�7,)�6)16−7−9−7;��352(8∋7−9−7;�
%1(�5)/−%&−/−7;�;28�1))(�72�029)�
;285�&86−1)66�∗25:%5(
)148−5−)6�0%5.)6�∋20:::�0%5.)6�∋20
ES586847_LCTC033015_cvtp1.pgs 03.20.2015 20:57 ADV blackyellowmagentacyan
A Matter of Balance
Have you mastered the analytical balance?
2 Incognito A Matter of Balance
Incognito continues with his “back to basics” focus. This time is the turn of the analytical balance.
Cover Story
Features
18 Extending the Compatible Analyte Volatility Range for Indoor Air Quality and Material Emissions Testing Using Multi-Bed Thermal Desorption Tubes Caroline Widdowson and David Barden, Markes International This article describes sampling methodology for thermal desorption–gas
chromatography (TD–GC) that can extend the compatible analyte range of tests used to determine chemicals released from materials, as well as associated indoor air quality measurements.
9 Emerging Trends in Pharmaceutical Analysis Benedetto Natalini of the University of Perugia, Italy, spoke to Bethany Degg of The Column about the driving forces in pharmaceutical analysis, including the importance of regulation, chirality, and miniaturization.
Regulars7 News
Prof ling PBDEs in Baltic Sea f sh, detecting bromethalin poisoning in animals, and ensuring the safety of New Zealand shellf sh are featured this week.
13 GC Troubleshooting in Petrochemical Analysis Stephen Harrison, Linde Gases A guide to simple troubleshooting steps in gas chromatography (GC) with an emphasis on petrochemical analysis.
22 CHROMacademy
Find out what’s new on the professional learning site for chromatographers.
23 Training Courses and Events
24 Staff
30 March 2015 Volume 11 Issue 5
ES586848_LCTC033015_001.pgs 03.20.2015 20:57 ADV blackyellowmagentacyan
2
Incognito2 News7 Q&A: Natalini9 Harrison137 99Widdowson and Barden18 CHROMacademy22 Training & Events23 Staff242222 2323
A Matter of BalanceIncognito continues with his “back to basics” focus. This time is the turn of the analytical balance.
It’s happened again. Following hot on
the heels of “Pipette-gate” at the end of
last year,1 I’ve been involved in another
dispute regarding the validity of a basic
laboratory skill. This time it’s the turn of
measurement of mass. Because my previous
article on the use of pipettes sparked so
much debate and interest, I thought this a
good opportunity to start another global
difference of opinion on the use of balances
within the analytical laboratory.
Starting with the same question as last
time — “Who legislates on the correct use of
balances in the analytical laboratory?” — ask
yourself who wrote your standard operating
procedure (SOP) on the use of analytical
balances to determine mass (not weight!)?
Which source was used to inform and guide
the author to ensure best practice was
taken into account as well as any regulatory
guidelines? Is the SOP always followed?
There are several regulations or regulatory
bodies that advise on the correct use of
balances; however, those which I use as
the de facto standards are USP Chapter 41
<Balances>,2 USP Chapter 1251 <Weighing
on an Analytical Balance>,3 and ISO
17025 Lab14 Calibration of Weighing
Machines (Edition 4 November 2006).4
Those of you who follow these things will
know that USP Chapter 41 changed in
December 2013 (after some 20 years in its
previous version), and that it is mandatory
in the pharmaceutical industry when
testing to USP standards. USP <1251> is a
guideline, mainly dealing with installation
qualif cation/operational qualif cation/
performance qualif cation (IQ/OQ/PQ)
matters and outside the scope of our
discussion here.
Let me highlight some of the issues that I
have seen in the determination of mass, one
of which was the cause of this latest dispute
on the correct use of an analytical balance.
Unlike the previous article on pipetting
I’m not going to formulate an imaginary
“perfect” SOP for balance use. It should
be reasonably straightforward to assemble
a reasonable SOP from a reference source,
even if this is the manufacturer’s instruction
manual. Instead I’m going to highlight
issues that are often not covered in SOPs,
common mistakes, and bad practice in the
measurement of mass.
General Weighing Practices
Location: Balances should be located
away from sources of heat (out of direct
Ph
oto
Cre
dit
: Ele
me
nta
lIm
ag
ing
/Ge
tty I
ma
ge
s
ES586853_LCTC033015_002.pgs 03.20.2015 20:58 ADV blackyellowmagentacyan
The Column www.chromatographyonline.com
sunlight and away from radiators or air
conditioning units) and in a position
where temperature does not f uctuate
considerably (typical temperature drift is
1–2 ppm/ºC). You should know how to
calculate the temperature coeff cient for
sensitivity of your balances should you
ever need to apply a correction factor! The
balance should be placed in the corner of
a room to ensure the least vibration, and
should be away from doors, windows, or
air conditioning units that can cause air
draughts. Ideally, balance tables should be
made of stone (should at least not suffer
from sag or vibration); be anti-magnetic (no
steel in the construction); and anti-static
(no plastic or glass). The balance should
be level (check bubble indicator before
each weighing session), and, if adjustment
is necessary, the balance should be
recalibrated (internal sensitivity adjustment)
before use.
Standby versus Power Off: Note that
if a balance has been powered off (rather
than put into standby mode), it may
take between one hour and one day to
“acclimatize” and you should consult your
balance literature for the recommended
time. If in standby mode, the balance may
be used once the internal calibration routine
is complete (where appropriate), or once a
stable reading is achieved with nothing on
the balance pan. It is good practice when
beginning a series of weighings to load
the balance pan, unload it again, and then
tare before beginning to avoid an “initial
weighing effect”.
Humidity: The humidity of the balance
location should be between 40% and
60% relative humidity (RH). High humidity
can lead to condensation and adsorption
of water; low humidity risks increased
electrostatic interference. If the balance
reading constantly drifts in one direction
or is not repeatable between weighings of
the same sample, use an anti-static gun,
metal receiver, or a balance with antistatic
ionizing blowers. Also note that changes in
humidity can affect air buoyancy (see later).
Sample Handling: The balance pan and its
surroundings should be free from powders
and liquids and should be brushed clean or
dried and recalibrated if found in a dirty state.
Use the smallest weighing vessel possible
to reduce the effect of f ow forces, don’t
touch with bare f ngers (skin oil residues
can reduce weighing accuracy), and use a
receiver with a smaller rather than a wider
neck to help prevent evaporation. Avoid
using plastic weighing vessels or receivers
because they are more susceptible to
electrostatic effects.
Ensure the sample is temperature
equilibrated with the weighing
Incognito
3
Incognito2 News7 Q&A: Natalini9 Harrison137 99Widdowson and Barden18 CHROMacademy22 Training & Events23 Staff242222 2323
Think of these instruments as your Tools for Macromolecular Characterization
A grocery scale is your go-to tool for weighing apples and oranges—you wouldn’t consider buying produce in a grocery store without
one! To determine the molar masses of your poly-mers or biopolymers in solution, the essential lab tool is a DAWN® or a miniDAWN™ Multi-Angle Light Scattering (MALS) detector connected to your favor-ite GPC/SEC. In fact, Wyatt Technology provides an entire biophysical characterization toolbox covering the macromolecular and nanoparticle essentials: mo-lar mass, size, charge and interactions.
The toolbox includes the high-throughput DynaPro® Plate Reader, for making thousands and thousands of unattended Dynamic Light Scattering (DLS) measurements to assess size, aggregation and stability of your samples.
Wyatt’s Möbius® instruments are the most sensi-tive on earth for gently —yet quickly—determining the zeta potential and charge on your molecules or QDQRSDUWLFOHV��LQ�IRUPXODWLRQ�EX�HU��'LG�ZH�PHQWLRQ�
that it can be automated via an autosampler? And our unique Calypso® Composition-Gradi-
ent system enables you to investigate interactions in solution without labeling or immobilization, to deter-
PLQH�ELQGLQJ�D�QLW\�DQG�absolute complex stoichi-ometry of self- and hetero-associating biomolecules.
Our customers undergo intensive days of train-ing at Light Scattering University® in Santa Barbara, that earns them a Masters in Light Scattering diplo-ma. All work and no play? After a long day’s work we spoil our customers with gourmet dinners and award-winning accommodations.
Still not convinced? Search our on-line bibliog-raphy consisting of thousands of published refer-ences that rely on our tools (more than 10,000 at last count). An expert sample-analysis laboratory is at your disposal, too, in order to see which measure-ments are best.
So what are you waiting for? Open the box and select your next essential biophysical characterization tool! Find us at www.wyatt.com.
09
8
1
7
65
4
3
2
Molar Mass
Charge
SizeInteractions
SEC - MALS • FFF - MALS • CG - MALS • DLS • MP - PALS
Molar Mass • Size • Charge • Interactions
ES586854_LCTC033015_003.pgs 03.20.2015 20:58 ADV blackyellowmagentacyan
The Column www.chromatographyonline.com
environment. Samples that are too cold
will register a higher mass and vice versa
for warm samples. The readout may be
unstable if samples are not thermally
equilibrated and air buoyancy effects will
be markedly increased. Warm samples may
also suffer from evaporation.
If weighing hygroscopic materials, ensure
that the container closure is in place and that
the receiving vessel is as narrow as possible
(for example, stoppered volumetric f ask).
Note that f ngerprints are hygroscopic!
Place the weighing vessel in the centre of
the balance pan, otherwise the result will
be skewed because of a phenomenon that
is known as “eccentricity” or “off-centre
loading error”.
Samples containing magnetic materials
(nickel, iron, steel, magnetic stirrer bars!!)
can affect the measurement of mass. In this
case, you may need to use antimagnetic
balance pans or increase the distance from
the pan to the magnetic sample by using an
upside down beaker. You will typically note
that balance readings are stable but not
repeatable for the same sample or when
positioning the sample at different positions
on the balance pan.
Balance Calibration
You should adjust the sensitivity of the
balance daily (usually via the balance
internal calibration algorithm) or when you
operate the balance for the f rst time; when
you change the location of the balance;
after levelling the balance; and after major
changes in temperature, humidity, or air
pressure.
Sensitivity is def ned as “change in the
output variable of a measuring instrument
divided by the associated change in the
input variable”. For a balance, this is
the change in the weighing value (mass
displayed) ∆W divided by the load variation
∆m (mass measured). Sensitivity is one
of the most important specif cations of a
balance and is typically determined from
the slope of the curve of mass measured
versus mass displayed over the nominal
range of the balance. Most analytical
balances have a built in calibration function
that can assess the sensitivity and linearity
of the instrument.
Adjustment for Gravity: The further a
mass is from the centre of the earth, the
lower the gravitational force action upon it.
A mass of 200 g measured on the ground
f oor will be 199.99937 g on the 10th
f oor — an error of 3.15 ppm. The further
a mass is from the equator, the lower the
centrifugal acceleration because of the
rotation of the earth that counteracts
gravitational force (around 92 ppm
per degree of latitude!). It is therefore
Incognito
4
Incognito2 News7 Q&A: Natalini9 Harrison137 99Widdowson and Barden18 CHROMacademy22 Training & Events23 Staff242222 2323
ES586855_LCTC033015_004.pgs 03.20.2015 20:58 ADV blackyellowmagentacyan
The Column www.chromatographyonline.com
important to calibrate balance sensitivity
in the balance location — especially after
moving the balance from one location to
another.
For highly accurate weighing, or when
comparative weighing is done on different
days, changes in environmental factors
must be considered. The sensitivity of the
balance is calibrated using weights
of 8.0 g/cm3 and when measuring the
mass of substances with different
densities, air buoyancy errors can arise.
A full treatment of this subject is outside
our scope here; however, changes in
atmospheric pressure, atmospheric
humidity, and temperature all require an
adjustment to be made for air buoyancy.
You can f nd a good reference source at
this link: http://www.npl.co.uk/upload/pdf/
buoycornote.pdf
Complying with USP General
Chapter <41> Requirements
USP Chapter 41 “repeatability” def nes the
starting point of a balance operating range:
• Perform 10 measurements with the exact
same weight. Use a single certif ed weight
(see ISO 17025 below) below 5% of the
balances nominal range.
• Calculate 2× standard deviation (SD)/
nominal value — the result should be
<0.10%.
• Calculate the starting point of the
operating range: 2 × SD × 1000.
• If SD <0.41 d, replace it by 0.41 d.
The coeff cient “d” is the measurement
interval or “readability”. Examples include:
• Microbalances: 1 d = 1 μg = 0.000001 g
(6-digit) (0.41 d = 0.41 μg)
• Semi-microbalances: 1 d = 0.01 mg
= 0.00001 g (5-digit) (0.41 d = 0.041 mg)
• Analytical balances: 1 d = 0.1 mg =
0.0001 g (4-digit) (0.41 d = 0. 41 mg)
So, if the standard deviation of the
determination of 10 measurements on your
analytical balance is <0.41 × d, then the
minimum weighable amount is 2 × 0.41 ×
0.1 × 1000 = 82 mg
This minimum weight should be
periodically assessed and is a unique feature
of each balance — not the balance type,
model, or manufacturer.
Accuracy: Balance accuracy must be
assessed using a test weight between 5%
and 100% of the balance capacity, and the
indicated reading should be less than or
equal to 0.1% of the test weight nominal
value. The test weight should have a
maximum permissible error of 0.03%.
One really important provision in USP <41>
states that: Unless otherwise specif ed, when
substances must be “accurately weighed” the
Incognito
5
Incognito2 News7 Q&A: Natalini9 Harrison137 99Widdowson and Barden18 CHROMacademy22 Training & Events23 Staff242222 2323
Chromatography Solutions Web: www.ellutia.com Email: [email protected] Phone: 843 259 2307
Yes it Really is a
Gas Chromatograph !!The 200 Series GC from Ellutia is a Gas Chromatograph unlike any you have seen before. Incredibly compact and energy efficient, yet still offering all the analytical performance required.
The 200 Series is a single channel instrument fitted as standard with a split/splitless injector and full electronic carrier gas control. A choice of detectors are available including FID, TCD, ECD and FPD.
The unique oven design is fully temperature controllable with up to 5 programmable temperature ramps. The oven can accommodate capillary columns up to 60 m in length as well as packed columns using the optional adapters.
At the heart of a 200 Series is the innovative way the
oven is heated. The use of an award winning heat exchanger design and flow through oven means the design of the GC can be kept incredibly compact, light weight and energy efficient without sacrificing performance.
Footprint of only 41(w) x 34(d) cm
Weight of only 7.5 Kg
Power Consumption of only 800VA
Starting at only $7999 with further discounts available for educational establishments, find out more about how the 200 Series GC can work for you by visiting:
www.ellutia.com/200Series.html
ES586858_LCTC033015_005.pgs 03.20.2015 20:58 ADV blackyellowmagentacyan
The Column www.chromatographyonline.com
Contact author: IncognitoE-mail: [email protected]
weighing shall be performed using a balance
that is calibrated over the operating range
and meets the requirements def ned for
repeatability and accuracy.
How do you calibrate your balance? Is
it done by your external service provider
or metrology department? Note that here
we don’t mean the daily adjustment of
the balance that most folks carry out
(internal instrument calibration) but a full
assessment of repeatability, sensitivity,
linearity, departure of indication from
nominal value, and eccentric loading. Most
folks will use the ISO17025 guidelines for
balance calibration and the United Kingdom
Accreditation Service (UKAS) document
Lab 14 (http://www.ukas.com/library/
Technical-Information/Pubs-Technical-
Articles/Pubs-List/LAB14.pdf) that outlines
the requirements for test weights and
calibration procedures nicely.
I think that will probably do for this
instalment, except to say that I haven’t
touched upon the estimation of measurement
uncertainty when using an analytical balance
or indeed the frequency with which checks
should be carried out. I will leave this to
your own further study, but would highlight
that under the new USP <41> regulations,
daily balance sensitivity calibration is not
required and that you should be familiar with
the “risk-based approach” that is described
therein.
The argument that prompted this
article was regarding the proper (simple)
specif cation in our in-house balance SOP
of a “safety factor”, which should be
considered when specifying the smallest net
weight measured using a balance to avoid
out-of-specif cation measurements as a result
of f uctuations in the minimum weighable
amount. Any suggestions?
References
1. Incognito, The Column 10(21), 2–5 (2014).
2. General Chapter <41> “Balances” in Second
Supplement to USP36 – NF31 (United States
Pharmacopeial Convention, Rockville, MD, USA, 1
June 2013).
3. General Chapter <1251>“Weighing on an
Analytical Balance” in Second Supplement to
USP36 – NF31 (United States Pharmacopeial
Convention, Rockville, MD, USA, 1 June 2013).
4. http://www.ukas.com/library/Technical-
Information/Pubs-Technical-Articles/Pubs-List/
LAB14.pdf
Incognito
6
Incognito2 News7 Q&A: Natalini9 Harrison137 99Widdowson and Barden18 CHROMacademy22 Training & Events23 Staff242222 2323
Visually intutitive modeling software
designed for your separation
DryLab® 4The Revolutionary HPLC Modeling Software
www.molnar-institute.com
ES586857_LCTC033015_006.pgs 03.20.2015 20:58 ADV blackyellowmagentacyan

Ph
oto
Cre
dit
: N
icci
rf/G
ett
y I
ma
ge
s
Researchers from the California Animal Health and Food Safety Laboratory at the University of California Davis in the USA have
developed an ultrahigh-performance liquid chromatography–mass spectrometry (UHPLC–MS) method for the detection of
desmethylbromethalin (DMB) residues in animal tissues.1 DMB is the toxic metabolite of bromethalin, a neurotoxic rodenticide
that has increased in usage because of new regulations introduced by the U.S. Environmental Protection Agency (EPA) to phase
out the use of other “second-generation” or long-acting anticoagulents in rodenticides intended for use in residential areas,
leading consumers to look for alternatives.
The U.S. EPA introduced regulations in 2008 to phase out the use of anticoagulents in rodent poisons because of risks to
children, pets, and wildlife. However, lead author Michael S. Filigenzi told The Column that consumers have now increased
their use of an alternative chemical, bromethalin, increasing the danger of poisoning non-target animals. Toxicologists therefore
needed a method to detect bromethalin in brain, liver, and fat tissue to conf rm bromethalin exposure in animals post-mortem.
The team initially developed the UHPLC–MS–MS method with electrospray ionization using a bromethalin standard, but found
the primary ion signal was not as expected. Filigenzi told The Column: “The results were consistent on different instrumentation
and over time, so we developed HPLC conditions and an extraction method which appeared to give us a reasonable detection
limit (in the low to mid part per billion range) and we detected it in a tissue sample from an animal suspected to have been
exposed to bromethalin.” He added: “We felt that we had a useful method but our inability to determine exactly what we
were detecting was worrisome, to say the least. Then, a desmethylbromethalin standard became commercially available.
When we analyzed that standard, it became evident that the compound we had been detecting all along was actually the
desmethylbromethalin — we weren’t detecting bromethalin at all.”
Simultaneous analysis by HPLC with UV and MS of the bromethalin standard detected a low level impurity of
desmethylbromethalin (<1%), which Filigenzi attributes to the poor ionization of bromethalin by electrospray LC–MS; DMB ionizes
exceedingly well. Feligenzi concluded: “Fortunately, bromethalin is metabolized
to desmethylbromethalin, which is the toxic form of the compound
and which will be present in animals exposed to bromethalin.
This makes it a good indicator of exposure. The published method
detects less than 1 ppb of desmethylbromethalin in tissue samples,
which has proven to be suff cient to demonstrate exposure to the
rodenticide in a number of cases.” — B.D.
Reference1. M.S. Filingenzi, A.C. Bautista, L.S. Aston, and R.H. Poppenga, Journal of
Agricultral and Food Chemistry DOI: 10.1021/jf5052706 (2015).
Detecting Off-Target Bromethalin Poisoning
Prof ling PBDE Levels In Baltic Sea Fish
Fish from the Baltic Sea are a major source of lipophilic environmental
pollutants for consumers in Finland. Surrounded by land, the Baltic
Sea is one of the most threatened marine environments, making
f sh from the Baltic Sea a major source of lipophilic environmental
pollutants including polybrominated diphenyl ethers (PBDEs).
PBDEs were used as f ame retardents on many products before
the EU introduced regulations in 2004 to restrict their use. To
determine the exposure of consumers in Finland to PBDEs as the
result of eating Baltic Sea f sh, researchers sampled f sh from the
Baltic Sea, freshwater lakes, and f sh farms. Corresponding author
Hannu Kiviranta, from the National Institute for Health and Welfare in
Kuopio, Finland, told The Column: “The motivation behind the study
was that unfortunately the Baltic Sea is polluted by many organic
pollutants and for protection of the population it is necessary to know
current levels of various pollutants. There is also already EU maximum
limit values for dioxins and PCBs in food and feed and maybe in the
future also for brominated f ame retardants. For legislation work we
need to know the levels of these pollutants in f sh.”
Over 200 samples of 17 edible f sh were prepared and subsequently
analyzed using gas chromatography–mass spectrometry (GC–MS) to
screen for 15 PBDE congeners including BDE-28, -47, -66, -71, -75,
-77, -85, -99, -100, -119, -138, -153, -154, -183, and -209. According
to the paper, analyses showed high levels of BDE-209 in Baltic herring
sampled near the city of Pori (Finland), and in farmed whitef sh. — B.D.
Reference1. R. Airaksinen et al., Environmental Science & Technology DOI: 10.1021/
es505266p (2015).
7
Incognito2 News7 Q&A: Natalini9 Harrison137 99Widdowson and Barden18 CHROMacademy22 Training & Events23 Staff242222 2323
ES586939_LCTC033015_007.pgs 03.20.2015 21:17 ADV blackyellowmagentacyan
The Column www.chromatographyonline.comP
ho
to C
red
it: Sco
tt H
ali
sto
ne
/Ge
tty I
ma
ge
s
News
8
Incognito2 News7 Q&A: Natalini9 Harrison137 99Widdowson and Barden18 CHROMacademy22 Training & Events23 Staff242222 2323
Analyzing PSTs in Shellfish AquacultureParalytic shellf sh toxins (PSTs) are naturally
occurring toxins produced by some species of
microscopic algae that can accumulate in f lter
feeding shellf sh. These toxins are a threat to
shellf sh aquaculture and pose a serious hazard
to public health when ingested. A group
of scientists has developed a method using
hydrophilic interaction liquid chromatography
coupled to ultrahigh-performance LC tandem
mass spectrometry (HILIC UHPLC–MS–MS) to
determine PSTs in a variety of shellf sh species
as part of the Safe New Zealand Seafood
Research programme.1
Historically, shellf sh toxins have been
analyzed using mouse bioassay methods,
but over recent years alternatives have been
sought for ethical and technical reasons.
Corresponding author Michael J. Boundy
told The Column: “In 2001, the Cawthron
Institute (New Zealand) began implementing
routine monitoring of the lipophilic shellf sh
toxins using high performance liquid
chromatography (HPLC)–mass spectrometry.
For many years, these lipophilic shellf sh toxins
were routinely monitored by LC–MS with
export clearance required to be combined
with a mouse bioassay screen whereas
paralytic shellf sh toxins were determined
solely by mouse bioassay.” He said: “At the
time, the only available off cial method of
analysis was the AOAC 2005.06 pre-column
oxidation LC f uorescence (FL) method, which
was decided to be a suitable interim method
for regulatory monitoring in New Zealand.
Appraisal of more recent off cial methods
of analysis AOAC 2011.02 (post-column
oxidation LC-FL) and AOAC 2001.27 (receptor
binding assay) indicated that none of the
methods of analysis met all of our laboratories
requirements for both regulatory monitoring
and research projects (fast analysis, short
turn-around-time, high throughput, sensitive,
quantitation of toxin prof le, low cost).
Therefore, we sought to develop a new
method that would meet our requirements.”
PSTs are a broad range of small, structurally
very similar compounds that have a wide
range of toxicities meaning that mass
spectrometry analyses can be challenging,
but HILIC separation was initially shown
to be very promising. However, it was
evident very early on in the research that
chromatographic reproducibility was poor.
Boundy told The Column: “Most of the effort
spent in the development of the method
was developing a set of mobile phases and
chromatographic conditions that could be easily
and consistently prepared, and would allow
robust chromatography that would meet the
requirements of a routine testing lab.”
There were signif cant problems when
identifying and quantifying toxins in shellf sh
using HILIC that were caused by the high
concentrations of salt solutions found in
the marine environment. Boundy said: “In
the presence of high concentrations of salt
solutions, retention on the analytical column
is signif cantly impacted, and retention times
would greatly differ between standards
and samples. Due to the wide range of
compounds sharing mass-spectrometric
MRM transitions, mitigating this retention
shift in samples was very important to ensure
specif city and correct identif cation of the
compounds of interest.”
To overcome this issue, sample clean-up
was therefore necessary. The study authors
chose graphitized carbon for this purpose as
it had been previously shown to be successful
in retaining highly polar compounds. Samples
were then analyzed using a rapid, selective,
and sensitive HILIC UHPLC–MS–MS method
for identif cation of PSTs in shellf sh. A
validation study on 12 commercially produced
shellf sh species has been performed and
will be published shortly. Michael concluded:
“The improved sensitivity and specif city of the
developed HILIC UHPLC–MS–MS method over
the previous methods of analysis has been
extremely benef cial with a range of research
projects. The improved sensitivity will provide
industry with an earlier warning during a
harmful algal bloom, and the improved
turn-around time will reduce the delays before
harvested product can be sold.” — K.M.
Reference
1. M.J. Boundy, Andrew I. Selwood, D.T. Harwood,
et al., Journal of Chromatography A 1387, 1–12
(2015).
ES586940_LCTC033015_008.pgs 03.20.2015 21:17 ADV blackyellowmagentacyan

Emerging Trends in Pharmaceutical AnalysisBenedetto Natalini of the University of Perugia, Italy, spoke to Bethany Degg of The Column about the driving forces in pharmaceutical
analysis, including the importance of regulation, chirality, and miniaturization. Natalini also discussed his recent research in chiral
chromatography, as well as developments in diagnostics using novel orthogonal liquid chromatography (LC) methods to quantify
neurotransmitters involved in Parkinson’s disease.
Q. Why is pharmaceutical analysis
important and what areas are you
focusing on at the moment?
A: Regulators worldwide require increasingly
high quality and safety standards from
the pharmaceutical industry. To ensure
these standards are met, reliable analysis
tools and methods are constantly required
and developed by analytical scientists.
Pharmaceutical analysis therefore plays a
pivotal role in advancing the concepts and
theories of analytical science, as well as
providing important information on practical
aspects of drug design, quality control, and
quality assurance of industrial manufacturing.
Chiral analysis also plays an important role in
the pharmaceutical analysis.
The current trend in drug discovery
towards enantiomerically pure drugs is
the result of the need to reduce the dose
of a drug, simplify the dose—response
relationship, and reduce the toxicity caused
by the therapeutically less active (or inactive)
enantiomer.
There is, therefore, a great demand for
chiral separations to determine enantiomeric
purity at the early stages of the drug
development process; for enantioselective
bioanalysis in clinical trial studies; to analyze
drugs in the environment; and for the quality
control of medical products and their raw
materials. All these areas have played a part
in my research activities, which involves the
study of the main principles governing the
molecular recognition mechanism in the
various domains of chiral chromatography.
Another area of my research is aimed
at devising chromatographic strategies to
determine the physico-chemical properties of
pharmaceutically relevant compounds. I have
also recently been involved in nutraceutical
analytical chemistry in relation to the study
of the enantiomeric composition of amino
acids and other functional compounds in
fresh and treated foodstuffs, as well as the
development of new high performance
liquid chromatography (HPLC) methods for
bioanalytical studies.Ph
oto
Cre
dit
: Im
ag
e S
ou
rce
/Ge
tty I
ma
ge
s
9
Incognito2 News7 Q&A: Natalini9 Harrison137 99Widdowson and Barden18 CHROMacademy22 Training & Events23 Staff242222 2323
ES586897_LCTC033015_009.pgs 03.20.2015 21:00 ADV blackyellowmagentacyan

The Column www.chromatographyonline.com
Q. How has pharmaceutical analysis
evolved and what are the most
interesting recent trends?
A: Pharmaceutical analysis methods are
traditionally and commonly applied to
the chemical analysis of drug molecules.
However, in the last two decades, modern
pharmaceutical analysis has evolved
enormously, capitalizing on combination
techniques, high-throughput technologies,
chemometrics, and most recently
miniaturization and nanotechnology.
The combination of various techniques
allows the modern pharmaceutical analyst
to exploit the virtues of each technique
and, in turn, to improve the overall quality
of analysis. Indeed, modern analytical
techniques and methods offer the possibility
of increasing the amount of information
received from individual analysis, with
reduced cost, analysis time, and sample
volumes.
High-throughput technologies are having
an increasingly important role in early-stage
drug development, providing a fast
qualitative and quantitative characterization
of thousands of compounds evaluated in
the frame of preclinical and clinical ADME
(Absorption, Distribution, Metabolism,
Excretion) studies.
The principal component analysis (PCA)
and projections to latent structures (PLS) are
two chemometric methods applied in the
domain of computer-aided drug discovery,
and which prove particularly successful
in early stage preclinical research as a
fast computational and analytical tool for
screening the increasing numbers of potential
drug candidates.
The interest in miniaturization technology
has grown rapidly, particularly in the
pharmaceutical industry where it has been
fuelled by the need to speed-up the analysis
in high-throughput screening applications.
Research in this area is particularly focused
on “lab-on-a-chip” nanotechnology because
of the potential to identify, study, and
evaluate new drug entities. Nanotechnology
will have an increasingly important role in the
development of commercial analytical and
preparative tools.
Q. Why is there so much emphasis on
chiral analysis and the detection of
enantiomers?
A: Confronted with the disastrous
consequences of the “Thalidomide Drama”,
scientists in academia, pharmaceutical
industry, and drug regulatory authorities
started recognizing the crucial role of drug
stereochemistry in the development of
new pharmaceutically active ingredients.
In response to the enhanced knowledge
on enantioselective drug action, in the
early 1990s a pragmatic approach to the
regulation of chiral drugs was imposed.
In most countries, regulatory authorities
require separate (or distinct) pharmacological
and toxicological tests of the racemate and
the individual enantiomers. This means that
both racemate and enantiomers must be
tested separately. The decision to develop
the racemate or single isomer is then mainly
based on (a) achievement and exhibition
of safety and effi cacy of the new drug and
(b) optimal use of time and money: In this
frame, the development of the racemate is
sometimes the appropriate decision, with a
number of issues favouring the development
of the only enantiomer endowed with
activity.
The recognition of chirality as a new asset
in drug development has had an enormous
effect on the product pipelines of the major
players in the pharmaceutical industry,
unavoidably leading to the development
of numerous enantiorecognition systems,
mostly in the various domains of
chromatography, as well as of increasingly
improved methods of analysis.
Enantiomers of specifi c compounds have
been established to act as neuromodulators
or neurotransmitters in the central nervous
system, while others were found to play
an important role in endocrine tissues.
Interestingly, the occurrence of racemization
Q&A: Natalini
10
Incognito2 News7 Q&A: Natalini9 Harrison137 99Widdowson and Barden18 CHROMacademy22 Training & Events23 Staff242222 2323
Use of Novel Zirconia-Based Cleanup Sorbents for the
Analysis of Contaminants in Fatty Food Samples
LIVE WEBINAR: Tuesday, March 31, 2015 8 am PDT/ 11 am EDT/ 4 pm BST/ 5 pm CEST
Register Free at www.chromatographyonline.com/novel
EVENT OVERVIEW:High fat content of foods has been a problem when analyzing samples for nonpolar contaminants such as pesticides, PCBs, and PAHs. Extraction methods for these compounds tend to generate samples that are highly contaminated with fatty matrix, causing a number of problems with the subsequent chromatographic anal-ysis. Traditional cleanup techniques, such as gel permeation chro-matography (GPC) and normal phase column chromatography can be very efective, but are often expensive and time consuming.
In this seminar, we will present an alternative approach for the
cleanup of fatty matrices using a novel zirconia-based family
of sorbents, for both QuEChERS (dispersive SPE) and traditional
cartridge SPE.
Key Learning Objectives:
n The use of a zirconia-based sorbent, (Supel™ QuE Z-Sep) will be demonstrated for the QuEChERS cleanup of various fatty foods, in the analysis of pesticides, PCBs, and PAHs.
n Learn about a new dual-layer SPE cartridge, Supelclean™ EZ-POP NP, designed specifcally for the extraction of POPs from oily food samples.
n Broaden your knowledge on advances in QuEChERS technology.
Sponsored by
Presented by
For questions, contact Kristen Moore
Presenters
Katherine StenersonPrincipal Applications ChemistSupelco/Sigma-Aldrich
Moderator
Laura BushEditorial DirectorLCGC & Spectroscopy
Who Should Attend:
Chromatography and sample prep method develop-
ers, especially those interested in learning about advances and
innovations in QuEChERS cleanup technology.
ES586893_LCTC033015_010.pgs 03.20.2015 21:00 ADV blackyellowmagentacyan

The Column www.chromatographyonline.com
of certain compounds in biological fl uids
and tissues can be associated to various
pathophysiological conditions. All these
relatively new acquisitions have expanded
the interest towards chirality issues as a
whole.
Q. In a recent study by your research
group, novel orthogonal liquid
chromatography methods were applied
to quantify neurotransmitters involved
in Parkinson’s disease.1 What were the
main objectives of this study?
A: Parkinson’s disease is a multifactorial
neurodegenerative disorder, characterized
by severe motor and non-motor symptoms
resulting from a selective loss of the
dopaminergic neurons in the nigrostriatal
pathway, with consequent reduction of
dopamine (DA) levels. A relatively long
preclinical phase precedes classical motor
symptoms that appear when more than 80%
of dopaminergic neurons are lost. Indeed,
non-motor symptoms, primarily cognitive
dysfunction, often occur many years before
the appearance of movement disorders,
thus limiting a prompt medical diagnosis.
Moreover, the molecular pathways involved
in the pathogenesis of disease have not yet
been fully disclosed. In this scenario, we
were motivated to develop new diagnostic
tools to evaluate early stage depletion
of DA and of some of its metabolites
(3,4-dihydroxyphenylacetic acid, DOPAC;
homovanillic acid, HVA; 3-methoxytyramine,
3-MT), thus facilitating biochemical
evaluations and clinical applications at once.
A recent study showed that the neurons
responsible for DA release also produce the
neurotransmitter gamma-aminobutyric acid
(GABA), which, in contrast to DA, contributes
to limit the neuronal hyperactivity.
Accordingly, we deemed it interesting to
develop an HPLC method for the quantitative
measurements of GABA levels in specifi c
biological samples, to apply for diagnostic
purposes.
The information derived from the
chromatographic study, when combined
to those from imaging approaches, could
facilitate the diagnosis at different stages.
Q. Why did you choose reversed-phase
ion-pairing chromatography (IPC)
and hydrophilic liquid interaction
chromatography (HILIC) for this study?
A: To take advantage of MS-compatible
chromatographic methods providing distinct
selectivity profi les, which enhances the
chance of correct species quantifi cation,
and allows the compensation of the intrinsic
limits characterizing all (single dimension)
chromatographic methods. To the best of my
knowledge, this represents the fi rst study in
Q&A: Natalini
11
Incognito2 News7 Q&A: Natalini9 Harrison137 99Widdowson and Barden18 CHROMacademy22 Training & Events23 Staff242222 2323
Triumphs and Challenges of High-Resolution Mass
Spectrometry in Comprehensive Pesticide Residue ScreensON-DEMAND WEBCAST Originally aired February 25, 2015
Register for free: http://www.chromatographyonline.com/triumphs
Triumphs and Challenges of High-Resolution Mass
Spectrometry in Comprehensive Pesticide Residue Screens
EVENT OVERVIEW:If we want to continually expand our analytical capabilities and allow for
post-acquisition data mining, we can no longer rely solely on triple-quad-
rupole instruments for rapid, single-injection, easy-to-manage analysis. The
Florida Department of Agriculture and Consumer Services pesticide regula-
tory program now has several single stage high resolution mass spectrometers
(ST-HRMS), which have a mass resolving power of ~100,000 and continually
scan over a large mass-to-charge range. ST-HRMS allows for the mass resolu-
tion of, among other analytes, phosmet from azinphos methyl, two commonly
applied pesticides with very close masses and similar chromatographic reten-
tion times, a scenario that arises frequently in pesticide analysis. After a year of
analyzing ~800 samples for 226 pesticides using ST-HRMS and systematically
comparing the results to those acquired using a QTRAP instrumentwe fnd a
high degree of agreement and thus conclude that ST-HRMS is valid analytical
technique when analyzing for many compounds in complex food matrices.
We fnd that this approach has the potential for transformational improve-
ments in our analytical capabilities by allowing a broad scope single-injec-
tion analysis to be paired with a broad scope analytical extraction, allowing
for more efcient analysis. In this presentation, we will also address some of
the fundamental limitations of ST-HRMS analysis, the lack of parent isolation
capabilities and the inability to distinguish between two analytes with the
same exact mass. Lastly, we will demonstrate strategies that successfully mit-
igate these potential impediments, including the use of structurally relevant
fragments for, among other pesticides, terbumeton, prometon and secbu-
meton, and the use of trusted fragments that have been observed for years
on triple quadrupole instruments, but the structures of which are unknown,
as is the case for azoxystrobin and others.
Key Learning Objectives:
nHow HRMS may be used to screen and quantify 100s-1000s pesticides,
toxins, and other residues in food products
nHow very large analytical screens are enabled by full scan HRMS
experiments
n Learn approaches that mitigate potential challenges to HRMS analyses for
compounds with same exact mass
For questions, contact Kristen Moore at [email protected]
Presenter:
MARK CROSSWHITE, Ph.D.
Florida Department
of Agriculture and
Consumer Services
Division of Food Safety
Chemical Residue Laboratory
Moderator:
LAURA BUSH
Editorial Director
LCGC & Spectroscopy
Who Should Attend:
n Food safety chemists and
researchers interested in pesticide
analysis
n Food scientists interested in the
application of HRMS technology
for screening and quantitation of
contaminants
Sponsored by
Presented by
ES586892_LCTC033015_011.pgs 03.20.2015 21:00 ADV blackyellowmagentacyan
The Column www.chromatographyonline.com
which the above fairly orthogonal methods
have been complementarily and successfully
applied to real samples with this aim.
Q. What were your main fi ndings?
What are the advantages of your
novel approach compared to existing
methods? Are other applications
possible?
A: The two fairly orthogonal HPLC methods
were directly applied to the biological
samples without preliminary derivatization
of the compounds of interest. A high level
of selectivity was obtained for dopamine
metabolites and GABA by running the
gradient reversed-phase IPC method with
a volatile ion-pairing reagent, which makes
it suitable for the quantitative assay of four
out of fi ve compounds. Matrix-deriving
interferences enabled the baseline separation
of dopamine, which was instead successfully
achieved with the HILIC-based method.
As previously reported, taking advantage
of HPLC methods providing distinct
selectivity profi les makes correct species
quantifi cation possible and allows analysts
to compensate the intrinsic limits
characterizing all chromatographic methods.
The two HPLC methods offer a valid
contribution to neuroscience research
and are potentially applicable to several
human biological samples. This approach
E-mail: [email protected]: http://www.unipg.it/it/pagina-personale?matricola=000818
will make it possible to diagnose the
early-stage of pathologies or to monitor
the progression of some neurodegenerative
disorders characterized by depletion of vital
neurotransmitters.
Q. Where do you see your research
taking you in the future? Do you have
anything further to add?
A: My future research activity will focus on
(a) studying the variation of the enantiomeric
composition of chiral biomarkers in biological
samples from healthy to pathological
conditions with 2D HPLC applications; (b)
developing new HPLC methods to identify
and quantify chiral biomarkers of bacterial
contamination in foodstuffs; and (c) gaining
a deeper understanding into the basic
principles governing the enantiorecognition
mechanism with both low- and
high-molecular-weight chiral selectors used
in LC applications, through the development
and application of spectroscopic and
molecular dynamic-based computational
protocols.
Reference
1. R. Sardella, S. Scorzoni, C. Conte, A. Lisanti,
F. Ianni, and B. Natalini, Journal of Pharmaceutical
and Biomedical Analysis 98, 253–259 (2014).
Benedetto Natalini
graduated in chemistry
at the Institute of
Organic Chemistry,
Faculty of Science,
University of Perugia
(Italy) in 1973. After
military service, he
began his research activity in 1976 at
the Institute of Medicinal Chemistry and
Pharmaceutical Technology, Faculty of
Pharmacy, University of Perugia (Italy). In
2003 he was designated an expert for the
ECM National Programme by the Ministry
of Health. In 2010 he was an Editor of the
International Journal of Medicinal Chemistry.
In 2011 he became coordinator of the
International Doctorate in Chemistry and
Technology of Drugs. From November 2011
to December 2013 he was Director of the
Department of Chemistry and Technology
of Drugs at the University of Perugia (Italy).
Since January 2014 he has been Director of
the Department of Pharmaceutical Sciences
at the University of Perugia.
Q&A: Natalini
12
Incognito2 News7 Q&A: Natalini9 Harrison137 99Widdowson and Barden18 CHROMacademy22 Training & Events23 Staff242222 2323
known by many, trusted by all
Cecil Instruments Limited Milton Technical Centre, Cambridge
CB24 6A United Kingdom tel. +44 (0) 1223 420 821
[email protected] www.cecilinstruments.com
• Quaternary and other Gradients
• Modular, Compact and Interchangeable
• AutoQuest Autosamplers
• Detector usage with hird Party Systems
• WaveQuest Scanning Detector Options
• Easy Maintenance
• Reliability and Performance
• 21 CFR part 11 Compliance
• PowerStream Chromatography Software
HPLC systems
ES586894_LCTC033015_012.pgs 03.20.2015 21:00 ADV blackyellowmagentacyan
GC Troubleshooting in Petrochemical AnalysisStephen Harrison, Linde Gases, Munich, Germany.
Gas chromatography (GC) is a core analytical
technique in the petrochemical sector, primarily
used to analyze the main process stream
components in fuel production but also to
detect trace impurities that can impact the
production process and f nal product. Against
this background, GC technology has advanced
towards higher sensitivity (or lower detection
limits), and detection of a greater number of
chemical components within a sample. Multiple
detectors can be combined for the analysis of
complex mixtures, resulting in instruments with
multifaceted and highly involved conf gurations
that can analyze 30 or more components from
a single sample injection. Another key trend is
the miniaturization of GC instruments, allowing
on-site analysis and a reduction in ref nery
running costs because they require very low
f ow rates of carrier gas.
Troubleshooting GC Analysis
As in other industries, chromatographers
in the petrochemical sector face the same
issues as all GC users. However, knowing
where to start troubleshooting can be
diff cult because there are so many potential
impurities, a broad range of analytes, and
wide concentration ranges encountered
during analysis. This is further complicated
where instrumentation is contained within
one “black box”. Merging and packaging
different technologies within one GC
unit can simplify analysis, but this creates
a greater number of issues because it is
impossible to visualize each step of the
analysis.
Calibration: A common cause of GC
problems is a lack of precision in the
calibration of the instrument and detector:
• The certif cate supplied with the
calibration gas mixture must be read and
clearly understood to ensure that the
component concentrations are similar to
the concentrations that will be measured.
• The accuracy of the reported values in the
calibration mixture should be appropriate
A guide to simple troubleshooting steps in gas chromatography (GC) with an emphasis on petrochemical analysis.
Ph
oto
Cre
dit
: Ja
son
Te
ale
Ph
oto
gra
ph
y/G
ett
y I
ma
ge
s
13
Incognito2 News7 Q&A: Natalini9 Harrison137 99Widdowson and Barden18 CHROMacademy22 Training & Events23 Staff242222 2323
ES586873_LCTC033015_013.pgs 03.20.2015 20:59 ADV blackyellowmagentacyan
The Column www.chromatographyonline.com
for the measurement being undertaken
and all required components must be
present in the calibration gas mixture.
• The certif cate should be checked to
ensure that the gas mixture is within its
shelf life or expiry date.
Beyond these fundamentals, the use of
appropriate cylinder connection techniques is
vital and this may involve purging the system
with an inert gas to remove atmospheric
air after calibration cylinder connection, but
prior to calibration sample introduction.
Troubleshooting Unexpected Peak
Shapes in Gas Chromatograms
A fundamental error in process or
malfunction of the equipment can be
diagnosed if a chromatogram displays
results far removed from expectations. If
the result is not what was anticipated, or
the result indicates only a small number
of components in a complicated chemical
mixture, it is possible the operator has
chosen a set-up for the separator column
and detector which are simply not suitable
for the sample being measured. Below are
key hints and tips on how to approach
troubleshooting unexpected chromatograms.
“Fuzzy” Chromatograms: A problem
occasionally encountered is that peaks may
become smeared to the point where there
is no apparent difference between peaks,
referred to as a “fuzzy” chromatogram.
This can be caused by using a damaged GC
column, or using a GC column that is not
capable of reaching the level of separation
required. The column should be replaced or
exchanged for a different column that will
achieve a better separation.
Another possible cause is that the carrier
gas is not appropriate for the application.
Hydrogen has a low viscosity and high
separation velocity and will often achieve
the fastest results, but helium will generally
achieve a better peak resolution despite a
slightly slower response time. A change in
carrier gas can sometimes address the issue.
Unexpected Peaks: The appearance of
unexpected peaks can sometimes be the
result of impurities in the carrier or detector
gas. Check the correct grade of gas has
been connected; for example, a purity gas of
99.8% has been connected to a GC system
that requires a purity of 99.999% or higher.
The next step is to check the system for
leaks that can let gases out of the system,
but also allow contaminant gases in. Leaks
are particularly problematic because they
lower method sensitivity and can result in a
loss of carrier gas, with associated costs and
potential safety issues. If leaks are found,
connections should be tightened, and the
system allowed to settle with gas f owing
Harrison
14
Incognito2 News7 Q&A: Natalini9 Harrison137 99Widdowson and Barden18 CHROMacademy22 Training & Events23 Staff242222 2323
ES586876_LCTC033015_014.pgs 03.20.2015 20:59 ADV blackyellowmagentacyan
The Column www.chromatographyonline.com
through to purge before resuming analysis.
It is also possible that there may be damage
to the GC column from the moisture in
incoming air.
If no leaks are found, the carrier, detector,
and gas cylinders should be replaced. It
is important when changing from an old
cylinder to a new cylinder to use appropriate
techniques such as purging and leak testing
to avoid the introduction of contaminants
during the cylinder change-over. If the
carrier gas or detector gas is sourced from
a gas generator, the gas could be replaced
by a high purity specialty gas cylinder to see
if any change in the results occurs. If so, it
could indicate that the generator produces
gas with non-favourable impurities for the
specif c analysis.
Masking Effect: Peaks in a chromatogram
can sometimes appear to be overlapping
creating a “masking effect”. Solutions on
how to address this are:
• Impurities in the carrier gas: Check for gas
purity and system leakages.
• The sample volume is too high: Typical
GC sample volumes are millilitres or micro
litres, so if too much volume is introduced
to the system, the detector or separator
could become overloaded and this leads
to masked peaks.
• Carrier gas: Analytes with a similar
separation coeff cient will elute at a
similar time and can be masked by the
carrier gas. If this is suspected, the best
troubleshooting idea is simply to switch to
a different type of carrier gas.
Peak Shifting: If the carrier gas f ow rate
is too high or too low, peaks will show
up in places where they are not expected,
effectively shifting the whole chromatogram
to the left or the right. The f rst step is to
check the carrier gas f ow rate. “Pressure
creep” is characteristic of single-stage gas
pressure regulators; as the cylinder empties,
carrier gas f ow rate can increase. Using
two-stage pressure regulation will maintain
a stable gas inlet pressure to the GC.
Inappropriate gas f ow rates can also
cause problems in the detector. The FID
f ame operates best when gas f ow rates
produce an even f ame with laminar f ow
and the correct stoichiometric mix of fuel
and oxidant gases. If the fuel gas (normally
hydrogen) or oxidant gas (normally synthetic
air) f ow rates are not matched, the f ame
will burn with an unstable characteristic
and can cause erratic sample detection.
The remedy here is simple: Gas f ow rates
should be checked and it should be ensured
that high quality gas regulators are used to
deliver the gases to the FID detector to avoid
pressure f uctuations that may cause the gas
f ow rates to change. In some modern
Harrison
15
Incognito2 News7 Q&A: Natalini9 Harrison137 99Widdowson and Barden18 CHROMacademy22 Training & Events23 Staff242222 2323
Register for free at
www.chromatographyonline.com/comparison
EVENT OVERVIEW:
A wide range of pharmaceuticals and personal care products (PPCPs)
have been detected as contaminants in surface and wastewaters around
the globe, which could possibly be linked to adverse health efects. This
webinar will discuss a study that investigated multiple water samples
from various points of the Tar River and from water treatment plants
in eastern North Carolina (USA) to determine the types and levels of
PPCPs in surface waters, and their potential link to the high incidences
of disease in this area.
Samples were prepared by solid-phase extraction (SPE) or liquid–liquid
extraction and analyzed for parent PPCPs and their metabolites by liquid
chromatography–time-of-fight mass spectrometry (LC–TOF-MS) and
gas chromatography–mass spectrometry (GC–MS). Many parent PPCPs
and their metabolites were detected in municipally treated wastewaters
as well as in the Tar River including: carbamazepine, iminostillbene,
oxcarbazepine, epiandrosterone, loratidine, gabapentin, β-estradiol,
triclosan, and others. In this presentation, the presenters discuss and
compare the results obtained using diferent extraction techniques
combined with GC–MS and LC–TOF-MS detection systems.
Who Should Attend
■ Environmental scientists using LC–MS and GC–MS in water analysis.
■ Water research scientists involved in the analysis of PPCPs.
Key Learning Objectives
■ Introduction to emerging PPCPs as
water contaminants.
■ Comparison of current methods used
for the extraction and identifcation
of PPCPs in surface and treated
wastewaters.
■ Scope and advantage of diferent
extraction and detection systems used.
Presenters:
Mustafa I. Selim
Tenured Professor of
Pharmacology and Toxicology
The Brody School of Medicine
East Carolina University (ECU)
Blake Rushing
PhD Research Student
The Brody School of Medicine
East Carolina University (ECU)
Moderator:
Laura Bush
Editorial Director
Spectroscopy & LCGC
For questions, contact Kristen Moore at [email protected]
Comparison of LC–MS and GC–MS Analysis of Pharmaceuticals and Personal Care Products in Surface Water and Treated Wastewaters
ON-DEMAND WEBCAST (Originally aired March 17, 2015)
ES586872_LCTC033015_015.pgs 03.20.2015 20:59 ADV blackyellowmagentacyan
The Column www.chromatographyonline.com
GC–FID setups the f ame will not ignite if the
fuel gas f ow rates are unsuitable. While a
good feature, if the sample is run through
the GC–FID without the f ame being ignited,
the results will clearly be wrong.
Off-the-Scale Peaks: Peaks on the
chromatogram scale can disappear off the
paper for the following reasons:
• High detector sensitivity: If it is possible,
the simplest troubleshooting solution
would be to reduce the detector sensitivity
level.
• Sample volume: Reduce the sample
volume or dilute the sample prior to, or
during, injection to the GC.
To be sure the GC works well and is f t for
purpose, good practice would be to run a
method specif c system suitability test. In
addition, to track any system drift over time,
known samples could be analyzed regularly
during the analytical run.
Sample Considerations
In extreme cases, a skewed result may have
nothing to do with the f ow rate, volume
of sample, purity of the carrier gas, or any
leakages. The wrong sample may have been
introduced to the instrument, or samples may
have become contaminated or decayed. If this
is suspected, the sampling technique, sample
preparation, and storage should be reviewed.
Sample Decay: Sample decay, or changes
in sample composition, can take place
during the chromatography process. For
example, if hydrogen is used as a carrier gas,
any unsaturated hydrocarbons or aromatic
hydrocarbons present in a sample are likely
to react. This will be vastly accelerated in
the GC column oven. In this case, the best
troubleshooting advice would be to change
the carrier gas.
Sample Collection: Samples can also be
inadvertently transformed prior to injection
into the column. Volatile components can
evaporate from the sample mixture, or
components within the sample can react
with each other or with air or moisture
from the ambient environment. Collecting
samples in evacuated sample containers
or using temperature control during
sample transportation can be effective
troubleshooting remedies.
The above risks can be signif cantly
mitigated by taking and analyzing multiple
samples that will signif cantly increase the
chance that a sample handling error will be
detected.
Petrochemical Analysis Focus
Gas Chromatography–Flame Ionization
Detection (GC–FID):
Overview: Perhaps the most common gas
chromatography technique used in ref ning
and petrochemical applications is gas
chromatography with a f ame ionization
detector (GC–FID). The FID detects analytes
by measuring an electrical current generated
by electrons from burning carbon particles
in the sample. FID harnesses a combination
of hydrogen and oxygen. The oxygen for
the f ame combustion is normally supplied
by the use of high purity synthetic air to
minimize the amount of impurities coming
into the detector.
Key Considerations: It is important when
changing over from one cylinder of
synthetic air to another to ensure that the
composition of the air in the new cylinder
is consistent with that of the previous
cylinders, in terms of blend tolerance. For
example, the target oxygen concentration
might be 20%, but that mixture might
have a blend tolerance of plus or minus
1% absolute (5% relative) meaning that
the actual oxygen concentration can be
between 19% and 21%. While a small
change in the consistency of the contents of
the new cylinder might be acceptable, more
pronounced differences will inf uence how
the FID f ame burns and could lead to a very
different analytical result, even though the
sample has not changed.
The same principle applies to ordering
calibration gas mixtures. Using a calibration
gas mixture with an analytical accuracy of
plus or minus 10% could create an apparent
shift in process parameters when a process
analyzer is recalibrated and the instrument
then begins to respond differently.
Troubleshooting Steps: The f rst step is to
check that the fuel gas to the detector
has been switched on, that the f ame is
functioning, and has been successfully
ignited. Troubleshooting relies on checking
gas f ow rates and re-ignition of the f ame
prior to re-running the sample. It should also
be ensured that high quality gas regulators
are used to deliver the gases to the FID
detector to avoid pressure f uctuations that
may cause the gas f ow rates to change.
Gas Chromatography–Sulphur
Chemiluminescence Detection
(GC–SCD):
Overview: The sulphur chemiluminescence
detector (SCD) has emerged as a powerful
tool in ref nery GC, and is primarily used
for the quantitative determination of
various sulphur organic species (such as
hydrogen sulphide, mercaptans, thiophenes,
benzothiophenes, and sulphides in
hydrocarbon samples). It is a highly
sensitive and useful technique for the
characterization of crude oils of different
origin, because sulphur speciation is
essential during oil catalytic processing in a
ref nery.
Harrison
16
Incognito2 News7 Q&A: Natalini9 Harrison137 99Widdowson and Barden18 CHROMacademy22 Training & Events23 Staff242222 2323
ES586881_LCTC033015_016.pgs 03.20.2015 20:59 ADV blackyellowmagentacyan

The Column www.chromatographyonline.com
Key Considerations: A key consideration
when performing GC–SCD analyses are
the physical properties of the sample
delivery lines. It is essential that these
delivery lines are constructed from an inert
material, because using the wrong material
could result in sample components reacting
with the walls of the line. The most common
material used in general industry is 316
stainless steel, but it is not appropriate for
ref nery analysis. This is because certain
sulphur compounds in the sample line can
adhere to the walls and therefore not reach
the analyzer at the same time as the bulk of
the sample. The best alternatives are highly
chemically resistant non-metallic materials
such as Tef on and Kel-F or Hastelloy C-22,
a nickel-chromium-molybdenum-tungsten
alloy with high corrosion resistance.
Troubleshooting Steps: This problem can
go undetected because analysts do not
know that these compounds are present
until the line becomes saturated, resulting
in a sudden concentration of the substance
being released and detected as an anomaly.
If sulphur compound peaks appear in an
analysis result, but several hours after they
might have been expected, the reason
could be that the sulphur concentration is
actually several hours old. To validate or
rule out this issue, test injections of known
concentration calibration gas mixtures into
the sample delivery pipework upstream of
the analyzer could validate or rule out this
problem.
Summary
The analysis of chemical components for
petrochemical plant process control has
been elevated to unprecedented levels of
accuracy. As legislation becomes ever more
stringent, the importance of quantifying
and qualifying emission pollutants in an
accurate and transparent manner through
GC has become a priority. Emissions
measurement has serious f nancial
implications and compliance to measurement
is critical.
Stephen Harrison is a British Chartered
Engineer (MIChemE) with a career in
industrial gases spanning 26 years, over 12
of which have been focused in the area
of specialty gases. He has worked in an
international capacity for both Linde Gases
and previously BOC and now leads Linde’s
global Specialty Gases & Specialty Equipment
business from Munich, Germany. Stephen
has a Masters degree in chemical engineering
from Imperial College, London, UK.
E-mail: [email protected]
Website: http://hiq.linde-gas.com/
Harrison
17
Incognito2 News7 Q&A: Natalini9 Harrison137 99Widdowson and Barden18 CHROMacademy22 Training & Events23 Staff242222 2323
Put your questions to our panel of experts. Complex scenarios welcome.
To fnd out more about CHROMacademy Premier membership contact:
Glen Murry on +1 732 - 346 - 3056 | e-mail: [email protected]
CHROMacademy is the world’s largesteLearning website for analytical scientists
www.chromacademy.com
Packed with practical information that will help increase your knowledge. Lite members have access to less than 5% of our content.
Premier members get so much more !
Ask the Expert.Get answers to your questions within 24 hrs
Tutor assisted certifed coursesHPLC Operator | HPLC Method Developer
GC Operator | GC Method Developer
powered by
SPEMSGCHPLC IR
ES586883_LCTC033015_017.pgs 03.20.2015 21:00 ADV blackyellowmagentacyan

Extending the Compatible Analyte Volatility Range for Indoor Air Quality and Material Emissions Testing Using Multi-Bed Thermal Desorption Tubes
This article describes sampling methodology for thermal desorption–gas chromatography (TD–GC) that can extend the compatible analyte range of tests used to determine chemicals released from materials, as well as associated indoor air quality measurements. We summarize studies that demonstrate how packed multi-bed thermal desorption tubes, popular in environmental analysis, deliver improved recovery of very volatile compounds over single-bed tubes without compromising the recovery or stability of heavier target analytes.
Caroline Widdowson and David Barden, Markes International, Llantrisant, Wales, UK.
Thermal desorption (TD) is a versatile gas
chromatography (GC) pre-concentration
technology that is applicable to the
analysis of volatile and semi-volatile
organic compounds (VOCs and SVOCs)
in a wide range of sample matrices. As
well as boosting sensitivity, it allows full
automation of the processes of sample
pre-concentration, desorption and
extraction, and GC injection, greatly
improving sample throughput.
The typical two-stage TD process, used
for concentrating volatiles from relatively
large volumes of air or gas, involves the
gentle heating of sorbent-packed TD tubes
in a f ow of inert carrier gas, with the
released components being swept into an
electrically-cooled focusing (“cold”) trap Ph
oto
Cre
dit
: Tri
cia
Sh
ay P
ho
tog
rap
hy/G
ett
y I
ma
ge
s
18
Incognito2 News7 Q&A: Natalini9 Harrison137 99Widdowson and Barden18 CHROMacademy22 Training & Events23 Staff242222 2323
ES586875_LCTC033015_018.pgs 03.20.2015 20:59 ADV blackyellowmagentacyan
The Column www.chromatographyonline.com
within the TD system. The focusing trap is
then heated rapidly in a reverse f ow of carrier
gas to inject the organic compounds into
the GC column as a sharp band of vapour.
This two-stage desorption process optimizes
concentration enhancement and produces
narrow chromatographic peaks, thus
optimizing sensitivity.
The selection of sorbents for thermal
desorption sampling tubes and focusing
traps involves the consideration of a range of
factors, including the strength of the sorbent–
sorbate interaction, artefacts, hydrophobicity,
inertness, and mechanical strength. Packed
with appropriate sorbent(s), a TD sampling
tube can allow quantitative retention and
release of compounds ranging from C2
hydrocarbons and freons to semi-volatiles
such as PCBs, phthalates, and PAHs, without
exceeding optimized tube dimensions or
requiring liquid cryogen coolant.
Material emissions test methods have
traditionally been targeted at relatively narrow
analyte ranges — typically from n-hexane
to n-C16 or, in some cases, from n-hexane
to n-C22. Such methods typically use tubes
packed with Tenax TA,1,2 and although
this sorbent has many desirable qualities
(for example, hydrophobicity, low inherent
artefacts, good recovery of semi-volatiles,
and inertness), it is not suitable for some
very polar compounds, and is too weak for
quantitative retention of species more volatile
than n-hexane.
Therefore, with the growing demand to
measure very volatile and semi-volatile toxic
compounds, increasing attention has been
given to the use of sampling tubes packed
with additional sorbents.3,4 In these so-called
“multi-bed” tubes, up to four sorbents are
arranged in order of increasing strength from
the sampling end, so that the less volatile
“sticky” components only encounter the
weakest sorbent, and are easily released
when the gas f ow is reversed during the
subsequent thermal desorption process. This
allows a wider volatility range of components
to be quantitatively sampled and analyzed.
Although such multi-bed sorbent tubes
are commonly used in ambient (outdoor)
air monitoring,5 their deployment for
material emissions testing and indoor air
quality monitoring has historically been
limited. However, a recent revision of a key
international standard method1 includes
the option to use multi-bed sorbent tubes.
This article describes studies that assessed
the effectiveness of these tubes against the
single-bed tubes more widely used in this f eld.
Experimental
The protocols used are brief y summarized
here. Full details can be found in the cited
references.
Tenax TA tubes
(in series)(a)
(b)
Ab
un
da
nce
(x
10
6 c
ou
nts
)
5
2
1
0 5 10 15 20 25 30 35 40 45
IS 3
2
1
5
6
7 8
4
3IS
4
6
7
6
5
4
3
2
1
0
Ab
un
da
nce
(x
10
6 c
ou
nts
)
7
8
6
5
4
3
2
1
0
1
2
3
87
Multi-bed tubes
(in series)
First tube
1 n-Pentane2 Methylcyclobutane3 Butyl acetate4 m/p-Xylene5 Styrene6 o-Xylene7 2-Ethoxyethyl acetate8 Benzaldehyde
Second tube
Time (min)
0 5 10 15 20 25 30 35 40 45
Time (min)
First tube
Second tube
Figure 1: Analysis of emissions from PU foam (sampling volume ~4.6 L), sampled onto (a) two Tenax TA tubes connected in series, and (b) two multi-bed tubes connected in series. Internal standard (IS) = toluene-d8. Adapted and reproduced with permission from Analytical Methods 5, V.M Brown and D.R Crump, An investigation into the performance of a multi-sorbent sampling tube for the measurement of VVOC and VOC emissions from products used indoors, 2746–2756 (2013) © Royal Society of Chemistry.
Widdowson and Barden
19
Incognito2 News7 Q&A: Natalini9 Harrison137 99Widdowson and Barden18 CHROMacademy22 Training & Events23 Staff242222 2323
ES586879_LCTC033015_019.pgs 03.20.2015 20:59 ADV blackyellowmagentacyan
The Column www.chromatographyonline.com
A Micro-Chamber/Thermal Extractor
(Markes International) was used to sample
volatiles emitted by polyurethane (PU)
foam onto the sorbent tubes, followed
by analysis using a TD-100 automated
thermal desorber (Markes International)
with gas chromatography (GC) (Agilent
Technologies) coupled to MS (Agilent
Technologies).
Emissions from Polyurethane (PU)
Foam:6 PU foam was freshly cut from a
composite door known to release a mixture
of very volatile organic compounds (VVOCs),
VOCs, and SVOCs. Material samples were
placed into individual micro-chambers
equilibrated at 23 °C and the emissions
sampled onto the two types of sorbent tube.
Two identical tubes, in series, were used in
each case — a front “sampling” tube, and a
rear “back-up” tube to collect any analytes
that broke through. Sampling conditions
were (a) 60 min with an air f ow of ~80 mL/
min, to generate the chromatograms shown
in Figure 1, and (b) 15 min with an air f ow
of 50 mL/min, to generate the mean values
shown in Figure 2.
Stability Studies:7 To generate the results
shown in Figure 3, a mixture of chemical
standards relevant to material emissions
testing was loaded onto sorbent tubes in
the gas phase (with or without methanol,
as necessary) to give a nominal loading of
100 ng for each component, with a bubbler
used to generate humid atmospheres.
Results and Discussion
Figure 1 compares emissions from the
PU foam sample sampled using the two
types of tube. It is immediately apparent
that the multi-bed tubes show better
recovery of the lightest analytes, n-pentane
(b.p. 36 °C) and methylcyclobutane (b.p.
36 °C), with no detectable breakthrough
of either analyte on the respective back-up
tubes.
These results are confirmed by the
analysis shown in Figure 2, which used the
same setup except with a lower flow rate
and shorter sampling time, more typical of
a standard sampling protocol.
In the past, there have been concerns
that, during storage, less volatile analytes
might migrate from weaker sorbents to
stronger sorbents within multi-bed tubes — a
phenomenon that would result in compounds
being irreversibly bound to the stronger
sorbent. However, the 4-week stability
data presented in Figure 3 shows that the
performance of the multi-bed sorbent tubes
was at least equal to that of the Tenax TA
tubes. It is worth noting that, whatever the
sorbent combination used, it is still advisable
to analyze tubes as soon as possible after
sampling, and ideally within four weeks.
All experiments used stainless steel 3½”
× ¼” sorbent tubes (Markes International),
packed either with Tenax TA or with quartz
wool–Tenax TA–Carbograph 5TD. All tubes
were stringently conditioned before use using
a TC-20 off-line tube conditioner (Markes
International). The conditioned tubes were
capped prior to and after sampling with
two-piece brass long-term storage caps f tted
with PTFE ferrules.
500 Tenax TA
Multi-bed
Co
nce
ntr
ati
on
(µ
g/m
3) 400
300
200
100
n-Pen
tane
Met
hylcy
clobuta
nea,
b
Butyl a
ceta
te
m/p
-Xylen
e
Styr
enea
o-X
ylen
e
2-Et
hoxyet
hyl a
ceta
teb
Benza
ldeh
ydeb
0
Figure 2: Mean concentrations (n = 7–9) with standard deviations for eight dominant compounds in the analysis of emissions from PU foam (sampling volume 0.75 L), sampled onto two Tenax TA tubes connected in series (red), and two multi-bed tubes connected in series (blue). a) Values divided by 10 for ease of comparison; b) no pure standard was available, and so quantitation used toluene equivalents. Adapted and reproduced with permission from Analytical Methods 5, V.M Brown and D.R Crump, An investigation into the performance of a multi-sorbent sampling tube for the measurement of VVOC and VOC emissions from products used indoors, 2746–2756 (2013) © Royal Society of Chemistry.
Widdowson and Barden
20
Incognito2 News7 Q&A: Natalini9 Harrison137 99Widdowson and Barden18 CHROMacademy22 Training & Events23 Staff242222 2323
ES586871_LCTC033015_020.pgs 03.20.2015 20:59 ADV blackyellowmagentacyan
The Column www.chromatographyonline.com
Conclusions
These results demonstrate that multi-bed
sorbent tubes packed with quartz wool,
Tenax TA, and Carbograph 5TD are
compatible with an extended analyte
range compared to single-bed Tenax TA
tubes. As well as allowing simultaneous
active/pumped sampling of volatiles from
n-butane to n-C30, the stability of a
number of volatile analytes is found to be
very similar on both tube types,
confirming the suitability of these
multi-bed tubes for a range of TD
applications.
Acknowledgement
The kind assistance of Dr Derrick Crump
and Dr Veronica Brown (Cranf eld University,
UK) in supplying the data for this article,
and in reviewing a draft, is gratefully
acknowledged.
References
1. ISO 16000: Indoor air. Part 6: Determination
of volatile organic compounds in indoor and
test chamber air by active sampling on Tenax
TA sorbent, thermal desorption and gas
chromatography using MS or MS-FID. Annex
D specif es multi-bed sorbent tubes packed
(as in this study) with quartz wool–Tenax TA–
Carbograph 5TD, as an alternative to single-bed
Tenax TA tubes.
2. EN TS 16516: Construction products:
Assessment of emissions of regulated
dangerous substances from construction
products – Determination of emissions into
indoor air.
3. Application Note 005: Advice on sorbent
selection, tube conditioning, tube storage, and
air sampling, Markes International, April 2014,
http://www.markes.com/Resources/Application-
notes/default.aspx.
4. E. Woolfenden, Journal of Chromatography
A 1217, 2685–2694 (2010), http://dx.doi.
org/10.1016/j.chroma.2010.01.015
5. US EPA Method TO-17: Determination of volatile
organic compounds in ambient air using active
sampling onto sorbent tubes.
6. V.M. Brown and D.R. Crump, Analytical
Methods 5, 2746–2756 (2013), http://dx.doi.
org/10.1039/c3ay40224j
7. V.M. Brown, D.R. Crump, N.T. Plant, and
I. Pengelly, Journal of Chromatography A
1350, 1–9 (2014), http://dx.doi.org/10.1016/j.
chroma.2014.05.011
E-mail: [email protected]: www.markes.com
Caroline Widdowson is the product
marketing manager for thermal desorption at
Markes International, having completed her
chemistry degree at Cardiff University in 2004,
followed by a Ph.D. in organic chemistry. As
part of her current role, she works closely with
manufacturers, test laboratories, and research
institutes to advise analytical chemists on
sampling, analysis, and regulations surrounding
the release of chemicals from materials indoors
or in vehicles.
David Barden is a technical copywriter at
Markes International, having joined the company
in 2011. David studied natural sciences at the
University of Cambridge, UK, and remained
there for his Ph.D. in organic chemistry, which
he received in 2003. A placement at the
European Journals Department of Wiley-VCH,
Weinheim, Germany, was followed by seven
years as a technical editor for various scientif c
journals at the Royal Society of Chemistry,
Cambridge, UK.
Reco
very
(%
)
100
98
96
94
Storage time (weeks)
40% RH <3% RH
920 1 2 3 4
Reco
very
(%
)
100
98
96
94
Storage time (weeks)
920 1 2 3 4
Tenax TA
Tenax TA
Multi-bed
Multi-bed
Figure 3: Mean percentage recoveries for n-hexane, methyl isobutyl ketone, toluene, butyl acetate, cyclohexanone, 1,2,3-trimethylbenzene, and 4-phenylcyclohexene (nominally 100 ng each) from Tenax TA and multi-bed sorbent tubes (n = 5), stored for up to 4 weeks at room temperature, after loading using air of moderate and low relative humidity (40% RH and <3% RH). The individual 4-week recoveries across all seven compounds with a 40% RH loading were between 93% and 104%. Image generated from data in reference 7 with the permission of the authors.
Widdowson and Barden
21
Incognito2 News7 Q&A: Natalini9 Harrison137 99Widdowson and Barden18 CHROMacademy22 Training & Events23 Staff242222 2323
ES586896_LCTC033015_021.pgs 03.20.2015 21:00 ADV blackyellowmagentacyan
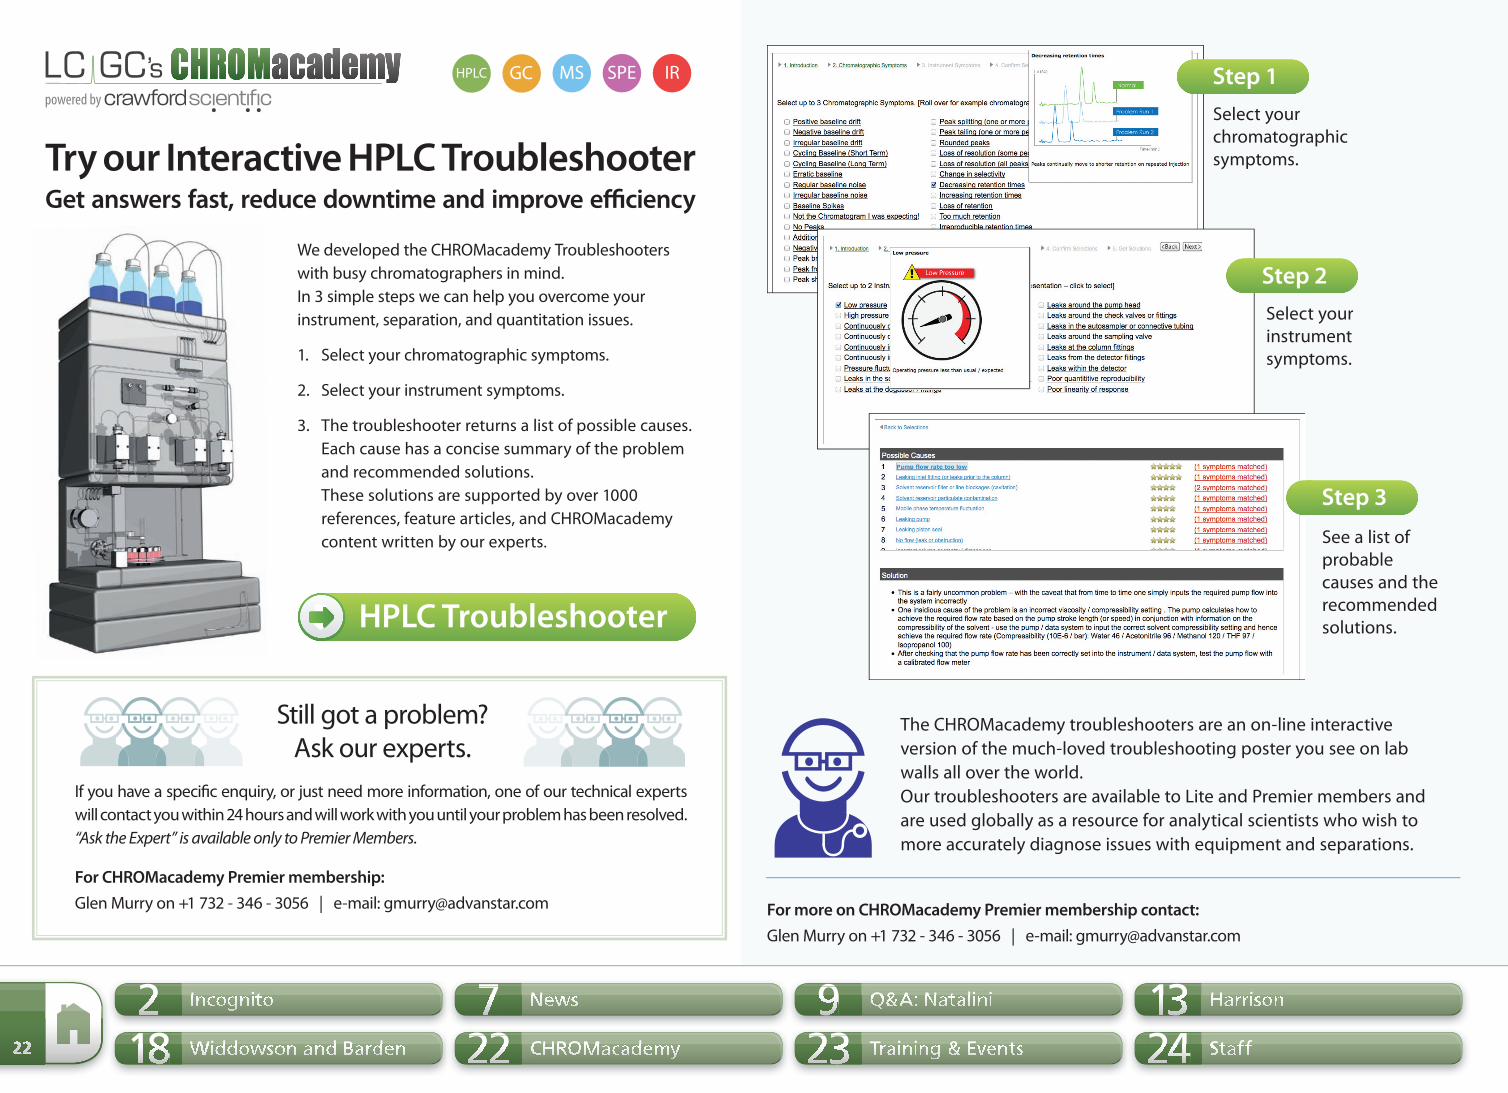
powered by
SPEMSGCHPLC IR
HPLC Troubleshooter
Step 1
Step 2
Step 3
Try our Interactive HPLC TroubleshooterGet answers fast, reduce downtime and improve ef ciency
For more on CHROMacademy Premier membership contact:
Glen Murry on +1 732 - 346 - 3056 | e-mail: [email protected]
Still got a problem?Ask our experts.
If you have a specif c enquiry, or just need more information, one of our technical experts
will contact you within 24 hours and will work with you until your problem has been resolved.
“Ask the Expert” is available only to Premier Members.
For CHROMacademy Premier membership:
Glen Murry on +1 732 - 346 - 3056 | e-mail: [email protected]
We developed the CHROMacademy Troubleshooters
with busy chromatographers in mind.
In 3 simple steps we can help you overcome your
instrument, separation, and quantitation issues.
1. Select your chromatographic symptoms.
2. Select your instrument symptoms.
3. The troubleshooter returns a list of possible causes.
Each cause has a concise summary of the problem
and recommended solutions.
These solutions are supported by over 1000
references, feature articles, and CHROMacademy
content written by our experts.
The CHROMacademy troubleshooters are an on-line interactive
version of the much-loved troubleshooting poster you see on lab
walls all over the world.
Our troubleshooters are available to Lite and Premier members and
are used globally as a resource for analytical scientists who wish to
more accurately diagnose issues with equipment and separations.
See a list ofprobablecauses and therecommendedsolutions.
Select yourinstrumentsymptoms.
Select yourchromatographicsymptoms.
22
Incognito2 News7 Q&A: Natalini9 Harrison137 99Widdowson and Barden18 CHROMacademy22 Training & Events23 Staff242222 2323
ES586877_LCTC033015_022.pgs 03.20.2015 20:59 ADV blackyellowmagentacyan

The Column www.chromatographyonline.com Training & Events
23
Incognito2 News7 Q&A: Natalini9 Harrison137 99Widdowson and Barden18 CHROMacademy22 Training & Events23 Staff242222 2323
GCComplete GC & GC–MS20–24 April 2015The Open University, Milton Keynes, UKWebsite: http://anthias.co.uk/training-courses/completeGC
Fundamental GC21 April 2015Hilton Glasgow Grosvenor, Glasgow, UKWebsite: http://www.crawfordscientific.com/training-online-calendar.asp
Practical GC–MS9 June 2015Caledonian University, Glasgow, UKWebsite: http://www.crawfordscientific.com/training-online-calendar.asp
HPLC/LC–MSEssentials of Modern HPLC/UHPLC 1: Fundamentals and Applications Online Short Course1–22 April 2015Website: http://proed.acs.org/course-catalog/courses/essentials-of-modern-hplc-uhplc-1-fundamentals-and-applications-online-short-course/
Practical HPLC Method Development19 May 2015Strathclyde University, Glasgow, UK
Training CoursesWebsite: http://www.crawfordscientific.com/training-online-calendar.asp
The Theory of HPLCOn-line training from CHROMacademyWebsite: http://www.chromacademy.com/hplc-training.html
SAMPLE PREPARATIONSample Preparation Techniques, SPE, Headspace Sampling & Modern TLC (4 Short Courses) 29 April 2015Reading, UK Website: www.hichrom.co.uk
Solid-Phase ExtractionOn-line training from CHROMacademyWebsite: http://www.chromacademy.com/sample-prep-training.html
MISCELLANEOUSLight Scattering and Viscometry Hands-On Training29–30 June 2015Mainz, GermanyWebsite: www.pss-polymer.com
Please send your event and training course information to Kate Mosford [email protected]
17–21 May 2015
39th International Symposium on Capillary Chromatography (ISCC) and
12th GC×GC Symposium 2015
Ft. Worth, Texas, USA
E-mail: [email protected]
Website: www.isccgcxgc2015.com
21–25 June 2015
42nd International Symposium on High Performance Liquid Phase Separations
and Related Techniques (HPLC 2015)
International Conference Centre, Geneva, Switzerland
Tel: +41 22 839 84 84
E-mail: [email protected]
Website: www.hplc2015-Geneva.org
30 June–3 July 2015
21st International Symposium on Separation Sciences (ISSS 2015)
Grand Hotel Union, Ljubljana, Slovenia
Tel: +386 1 477 0265
E-mail: [email protected]
Website: www.isss2015.si
3–6 November 2015
Recent Advances in Food Analysis (RAFA)
Clarion Congress Hotel, Prague, Czech Republic
Tel: +386 1 4760 265
E-mail: [email protected].
Website: www.rafa2015.eu
Event News
ES586884_LCTC033015_023.pgs 03.20.2015 20:59 ADV blackyellowmagentacyan
Contact Information
Eu
rop
eN
ort
h A
meri
ca
Mission StatementThe Column (ISSN 2050-280X) is the analytical chemist’s companion within the dynamic world of chromatography. Interactive and accessible, it provides a broad understanding of technical applications and products while engaging, stimulating and challenging the global community with thought-provoking commentary that connects its members to each other and the industries they serve.Whilst every effort is made to ensure the accuracy of the information supplied, UBM Advanstar accepts no responsibility for the opinions and statements expressed.Custom Reprints: Contact Brian Kolb at Wright’s Media, 2407 Timberloch Place, The Woodlands, TX 77380. Telephone: 877-652-5295 ext. 121. Email: [email protected].
©2015 Advanstar Communications Inc. All rights reserved. No part of this publication may be reproduced in any material form (including photocopying or storing it in any medium by electronic means and whether or not transiently or incidentally to some other use of this publication) without the written permission of the copyright owner except in accordance with the provisions of the Copyright, Designs & Patents Act (UK) 1988 or under the terms of a licence issued by the Copyright Licensing Agency, 90 Tottenham Court Road, London W1P 0LP, UK.Applications for the copyright owner’s permission to reproduce any part of this publication should be forwarded in writing to Permissions Dept, Honeycomb West, Chester Business Park, Wrexham Road, Chester, CH4 9QH. Warning: The doing of an unauthorized act in relation to a copyright work may result in both a civil claim for damages and criminal prosecution.
Group PublisherMichael J. [email protected]
Sales Manager Gareth [email protected]
Sales Executive Liz [email protected]
Sales Operations ExecutiveSarah [email protected]
Editor-in-ChiefAlasdair [email protected]
Managing EditorKate [email protected]
Associate EditorBethany [email protected]
Advanstar CommunicationsHoneycomb West,Chester Business Park,Wrexham Road,Chester, CH4 9QH, UKTel: +44 (0) 1244 629 300Fax: +44 (0) 1244 678 00
Group PublisherMichael J. [email protected]
Associate PublisherEdward [email protected]
East Coast Sales ManagerStephanie [email protected]
Account ExecutiveLizzy [email protected]
Editorial Director,Analytical SciencesLaura [email protected]
Group Technical Editor Stephen A. [email protected]
Managing EditorMegan L’[email protected]
Administation and Sales OfficesWoodbridge Corporate Plaza,485 Route 1 South,Building F, First floor, Iselin,NJ 08830, USATel: +1 732 596 0276Fax: +1 732 225 0211
Corporate Office, 641 Lexington Ave., 8th Floor, New York, NY 10022-4503, USA
UBM Advanstar:
Chief Executive Officer Joe Loggia
Executive Vice-President, Life Sciences
Tom Ehardt
Executive Vice-President Georgiann
DeCenzo
Executive Vice-President Chris DeMoulin
Executive Vice-President, Business Systems
Rebecca Evangelou
Executive Vice-President, Human Resources
Julie Molleston
Executive Vice-President, Strategy &
Business Development Mike Alic
Sr Vice-President Tracy Harris
Vice-President, General Manager Pharm/
Science Group Dave Esola
Vice-President, Legal Michael Bernstein
Vice-President, Media Operations
Francis Heid
Vice-President, Treasurer & Controller
Adele Hartwick
UBM Americas:
Chief Executive Officer Sally Shankland
Chief Operating Officer Brian Field
Chief Financial Officer Margaret Kohler
UBM plc:
Chief Executive Officer Tim Cobbold
Group Operations Director Andrew Crow
Chief Financial Officer Robert Gray
Chairman Dame Helen Alexander
Eu
rop
eN
ort
h A
meri
ca
24
Incognito2 News7 Q&A: Natalini9 Harrison137 99Widdowson and Barden18 CHROMacademy22 Training & Events23 Staff242222 2323
ES586856_LCTC033015_024.pgs 03.20.2015 20:58 ADV blackyellowmagentacyan