Embed Size (px)
Citation preview
Livestock to 2020: The Revolution Continues
by:
Christopher L. Delgado
Mark W. Rosegrant
Siet Meijer
January 11, 2001
Paper presented at the annual meetings of the International Agricultural Trade Research Consortium (IATRC), Auckland, New Zealand, January 18-19, 2001. Delgado and Rosegrant are Senior Research Fellows and Meijer is Senior Research Assistant at the International Food Policy Research Institute (IFPRI), Washington, D.C. Correspondence to: Christopher Delgado, IFPRI, 2033 K St., N.W., Washington, D.C. 20006 ; tel. 202-862-5617; fax 202-467-4439 ; e-mail [email protected]

1
Livestock to 2020: The Revolution Continues1
The Livestock Revolution
From the beginning of the 1970s to the mid 1990s, consumption of meat in
developing countries increased by 70 million metric tons (MMT), almost triple the
increase in developed countries, and consumption of milk by 105 MMT of liquid milk
equivalents (LME), more than twice the increase that occurred in developed countries.
The market value of that increase in meat and milk consumption totaled approximately
$155 billion (1990 US$), more than twice the market value of increased cereals
consumption under the better-known “Green Revolution” in wheat, rice and maize. The
population growth, urbanization, and income growth that fueled the increase in meat and
milk consumption are expected to continue well into the new millennium, creating a
veritable Livestock Revolution. As these events unfold, many people's diets will change,
some for the better, but others for the worse, especially if food contamination is not
controlled. Farm income could rise dramatically, but whether that gain will be shared by
poor smallholders and landless agricultural workers who need it most is still
undetermined. The environmental and public health impact of rapidly rising livestock
1 This is an updating with new model results supplied by Mark Rosegrant of the projections and analysis in C. Delgado et al., Livestock to 2020: The Next Food Revolution, a 40,000 word report in the 2020 Vision discussion paper series of the International Food Policy Research Institute (IFPRI) published in 1999 and drawing on modeling done by Rosegrant in 1998. The former report was produced jointly by IFPRI, the Food and Agricultural Organization of the United Nations (FAO), and the International Livestock Research Institute (ILRI). A short form of the 2020 discussion paper was published under the same authorship as “The Coming Livestock Revolution”, in Choices, Special Millennium Issue, Fourth Quarter 1999.
2
production in close proximity to population centers also needs attention (Delgado et al.,
1999a, 1999b).
The Livestock Revolution is propelled by demand. People in developing countries
are increasing their consumption from the very low levels of the past, and they have a
long way to go before coming near developed country averages. In developing countries
people consumed an annual average in 1996-98 of 25 kg/capita meat and 51 kg/capita
milk, one-third the meat and one-fifth the milk consumed by people in developed
countries. Nevertheless, the caloric contribution per capita of meat, milk and eggs in
developing countries in the late 1990’s was still only a quarter that of the same absolute
figure for developed countries and, at 10 percent, accounted for only half the share of
calories from animal sources observed in the developed countries, as shown in Table 1.
Per capita consumption is rising fastest in regions where urbanization and rapid
income growth result in people adding variety to their diets. Across countries, per capita
consumption is significantly determined by average capita income (Cranfield 1998).
Aggregate consumption grows fastest where rapid population growth augments income
and urban growth (Rae 1998; Delgado and Courbois 1998). Since the early 1980s, total
meat and milk consumption grew at 6 and 4 percent per year respectively throughout the
developing world.2. In East and Southeast Asia--where income grew at 4-8 percent per
year between the early 1980’s and 1998, population at 2-3 percent per year, and
urbanization at 4-6 percent per year--meat consumption grew between 4 and 8 percent per
year.
2 Compound annual growth rates estimated between 1982/84 and 1996/98.

3
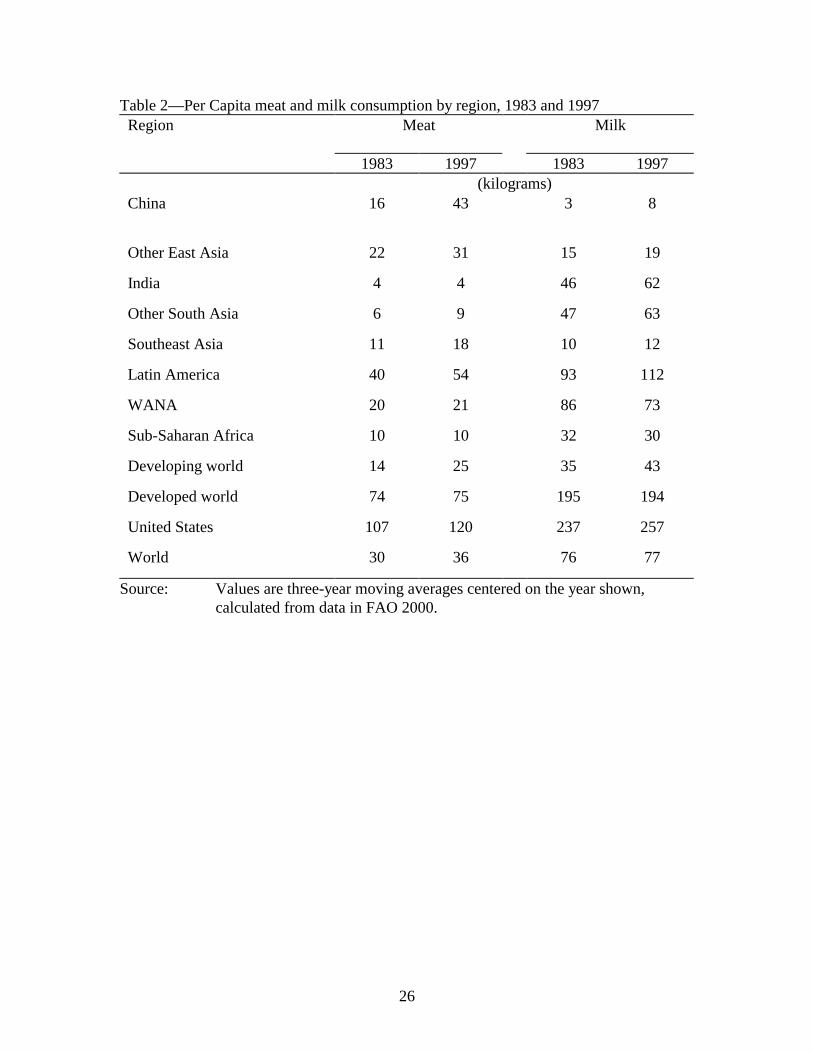
The Livestock Revolution has been most evident in East Asia, as illustrated by the
per capita figures for China in Table 2. Considerable controversy surrounded the official
Chinese feed use and meat production figures in the first half of the 1990’s, and
conservative adjustments have been incorporated in the analysis here to the extent
feasible. However, even a radical downsizing of the estimates of past Chinese growth in
consumption only puts off by two or three years the arrival of the situation that will be
projected for 2020 below, and does not change significantly the long term conclusions of
the modeling. Using the current (downsized) FAO estimates of Chinese consumption
changes between 1982/84 and 1996/98, the share of the world's meat consumed in
developing countries rose from 37 to 48 percent, and their share of the world's milk rose
from 34 to 44 percent (Table 3). Pork and poultry accounted for 76 percent of the large
net consumption increase of meat in developing countries from 1982/84 to 1996/98.
Conversely, both per capita and aggregate milk and meat consumption stagnated in the
developed world, where saturation levels of consumption have been reached and
population growth is small. Nine-tenths of the small net increase in meat consumption
that occurred in developed countries over the same period was from poultry.
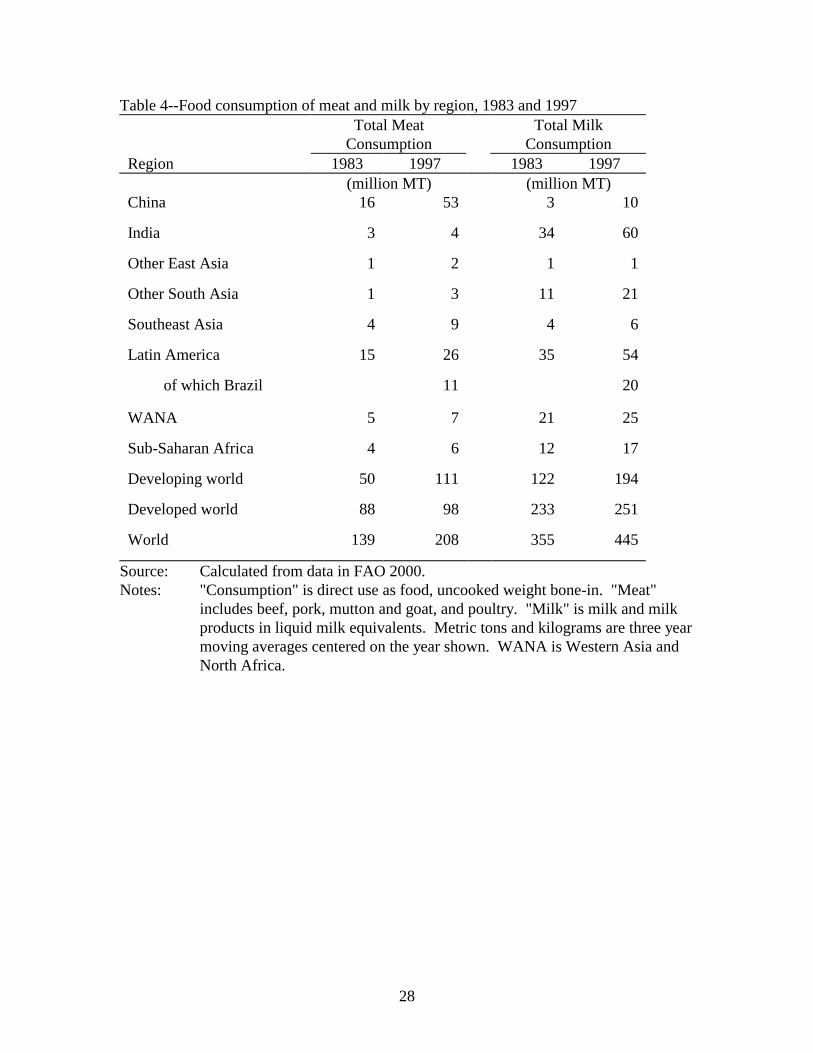
The dominant role of China and Brazil in the meat part of the Livestock Revolution
is shown in Table 4. However, the near doubling of aggregate milk consumption as food
in India between the early 1980’s and the late 1990’s suggests that the Livestock
Revolution goes beyond just meat and beyond China and Brazil. At 60 MMT of LME in
1996/98, Indian milk consumption amounted to 13 percent of the world’s total and 31
percent of milk consumption in all developing countries. The high milk consumption of
Latin America in 1996/98, at 112 kg/capita, is half way between the developing world as
4
a whole (43 kg/capita) and the developed countries (194 kg/capita), because of the very
high level (75%) of urbanization in Latin America (Table 2).
The rapid rise in livestock production in developing countries has been confronted
in recent years by dwindling grazing resources for ruminant animals and a pattern of
effective demand largely centered on rapidly growing mega-cities fueled by non-
agricultural development. The latter increases pressures for rapid industrial approaches to
satisfying urban meat demand. Together, these trends help explain the large share of non-
ruminants in the production increases in both the North and the South. The decline in the
feeding of cereals to ruminants in the North and the much larger increase in non-ruminant
production in the South helps explain a relative shift to the South in the use of feed
cereals. This shift is illustrated in Table 5, which only includes cereals used for feed.
Cereals feed use in the developed countries has actually declined since the early 1980’s,
whereas it increased substantially in developing countries. The share of the latter in
world use of cereals for feed went from 21 percent in 1982/84 to 36 percent in 1996/98.
This salient fact has inspired many observers to wonder if the rise of production of pork,
poultry, eggs, and milk for the urban middle class would jack up the price of cereals to
the poor in both rural and urban areas of developing countries. Furthermore, others
wondered whether the trends portrayed above could possibly continue far into the future,
without resource scarcities or import constraints raising prices to the point that the growth
in consumption would peter out.
Whether these trends will continue into the future was explored in 1998 with
IFPRI's International Model for Policy Analysis of Agricultural Commodities and Trade
(IMPACT), a global food model first reported in Rosegrant, Agcaolili-Sombilla, and

5
Perez (1995). Results were put into the context of growing concern about livestock
issues in Delgado et al. (1999a, 1999b). The present paper reports results from a
substantially updated version of IMPACT run in October 2000, which benefited in part
from the many comments received on the earlier work.
The IMPACT Model3
IFPRI's International Model for Policy Analysis of Agricultural Commodities and
Trade is useful for analyzing alternative scenarios for global food demand, supply and
trade. IMPACT is specified as a set of country or regional sub-models, within each of
which supply, demand and prices for agricultural commodities are determined. The
present version of IMPACT (October 2000) covers 36 countries and regions (which
account for virtually all of world food production and consumption), and 22 commodities,
including all cereals, soybeans, roots and tubers, four meats, milk, eggs, oils, oilcakes,
meals, sugar, fruits and vegetables.
The model uses a system of supply and demand elasticities, different for each of the
36 markets and incorporated into a series of linear and nonlinear equations, to
approximate the underlying production and demand functions. Cross-price elasticities
and intermediate demands (such as feed grains for livestock production) ensure the
interlink age of markets within each of the 36 country groupings. Sectoral growth
multipliers are used to determine the intersect oral effects of changes in income in
agricultural and nonagricultural sectors.
3 This section draws heavily on Rosegrant 1999
6
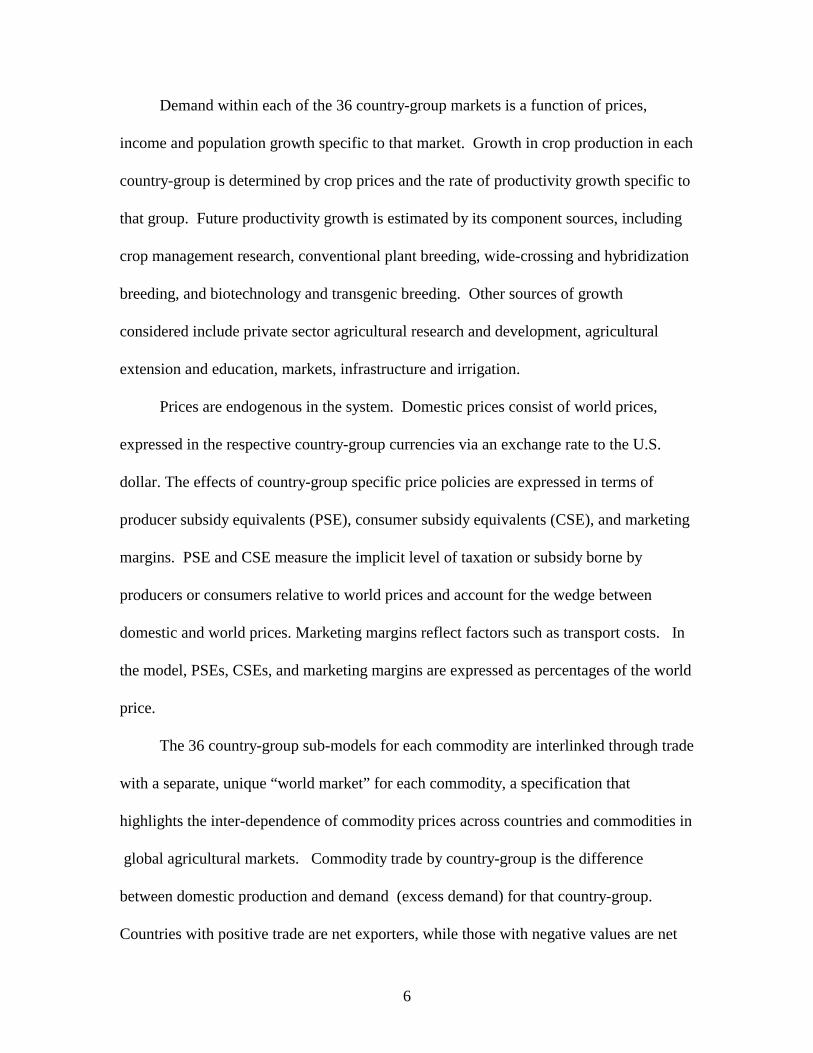
Demand within each of the 36 country-group markets is a function of prices,
income and population growth specific to that market. Growth in crop production in each
country-group is determined by crop prices and the rate of productivity growth specific to
that group. Future productivity growth is estimated by its component sources, including
crop management research, conventional plant breeding, wide-crossing and hybridization
breeding, and biotechnology and transgenic breeding. Other sources of growth
considered include private sector agricultural research and development, agricultural
extension and education, markets, infrastructure and irrigation.
Prices are endogenous in the system. Domestic prices consist of world prices,
expressed in the respective country-group currencies via an exchange rate to the U.S.
dollar. The effects of country-group specific price policies are expressed in terms of
producer subsidy equivalents (PSE), consumer subsidy equivalents (CSE), and marketing
margins. PSE and CSE measure the implicit level of taxation or subsidy borne by
producers or consumers relative to world prices and account for the wedge between
domestic and world prices. Marketing margins reflect factors such as transport costs. In
the model, PSEs, CSEs, and marketing margins are expressed as percentages of the world
price.
The 36 country-group sub-models for each commodity are interlinked through trade
with a separate, unique “world market” for each commodity, a specification that
highlights the inter-dependence of commodity prices across countries and commodities in
global agricultural markets. Commodity trade by country-group is the difference
between domestic production and demand (excess demand) for that country-group.
Countries with positive trade are net exporters, while those with negative values are net
7
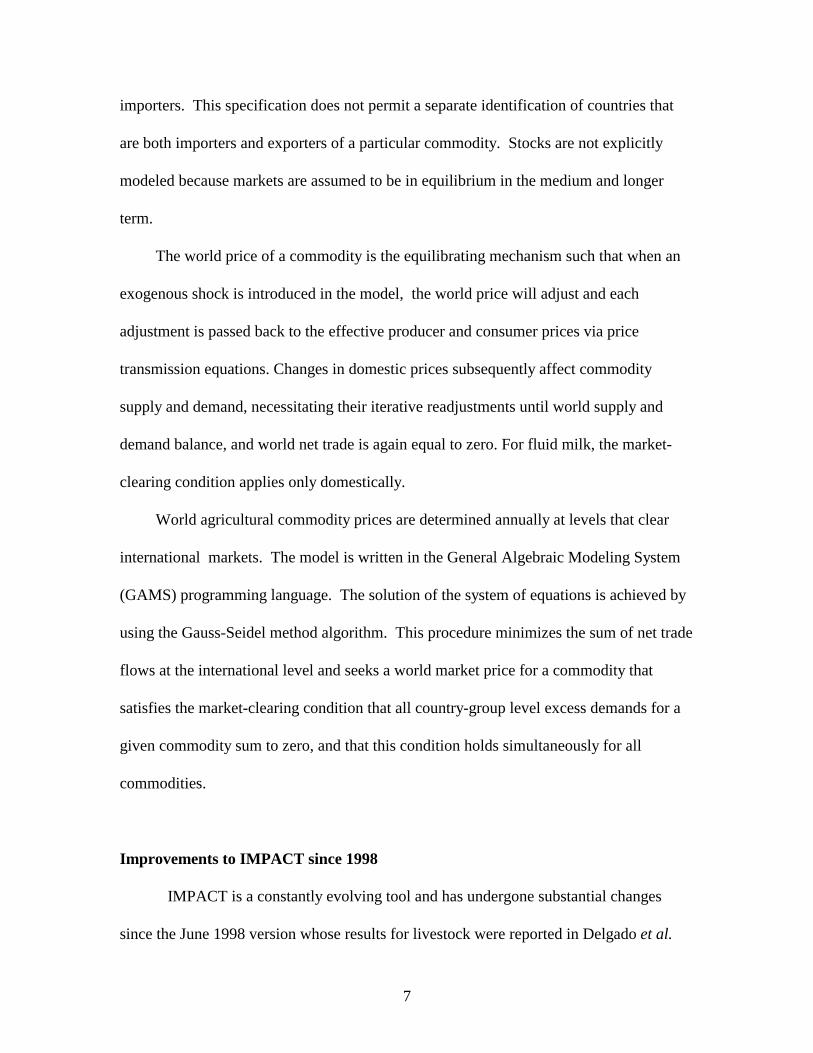
importers. This specification does not permit a separate identification of countries that
are both importers and exporters of a particular commodity. Stocks are not explicitly
modeled because markets are assumed to be in equilibrium in the medium and longer
term.
The world price of a commodity is the equilibrating mechanism such that when an
exogenous shock is introduced in the model, the world price will adjust and each
adjustment is passed back to the effective producer and consumer prices via price
transmission equations. Changes in domestic prices subsequently affect commodity
supply and demand, necessitating their iterative readjustments until world supply and
demand balance, and world net trade is again equal to zero. For fluid milk, the market-
clearing condition applies only domestically.
World agricultural commodity prices are determined annually at levels that clear
international markets. The model is written in the General Algebraic Modeling System
(GAMS) programming language. The solution of the system of equations is achieved by
using the Gauss-Seidel method algorithm. This procedure minimizes the sum of net trade
flows at the international level and seeks a world market price for a commodity that
satisfies the market-clearing condition that all country-group level excess demands for a
given commodity sum to zero, and that this condition holds simultaneously for all
commodities.
Improvements to IMPACT since 1998
IMPACT is a constantly evolving tool and has undergone substantial changes
since the June 1998 version whose results for livestock were reported in Delgado et al.

8
(1999a). Seven sets of changes in suspected decreasing order of importance to the
livestock and feed results are:
• The baseline data are changed from 1992-94 averages to 1996-98 averages.
This incorporates the experience of the Asian economic crisis and events in
the former Soviet Union.
• GDP projections through 2020 were consequently updated also with better
information; the result was slightly less pessimistic for most of Asia than the
previous version that had factored in the early impact of the financial crisis
starting in 1997, but more pessimistic for the former Soviet Union and Central
Asia.
• The population projections to 2020 were reduced by substituting the late 1998
United Nations Medium Variant projections for the same series published by
the U.N. in 1996.
• Meat and feed supply and demand elasticities and technological change
parameters were significantly upgraded for Argentina and Brazil, to reflect
major events of the early to mid-1990’s not reflected in the previous model,
including the impacts of agricultural liberalization.
• Poultry demand and supply elasticities were increased very slightly in most
Asian countries to better track on-going transitions in demand and supply
patterns in those countries.
• Six new commodities were added: cane and beet sugar, sweeteners, tropical
and temperate fruits, and vegetables.
• The country-group coverage changed slightly, with the splitting off of Central
9
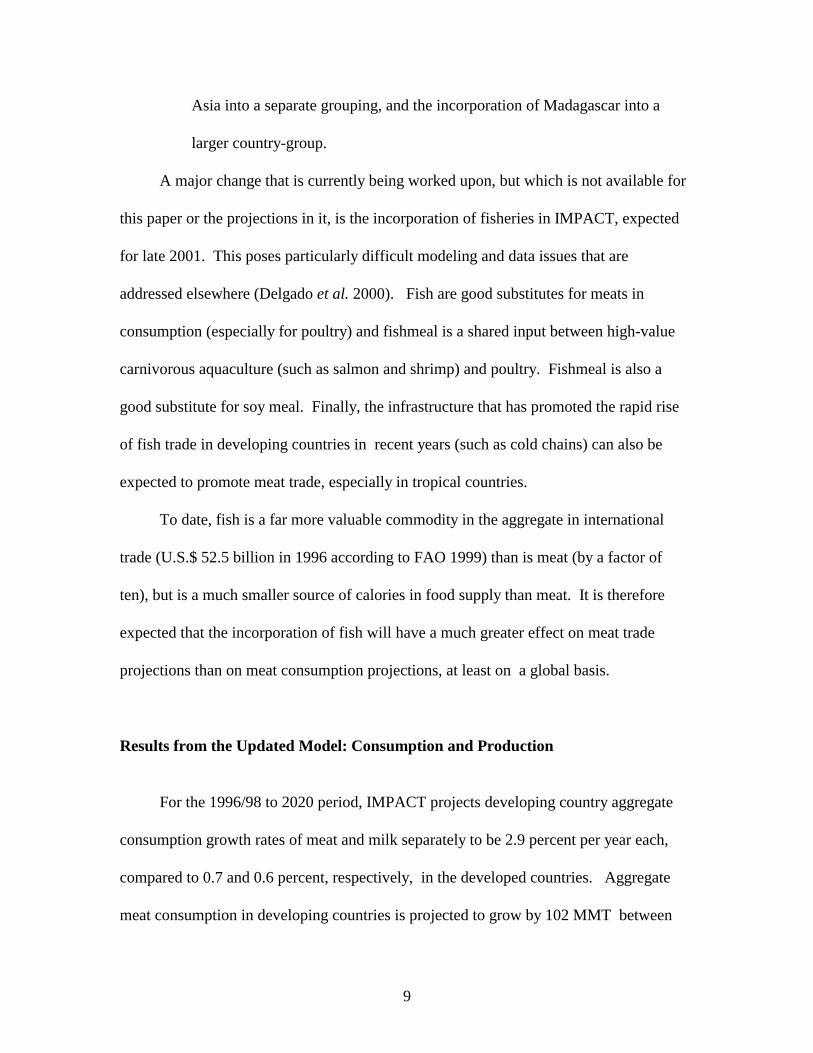
Asia into a separate grouping, and the incorporation of Madagascar into a
larger country-group.
A major change that is currently being worked upon, but which is not available for
this paper or the projections in it, is the incorporation of fisheries in IMPACT, expected
for late 2001. This poses particularly difficult modeling and data issues that are
addressed elsewhere (Delgado et al. 2000). Fish are good substitutes for meats in
consumption (especially for poultry) and fishmeal is a shared input between high-value
carnivorous aquaculture (such as salmon and shrimp) and poultry. Fishmeal is also a
good substitute for soy meal. Finally, the infrastructure that has promoted the rapid rise
of fish trade in developing countries in recent years (such as cold chains) can also be
expected to promote meat trade, especially in tropical countries.
To date, fish is a far more valuable commodity in the aggregate in international
trade (U.S.$ 52.5 billion in 1996 according to FAO 1999) than is meat (by a factor of
ten), but is a much smaller source of calories in food supply than meat. It is therefore
expected that the incorporation of fish will have a much greater effect on meat trade
projections than on meat consumption projections, at least on a global basis.
Results from the Updated Model: Consumption and Production
For the 1996/98 to 2020 period, IMPACT projects developing country aggregate
consumption growth rates of meat and milk separately to be 2.9 percent per year each,
compared to 0.7 and 0.6 percent, respectively, in the developed countries. Aggregate
meat consumption in developing countries is projected to grow by 102 MMT between
10
the late 1990s and 2020, whereas the corresponding figure for developed countries is 16
MMT (Table 6). Similarly, additional milk consumption in the developed countries of 25
MMT of Liquid Milk Equivalents (LME) will be dwarfed by the additional consumption
in developing countries of 178 MMT.
In developing countries, 70 percent of the additions to meat consumption are from
pork and poultry; in the developed countries, the comparable figure is 81 percent. Poultry
consumption in developing countries is projected to grow at 3.7 percent per annum
through 2020, followed by beef at 2.9 percent and pork at 2.4 percent. In the developed
countries, poultry consumption is projected to grow at 1.3 percent per annum through
2020, with other meats growing at 0.5 percent or less (Table 6). As the growth rates in
Table 7 suggest, high growth in consumption is spread throughout the developing world
and in no way limited to China, India and Brazil, although the sheer size and vigor of
those countries will mean that they will continue to increase their dominance of world
markets for livestock products. Experience for individual commodities will vary widely
among different parts of the developing world, with China leading the way on meat with a
near-doubling of the total quantity consumed; the increments are primarily poultry and
pork. India and the other South Asian countries will drive a large increase in total milk
consumption.
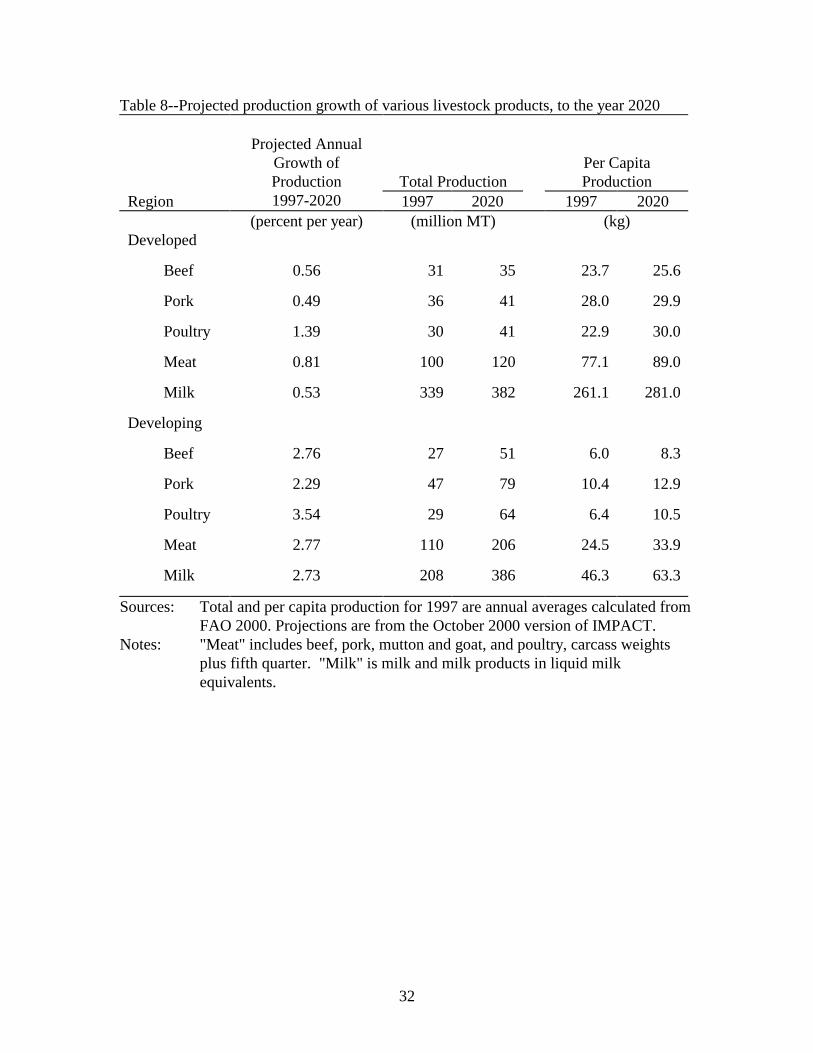
Production patterns generally follow consumption patterns, as sugg4ested by
projected growth rates in production in Table 8 that are similar to growth rates for
consumption in Table 6. Because of the relatively high cost of handling perishable final
products and taste factors, most meat and milk will be produced where it is consumed,
aided by increasing feed imports. By 2020, people living in developing countries are

11
projected to produce on average 38 percent more meat and 37 percent more milk per
capita than in the late 1990s.
Since so much of the expansion in meat production comes from monogastric
livestock such as pigs and poultry, effective demand for concentrate feeds in developing
countries will continue to increase. IMPACT projects a worldwide expansion of an
additional 265 MMT of cereals used as feed per year by 2020, compared to the 1996/98
annual average. This can be compared to an average annual U.S. maize (corn) crop of
about 200 MMT in the 1990’s. Developing countries accounted for 36 percent of cereals
feed use in 1996/98, but are projected to account for 47 percent in 2020. Although the
share of cereals feed use occurring in developed countries is projected to fall, the absolute
amount will increase to 2020, and developed countries will continue to be the big cereals
feed users when there smaller population size is taken into account. On a human per
capita basis, cereals feed use in 2020 in developed countries is projected to be 362 kg,
compared to 71 kg in developing countries (Table 5).
Results for the Updated Model: Trade and Prices
The actual trade situation for livestock products and feed cereals, and the projected
situation for 2020, are shown in Table 9. Several striking conclusions emerge. First, the
big trade flows that equilibrate rapidly growing livestock demand with supply in
developing countries occur primarily in the feed cereals market. Developing countries as
a whole increase their net imports of cereals for all purposes by 98 MMT or to a total of
more than 200 MMT of net annual imports from the developed countries. Maize,
12
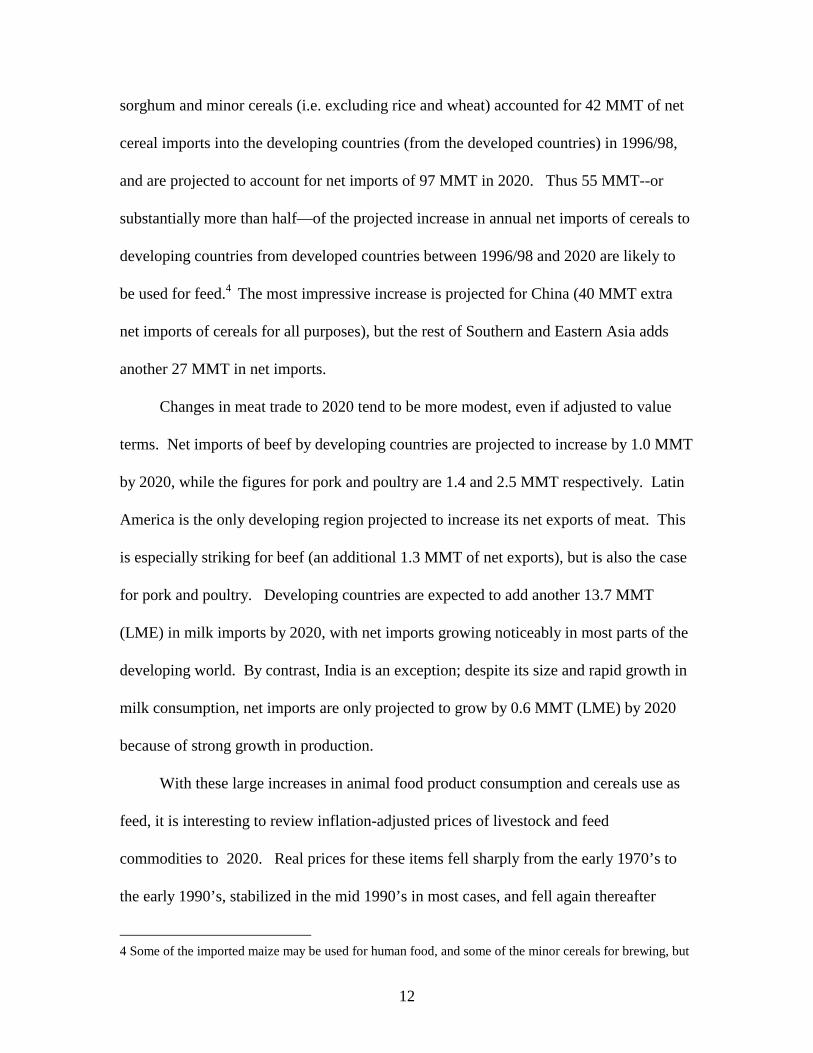
sorghum and minor cereals (i.e. excluding rice and wheat) accounted for 42 MMT of net
cereal imports into the developing countries (from the developed countries) in 1996/98,
and are projected to account for net imports of 97 MMT in 2020. Thus 55 MMT--or
substantially more than half—of the projected increase in annual net imports of cereals to
developing countries from developed countries between 1996/98 and 2020 are likely to
be used for feed.4 The most impressive increase is projected for China (40 MMT extra
net imports of cereals for all purposes), but the rest of Southern and Eastern Asia adds
another 27 MMT in net imports.
Changes in meat trade to 2020 tend to be more modest, even if adjusted to value
terms. Net imports of beef by developing countries are projected to increase by 1.0 MMT
by 2020, while the figures for pork and poultry are 1.4 and 2.5 MMT respectively. Latin
America is the only developing region projected to increase its net exports of meat. This
is especially striking for beef (an additional 1.3 MMT of net exports), but is also the case
for pork and poultry. Developing countries are expected to add another 13.7 MMT
(LME) in milk imports by 2020, with net imports growing noticeably in most parts of the
developing world. By contrast, India is an exception; despite its size and rapid growth in
milk consumption, net imports are only projected to grow by 0.6 MMT (LME) by 2020
because of strong growth in production.
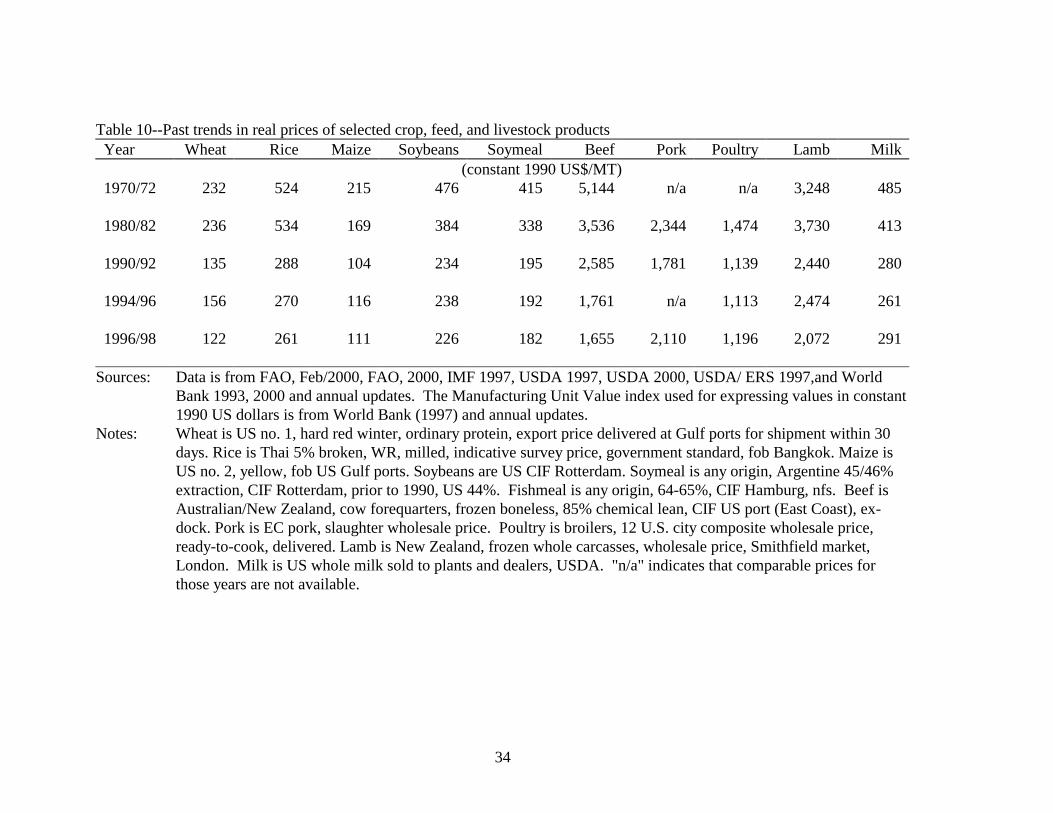
With these large increases in animal food product consumption and cereals use as
feed, it is interesting to review inflation-adjusted prices of livestock and feed
commodities to 2020. Real prices for these items fell sharply from the early 1970’s to
the early 1990’s, stabilized in the mid 1990’s in most cases, and fell again thereafter
4 Some of the imported maize may be used for human food, and some of the minor cereals for brewing, but
13
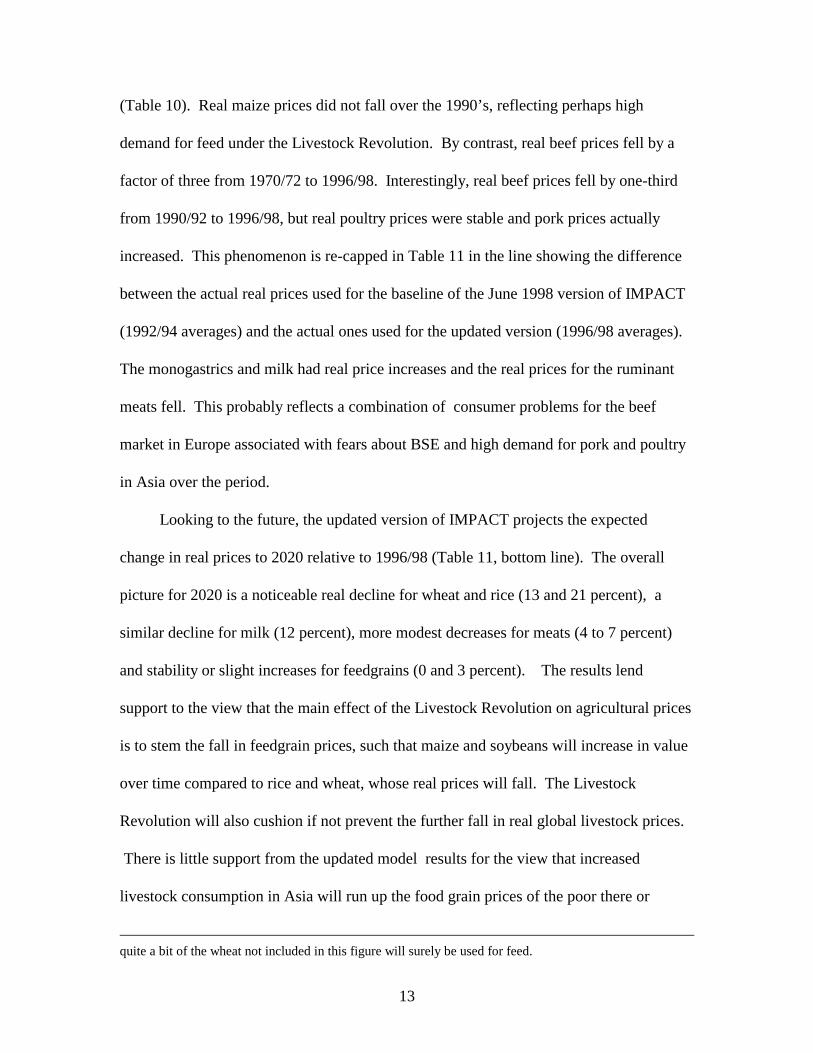
(Table 10). Real maize prices did not fall over the 1990’s, reflecting perhaps high
demand for feed under the Livestock Revolution. By contrast, real beef prices fell by a
factor of three from 1970/72 to 1996/98. Interestingly, real beef prices fell by one-third
from 1990/92 to 1996/98, but real poultry prices were stable and pork prices actually
increased. This phenomenon is re-capped in Table 11 in the line showing the difference
between the actual real prices used for the baseline of the June 1998 version of IMPACT
(1992/94 averages) and the actual ones used for the updated version (1996/98 averages).
The monogastrics and milk had real price increases and the real prices for the ruminant
meats fell. This probably reflects a combination of consumer problems for the beef
market in Europe associated with fears about BSE and high demand for pork and poultry
in Asia over the period.
Looking to the future, the updated version of IMPACT projects the expected
change in real prices to 2020 relative to 1996/98 (Table 11, bottom line). The overall
picture for 2020 is a noticeable real decline for wheat and rice (13 and 21 percent), a
similar decline for milk (12 percent), more modest decreases for meats (4 to 7 percent)
and stability or slight increases for feedgrains (0 and 3 percent). The results lend
support to the view that the main effect of the Livestock Revolution on agricultural prices
is to stem the fall in feedgrain prices, such that maize and soybeans will increase in value
over time compared to rice and wheat, whose real prices will fall. The Livestock
Revolution will also cushion if not prevent the further fall in real global livestock prices.
There is little support from the updated model results for the view that increased
livestock consumption in Asia will run up the food grain prices of the poor there or
quite a bit of the wheat not included in this figure will surely be used for feed.

14
elsewhere, especially since world maize prices were very significantly higher in the real
terms in the 1970’s and 1980’s than they are now, or are projected to be in 2020.
Sensitivity Analysis
Formal sensitivity analysis of livestock issues has not been completed for the
updated model, but both the differences of the present forecast from the previous forecast
and detailed sensitivity analysis with the older version of the model reported in Delgado
et al. (1999a) provide insight into the sensitivity of model results to different components.
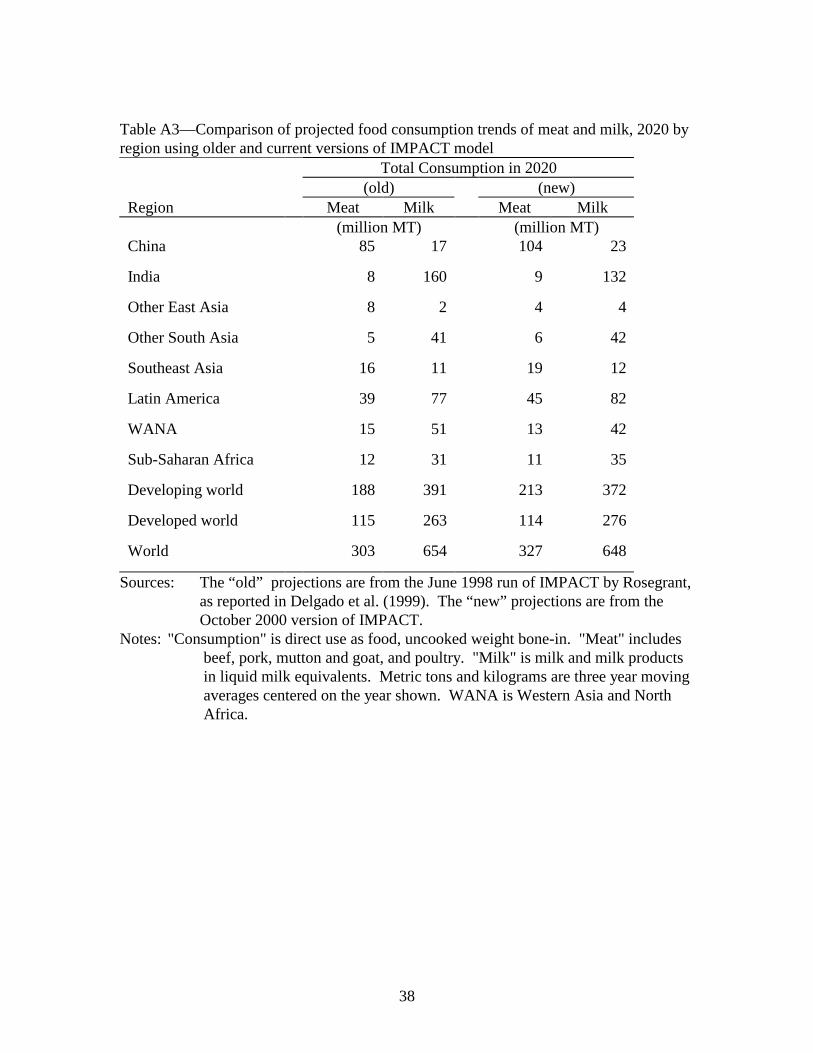
Beyond the comparison of real price projections for 2020 in Table 11, Appendix tables
A2 and A3 present comparisons of projected total and per capita food consumption for
different livestock products in different regions from Delgado et al. (1999a) and the
October 2000 version of IMPACT presented above. Despite the many updates listed
above in the model, the projections for 2020 are essentially similar, with two significant
exceptions.
The first is that the new runs project a markedly higher rate of growth of poultry in
Asia than previously, projecting a further 18 MMT increase in consumption for
developing countries as a whole (37 percent above the previous forecast). This stems
from the slightly less pessimistic income scenarios in Asia and slightly increased price
elasticities.5 The second significant change between the older and newer set of 2020
consumption projections is that milk consumption in developed countries is expected to
be 5 percent higher than forecast previously, and milk consumption in developing
5 The lower baseline price used for poultry in the October 2000 is not a factor, counter to economic intuition. This is because in the normalization of the model, all price changes are in essence percentage price changes from the baseline.
15
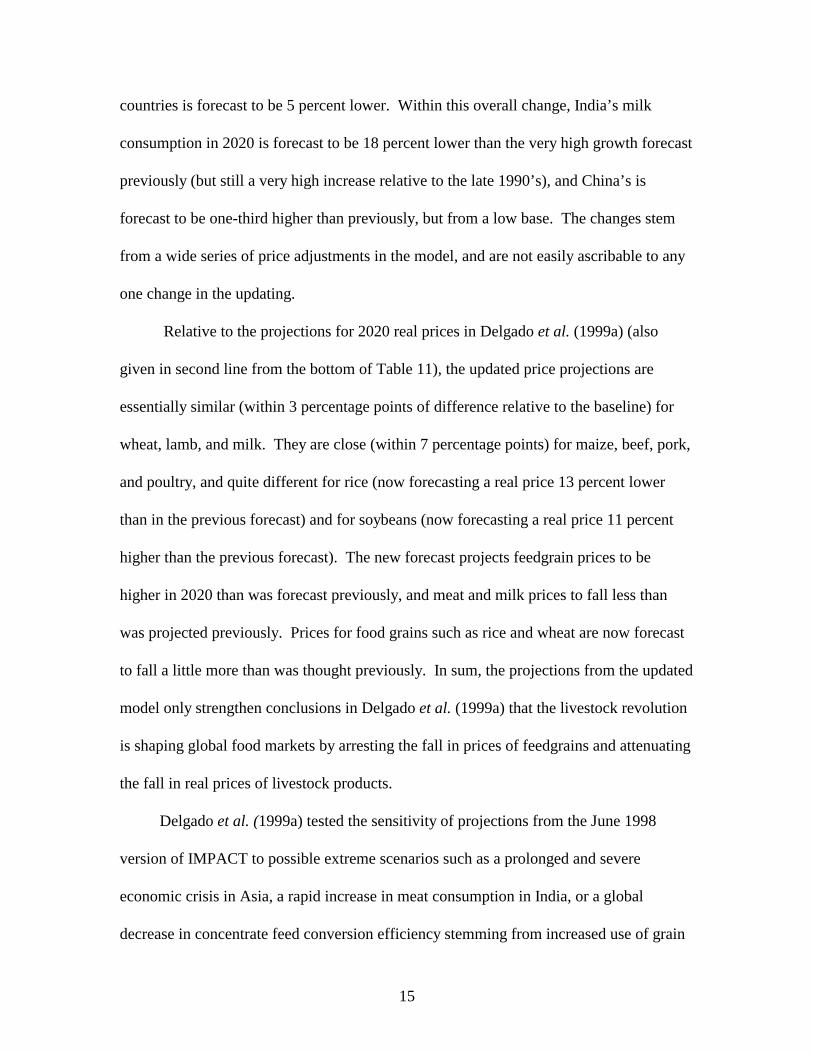
countries is forecast to be 5 percent lower. Within this overall change, India’s milk
consumption in 2020 is forecast to be 18 percent lower than the very high growth forecast
previously (but still a very high increase relative to the late 1990’s), and China’s is
forecast to be one-third higher than previously, but from a low base. The changes stem
from a wide series of price adjustments in the model, and are not easily ascribable to any
one change in the updating.
Relative to the projections for 2020 real prices in Delgado et al. (1999a) (also
given in second line from the bottom of Table 11), the updated price projections are
essentially similar (within 3 percentage points of difference relative to the baseline) for
wheat, lamb, and milk. They are close (within 7 percentage points) for maize, beef, pork,
and poultry, and quite different for rice (now forecasting a real price 13 percent lower
than in the previous forecast) and for soybeans (now forecasting a real price 11 percent
higher than the previous forecast). The new forecast projects feedgrain prices to be
higher in 2020 than was forecast previously, and meat and milk prices to fall less than
was projected previously. Prices for food grains such as rice and wheat are now forecast
to fall a little more than was thought previously. In sum, the projections from the updated
model only strengthen conclusions in Delgado et al. (1999a) that the livestock revolution
is shaping global food markets by arresting the fall in prices of feedgrains and attenuating
the fall in real prices of livestock products.
Delgado et al. (1999a) tested the sensitivity of projections from the June 1998
version of IMPACT to possible extreme scenarios such as a prolonged and severe
economic crisis in Asia, a rapid increase in meat consumption in India, or a global
decrease in concentrate feed conversion efficiency stemming from increased use of grain

16
in animal rations under industrialization. In all cases, the projected growth of aggregate
consumption of livestock products in developing countries remained strong. The
projected consumption growth in Asia was lower in the severe economic crisis scenario,
and world prices fell further in that scenario than they did in the base projection to 2020.
The scenario incorporating a dramatic shift in tastes in India toward meat consumption
had the opposite effect, raising projected world prices. Other model runs showed that
changes in production efficiency and cost matter greatly to the relative competitiveness
and production outcomes of individual countries, to the use of cereals as feed, and to
world trade patterns, but barely affected projected levels of world livestock consumption.
It was assumed in sensitivity analysis that between 1992/94 and 2020 the amount of feed
required to produce a unit of meat and milk in developing countries would rise by an
additional 60 percent; the result of this change from the baseline in the older model was
that world maize prices were only 21 percent higher in 2020 than the original baseline
projection. In real terms, that level was still half the prevailing prices in the early 1980s.
Both the projections of the June 1998 version of IMPACT and the updated
projections form the October 2000 version are confirmed by events in world markets over
the past 30 years. Demand increases for meat and milk have largely been met through
expansion of feed production or imports at world prices that have declined in real terms
over time. Historically, livestock has been one of the main factors stabilizing world
cereal supply. Evidence from years of cereal price shocks in the 1970s and 1980s
suggests that reductions in cereal supply were largely absorbed by reductions in feeding to
livestock.
17
The model assumes that the most important forces driving increasing consumption
of animal products--population, income growth, and urbanization--will continue during
the next twenty years, albeit at reduced rates compared to the past 20 years. The key
conclusion from the model is that even with only modestly increasing productivity, large
amounts of additional meat, milk, and feed will be supplied without dramatic price
increases. The issues then are not whether sufficient animal products and cereals will be
available, but what impact increased production and consumption will have on the
environment, human health, and the incomes of the poor. Because developing countries
will produce 63 percent of world meat and 50 percent of world milk in 2020, the brunt of
the benefits and costs of the Livestock Revolution will accrue in those regions.
Conclusions: Opportunities and Perils
The principal conclusion of the present study is to confirm the finding in the
previous work that the Livestock Revolution in developing countries will continue at least
to 2020 and will increasingly drive world markets for meat, milk and feed grains. Thus
whether it is a good thing is not the issue; it is a phenomenon that will occur. In fact the
updates actually strengthen this conclusion, as the changes in the world that have been
incorporated in the updating have slightly alleviated the basically very conservative
assumptions of the original work.
Developing countries as a whole will increase their already large net imports of
cereals to a an annual amount in 2020 of about the same magnitude as the annual U.S.
corn crop (200 MMT). About half (97MMT) of these net imports will be maize and
cereals other than rice and wheat; most of the coarse grains will probably go to feeding, as

18
may some of the wheat. Net meat imports into developing countries from the developed
countries are also projected to expand (by a factor of 10), but from a smaller base at the
present time. Developing countries as a whole are projected to increase their net meat
impoerts from the North by an annual level of about 5 MMT by 2020; half of this will be
poultry imports, with the remainder being 1.4 MMT of pork and 1 MMT of beef. Net
milk imports into developing countries are projected to expand by an additional 13.7
MMT (LME) to a annual total by 2020 of 33.7 MMT.
Results also confirm the finding that the Livestock Revolution is not necessarily a
threat to the poor through raising cereals prices. The model suggests relative little change
in 2020 relative to real price levels in the base years 1996/98. Principally because of net
import demand from developing countries, feedgrain prices will remain at about 1996/98
average levels. Meat prices will fall in the range of 4 to 7 percent, whereas the milk price
is projected to fall 12 percent. These falls would be substantially higher without the
Livestock Revolution. However, an assessment of the impact of the Livestock
Revolution on developing countries requires going beyond projections. Because previous
trends have been found to hold and perhaps even to be stronger than expected, the rest of
the present paper will draw liberally on the previous work in this regard.6
On the positive side, increased consumption of animal products can improve the
incomes of poor farmers and food processors in developing countries. Considerable
evidence from in-depth field studies of rural households in Africa and Asia shows that the
rural poor and landless presently get a higher share of their income from livestock than do
better-off rural people (von Braun and Pandya-Lorch 1991; Delgado et al. 1999a). The
19
exception tends to be in Latin America, where relative rural wealth correlates more
clearly with cattle holdings. In most of the developing world, a goat, a pig, some
chickens, or a milking cow can provide a key income supplement for the landless and
otherwise asset-poor.
Some analysts contemplating the Livestock Revolution extend the concern with
excess animal products consumption in developed countries to the rise in consumption in
developing countries. However, for the majority of people in developing countries,
whose consumption levels are still very low as evidenced by Table 1, little evidence
supports this view. On the contrary, protein and micro-nutrient deficiencies, which tend
to disappear with increased consumption of livestock products, remain widespread in
developing countries. There is valid concern that those who most need the added meat
and milk will not get it simply from increasing production, and this is a highly valid
policy concern.
Rapid industrialization of production of monogastrics under the Livestock
Revolution will supply urban supermarkets, but may not bolster rural incomes in a
widespread manner unless specific actions are undertaken. There are large economies of
scale in processing livestock-origin food products and in input supply, but far less in
production itself once market distortions favoring powerful producers are removed.
Poverty policy can promote vertical integration of small producers with livestock food
processors, through contract farming or participatory producer coops. The alternative
might be that the poor are driven out by industrial livestock producers and the one
growing market they presently supply will be closed to them. Simulations with IMPACT
6 Principally on Delgado et al. (1999b).

20
show that policies affect the costs of livestock production and thus, the location and type
of production at home and abroad. Policies towards infrastructure, pollution, access to
capital, and rural organization will affect the comparative advantage of smallholders
versus large industrial enterprises.
Conversely, the Livestock Revolution may worsen environmental problems (de
Haan et al. 1997). The expansion of livestock food production in developing countries
until recently came primarily from rapidly increasing numbers of animals rather than from
higher carcass weights. This increase contributed to large concentrations of animals and
people in urban environments in many cities of developing countries with weak
regulations governing livestock production (such as in Beijing, Mumbai, Lima, and Dar-
es-Salaam). Over-stocking has also occurred In places where land is "free" (such as most
of the African Sahel); more intensive use of the land without additional inputs could
further degrade its productivity. Property rights systems that do not internalize
externalities are responsible for most problems of this kind.
Conversely, animals have tended over time to be produced more intensively in
places where financial capital is cheap relative to land (such as the Netherlands),
worsening waste and air problems. Nutrient loading has occurred where the social cost
has not been fully passed on to the producers and through them to the consumers.
Distortions in domestic capital markets, such as subsidized lending to influential
organizations, often promote inefficient, large-scale pig, milk, and poultry production in
the peri-urban areas of developing countries. These policies distort the pattern of
livestock development and ultimately cannot be sustained. Further, poor infrastructure
and distortions in the marketing chain, such as extortionate police road stops that prevent

21
competition from rural areas, poor environmental regulation, and lack of legal
accountability for pollution promote urban piggeries and dairies that cannot adequately
dispose of waste materials.
Growing concentrations of animals and people in the major cities of developing
countries also notably increased the incidence of zoonotic diseases such as infections
from Salmonella, E-coli, and Avian Flu--diseases that can only be controlled through
enforcement of zoning and health regulations. The Livestock Revolution also raises other
major public health concerns. Greater intensification of livestock production has caused
a build-up of pesticides and antibiotics in the food chain in many places of both the
developed and developing world. Furthermore, as the consumption of livestock products
increases in tropical climates, food safety risks from microbial contamination become
more prevalent.
Policy needs to focus on removing the overt distortions that produce problems,
while promoting institutional change in property rights in commercializing smallholder
areas. Governments and development partners wanting to help the poor in commercially
viable activities need to follow the Livestock Revolution closely. The rapidly growing
demand for livestock products is a rare opportunity for smallholder farmers to benefit
from a rapidly growing market. The worst thing that well-motivated agencies can do is to
cease public investments that facilitate economic, sustainable, and small-operator forms
of market-oriented livestock production. Lack of action will not stop the Livestock
Revolution, but it will help ensure that the form it takes is less favorable for growth,
poverty alleviation and preservation of the environment.

22
References
Cranfield, J.A.L., T.W. Hertel, J.S. Eales and P.V. Preckel. 1998. Changes in the
structure of global food demand. American Journal of Agricultural Economics 80(5):1042-1050.
Delgado, C., and C. Courbois. 1998. Trade-offs among fish, meat, and milk demand in
developing countries from the 1970s to the 1990s. in A. Eide and T. Vassdal, eds., Proceedings of the IXth Biennial Conference of the International Institute of Fisheries Economics and Trade--IIFET 98, July 7-11, Tromsö, Norway: University of Tromso, Norwegian School of Fisheries.
Delgado, C., M. Rosegrant, H. Steinfeld, S. Ehui, and C. Courbois. 1999a. Livestock to
2020: The next food revolution. Food, Agriculture, and the Environment Discussion Paper 28. Washington, DC: International Food Policy Research Institute.
Delgado, C., M. Rosegrant, H. Steinfeld, S. Ehui, and C. Courbois. 1999b. The Coming
Livestock Revolution. Choices: Choices at the Millennium, A Special Issue. Fourth Quarter 1999. 40-44.
Delgado, C., C. Courbois, M.W. Rosegrant and M. Ahmed. 2000. Issues in Modeling
Fish to 2020 within a Global Food Model. Paper presented at biennial meetings of the International Institute of Fisheries Economics and Trade. IIFET2000: Microbehavior and Macroresults, Corvallis, Oregon, U.S.A., July 10-14, 2000.
de Haan, C., H. Steinfeld, and H. Blackburn. 1997. Livestock and the environment:
Finding a balance. Report of a study coordinated by the Food and Agriculture Organization of the United Nations, the United States Agency for International Development, and the World Bank. Brussels: European Commission Directorate-General for Development.
FAO (Food and Agriculture Organization of the United Nations), 1997a. FAO Statistics
Database. <http:faostat.fao.org/default. htm>. Accessed September and December 1997. Rome: FAO (Food and Agriculture Organization of the United Nations).
FAO, 1999. The State of the World Fisheries and Aquaculture. Rome: FAO (Food and
Agriculture Organization of the United Nations). FAO, February 2000. Food Outlook, Global information and early warning system on
food and agriculture, Commodities and Trade Division (ESC), Rome, Italy. FAO. 2000. FAO Statistics Database. <http:faostat.fao.org/default. htm>. Accessed July
2000. Rome: FAO (Food and Agriculture Organization of the United Nations).

23
IMF (International Monetary Fund). 1997. International financial statistics yearbook.
Washington, DC. Rae, A.N., 1998. ‘The Effects of Expenditure Growth and Urbanization on Food
Consumption in East Asia: a Note on Animal Products’, Agricultural Economics 18: 291-299.
Rosegrant, M. W., M. Agcaoili-Sombilla, R. V. Gerpacio, and C. Ringler. 1997. Global
food markets and US exports in the twenty-first century. Paper presented at the Illinois World Food and Sustainable Agriculture Program Conference "Meeting the Demand for Food in the 21st Century: Challenges and Opportunities for Illinois Agriculture," May 28, Urbana Champaign.
Rosegrant, M.W., 1999. International Model for Policy Analysis of Agricultural
Commodities and Trade (IMPACT): Model Description. International Food Policy Research Institute, Washington DC. (mimeo).
Rosegrant, M. W., M. Agcaoili-Sombilla, and N. Perez. 1995. Global food projections to
2020: Implications for investment. 2020 Vision Discussion Paper No. 5. Washington, DC: International Food Policy Research Institute.
Simpson, J. R., X. Cheng, and A. Miyazaki. 1994. China's livestock and related
agriculture: Projections to 2025. Wallingford, UK: CAB International. UN (United Nations), 1998. World Population Prospects, 1998 Revision. Comprehensive
Tables, United Nations, New York.
USDA(United States Department of Agriculture), ERS (Economic Research Service of USDA). 1997. World agriculture: Trends and indicators\World and regional data. <http://mann77.mannlib.cornell.edu/data-sets/international/89024/14/World.wk1>. Accessed 12/1/97.
USDA. 1997. Agricultural statistics. Washington, DC: United States Government
Printing Office. USDA, ERS. FATUS database: http:///www.ers.usda.gov Accessed July, 2000. USDA, April 2000. Milk Production, Disposition and Income; 1999 Summary. National
Agricultural Statistics Service, NASS, USDA, USA.
Von Braun, J., and R. Pandya-Lorch. 1991. Income sources of malnourished people in rural areas: A synthesis of case studies and implications for policy. In Income sources of malnourished people in rural areas: Microlevel information and policy implications, ed. J. von Braun and R. Pandya-Lorch. Working Papers on

24
Commercialization of Agriculture and Nutrition, No. 5. Washington, D.C.: International Food Policy Research Institute.
World Bank. 1993. Price prospects for major primary commodities, 1990-2005, volume
2. Washington, DC. World Bank. annual. Commodity markets and the developing countries. Washington, DC. World Bank, 2000. Global Commodity Markets: A Comprehensive Review and Price
Forecast. Commodities Team Development Prospects Group, World Bank, Washington DC.

25
Table 1--Annual per capita human food consumption (kg) and percent of calories from selected livestock products, 1973 and 1997
Commodity Developed Countries Developing Countries 1973 1997 1973 1997
Beef 26 23 4 6 (3%) (3%) (1%) (1%)
Mutton and goat 3 2 1 2 (1%) (0+%) (0%) (0+%)
Pork 26 28 4 10 (4%) (5%) (2%) (4%)
Poultry 11 21 2 7 (1%) (3%) (0%) (1%)
Eggs 13 14 2 7 (2%) (1%) (0%) (1%)
Milk and products excluding butter 188 245 29 51 (9%) (9%) (2%) (3%)
Four meats 67 75 11 25 (10%) (10%) (3%) (6%)
Four meats, eggs, and milk 268 334 42 83 (20%) (20%) (6%) (10%)
Source: Calculated from data in FAO 2000. Notes: "Four meats" includes beef, pork, mutton and goat, and poultry. Percentages
of total food calories consumed directly by humans accounted for by the item and location shown are given in parentheses. Values are three year moving averages centered on the year shown; percentages are calculated from three year moving averages. Throughout this report the term "food" will be used to distinguish direct food consumption by humans from uses of animal products as feed, fuel, cosmetics, or coverings.
26
Table 2—Per Capita meat and milk consumption by region, 1983 and 1997 Region Meat Milk
1983 1997 1983 1997 (kilograms) China 16 43 3 8
Other East Asia 22 31 15 19
India 4 4 46 62
Other South Asia 6 9 47 63
Southeast Asia 11 18 10 12
Latin America 40 54 93 112
WANA 20 21 86 73
Sub-Saharan Africa 10 10 32 30
Developing world 14 25 35 43
Developed world 74 75 195 194
United States 107 120 237 257
World 30 36 76 77
Source: Values are three-year moving averages centered on the year shown, calculated from data in FAO 2000.

27
Table 3--Food consumption trends of various livestock products 1983 and 1997
Total Consumption % of
World Total
Per Capita Consumption
Region
1983 1997 1997 1983 1997 (million MT) (kg) Developed world
Beef 32 30 52.2 27 25
Pork 34 36 43.4 29 28
Poultry 19 28 49.1 16 20
Meat 88 98 46.9 74 76
Milk 233 251 56.4 195 192
Developing world
Beef 16 27 47.4 5 5
Pork 20 47 56.6 6 9
Poultry 10 29 50.9 3 5
Meat 50 111 53.1 14 21
Milk 122 194 43.6 35 40
Source: Calculated from data in FAO 2000. Notes: "Consumption" is direct use as food, uncooked weight bone-in. "Meat"
includes beef, pork, mutton and goat, and poultry. "Milk" is milk and milk products in liquid milk equivalents. Metric tons and kilograms are three year moving averages centered on the year shown.
28
Table 4--Food consumption of meat and milk by region, 1983 and 1997 Total Meat
Consumption Total Milk
Consumption Region 1983 1997 1983 1997 (million MT) (million MT) China 16 53 3 10
India 3 4 34 60
Other East Asia 1 2 1 1
Other South Asia 1 3 11 21
Southeast Asia 4 9 4 6
Latin America 15 26 35 54
of which Brazil 11 20
WANA 5 7 21 25
Sub-Saharan Africa 4 6 12 17
Developing world 50 111 122 194
Developed world 88 98 233 251
World 139 208 355 445
Source: Calculated from data in FAO 2000. Notes: "Consumption" is direct use as food, uncooked weight bone-in. "Meat"
includes beef, pork, mutton and goat, and poultry. "Milk" is milk and milk products in liquid milk equivalents. Metric tons and kilograms are three year moving averages centered on the year shown. WANA is Western Asia and North Africa.

29
Table 5--Trends in the use of cereal as feed Total Cereal Use as Feed Region 1983 1993 1997 2020 (million MT) Chinaa 40-49 78-84 91-111 221
India 2 3 2 4
Other East Asia 3 7 8 12
Other South Asia 1 1 1 1
Southeast Asia 6 12 15 27
Latin America 40 55 58 98
WANA 24 29 36 59
Sub-Saharan Africa 2 3 4 8
Developing world 128 194 235 432
Developed world 465 442 425 493
World 592 636 660 925
Sources: Calculated from data in FAO 2000. Figures are three year moving averages centered on year shown. The 2020 projections are from the October 2000 version of the IMPACT model.
Notes: Cereals includes wheat, maize, rice, barley, sorghum, millet, rye, and oats. Metric tons and kilograms are three year averages centered on the year shown. WANA is Western Asia and North Africa. aSimpson, Cheng, and Miyazaki (1994) report 40 million MT from USDA ERS data. That figure is used here because it is more consistent with the feed quantities and feed/meat conversion ratios in Rosegrant et al. 1997. FAO (1997a) reports 49 million MT. Extrapolations of the lower figure yield the lower bound estimate. FAO data are used on the upper bound and in the totals.

30
Table 6--Projected food consumption trends of various livestock products to the year 2020
Total
Consumption
% of World
Total
Per Capita
Consumption Region
Projected Annual Growth of
Consumption 1997-2020 1997 2020 2020 1997 2020
(percent per year) (million MT) (kg) Developed world
Beef 0.5 30 34 39.5 23.3 24.8
Pork 0.4 36 39 32.8 27.9 28.8
Poultry 1.3 28 38 36.2 21.7 27.6
Meat 0.7 98 114 34.9 75.3 84.0
Milk 0.6 251 276 42.6 193.6 202.9
Developing world
Beef 2.9 27 52 60.5 6.0 8.5
Pork 2.4 47 80 67.2 10.4 13.1
Poultry 3.7 29 67 63.8 6.5 11.1
Meat 2.9 111 213 65.1 24.6 34.9
Milk 2.9 194 372 57.4 43.2 61.1
Sources: Total and per capita consumption for 1997 are calculated from FAO 2000 and are three-year moving averages centered on 1997. The 2020 projections are from the October 2000 version of the IMPACT model.
Notes: "Consumption" is direct use as food, uncooked weight bone-in. "Meat" includes beef, pork, mutton and goat, and poultry. "Milk" is milk and milk products in liquid milk equivalents. Metric tons and kilograms are three year moving averages centered on the year shown. WANA is Western Asia and North Africa.

31
Table 7--Projected food consumption trends of meat and milk, 1997-2020
Projected annual
growth 1997-2020
Total Consumption in
2020
Per Capita Consumption in
2020 Region Meat Milk Meat Milk Meat Milk (percent per year) (million MT) (kg) China 3.0 3.5 104 23 71 16
India 3.5 3.2 9 132 7 104
Other East Asia 3.2 1.7 4 4 54 29
Other South Asia 3.3 3.0 6 42 12 78
Southeast Asia 3.3 2.9 19 12 29 18
Latin America 2.4 1.8 45 82 69 127
of which Brazil 2.3 1.7 19 30 92 142
WANA 2.6 2.2 13 42 26 83
Sub-Saharan Africa 3.2 3.3 11 35 12 37
Developing world 2.9 2.7 213 372 35 61
Developed world 0.7 0.4 114 276 84 203
World 2.0 1.5 327 648 44 87
Sources: Total and per capita meat consumption for 1997 are annual averages of 1996 to 1998 values, calculated from FAO 2000. Projections are from the October 2000 version of IMPACT.
Notes: "Consumption" is direct use as food, uncooked weight bone-in. "Meat" includes beef, pork, mutton and goat, and poultry. "Milk" is milk and milk products in liquid milk equivalents. Metric tons and kilograms are three year moving averages centered on the year shown. WANA is Western Asia and North Africa.
32
Table 8--Projected production growth of various livestock products, to the year 2020
Total Production
Per Capita Production
Region
Projected Annual
Growth of Production 1997-2020 1997 2020 1997 2020
(percent per year) (million MT) (kg) Developed
Beef 0.56 31 35 23.7 25.6
Pork 0.49 36 41 28.0 29.9
Poultry 1.39 30 41 22.9 30.0
Meat 0.81 100 120 77.1 89.0
Milk 0.53 339 382 261.1 281.0
Developing
Beef 2.76 27 51 6.0 8.3
Pork 2.29 47 79 10.4 12.9
Poultry 3.54 29 64 6.4 10.5
Meat 2.77 110 206 24.5 33.9
Milk 2.73 208 386 46.3 63.3
Sources: Total and per capita production for 1997 are annual averages calculated from FAO 2000. Projections are from the October 2000 version of IMPACT.
Notes: "Meat" includes beef, pork, mutton and goat, and poultry, carcass weights plus fifth quarter. "Milk" is milk and milk products in liquid milk equivalents.

33
Table 9-Net exports (imports) of various livestock products by location in 1997 and projected to the year 2020 Beef Pork Poultry Milk Cereals Region 1997 2020 1997 2020 1997 2020 1997 2020 1997 2020 (million MT) China -0.042 -0.608 0.159 -1.182 -0.155 -2.231 -1.369 -2.917 -7.760 -47.60
India 0.158 0.072 0 -0.064 0 -0.041 0.048 -0.539 1.701 -6.417
Other East Asia -0.185 -0.487 0.007 -0.135 -0.038 -0.502 -0.195 -0.553 -13.58 -19.43
Other South Asia -0.022 -0.128 0 -0.006 -0.001 -0.088 -0.759 -3.584 -4.972 -15.04
Southeast Asia -0.197 -0.830 -0.008 0.109 0.158 0.280 -4.663 -8.837 -5.704 -8.645
Latin America 0.500 1.823 -0.105 0.049 -0.060 0.588 -5.767 -4.539 -15.35 -3.489
WANA -0.377 -0.744 -0.006 -0.016 -0.459 -0.905 -4.885 -7.864 -45.23 -73.10
Sub-Saharan Africa 0.011 -0.063 -0.043 -0.092 -0.127 -0.214 -2.279 -4.596 -12.53 -27.34
Developing world -0.152 -1.156 -0.007 -1.402 -0.701 -3.155 -20.01 -33.70 -104.1 -202.1
Developed world 0.152 1.156 0.007 1.402 0.701 3.155 20.01 33.70 104.1 202.1
Source: Projections are based on production minus consumption in the years shown for the commodity and region shown. Figures for 1997 are annual averages calculated from FAO 2000. Projections are from the October 2000 version of IMPACT.
Notes: Metric tons are carcass weights plus fifth quarter for meat. "Milk" is milk and milk products are in liquid milk equivalents. Net export (import) figures may not sum to zero overall because of rounding.
34
Table 10--Past trends in real prices of selected crop, feed, and livestock products Year Wheat Rice Maize Soybeans Soymeal Beef Pork Poultry Lamb Milk (constant 1990 US$/MT) 1970/72
232 524 215 476 415 5,144 n/a n/a 3,248 485
1980/82
236 534 169 384 338 3,536 2,344 1,474 3,730 413
1990/92
135 288 104 234 195 2,585 1,781 1,139 2,440 280
1994/96
156 270 116 238 192 1,761 n/a 1,113 2,474 261
1996/98
122 261 111 226 182 1,655 2,110 1,196 2,072 291
Sources: Data is from FAO, Feb/2000, FAO, 2000, IMF 1997, USDA 1997, USDA 2000, USDA/ ERS 1997,and World Bank 1993, 2000 and annual updates. The Manufacturing Unit Value index used for expressing values in constant 1990 US dollars is from World Bank (1997) and annual updates.
Notes: Wheat is US no. 1, hard red winter, ordinary protein, export price delivered at Gulf ports for shipment within 30 days. Rice is Thai 5% broken, WR, milled, indicative survey price, government standard, fob Bangkok. Maize is US no. 2, yellow, fob US Gulf ports. Soybeans are US CIF Rotterdam. Soymeal is any origin, Argentine 45/46% extraction, CIF Rotterdam, prior to 1990, US 44%. Fishmeal is any origin, 64-65%, CIF Hamburg, nfs. Beef is Australian/New Zealand, cow forequarters, frozen boneless, 85% chemical lean, CIF US port (East Coast), ex-dock. Pork is EC pork, slaughter wholesale price. Poultry is broilers, 12 U.S. city composite wholesale price, ready-to-cook, delivered. Lamb is New Zealand, frozen whole carcasses, wholesale price, Smithfield market, London. Milk is US whole milk sold to plants and dealers, USDA. "n/a" indicates that comparable prices for those years are not available.

35
Table 11--Real prices of selected crop, livestock, and fisheries products as projected by the IMPACT model Year Wheat Rice Maize Soybeans Beef Pork Poultry Lamb Milk (constant 1996/98 average US$/MT) IMPACT new baseline prices 1996-98 133 285 94 247 1808 2304 735 2918 318 Impact baseline projections (new)
2010 129 287 104 248 1775 2320 701 2931 308 2020 115 223 97 248 1696 2147 700 2709 277
(total percentage change relative to starting period) Percentage increase 1992-94 actual to 1996-98 actual -17 -5 -11 -14 -18 +18 +6 -15 +7 Projected percentage increase 1992-94 to 2020 in older version of model -10 -8 -2 -11 -12 -11 -11 -9 -14 Projected percentage increase 1996-98 to 2020 (updated model) -13 -21 +3 0 -6 -6 -4 -7 -12
Notes: The IMPACT base prices in 1996-1998 are comparable to series given in Table 10, except : (a) they are expressed in
constant 1996-1998 avg. US$; (b) the base price for maize is the 1997-99 avg. because of the 1996 maize price spike; and (c) a lower price poultry series more representative of developing countries was used in lieu of the U.S. domestic broiler price in the previous table. The latter was used in the previous table to give a longer time series of changes.
Sources: Actual prices are from Table 10, except for items in “notes” above. Projections from the 1992-94 baseline use older version of IMPACT by Rosegrant reported in Delgado et al. 1999a. Projections from 1996/98use the Oct. 2000 version of IMPACT.

36
Table A1--Regional classification of countries Region Member Countries
China Mainland China
Other East Asia Hong Kong, Macau, Mongolia, North Korea, and South Korea
India India
Other South Asia Afghanistan, Bangladesh, Bhutan, Maldives, Nepal, Pakistan, and Sri Lanka
Southeast Asia Brunei, Cambodia, East Timor, Indonesia, Laos, Malaysia, Myanmar, Philippines, Singapore, Thailand, and Vietnam
Latin America South and Central America and Caribbean
Western Asia and North Africa (WANA)
Algeria, Bahrain, Cyprus, Egypt, Gaza Strip, Iran, Iraq, Jordan, Kuwait, Lebanon, Libya, Morocco, Oman, Qatar, Saudi Arabia, Syria, Tunisia, Turkey, United Arab Emirates, Western Sahara, and Yemen
Sub-Saharan Africa Africa south of the Sahara except for South Africa
Developed Australia, Canada, Eastern Europe, European Union, other western European countries, Israel, former Soviet Union, Japan, New Zealand, South Africa, United States
Developing All other countries in FAO Statistics Database
World All countries included in FAO Statistics Database
Sources: Regional groupings were chosen based on FAO 1997a, which is consistent with classification in Rosegrant et al. 1997.
Note: Data from some small countries were not available in all series in all years. Missing values for very small countries are ignored without note.

37
Table A2—Comparison of projected food consumption trends of various livestock products, to the year 2020 by product using older and current versions of the IMPACT model
Projected Annual Growth of
Consumption 1997-2020
(percent per year)
Total Consumption
Per Capita Consumption
Region (old)
(new)
2020 (old)
2020 (new)
2020 (old)
2020 (new)
(million MT) (kg) Developed world
Beef 0.4 0.5 36 34 26 25
Pork 0.3 0.4 41 39 29 29
Poultry 1.0 1.3 34 38 25 28
Meat 0.6 0.7 115 114 83 84
Milk 0.2 0.4 263 276 189 202
Developing world
Beef 2.8 2.9 47 52 7 8
Pork 2.8 2.4 81 80 13 13
Poultry 3.1 3.7 49 67 8 11
Meat 2.9 2.9 188 213 30 35
Milk 3.3 2.9 391 372 62 61
Sources: The “old” projections are from the June 1998 run of IMPACT by Rosegrant, as reported in Delgado et al. 1999a. The “new” projections for 2020 are from the October 2000 version of IMPACT.
Notes: "Consumption" is direct use as food, uncooked weight bone-in. "Meat" includes beef, pork, mutton and goat, and poultry. "Milk" is milk and milk products in liquid milk equivalents.
38
Table A3—Comparison of projected food consumption trends of meat and milk, 2020 by region using older and current versions of IMPACT model Total Consumption in 2020 (old) (new) Region Meat Milk Meat Milk (million MT) (million MT) China 85 17 104 23
India 8 160 9 132
Other East Asia 8 2 4 4
Other South Asia 5 41 6 42
Southeast Asia 16 11 19 12
Latin America 39 77 45 82
WANA 15 51 13 42
Sub-Saharan Africa 12 31 11 35
Developing world 188 391 213 372
Developed world 115 263 114 276
World 303 654 327 648
Sources: The “old” projections are from the June 1998 run of IMPACT by Rosegrant, as reported in Delgado et al. (1999). The “new” projections are from the October 2000 version of IMPACT.
Notes: "Consumption" is direct use as food, uncooked weight bone-in. "Meat" includes beef, pork, mutton and goat, and poultry. "Milk" is milk and milk products in liquid milk equivalents. Metric tons and kilograms are three year moving averages centered on the year shown. WANA is Western Asia and North Africa.


![ANALISIS REGRESI SEDERHANA - eprints.dinus.ac.ideprints.dinus.ac.id/14560/1/[Materi]_ANALISIS_REGRESI_DENGAN_VA… · JENIS-JENIS VARIABEL DALAM PENELITIAN Variabel Bebas ( Independen](https://img.pdfslide.net/doc/110x75/5a7d19667f8b9a563b8d6cb0/analisis-regresi-sederhana-materianalisisregresidenganvajenis-jenis-variabel.jpg)