Embed Size (px)
Citation preview
December 26, 2018
Steven T. James
House Clerk
State House Room 145
Boston, MA 02133
William F. Welch
Senate Clerk
State House Room 335
Boston, MA 02133
Dear Mr. Clerk,
Pursuant to Section 2 of Chapter 111 of the Massachusetts General Laws, the attached report
summarizes mortality data and statistics for the 2016 calendar year.
Sincerely,
Monica Bharel, MD, MPH
Commissioner
Department of Public Health
The Commonwealth of Massachusetts Executive Office of Health and Human Services
Department of Public Health 250 Washington Street, Boston, MA 02108-4619
CHARLES D. BAKER
Governor
KARYN E. POLITO Lieutenant Governor
MARYLOU SUDDERS
Secretary
MONICA BHAREL, MD, MPH Commissioner
Tel: 617-624-6000
www.mass.gov/dph

1
Massachusetts Deaths 2016
December 2018
Massachusetts Deaths 2016
Office of Population Health
Massachusetts Department of Public Health
November 2018
0%
10%
20%
30%
40%
50%
60%
18
42
18
47
18
52
18
57
18
62
18
67
18
72
18
77
18
82
18
87
18
92
18
97
19
02
19
07
19
12
1917
19
22
19
27
19
32
19
37
19
42
19
47
19
52
19
57
19
62
19
67
19
72
19
77
19
82
19
87
19
92
19
97
20
02
20
07
2012
Pe
rce
nt
of
To
tal D
eath
s
Cancer
Infectious Disease
Heart Disease
Injuries
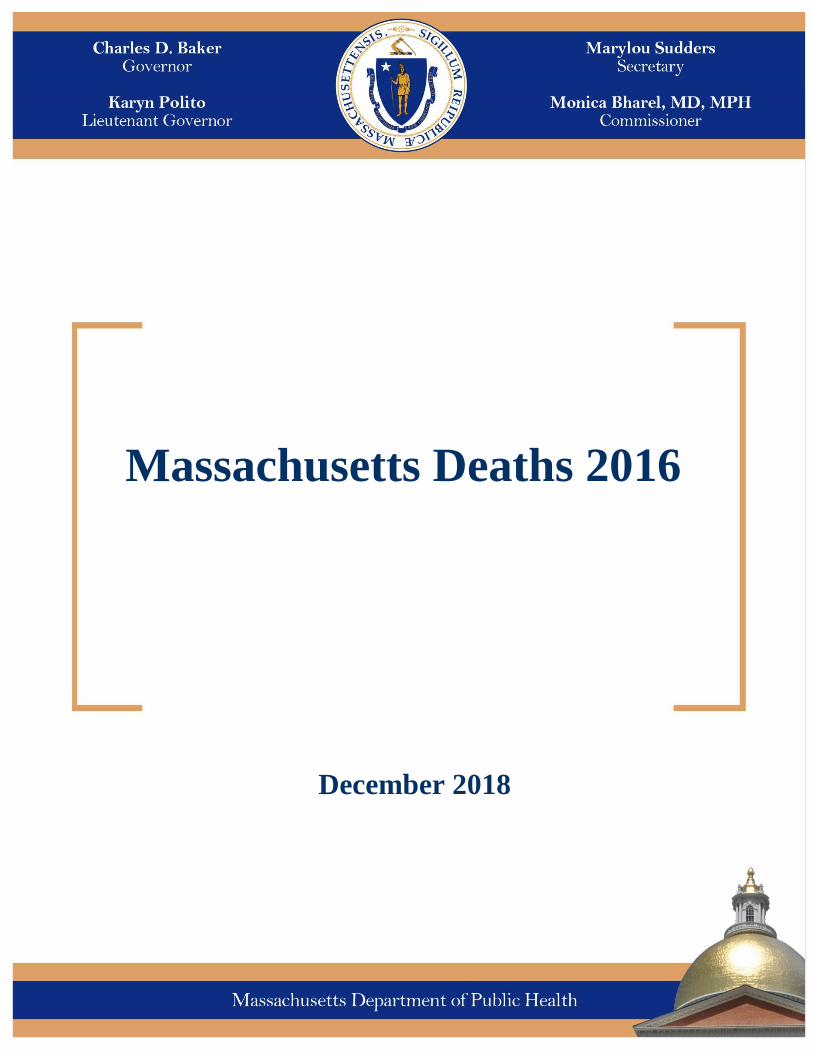
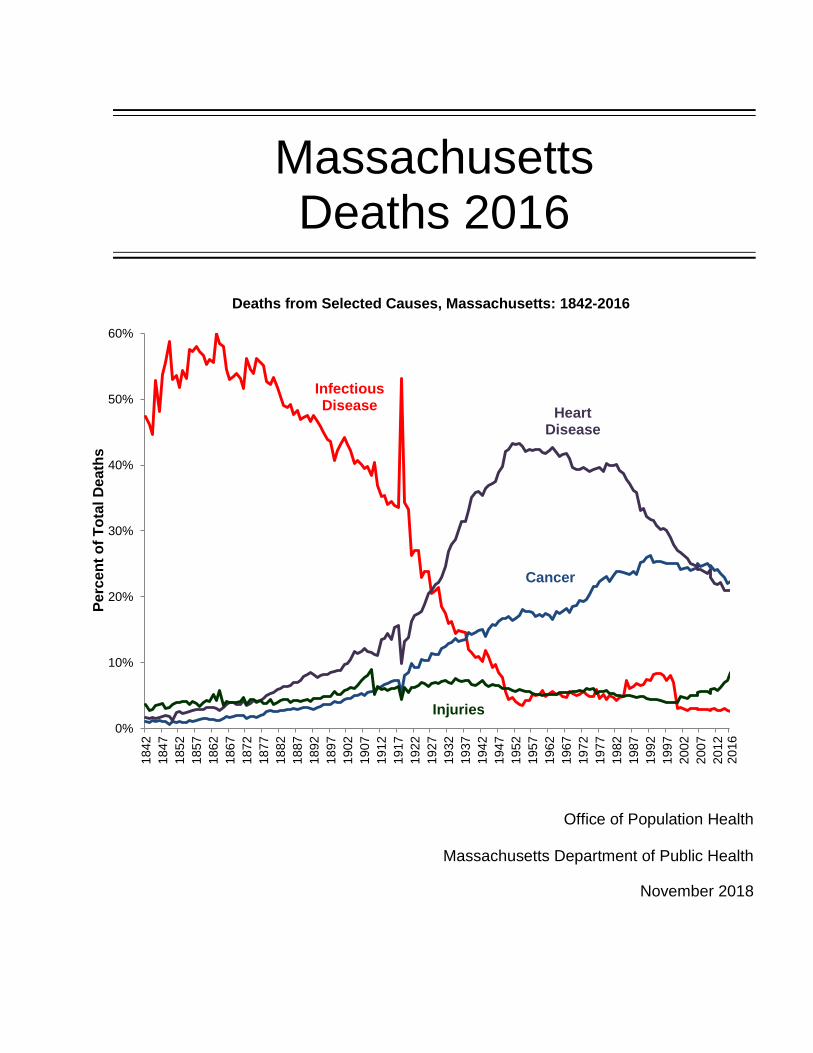
Deaths from Selected Causes, Massachusetts: 1842-2016
2016
2016
2016
20
16

Massachusetts Deaths 2016
Charles D. Baker, Governor Marylou Sudders, Secretary of Health and Human Services Monica Bharel, MD, MPH, Commissioner of Public Health
Abigail R. Averbach Assistant Commissioner and Director
Office of Population Health
Karin Barrett Registrar
Registry of Vital Records and Statistics
Massachusetts Department of Public Health
November 2018
Acknowledgments
This report was prepared by Vanessa Neergheen, Registry of Vital Records and Statistics. Special thanks go to: Karin Barrett, Registrar, Registry of Vital Records and Statistics; Dean DiMartino, Deputy Registrar, Registry of Vital Records and Statistics; Sharon Pagnano, Maria Vu, and Marsha Grabau, Registry of Vital Records and Statistics; Dana Bernson and Malena Hood, Office of Special Analytic Projects; Natalie Nguyen Durham and Kevin Foster, Office of Data Management and Outcomes Assessment. Data in this report have been collected through the efforts of the Registry of Vital Records and Statistics staff, including: Michael Baker, Pamela Corbin, June Deloney, Alex Forman, Marsha Grabau, Annette Luc, Denise O'Gara, Margaret Riley, Jennifer Smith, and Monica Smith.
To obtain additional copies of this report, contact:
Massachusetts Department of Public Health Registry of Vital Records and Statistics
150 Mt. Vernon Street 1st Floor Dorchester, MA 02125
(617) 740-2670
To obtain more information on deaths in Massachusetts and other Department of Public Health data please visit the Department’s free, Internet-based public health
information reports at: http://www.mass.gov/eohhs/researcher/community-health/masschip/
or call 888-MAS-CHIP (toll free in MA) or 617-624-5629.
5
TABLE OF CONTENTS
2016 Massachusetts Deaths Highlights ................................................................................10
Note to Readers ...................................................................................................................11
Table 1. Trends in Mortality Characteristics, Massachusetts: 2006-2016.............................13
Table 2. Selected Leading Causes of Death, Age-Adjusted Rates, Massachusetts and United States: 2001-2016 ................................................................................................................14
Figure 1. Life Expectancy at Birth, Massachusetts: 1900-2016 ............................................16
Figure 2. Expected Years of Life Remaining at Different Ages by Race and Hispanic Ethnicity, Massachusetts: 2016 ............................................................................................17
Table 3. Years of Life Remaining by Race and Hispanic Ethnicity and Gender, Massachusetts: 2016............................................................................................................17
Figure 3. Changes in Age Composition of the Population, Massachusetts: 1900-2010 ........18
Figure 4. Trends in Percentage of Deaths from Selected Causes, Massachusetts: 1842-2016 ..................................................................................................19
Table 4. Distribution of Deaths by Place of Occurrence, Massachusetts: 2012-2016...........20
Figure 5. Proportion of Deaths Certified by Medical Examiner for Selected Causes of Death, Massachusetts: 2016............................................................................................................21
Figure 6. Premature Mortality Rate (PMR) by Race and Hispanic Ethnicity, Massachusetts: 2016............................................................................................................22
Table 5. Age-Specific and Age-Adjusted Death Rates for Ages 25-64 Years by Educational Attainment, Massachusetts: 2016 .........................................................................................23
Figure 7. Daily Mortality Statistics, Massachusetts: 2016 ....................................................24
Table 6. Top Ten Leading Underlying Causes of Death by Age, Massachusetts: 2016 .......25
Table 7. Leading Underlying Causes of Death, Numbers and Age-Specific Rates by Gender, Massachusetts: 2016............................................................................................................26
Table 8. Leading Underlying Causes of Death, Numbers and Age-Specific Rates (Ages 65 and Older) by Gender, Massachusetts: 2016 .......................................................................27
Table 9. Leading Causes of Death and Age-Adjusted Rates by Race and Hispanic Ethnicity, Massachusetts: 2016...........................................................................................................28
6
Figure 8. Number of Heart Disease Deaths by Age Group and Gender, Massachusetts: 2016............................................................................................................29
Figure 9. Age Distribution by Race and Hispanic Ethnicity for Heart Disease Deaths, Massachusetts: 2016............................................................................................................30
Figure 10. Number of Cancer Deaths by Age Group and Gender, Massachusetts: 2016 ....31
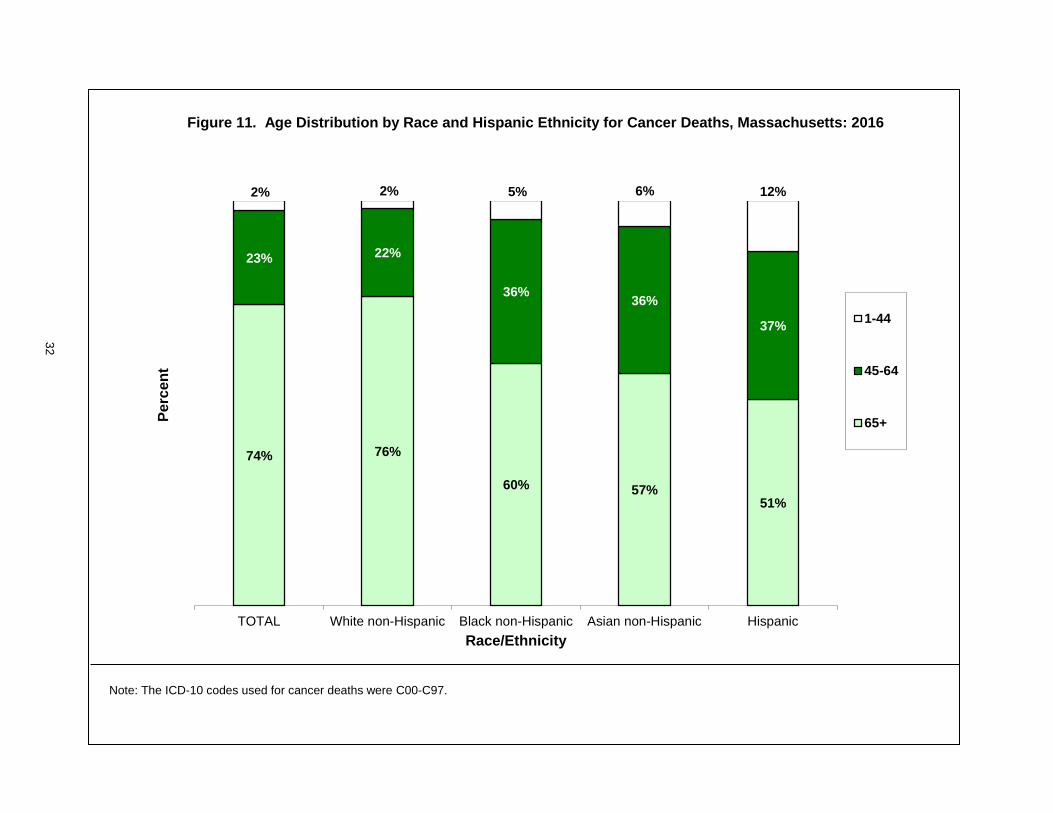
Figure 11. Age Distribution by Race and Hispanic Ethnicity for Cancer Deaths, Massachusetts: 2016............................................................................................................32
Table 10. Heart Disease and Cancer Deaths by Race and Hispanic Ethnicity and Gender, Age-Adjusted Rates, Massachusetts: 2003-2016 .................................................................33
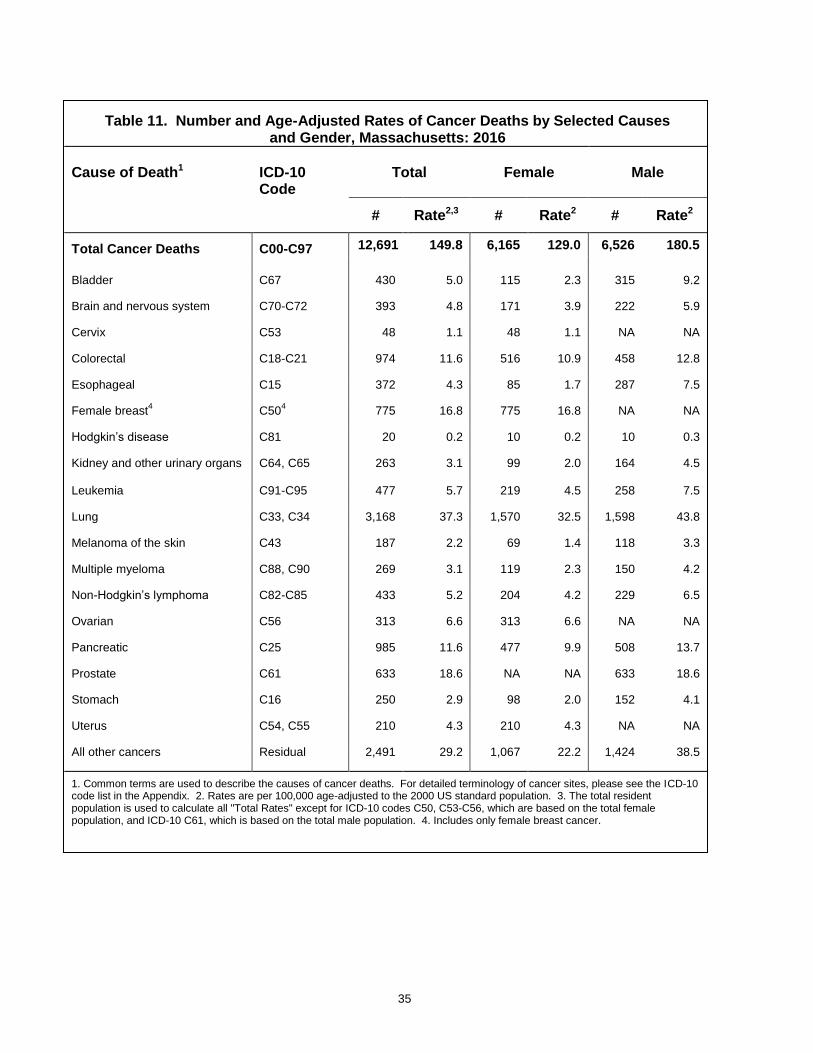
Table 11. Number and Age-Adjusted Rates of Cancer Deaths by Selected Causes and Gender, Massachusetts: 2016 ..............................................................................................35
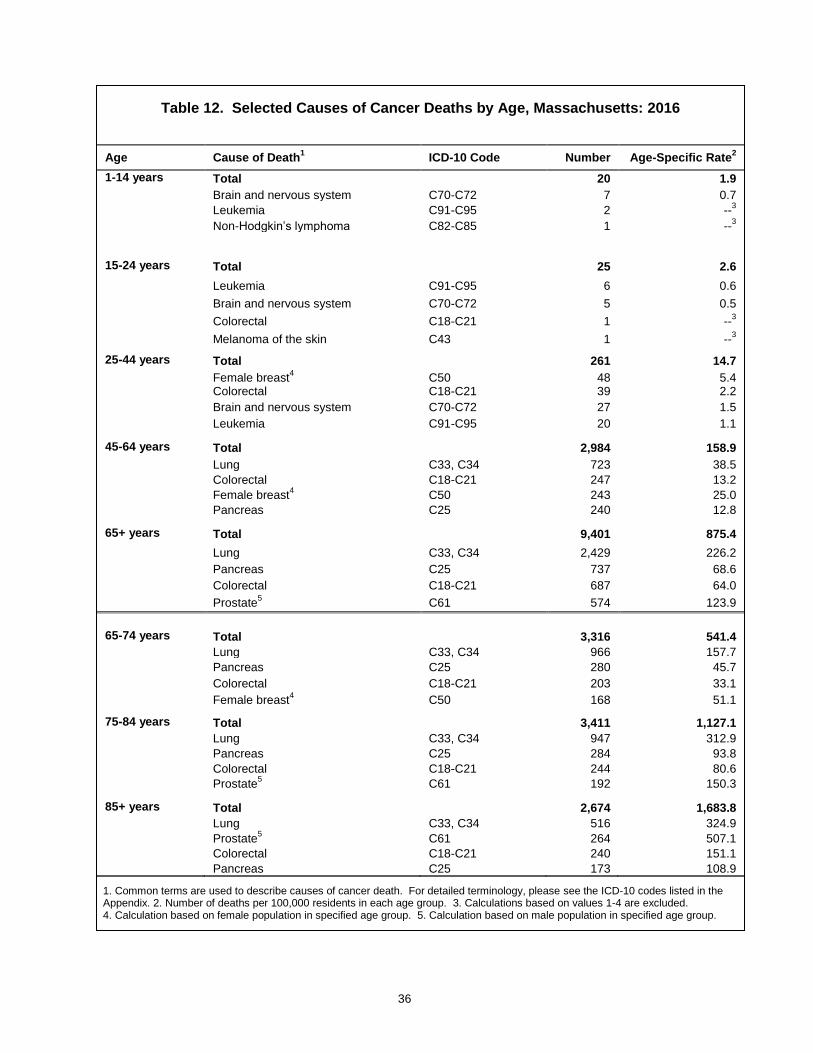
Table 12. Selected Causes of Cancer Deaths by Age, Massachusetts: 2016 ......................36
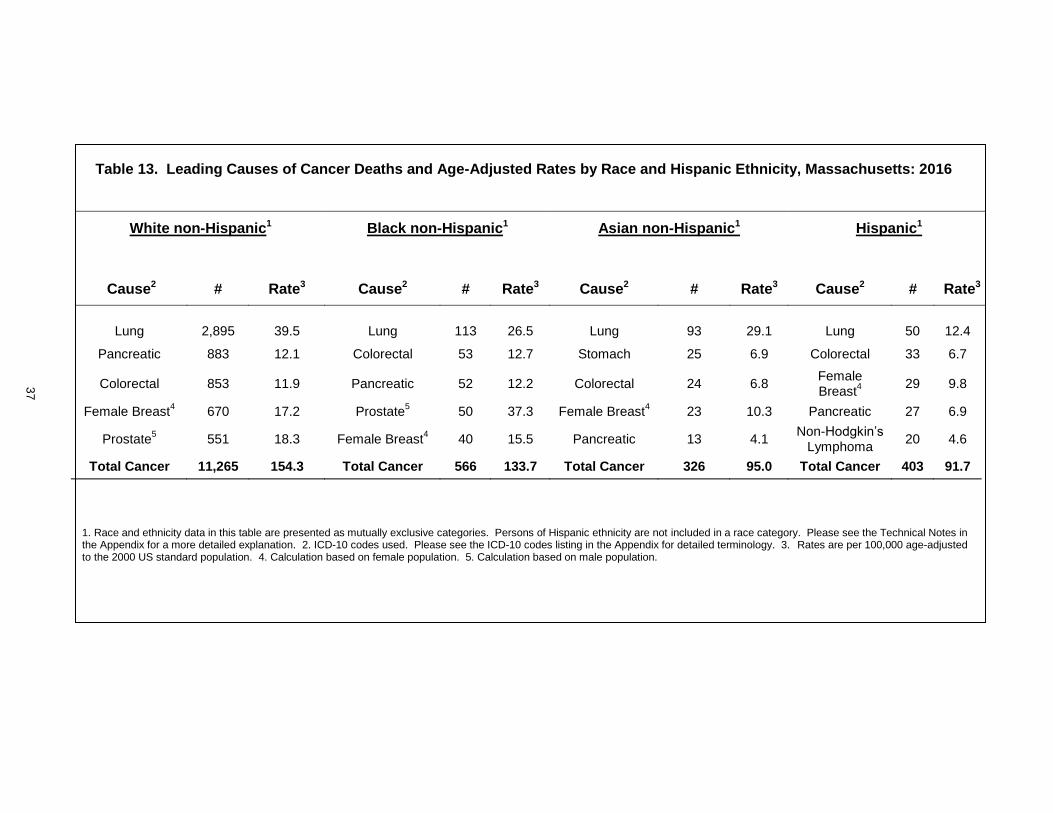
Table 13. Leading Causes of Cancer Deaths and Age-Adjusted Rates by Race and Hispanic Ethnicity, Massachusetts: 2016 ............................................................................................37
Table 14. Number, Percent, and Age-Adjusted Rates of Stroke Deaths by Type and Gender, Massachusetts: 2016............................................................................................................38
Figure 12. Number of Stroke Deaths by Age Group and Gender, Massachusetts: 2016 ......39
Figure 13. Age Distribution by Race and Hispanic Ethnicity for Stroke Deaths, Massachusetts: 2016............................................................................................................40
Table 15. Stroke Deaths by Race and Hispanic Ethnicity and Gender, Age-Adjusted Rates, Massachusetts: 2003-2016 ..................................................................................................41
Figure 14. Diabetes Deaths, Massachusetts: 2002-2016 .....................................................42
Table 16. Diabetes Deaths by Gender, Massachusetts: 2016 .............................................42
Table 17. Diabetes Deaths by Race and Hispanic Ethnicity, Massachusetts: 2016 .............43
Figure 15. Age Distribution of Diabetes Deaths, Massachusetts: 2016 .................................43
Figure 16. Diabetes Death Rates, Massachusetts: 2001-2016 ..............................................44
Table 18. Injury Deaths by Leading Causes, Gender, Age: Numbers, Age-Adjusted, and Age-Specific Rates, Massachusetts: 2016 ...................................................................................45
Table 19. Injury Deaths by Leading Causes, Gender and Race and Hispanic Ethnicity: Numbers and Age Adjusted Rates, Massachusetts: 2016 ....................................................46
7
Table 20. Unintentional Injury Deaths by Gender, Age: Numbers, Age-Adjusted, and Age-Specific Rates, Massachusetts: 2016 ...................................................................................47
Table 21. Unintentional Injury Deaths by Gender and Race and Hispanic Ethnicity: Numbers and Age-Adjusted Rates, Massachusetts: 2016 ...................................................................48
Table 22. Intentional Injury Deaths by Gender, Age: Numbers, Age-Adjusted, and Age-Specific Rates, Massachusetts: 2016 ...................................................................................49
Table 23. Intentional Injury Deaths by Gender and Race and Hispanic Ethnicity: Numbers and Age-Adjusted Rates, Massachusetts: 2016 ...................................................................50
Table 24. Injury Deaths by Intent, Method and Gender: Numbers and Age-Adjusted Rates, Massachusetts: 2016............................................................................................................51
Table 25. HIV/AIDS Deaths by Place of Occurrence, Massachusetts: 2000-2016 ...............52
Table 26. HIV/AIDS Deaths by Age, Massachusetts: 2000-2016 .........................................53
Table 27. HIV/AIDS Deaths by Gender, Race and Hispanic Ethnicity, Massachusetts: 2000-2016 ..................................................................................................54
Table 28. HIV/AIDS Deaths by Gender, Race and Hispanic Ethnicity: Numbers, Percent and Age-Adjusted Rates, Massachusetts: 2003-2016 .................................................................55
Table 29. HIV/AIDS Deaths by Race, Hispanic Ethnicity, and Gender of Persons Ages 25-44, Massachusetts: 2003-2016 ..................................................................................................56
Table 30. Trends in Infant, Neonatal, and Post Neonatal Mortality, by Race and Hispanic Ethnicity, Massachusetts: 2006-2016 ...................................................................................57
Table 31. Infant, Neonatal, and Post Neonatal Deaths by Cause, Massachusetts: 2016 .....58
Table 32. Infant Deaths by Major Causes, Race and Hispanic Ethnicity, Massachusetts: 2016............................................................................................................59
Table 33. Target Status for Selected Healthy People 2020 Mortality Objectives ..................60
Table 34. Rank of Premature Mortality Rates for the Largest 30 Communities, Massachusetts: 2016............................................................................................................61
Table 35. Premature Mortality Rates by Community, Massachusetts: 2016 ........................62
Figure 17. Percent of Deaths Amenable to Health Care, Massachusetts: 2016 ...................69
Figure 18. Amenable Mortality by Race and Hispanic Ethnicity, Massachusetts: 2002-2016 ..................................................................................................70
Appendix ..............................................................................................................................71

8
Figure 19. Percent Distribution of Leading Underlying Causes of Death, Massachusetts: 2016............................................................................................................72
Table 36. Number and Age-Specific Rates for Leading Underlying Causes of Death by Race and Hispanic Ethnicity, Massachusetts: 2016 .......................................................................73
Figure 20. Heart Disease Death Rates by Race and Hispanic Ethnicity and Gender, Massachusetts: 1996-2016 ..................................................................................................75
Figure 21. Cancer Death Rates by Race and Hispanic Ethnicity and Gender, Massachusetts: 1996-2016 ............................................................................................................................76
Table 37. Premature Mortality Rates by Community Health Network Area (CHNA), Massachusetts: 2016............................................................................................................77
Table 38. Premature Mortality Rates by County, Massachusetts: 2016 ...............................78
Table 39. Selected Causes of Death by Community, Massachusetts: 2016 ........................79
Table 40. Selected Causes of Death by Community Health Network Area (CHNA), Massachusetts: 2016............................................................................................................90
Table 41. Selected Causes of Death by County, Massachusetts: 2016 ................................91
Technical Notes ....................................................................................................................92
Data Sources .......................................................................................................................92
Changes to Mortality Data, Effective 1999 ............................................................................92
Changes to the Presentation of Race and Ethnicity Data .....................................................92
Population Estimates ............................................................................................................93
Applying Comparability Ratios to Examine Trends in Mortality .............................................94
Tests of Statistical Significance ............................................................................................95
Confidence Intervals .............................................................................................................96
Glossary... ............................................................................................................................97
Table A1. ICD-10 and ICD-9 Codes Used in this Publication ............................................. 102
Table A2. ICD-10 Injury Codes Used in this Publication .................................................... 103
Table A3. ICD-10 Codes for Selected Healthy People 2020 Mortality Objectives .............. 104
Table A4. Preliminary Comparability Ratios ....................................................................... 105
9
Table A5. Preliminary Comparability Ratios: Causes of Infant Death ................................. 106
Table A6. Causes of Death Considered Amenable to Health Care ..................................... 107
Table A7. Population Estimates for Massachusetts Community Health Network Areas (CHNA) and Counties: 2010 and 2016 ............................................................................... 108
Table A8. Population Estimates for Massachusetts Communities, 2010 ............................ 109
Table A9. 2016 Massachusetts Population Estimates By Age Group, Gender, Race and Hispanic Ethnicity ........................................................................................................ 112
Massachusetts Death Certificate: 2016 .............................................................................. 113
Circumstance for Referral to the Office of the Chief Medical Examiner (OCME) ................. 115
Massachusetts Deaths: 2016 Evaluation Form ................................................................... 117

10
2016 Massachusetts Deaths Highlights
From 2015 to 2016, the age-adjusted mortality rate for Massachusetts residents significantly decreased
from 684.6 deaths per 100,000 to 668.9 deaths per 100,000. The age-adjusted mortality rates for White
non-Hispanic, Asian non-Hispanic, Hispanic, female, and male residents also significantly decreased,
while the rate for Black non-Hispanic residents significantly increased (Table 1).
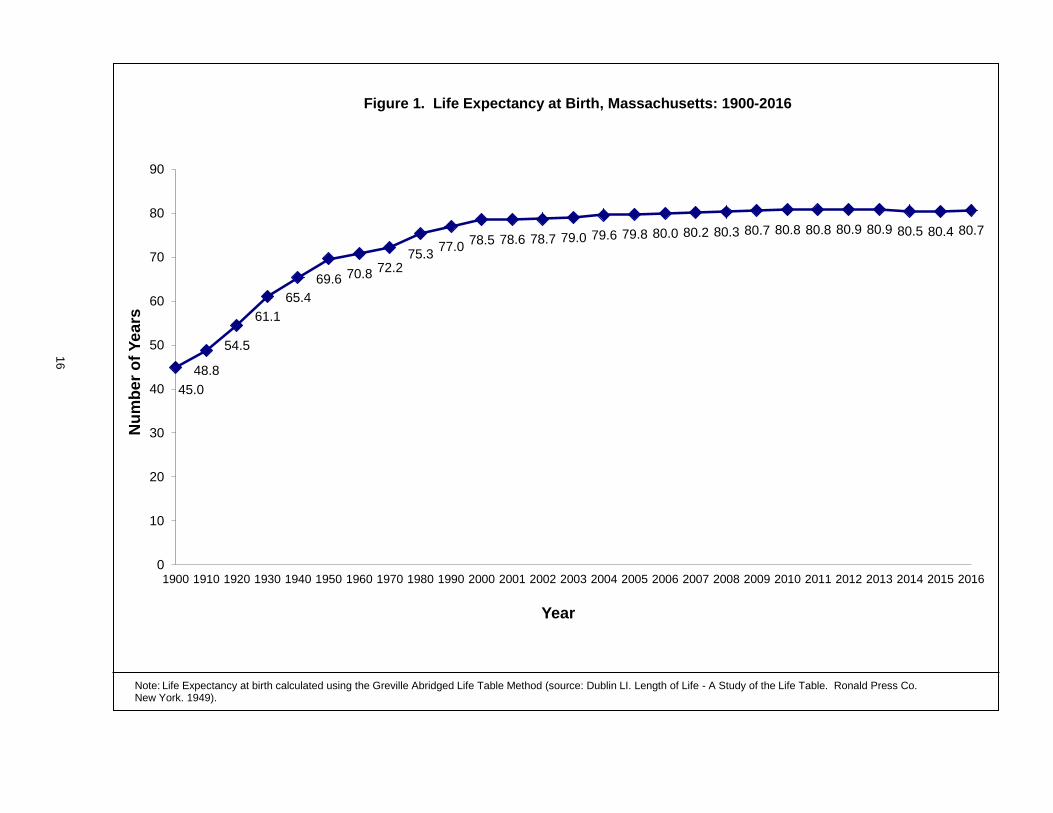
The average life expectancy of Massachusetts residents was 80.7 years in 2016 (Figure 1). Since
2006, the Massachusetts life expectancy has remained close to 80 years, reaching 80.9 years at its
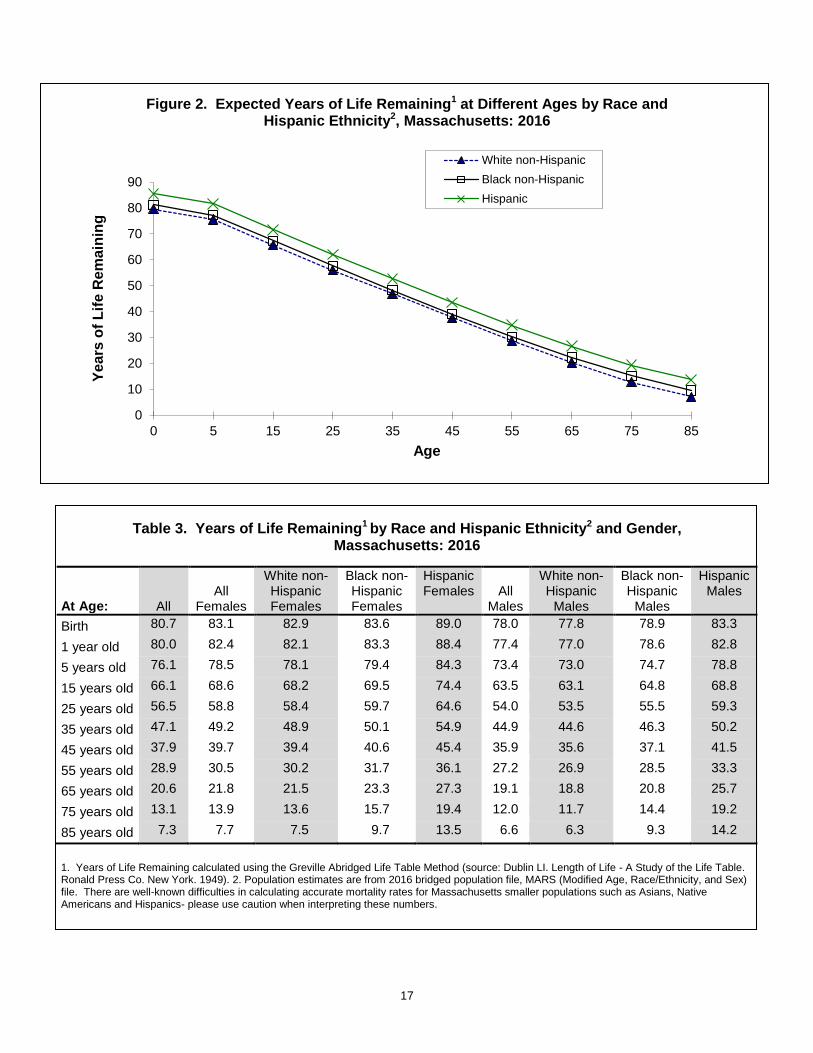
highest in 2012/2013. Hispanic women had the highest life expectancy, living 89.0 years from birth, on
average, while the life expectancies for White non-Hispanic women and Black non-Hispanic women
were 82.9 and 83.6 years, respectively (Table 3).
In 2016, the premature mortality rate (which only includes deaths that occur before age 75) remained
higher for Black non-Hispanic residents (309.2 deaths per 100,000) than for White non-Hispanic
(288.6), Hispanic (251.9), and Asian non-Hispanic (122.1) residents (Figure 6). However, the life
expectancy of Black non-Hispanic residents who lived to age 75 was higher than that of White non-
Hispanic residents (Table 3), which suggests that Black non-Hispanic residents live longer upon
reaching old age.
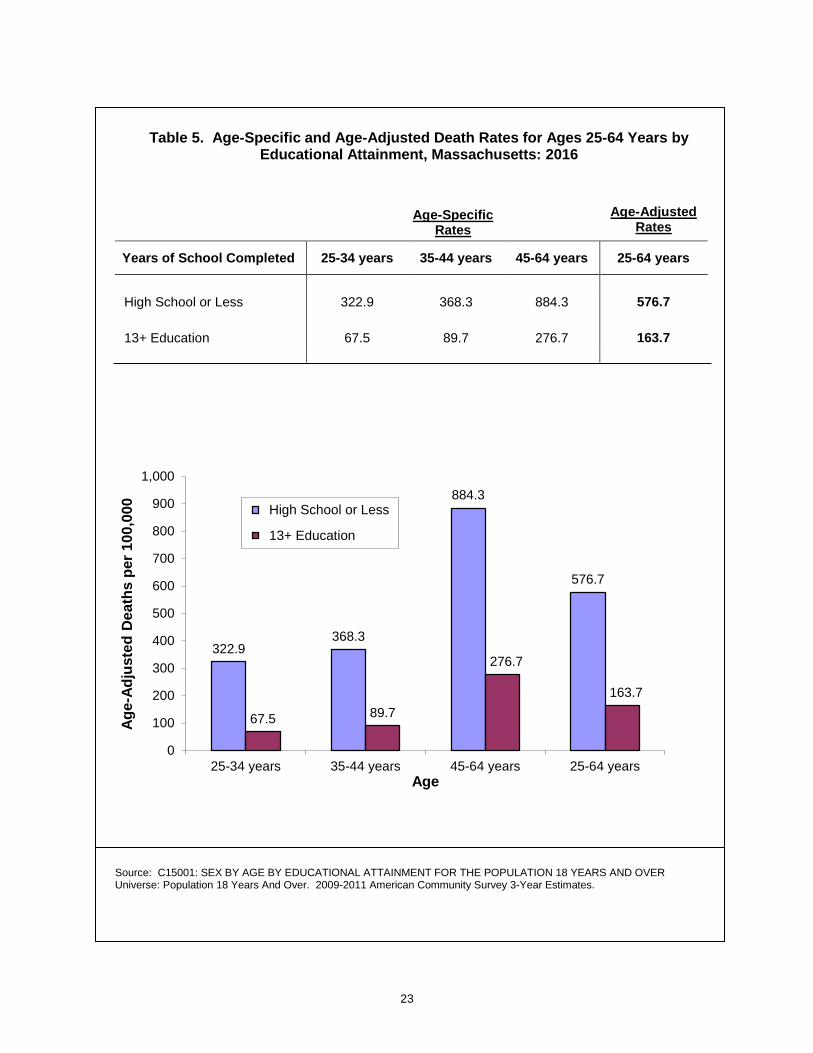
Among Massachusetts residents ages 25-64, the death rate for those who completed high school or
less was more than three times higher than the corresponding rate among those who completed
education above high school (Table 5).
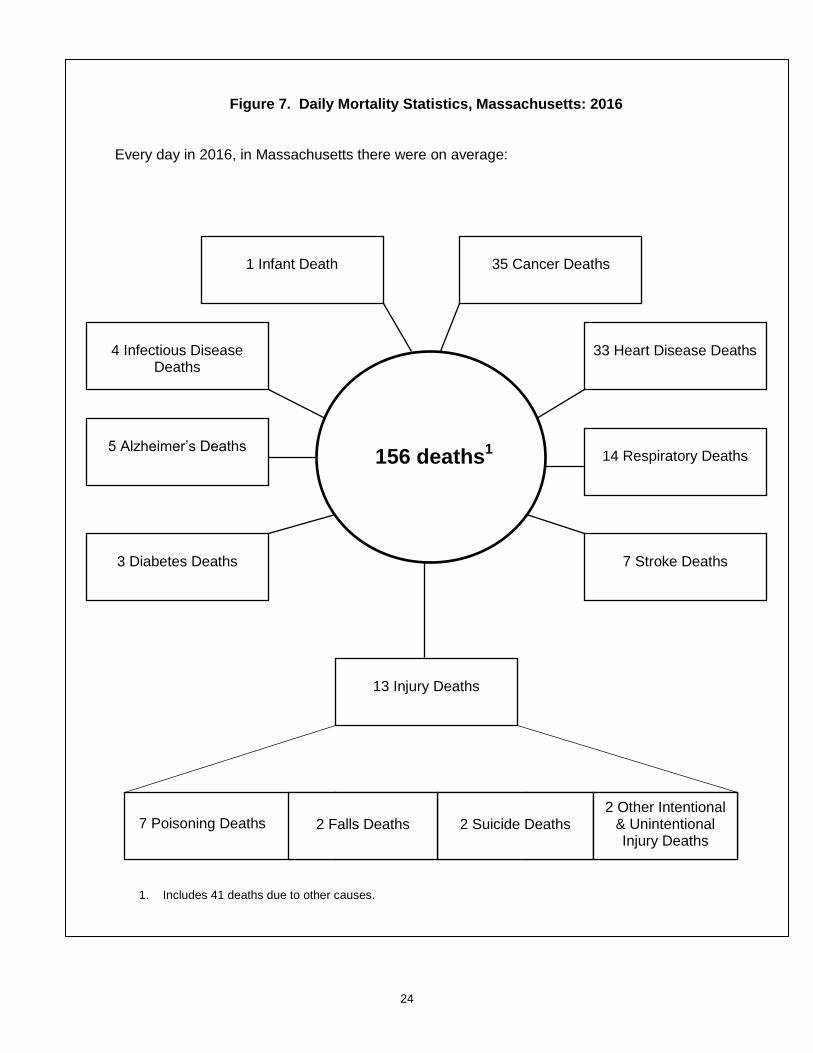
Every day in 2016, there were on average 156 deaths, which included 35 cancer deaths, 33 heart
disease deaths, 14 respiratory condition deaths, and 13 injury deaths (Figure 7). Of the 13 injury
deaths, 7 deaths were due to poisonings, which include opioid overdoses.
Cancer was the leading cause of death for Massachusetts residents in 2016 (Table 6). The rate of
cancer deaths was highest for White non-Hispanic residents (687.9 per 100,000) and lowest for Asian
non-Hispanic residents (324.7 per 100,000) (Table 9). Lung cancer remained the leading cancerous
cause of death (Table 11).
In 2016, Black non-Hispanic and Hispanic residents died from cancer at younger ages when compared
to White non-Hispanic and Asian non-Hispanic residents (Figure 9). Black non-Hispanic, Hispanic, and
Asian non-Hispanic residents died from heart disease at younger ages when compared to White non-
Hispanic residents (Figure 11).
In 2016, the rate of heart disease deaths remained higher for White non-Hispanic men and women than
for any other racial/ethnic group (Table 10).
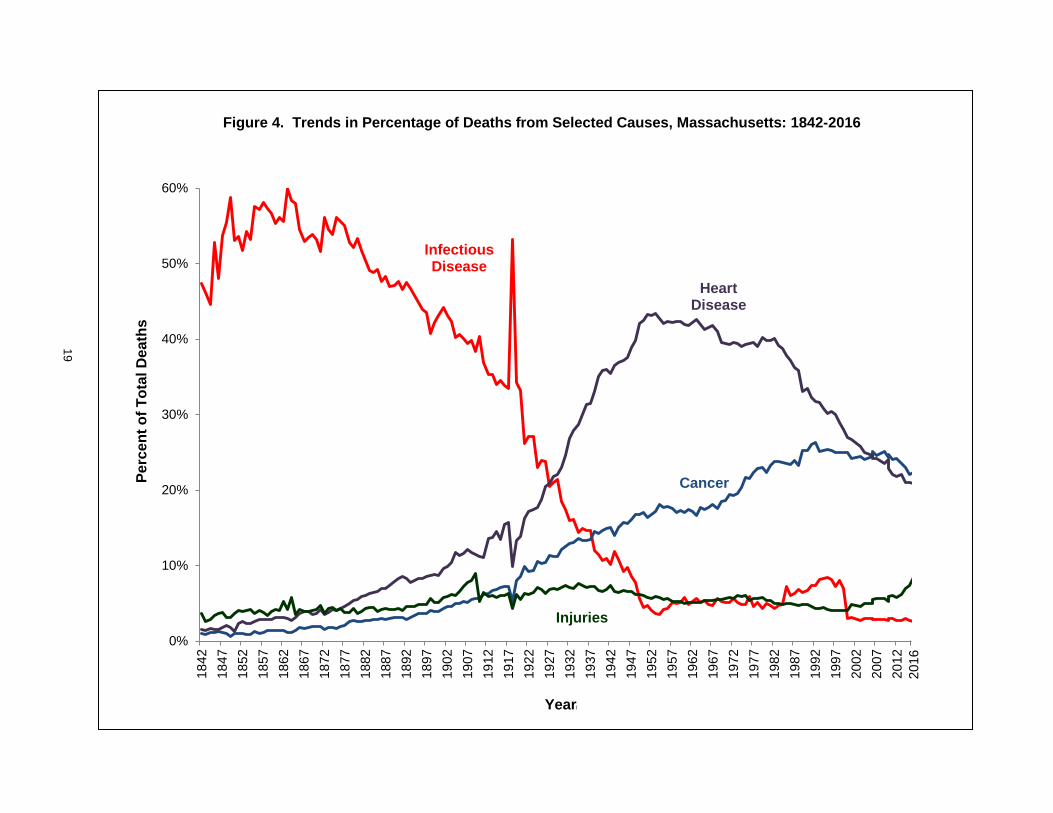
The percentage of deaths due to injuries continued to climb in 2016 (Figure 4). Deaths due to injury
have steadily increased since 2012. Injury deaths include opioid overdoses.
Poisonings, which include opioid overdoses, continued to be the largest cause of injury deaths in 2016,
with the injury death rate increasing from 28.4 per 100,000 in 2015 to 35.4 per 100,000 in 2016 (Table
18). For all leading causes of injury death, rates were higher for men than for women, with the greatest
disparity in poisoning deaths (52.6 per 100,000 for men and 18.7 per 100,000 for women).
The rate of suicide deaths for White non-Hispanic residents (10.0 per 100,000) was almost double the
corresponding rates for other groups (5.5 per 100,000 for Black non-Hispanics, 5.4 per 100,000 for
Asian non-Hispanics, and 5.0 per 100,000 for Hispanics) (Table 23).
In 2016, the rate of infant mortality for Black non-Hispanic residents (7.9 per 1,000 live births) was
almost three times higher than the corresponding rate for White non-Hispanic residents (2.7 per 1,000
live births) (Table 29).
The leading cause of infant deaths in 2016 was disorders relating to short gestation and low
birthweight, representing 24.7% of all infant deaths (Table 30).
11
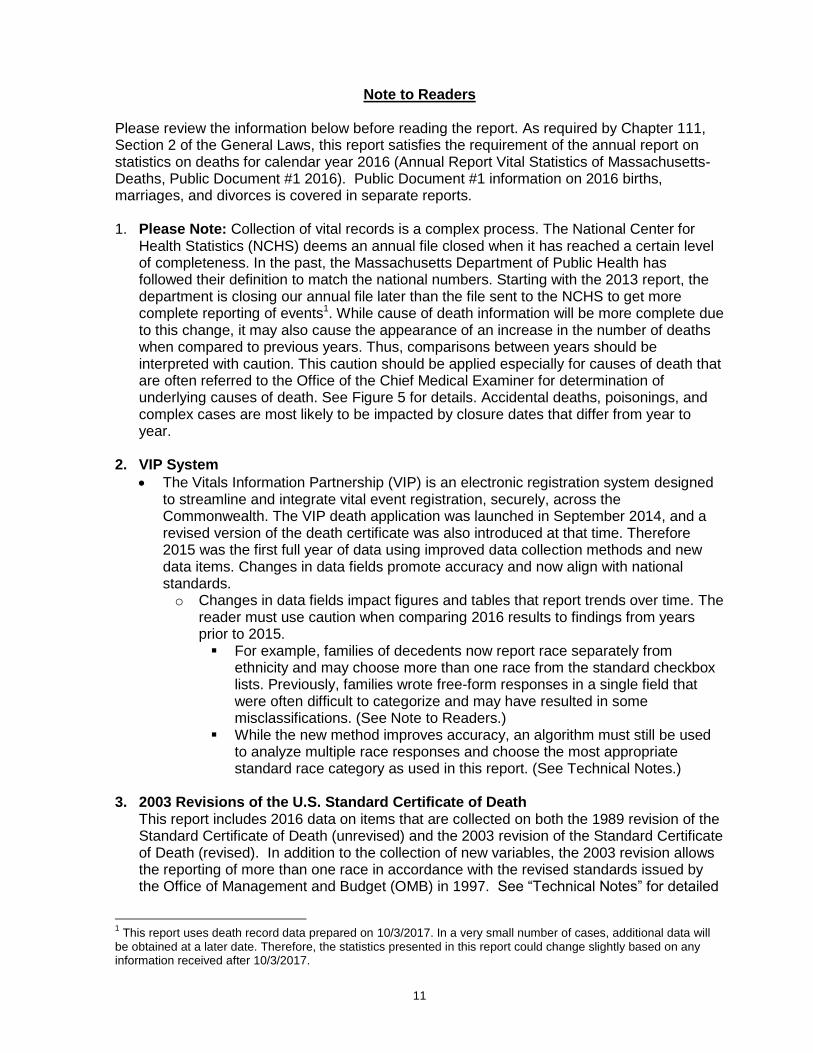
Note to Readers Please review the information below before reading the report. As required by Chapter 111, Section 2 of the General Laws, this report satisfies the requirement of the annual report on statistics on deaths for calendar year 2016 (Annual Report Vital Statistics of Massachusetts-Deaths, Public Document #1 2016). Public Document #1 information on 2016 births, marriages, and divorces is covered in separate reports. 1. Please Note: Collection of vital records is a complex process. The National Center for
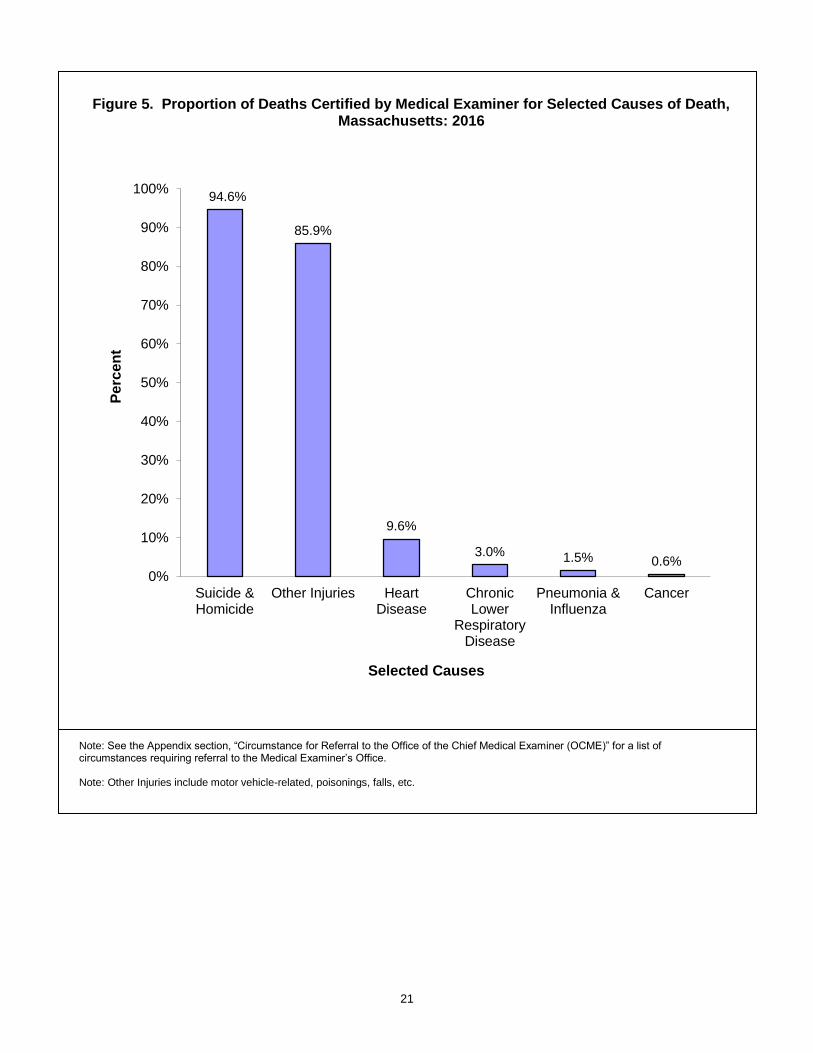
Health Statistics (NCHS) deems an annual file closed when it has reached a certain level of completeness. In the past, the Massachusetts Department of Public Health has followed their definition to match the national numbers. Starting with the 2013 report, the department is closing our annual file later than the file sent to the NCHS to get more complete reporting of events1. While cause of death information will be more complete due to this change, it may also cause the appearance of an increase in the number of deaths when compared to previous years. Thus, comparisons between years should be interpreted with caution. This caution should be applied especially for causes of death that are often referred to the Office of the Chief Medical Examiner for determination of underlying causes of death. See Figure 5 for details. Accidental deaths, poisonings, and complex cases are most likely to be impacted by closure dates that differ from year to year.
2. VIP System
The Vitals Information Partnership (VIP) is an electronic registration system designed to streamline and integrate vital event registration, securely, across the Commonwealth. The VIP death application was launched in September 2014, and a revised version of the death certificate was also introduced at that time. Therefore 2015 was the first full year of data using improved data collection methods and new data items. Changes in data fields promote accuracy and now align with national standards. o Changes in data fields impact figures and tables that report trends over time. The
reader must use caution when comparing 2016 results to findings from years prior to 2015. For example, families of decedents now report race separately from
ethnicity and may choose more than one race from the standard checkbox lists. Previously, families wrote free-form responses in a single field that were often difficult to categorize and may have resulted in some misclassifications. (See Note to Readers.)
While the new method improves accuracy, an algorithm must still be used to analyze multiple race responses and choose the most appropriate standard race category as used in this report. (See Technical Notes.)
3. 2003 Revisions of the U.S. Standard Certificate of Death
This report includes 2016 data on items that are collected on both the 1989 revision of the Standard Certificate of Death (unrevised) and the 2003 revision of the Standard Certificate of Death (revised). In addition to the collection of new variables, the 2003 revision allows the reporting of more than one race in accordance with the revised standards issued by the Office of Management and Budget (OMB) in 1997. See “Technical Notes” for detailed
1 This report uses death record data prepared on 10/3/2017. In a very small number of cases, additional data will
be obtained at a later date. Therefore, the statistics presented in this report could change slightly based on any information received after 10/3/2017.
12
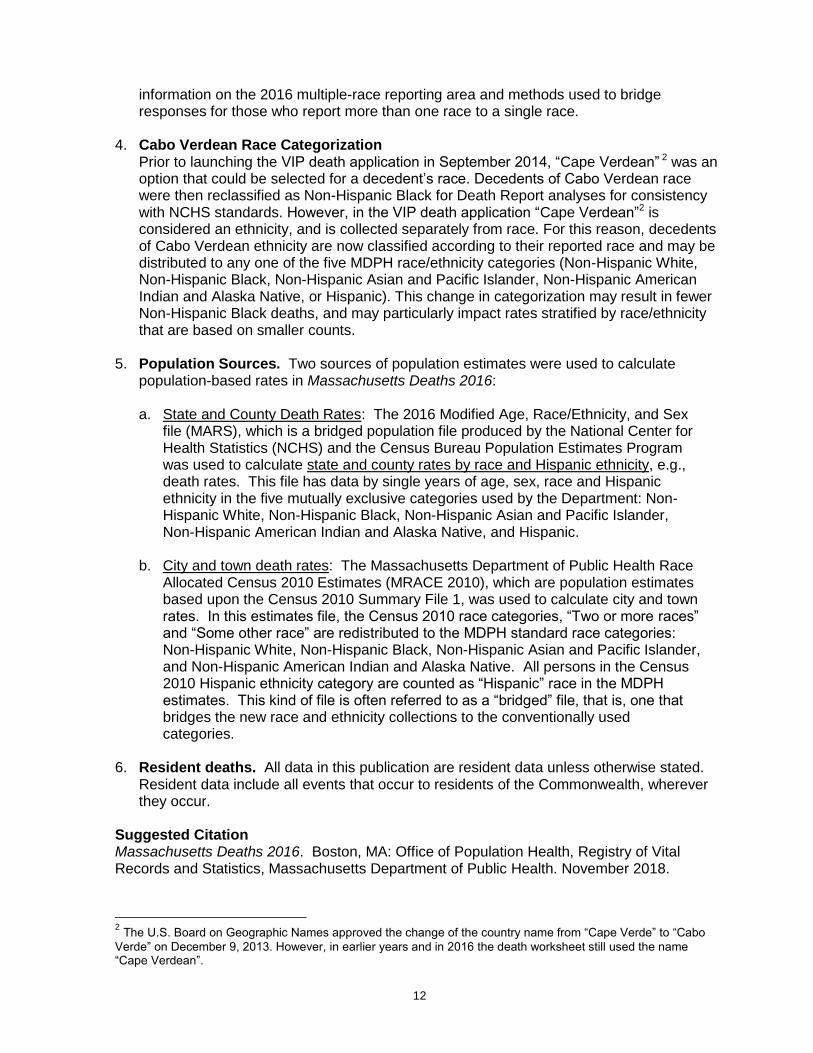
information on the 2016 multiple-race reporting area and methods used to bridge responses for those who report more than one race to a single race.
4. Cabo Verdean Race Categorization Prior to launching the VIP death application in September 2014, “Cape Verdean” 2 was an option that could be selected for a decedent’s race. Decedents of Cabo Verdean race were then reclassified as Non-Hispanic Black for Death Report analyses for consistency with NCHS standards. However, in the VIP death application “Cape Verdean”2 is considered an ethnicity, and is collected separately from race. For this reason, decedents of Cabo Verdean ethnicity are now classified according to their reported race and may be distributed to any one of the five MDPH race/ethnicity categories (Non-Hispanic White, Non-Hispanic Black, Non-Hispanic Asian and Pacific Islander, Non-Hispanic American Indian and Alaska Native, or Hispanic). This change in categorization may result in fewer Non-Hispanic Black deaths, and may particularly impact rates stratified by race/ethnicity that are based on smaller counts.
5. Population Sources. Two sources of population estimates were used to calculate population-based rates in Massachusetts Deaths 2016: a. State and County Death Rates: The 2016 Modified Age, Race/Ethnicity, and Sex
file (MARS), which is a bridged population file produced by the National Center for Health Statistics (NCHS) and the Census Bureau Population Estimates Program was used to calculate state and county rates by race and Hispanic ethnicity, e.g., death rates. This file has data by single years of age, sex, race and Hispanic ethnicity in the five mutually exclusive categories used by the Department: Non-Hispanic White, Non-Hispanic Black, Non-Hispanic Asian and Pacific Islander, Non-Hispanic American Indian and Alaska Native, and Hispanic.
b. City and town death rates: The Massachusetts Department of Public Health Race
Allocated Census 2010 Estimates (MRACE 2010), which are population estimates based upon the Census 2010 Summary File 1, was used to calculate city and town rates. In this estimates file, the Census 2010 race categories, “Two or more races” and “Some other race” are redistributed to the MDPH standard race categories: Non-Hispanic White, Non-Hispanic Black, Non-Hispanic Asian and Pacific Islander, and Non-Hispanic American Indian and Alaska Native. All persons in the Census 2010 Hispanic ethnicity category are counted as “Hispanic” race in the MDPH estimates. This kind of file is often referred to as a “bridged” file, that is, one that bridges the new race and ethnicity collections to the conventionally used categories.
6. Resident deaths. All data in this publication are resident data unless otherwise stated.
Resident data include all events that occur to residents of the Commonwealth, wherever they occur.
Suggested Citation Massachusetts Deaths 2016. Boston, MA: Office of Population Health, Registry of Vital Records and Statistics, Massachusetts Department of Public Health. November 2018.
2 The U.S. Board on Geographic Names approved the change of the country name from “Cape Verde” to “Cabo
Verde” on December 9, 2013. However, in earlier years and in 2016 the death worksheet still used the name “Cape Verdean”.
13
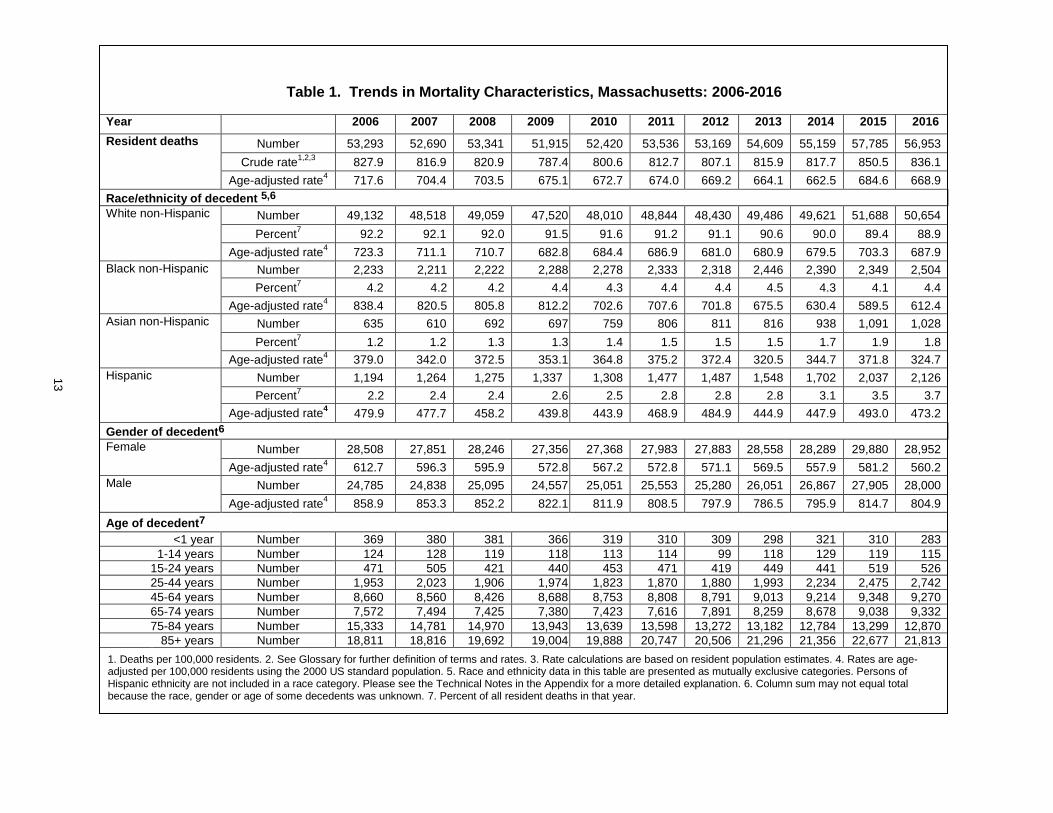
1. Deaths per 100,000 residents. 2. See Glossary for further definition of terms and rates. 3. Rate calculations are based on resident population estimates. 4. Rates are age-adjusted per 100,000 residents using the 2000 US standard population. 5. Race and ethnicity data in this table are presented as mutually exclusive categories. Persons of Hispanic ethnicity are not included in a race category. Please see the Technical Notes in the Appendix for a more detailed explanation. 6. Column sum may not equal total because the race, gender or age of some decedents was unknown. 7. Percent of all resident deaths in that year.
Table 1. Trends in Mortality Characteristics, Massachusetts: 2006-2016
Year 2006 2007 2008 2009 2010 2011 2012 2013 2014 2015 2016
Resident deaths
Number 53,293 52,690 53,341 51,915 52,420 53,536 53,169 54,609 55,159 57,785 56,953
Crude rate1,2,3
827.9 816.9 820.9 787.4 800.6 812.7 807.1 815.9 817.7 850.5 836.1
Age-adjusted rate4 717.6 704.4 703.5 675.1 672.7 674.0 669.2 664.1 662.5 684.6 668.9
Race/ethnicity of decedent 5,6
White non-Hispanic Number 49,132 48,518 49,059 47,520 48,010 48,844 48,430 49,486 49,621 51,688 50,654
Percent7
92.2 92.1 92.0 91.5 91.6 91.2 91.1 90.6 90.0 89.4 88.9
Age-adjusted rate4 723.3 711.1 710.7 682.8 684.4 686.9 681.0 680.9 679.5 703.3 687.9
Black non-Hispanic Number 2,233 2,211 2,222 2,288 2,278 2,333 2,318 2,446 2,390 2,349 2,504
Percent7
4.2 4.2 4.2 4.4 4.3 4.4 4.4 4.5 4.3 4.1 4.4
Age-adjusted rate4 838.4 820.5 805.8 812.2 702.6 707.6 701.8 675.5 630.4 589.5 612.4
Asian non-Hispanic Number 635 610 692 697 759 806 811 816 938 1,091 1,028
Percent7
1.2 1.2 1.3 1.3 1.4 1.5 1.5 1.5 1.7 1.9 1.8
Age-adjusted rate4 379.0 342.0 372.5 353.1 364.8 375.2 372.4 320.5 344.7 371.8 324.7
Hispanic Number 1,194 1,264 1,275 1,337 1,308 1,477 1,487 1,548 1,702 2,037 2,126
Percent7
2.2 2.4 2.4 2.6 2.5 2.8 2.8 2.8 3.1 3.5 3.7
Age-adjusted rate4 479.9 477.7 458.2 439.8 443.9 468.9 484.9 444.9 447.9 493.0 473.2
Gender of decedent6
Female Number 28,508 27,851 28,246 27,356 27,368 27,983 27,883 28,558 28,289 29,880 28,952
Age-adjusted rate4 612.7 596.3 595.9 572.8 567.2 572.8 571.1 569.5 557.9 581.2 560.2
Male Number 24,785 24,838 25,095 24,557 25,051 25,553 25,280 26,051 26,867 27,905 28,000
Age-adjusted rate4 858.9 853.3 852.2 822.1 811.9 808.5 797.9 786.5 795.9 814.7 804.9
Age of decedent7
<1 year Number 369 380 381 366 319 310 309 298 321 310 283
1-14 years Number 124 128 119 118 113 114 99 118 129 119 115
15-24 years Number 471 505 421 440 453 471 419 449 441 519 526
25-44 years Number 1,953 2,023 1,906 1,974 1,823 1,870 1,880 1,993 2,234 2,475 2,742
45-64 years Number 8,660 8,560 8,426 8,688 8,753 8,808 8,791 9,013 9,214 9,348 9,270
65-74 years Number 7,572 7,494 7,425 7,380 7,423 7,616 7,891 8,259 8,678 9,038 9,332
75-84 years Number 15,333 14,781 14,970 13,943 13,639 13,598 13,272 13,182 12,784 13,299 12,870
85+ years Number 18,811 18,816 19,692 19,004 19,888 20,747 20,506 21,296 21,356 22,677 21,813
8
vi
13

14
Table 2. Selected Leading Causes of Death, Age-Adjusted Rates, Massachusetts and United States: 2001-2016
Year Age-Adjusted Rates1
Heart Disease Cancer Stroke
MA US2 MA US2 MA US2
2001 Rate % of Total
211.0 26.7
247.7 28.9
200.0 24.2
195.8 22.9
46.7 6.2
57.9 6.8
2002 Rate % of Total
201.1 26.0
240.4 28.4
200.1 24.0
194.0 22.8
48.1 6.0
56.3 6.7
2003 Rate % of Total
196.6 26.0
232.3 28.0
193.0 24.1
190.1 22.7
45.0 6.0
53.5 6.5
2004 Rate % of Total
182.8 25.3
217.0 27.2
188.4 24.5
185.8 23.1
42.5 6.0
50.0 6.3
2005 Rate % of Total
172.2 24.6
211.0 26.6
184.9 24.5
183.8 22.8
38.1 5.5
46.6 5.9
2006 Rate % of Total
168.8 24.2
199.4 25.9
186.3 25.1
180.8 23.1
36.7 5.4
43.6 5.7
2007 Rate % of Total
165.7 24.2
190.9 25.9
179.2 24.6
178.4 23.1
35.0 5.1
42.2 5.7
2008 Rate % of Total
165.5 24.1
186.5 25.4
177.8 24.4
175.3 23.2
33.7 4.9
40.7 5.6
2009 Rate % of Total
155.2 23.6
179.8 24.6
174.0 25.1
173.6 23.3
32.2 4.9
38.9 5.3
2010 Rate % of Total
149.4 22.9
178.5 24.1
171.0 24.7
172.5 23.3
31.2 4.8
39.0 5.2
2011 Rate 144.4 173.7 166.1 173.7 30.2 37.9
% of Total 22.1 23.7 24.0 23.7 4.6 5.1
2012 Rate 141.3 170.5 166.7 166.5 28.7 36.9
% of Total 21.8 23.6 24.2 22.9 4.4 5.1
2013 Rate 142.2 169.8 159.5 163.2 27.7 36.2
% of Total 22.1 23.5 23.5 22.5 4.3 5.0
2014 Rate 137.5 167.0 155.6 161.2 28.7 36.5 % of Total 21.5 23.4 23.2 22.5 4.5 5.1
2015 Rate 138.7 167.0 152.8 161.2 28.4 36.5 % of Total 21.0 23.4 22.1 22.5 4.3 5.1
2016 Rate 134.8 197.2 149.8 185.4 27.9 43.7 % of Total 20.9 23.4 22.3 22.0 4.3 5.2
14
15
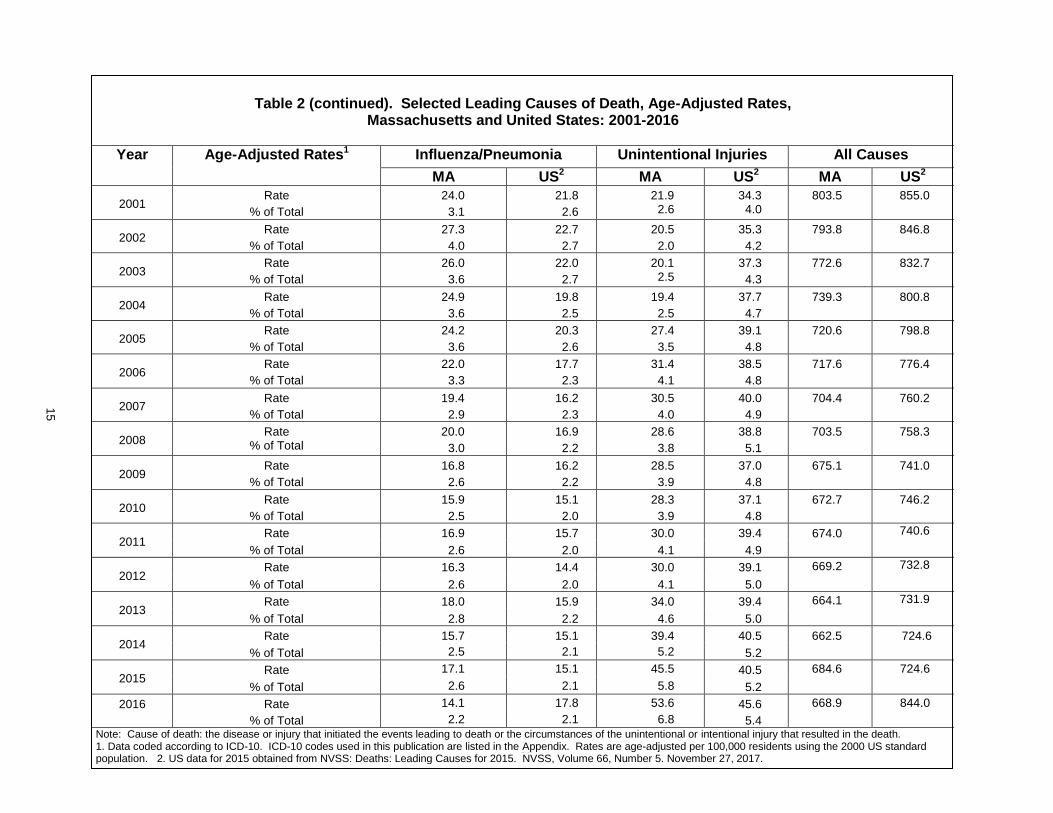
Note: Cause of death: the disease or injury that initiated the events leading to death or the circumstances of the unintentional or intentional injury that resulted in the death. 1. Data coded according to ICD-10. ICD-10 codes used in this publication are listed in the Appendix. Rates are age-adjusted per 100,000 residents using the 2000 US standard population. 2. US data for 2015 obtained from NVSS: Deaths: Leading Causes for 2015. NVSS, Volume 66, Number 5. November 27, 2017.
Table 2 (continued). Selected Leading Causes of Death, Age-Adjusted Rates, Massachusetts and United States: 2001-2016
Year Age-Adjusted Rates1 Influenza/Pneumonia Unintentional Injuries All Causes
MA US2 MA US2 MA US2
2001 Rate
% of Total
24.0
3.1
21.8
2.6
21.9 2.6
34.3 4.0
803.5 855.0
2002 Rate
% of Total
27.3
4.0
22.7
2.7
20.5
2.0
35.3
4.2
793.8
846.8
2003 Rate
% of Total
26.0
3.6
22.0
2.7
20.1 2.5
37.3
4.3
772.6
832.7
2004 Rate
% of Total
24.9
3.6
19.8
2.5
19.4
2.5
37.7
4.7
739.3 800.8
2005 Rate
% of Total
24.2
3.6
20.3
2.6
27.4
3.5
39.1
4.8
720.6 798.8
2006 Rate
% of Total
22.0
3.3
17.7
2.3
31.4
4.1
38.5
4.8
717.6 776.4
2007 Rate
% of Total
19.4
2.9
16.2
2.3
30.5
4.0
40.0
4.9
704.4 760.2
2008 Rate
% of Total 20.0
3.0
16.9
2.2
28.6
3.8
38.8
5.1
703.5 758.3
2009 Rate
% of Total
16.8
2.6
16.2
2.2
28.5
3.9
37.0
4.8
675.1 741.0
2010 Rate
% of Total
15.9
2.5
15.1
2.0
28.3
3.9
37.1
4.8
672.7 746.2
2011 Rate 16.9 15.7 30.0 39.4 674.0 740.6
% of Total 2.6 2.0 4.1 4.9
2012 Rate 16.3 14.4 30.0 39.1 669.2 732.8
% of Total 2.6 2.0 4.1 5.0
2013 Rate 18.0 15.9 34.0 39.4 664.1 731.9
% of Total 2.8 2.2 4.6 5.0
2014 Rate 15.7 15.1 39.4 40.5 662.5 724.6
% of Total 2.5 2.1 5.2 5.2
2015 Rate 17.1 15.1 45.5 40.5 684.6 724.6
% of Total 2.6 2.1 5.8 5.2
2016 Rate 14.1 17.8 53.6 45.6 668.9 844.0
% of Total 2.2 2.1 6.8 5.4
15
16
Figure 1. Life Expectancy at Birth, Massachusetts: 1900-2016
45.0
48.8
54.5
61.1
65.4
69.6 70.8 72.2 75.3
77.0 78.5 78.6 78.7 79.0 79.6 79.8 80.0 80.2 80.3 80.7 80.8 80.8 80.9 80.9 80.5 80.4 80.7
0
10
20
30
40
50
60
70
80
90
1900 1910 1920 1930 1940 1950 1960 1970 1980 1990 2000 2001 2002 2003 2004 2005 2006 2007 2008 2009 2010 2011 2012 2013 2014 2015 2016
Nu
mb
er
of
Ye
ars
Year
16
Note: Life Expectancy at birth calculated using the Greville Abridged Life Table Method (source: Dublin LI. Length of Life - A Study of the Life Table. Ronald Press Co.
New York. 1949).
17
Figure 2. Expected Years of Life Remaining1 at Different Ages by Race and Hispanic Ethnicity2, Massachusetts: 2016
Table 3. Years of Life Remaining1 by Race and Hispanic Ethnicity2 and Gender, Massachusetts: 2016
At Age: All All
Females
White non-Hispanic Females
Black non-Hispanic Females
Hispanic Females All
Males
White non-Hispanic
Males
Black non-Hispanic
Males
Hispanic Males
Birth 80.7 83.1 82.9 83.6 89.0 78.0 77.8 78.9 83.3
1 year old 80.0 82.4 82.1 83.3 88.4 77.4 77.0 78.6 82.8
5 years old 76.1 78.5 78.1 79.4 84.3 73.4 73.0 74.7 78.8
15 years old 66.1 68.6 68.2 69.5 74.4 63.5 63.1 64.8 68.8
25 years old 56.5 58.8 58.4 59.7 64.6 54.0 53.5 55.5 59.3
35 years old 47.1 49.2 48.9 50.1 54.9 44.9 44.6 46.3 50.2
45 years old 37.9 39.7 39.4 40.6 45.4 35.9 35.6 37.1 41.5
55 years old 28.9 30.5 30.2 31.7 36.1 27.2 26.9 28.5 33.3
65 years old 20.6 21.8 21.5 23.3 27.3 19.1 18.8 20.8 25.7
75 years old 13.1 13.9 13.6 15.7 19.4 12.0 11.7 14.4 19.2
85 years old 7.3 7.7 7.5 9.7 13.5 6.6 6.3 9.3 14.2
1. Years of Life Remaining calculated using the Greville Abridged Life Table Method (source: Dublin LI. Length of Life - A Study of the Life Table. Ronald Press Co. New York. 1949). 2. Population estimates are from 2016 bridged population file, MARS (Modified Age, Race/Ethnicity, and Sex) file. There are well-known difficulties in calculating accurate mortality rates for Massachusetts smaller populations such as Asians, Native Americans and Hispanics- please use caution when interpreting these numbers.
0
10
20
30
40
50
60
70
80
90
0 5 15 25 35 45 55 65 75 85
Ye
ars
of
Lif
e R
em
ain
ing
Age
White non-Hispanic
Black non-Hispanic
Hispanic
18
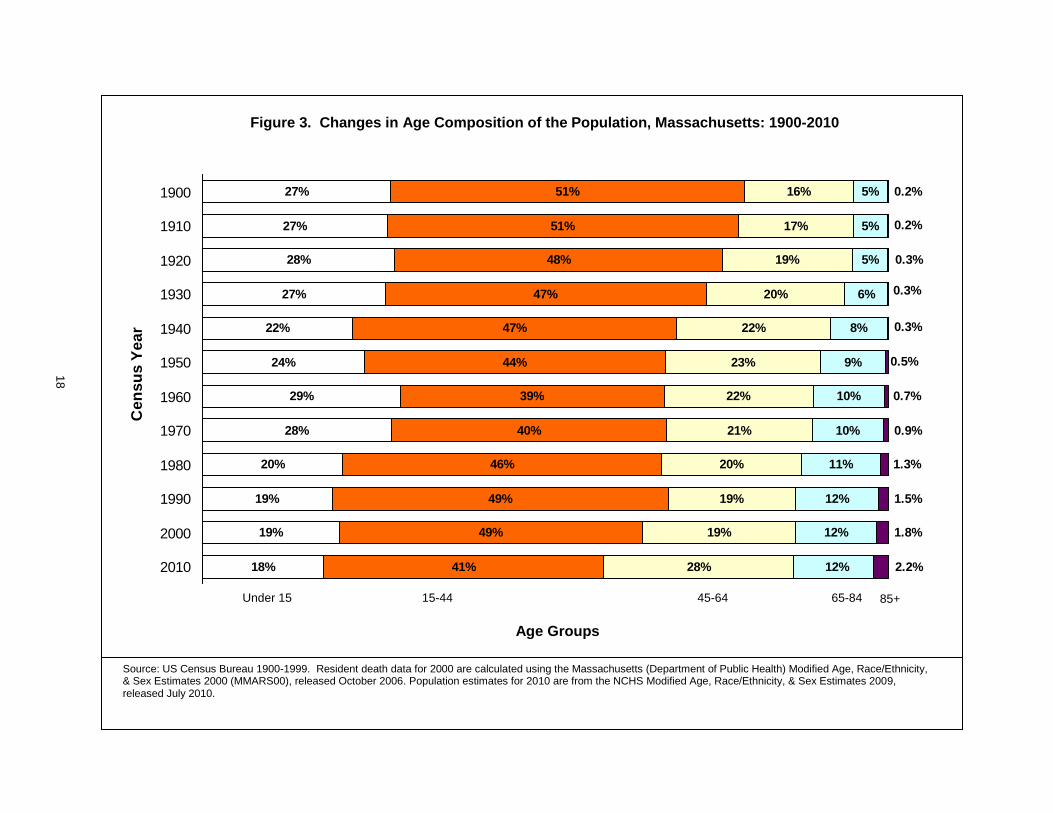
Figure 3. Changes in Age Composition of the Population, Massachusetts: 1900-2010
18%
19%
20%
28%
29%
24%
22%
27%
28%
27%
27%
41%
49%
46%
40%
39%
44%
47%
47%
48%
51%
51%
28%
19%
20%
21%
22%
23%
22%
20%
19%
17%
16%
12%
11%
10%
10%
9%
8%
6%
5%
5%
5%
19% 49% 19%
12%
12%
0.2%
0.9%
1.3%
1.5%
1.8%
2.2%
0.7%
0.5%
0.3%
0.3%
0.3%
0.2%
2010
2000
1990
1980
1970
1960
1950
1940
1930
1920
1910
1900
Ce
ns
us
Ye
ar
Age Groups15-44 Under 15 45-64 65-84 85+
Source: US Census Bureau 1900-1999. Resident death data for 2000 are calculated using the Massachusetts (Department of Public Health) Modified Age, Race/Ethnicity, & Sex Estimates 2000 (MMARS00), released October 2006. Population estimates for 2010 are from the NCHS Modified Age, Race/Ethnicity, & Sex Estimates 2009, released July 2010.
18
Age Groups
19
Figure 4. Trends in Percentage of Deaths from Selected Causes, Massachusetts: 1842-2016
0%
10%
20%
30%
40%
50%
60%18
42
18
47
18
52
18
57
18
62
18
67
18
72
18
77
18
82
18
87
18
92
18
97
19
02
19
07
19
12
19
17
19
22
19
27
19
32
19
37
19
42
19
47
19
52
19
57
19
62
19
67
19
72
19
77
19
82
19
87
19
92
19
97
20
02
20
07
20
12
Pe
rce
nt
of
To
tal D
eath
s
Cancer
Infectious Disease
Heart Disease
Injuries
2016
19
Year

20
Table 4. Distribution of Deaths by Place of Occurrence, Massachusetts: 2012-2016
Type of Place where Death Occurred
2012 2013 2014 2015 2016
Number Percent Number Percent Number Percent Number Percent Number Percent
Hospital (inpatient/outpatient)
19,963 38% 20,277 37% 20,534 37% 21,397 37% 20,579 36%
Dead on Arrival
623 1% 617 1% 641 1% 602 1% 732 1%
Nursing Home
15,377 29% 15,652 29% 15,353 28% 16,099 28% 14,800 26%
Hospice
--1 --
1 --
1 --
1 --
1 --
1 2,628 5% 3,137 6%
Assisted Living Facility or Rest Home
--1 --
1 --
1 --
1 --
1 --
1 1,251 2% 1,332 2%
At Home
14,553 27% 15,117 28% 15,096 27% 14,419 25% 14,925 26%
Other
2,624 5% 2,842 5% 3,499 6% 1,382 2% 1,446 3%
Unknown
29 0.05% 104 0.19% 36 0.07% 7 0.01% 2 0%
1. Prior to 2015, these deaths were included in the “Other” category.
20
21
Figure 5. Proportion of Deaths Certified by Medical Examiner for Selected Causes of Death, Massachusetts: 2016
Note: See the Appendix section, “Circumstance for Referral to the Office of the Chief Medical Examiner (OCME)” for a list of circumstances requiring referral to the Medical Examiner’s Office. Note: Other Injuries include motor vehicle-related, poisonings, falls, etc.
94.6%
85.9%
9.6%
3.0% 1.5% 0.6% 0%
10%
20%
30%
40%
50%
60%
70%
80%
90%
100%
Suicide &Homicide
Other Injuries HeartDisease
ChronicLower
RespiratoryDisease
Pneumonia &Influenza
Cancer
Pe
rce
nt
Selected Causes

22
Figure 6. Premature Mortality Rate (PMR) by Race and Hispanic Ethnicity, Massachusetts: 2016
Note: Premature Mortality Rate is defined as deaths that occur before the age of 75 years per 100,000, age-adjusted to the 2000 US standard population under 75 years of age.
282.2 288.6
309.2
122.1
251.9
0
50
100
150
200
250
300
350
Total White non-Hispanic Black non-Hispanic Asian non-Hispanic Hispanic
Ag
e-A
dju
ste
d R
ate
per
100,0
00
Race/Ethnicity
22
23
Table 5. Age-Specific and Age-Adjusted Death Rates for Ages 25-64 Years by Educational Attainment, Massachusetts: 2016
Age-Specific
Rates
Age-Adjusted Rates
Years of School Completed 25-34 years 35-44 years 45-64 years 25-64 years
High School or Less 322.9 368.3 884.3 576.7
13+ Education 67.5 89.7 276.7 163.7
Source: C15001: SEX BY AGE BY EDUCATIONAL ATTAINMENT FOR THE POPULATION 18 YEARS AND OVER Universe: Population 18 Years And Over. 2009-2011 American Community Survey 3-Year Estimates.
322.9 368.3
884.3
576.7
67.5 89.7
276.7
163.7
0
100
200
300
400
500
600
700
800
900
1,000
25-34 years 35-44 years 45-64 years 25-64 years
Ag
e-A
dju
ste
d D
eath
s p
er
100,0
00
Age
High School or Less
13+ Education
24
Figure 7. Daily Mortality Statistics, Massachusetts: 2016
Every day in 2016, in Massachusetts there were on average:
1. Includes 41 deaths due to other causes.
1 Infant Death
4 Infectious Disease
Deaths
14 Respiratory Deaths
5 Alzheimer’s Deaths
33 Heart Disease Deaths
3 Diabetes Deaths
7 Stroke Deaths
13 Injury Deaths
7 Poisoning Deaths
6 Other Intentional &
Unintentional Injury Deaths
2 Suicide Deaths
35 Cancer Deaths
156 deaths1
2 Suicide Deaths
2 Falls Deaths
2 Other Intentional & Unintentional Injury Deaths

25
Table 6. Top Ten Leading Underlying Causes of Death by Age, Massachusetts: 2016
Age Groups (number of deaths)
Rank1
<1 year 1-14
years 15-24 years
25-44 years
45-64 years
65-74 years
75-84 years
85+ years
All
1
Short Gestation and LBW
1 (70)
Unintentional Injuries
3 (27)
Unintentional Injuries
3 (285)
Unintentional Injuries
3 (1,409) Cancer (2,984) Cancer (3,316) Cancer (3,411)
Heart Disease (5,797)
Cancer (12,691)
2
Congenital Malformations
(50) Cancer (20) Suicide (83) Cancer (261) Heart Disease
(1,559) Heart Disease
(1,736) Heart Disease
(2,657) Cancer (2,674)
Heart Disease (11,923)
3
Pregnancy Complications
(28) Heart Disease
(8) Homicide (44) Suicide (210) Unintentional
Injuries3 (1,097)
Chronic Lower Respiratory
Disease5 (616)
Chronic Lower Respiratory
Disease5 (838) Stroke (1,325)
Unintentional Injuries
3
(3,887)
4
SIDS2 (14)
Congenital Malformations
(8) Cancer (25) Heart Disease
(150) Chronic Liver Disease (389) Stroke (303) Stroke (608)
Alzheimer’s Disease (1,234)
Chronic Lower Respiratory
Disease5
(2,676)
5
Complications of Placenta (11)
Ill-Defined Conditions
4 (7)
Ill-Defined Conditions
4 (16)
Ill-Defined Conditions
4 (79)
Chronic Lower Respiratory
Disease5 (300) Diabetes (299)
Alzheimer’s Disease (371)
Chronic Lower Respiratory
Disease5 (889) Stroke (2,468)
6
Respiratory Distress (9) Suicide (7)
Heart Disease (13)
Chronic Liver Disease (65) Diabetes (254)
Unintentional Injuries
3 (255) Nephritis (320)
Influenza & Pneumonia
(652)
Alzheimer’s Disease (1,710)
7
Necrotizing Entercolitis (8)
Other Infections (4)
Congenital Malformations (5) Homicide (65) Suicide (243) Nephritis (207) Diabetes (317)
Unintentional Injuries
3 (508)
Diabetes (1,267)
8
Intrauterine Hypoxia (6)
In Situ Neoplasms (3)
Injuries of Undetermined
Intent3 (4)
Chronic Lower Respiratory
Disease5 (28) Stroke (206)
Influenza & Pneumonia
(172) Unintentional Injuries
3 (301) Nephritis (502)
Influenza & Pneumonia
(1,243)
9 Pulmonary
Hemorrhage (4) Homicide (3) Diabetes (3) Diabetes (27) Septicemia (123) Septicemia
(167)
Influenza & Pneumonia
(289)
Ill-Defined Conditions
4
(449)
Nephritis (1,140)
10 Neonatal Hemorrhage (4) Stroke (2)
Medical Complications (3) Septicemia (24)
Hypertension (111)
Chronic Liver Disease (145)
Septicemia (258) Diabetes (367)
Ill-Defined Conditions
4
(890)
All Causes Total (283) Total (115) Total (526) Total (2,742) Total (9,270) Total (9,332) Total (12,870) Total (21,813) Total (56,953)
Note: Ranking based on number of deaths. The number of deaths is shown in parentheses. 1. LBW: Low birthweight.
2. SIDS: Sudden Infant Death Syndrome
3. Injuries are subdivided into 4 separate categories by intent: unintentional, homicide, suicide, and injuries of undetermined intent (deaths where investigation has not determined whether injuries were accidental or purposely inflicted).
4. Ill-Defined Conditions: Includes ICD-10 codes R00-R99.
5. The title of this cause of death has changed between ICD-10 and ICD-9. Chronic Lower Respiratory Disease (ICD-10 title) corresponds to Chronic Obstructive Pulmonary Disease (COPD) (ICD-9 title).
25
26
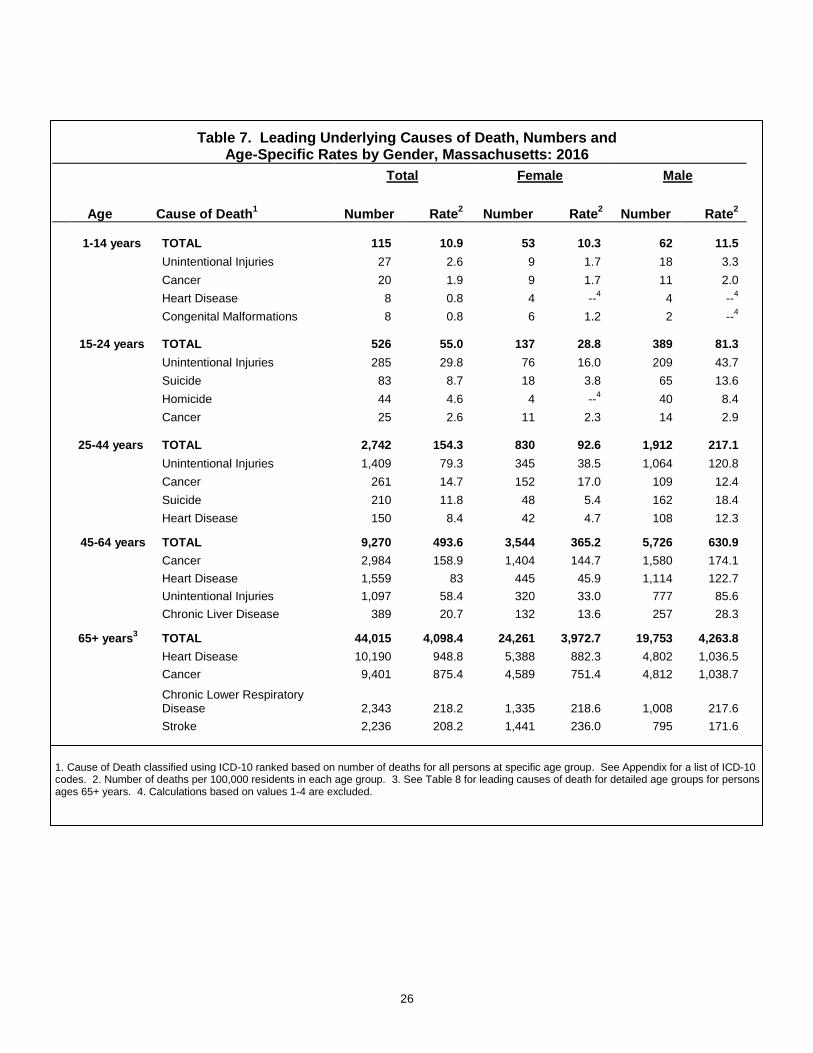
Table 7. Leading Underlying Causes of Death, Numbers and Age-Specific Rates by Gender, Massachusetts: 2016
Total Female Male
Age Cause of Death1 Number Rate
2 Number Rate
2 Number Rate
2
1-14 years TOTAL 115 10.9 53 10.3 62 11.5 Unintentional Injuries 27 2.6 9 1.7 18 3.3 Cancer 20 1.9 9 1.7 11 2.0 Heart Disease 8 0.8 4 --
4 4 --
4
Congenital Malformations 8 0.8 6 1.2 2 --4
15-24 years TOTAL 526 55.0 137 28.8 389 81.3 Unintentional Injuries 285 29.8 76 16.0 209 43.7 Suicide 83 8.7 18 3.8 65 13.6 Homicide 44 4.6 4 --
4 40 8.4
Cancer 25 2.6 11 2.3 14 2.9
25-44 years TOTAL 2,742 154.3 830 92.6 1,912 217.1 Unintentional Injuries 1,409 79.3 345 38.5 1,064 120.8 Cancer 261 14.7 152 17.0 109 12.4 Suicide 210 11.8 48 5.4 162 18.4 Heart Disease 150 8.4 42 4.7 108 12.3
45-64 years TOTAL 9,270 493.6 3,544 365.2 5,726 630.9 Cancer 2,984 158.9 1,404 144.7 1,580 174.1 Heart Disease 1,559 83 445 45.9 1,114 122.7 Unintentional Injuries 1,097 58.4 320 33.0 777 85.6 Chronic Liver Disease 389 20.7 132 13.6 257 28.3
65+ years3 TOTAL 44,015 4,098.4 24,261 3,972.7 19,753 4,263.8
Heart Disease 10,190 948.8 5,388 882.3 4,802 1,036.5 Cancer 9,401 875.4 4,589 751.4 4,812 1,038.7
Chronic Lower Respiratory Disease 2,343 218.2 1,335 218.6 1,008 217.6
Stroke 2,236 208.2 1,441 236.0 795 171.6
1. Cause of Death classified using ICD-10 ranked based on number of deaths for all persons at specific age group. See Appendix for a list of ICD-10 codes. 2. Number of deaths per 100,000 residents in each age group. 3. See Table 8 for leading causes of death for detailed age groups for persons ages 65+ years. 4. Calculations based on values 1-4 are excluded.
27
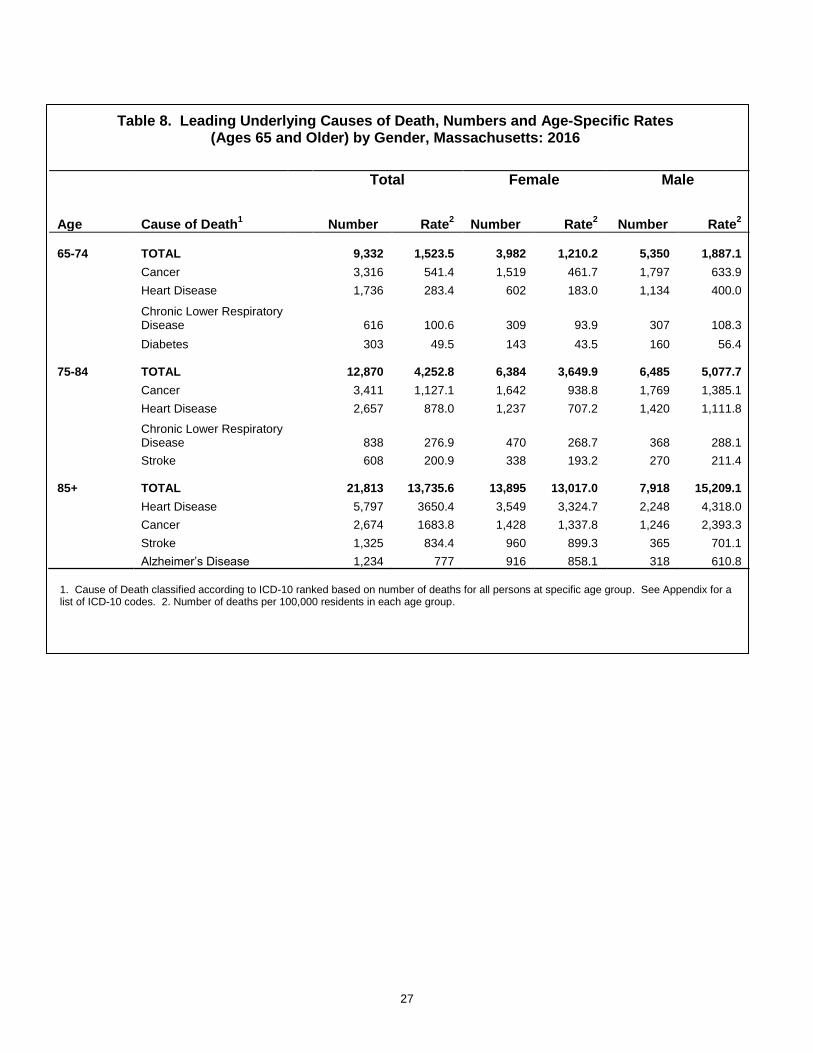
Table 8. Leading Underlying Causes of Death, Numbers and Age-Specific Rates
(Ages 65 and Older) by Gender, Massachusetts: 2016
Total Female Male
Age Cause of Death1 Number Rate
2 Number Rate
2 Number Rate
2
65-74 TOTAL 9,332 1,523.5 3,982 1,210.2 5,350 1,887.1
Cancer 3,316 541.4 1,519 461.7 1,797 633.9
Heart Disease 1,736 283.4 602 183.0 1,134 400.0
Chronic Lower Respiratory Disease 616 100.6 309 93.9 307 108.3
Diabetes 303 49.5 143 43.5 160 56.4
75-84 TOTAL 12,870 4,252.8 6,384 3,649.9 6,485 5,077.7
Cancer 3,411 1,127.1 1,642 938.8 1,769 1,385.1
Heart Disease 2,657 878.0 1,237 707.2 1,420 1,111.8
Chronic Lower Respiratory Disease 838 276.9 470 268.7 368 288.1
Stroke 608 200.9 338 193.2 270 211.4
85+ TOTAL 21,813 13,735.6 13,895 13,017.0 7,918 15,209.1
Heart Disease 5,797 3650.4 3,549 3,324.7 2,248 4,318.0
Cancer 2,674 1683.8 1,428 1,337.8 1,246 2,393.3
Stroke 1,325 834.4 960 899.3 365 701.1
Alzheimer’s Disease 1,234 777 916 858.1 318 610.8
1. Cause of Death classified according to ICD-10 ranked based on number of deaths for all persons at specific age group. See Appendix for a list of ICD-10 codes. 2. Number of deaths per 100,000 residents in each age group.
28
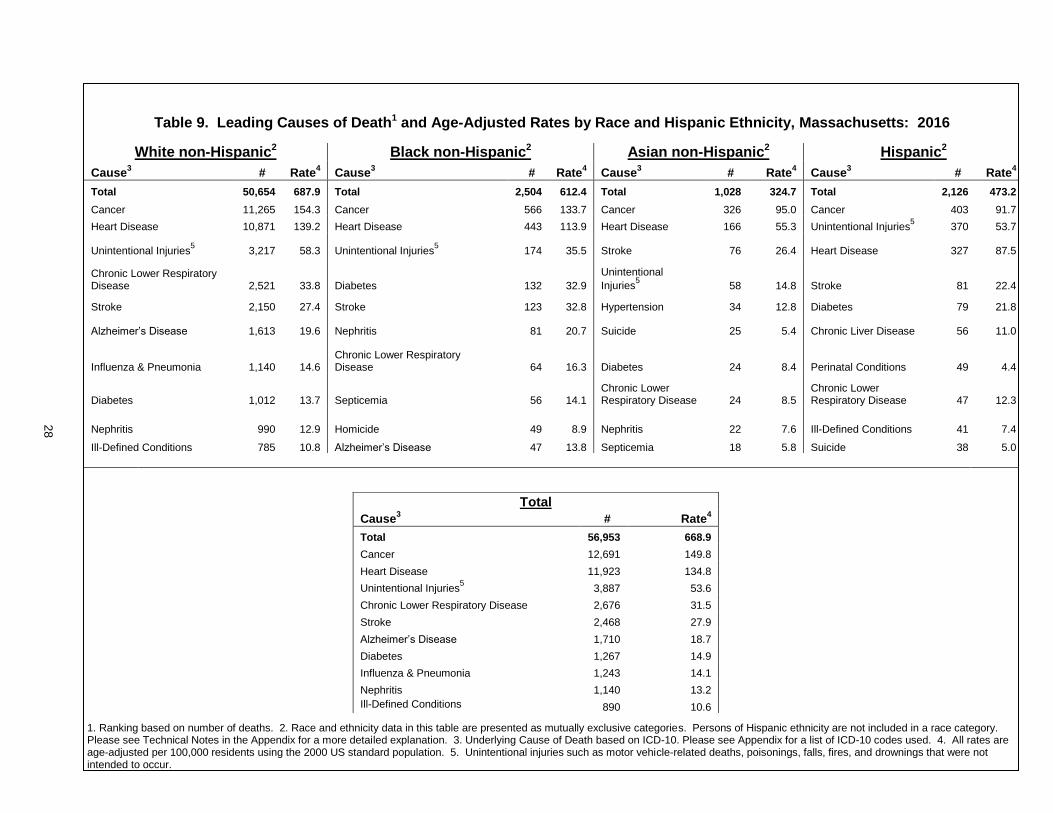
Table 9. Leading Causes of Death1 and Age-Adjusted Rates by Race and Hispanic Ethnicity, Massachusetts: 2016
White non-Hispanic2 Black non-Hispanic2 Asian non-Hispanic2 Hispanic2
Cause3 # Rate
4 Cause
3 # Rate
4 Cause
3 # Rate
4 Cause
3 # Rate
4
Total 50,654 687.9 Total 2,504 612.4 Total 1,028 324.7 Total 2,126 473.2
Cancer 11,265 154.3 Cancer 566 133.7 Cancer 326 95.0 Cancer 403 91.7
Heart Disease 10,871 139.2 Heart Disease 443 113.9 Heart Disease 166 55.3 Unintentional Injuries5 370 53.7
Unintentional Injuries5 3,217 58.3 Unintentional Injuries
5 174 35.5 Stroke 76 26.4 Heart Disease 327 87.5
Chronic Lower Respiratory Disease 2,521 33.8 Diabetes 132 32.9
Unintentional
Injuries5 58 14.8 Stroke 81 22.4
Stroke 2,150 27.4 Stroke 123 32.8 Hypertension 34 12.8 Diabetes 79 21.8
Alzheimer’s Disease 1,613 19.6 Nephritis 81 20.7 Suicide 25 5.4 Chronic Liver Disease 56 11.0
Influenza & Pneumonia 1,140 14.6 Chronic Lower Respiratory Disease 64 16.3 Diabetes 24 8.4 Perinatal Conditions 49 4.4
Diabetes 1,012 13.7 Septicemia 56 14.1 Chronic Lower Respiratory Disease 24 8.5
Chronic Lower Respiratory Disease 47 12.3
Nephritis 990 12.9 Homicide 49 8.9 Nephritis 22 7.6 Ill-Defined Conditions 41 7.4
Ill-Defined Conditions 785 10.8 Alzheimer’s Disease 47 13.8 Septicemia 18 5.8 Suicide 38 5.0
Total
Cause3 # Rate
4
Total 56,953 668.9
Cancer 12,691 149.8
Heart Disease 11,923 134.8
Unintentional Injuries5 3,887 53.6
Chronic Lower Respiratory Disease 2,676 31.5
Stroke 2,468 27.9
Alzheimer’s Disease 1,710 18.7
Diabetes 1,267 14.9
Influenza & Pneumonia 1,243 14.1
Nephritis 1,140 13.2
Ill-Defined Conditions
890 10.6
28
1. Ranking based on number of deaths. 2. Race and ethnicity data in this table are presented as mutually exclusive categories. Persons of Hispanic ethnicity are not included in a race category. Please see Technical Notes in the Appendix for a more detailed explanation. 3. Underlying Cause of Death based on ICD-10. Please see Appendix for a list of ICD-10 codes used. 4. All rates are age-adjusted per 100,000 residents using the 2000 US standard population. 5. Unintentional injuries such as motor vehicle-related deaths, poisonings, falls, fires, and drownings that were not intended to occur.
29
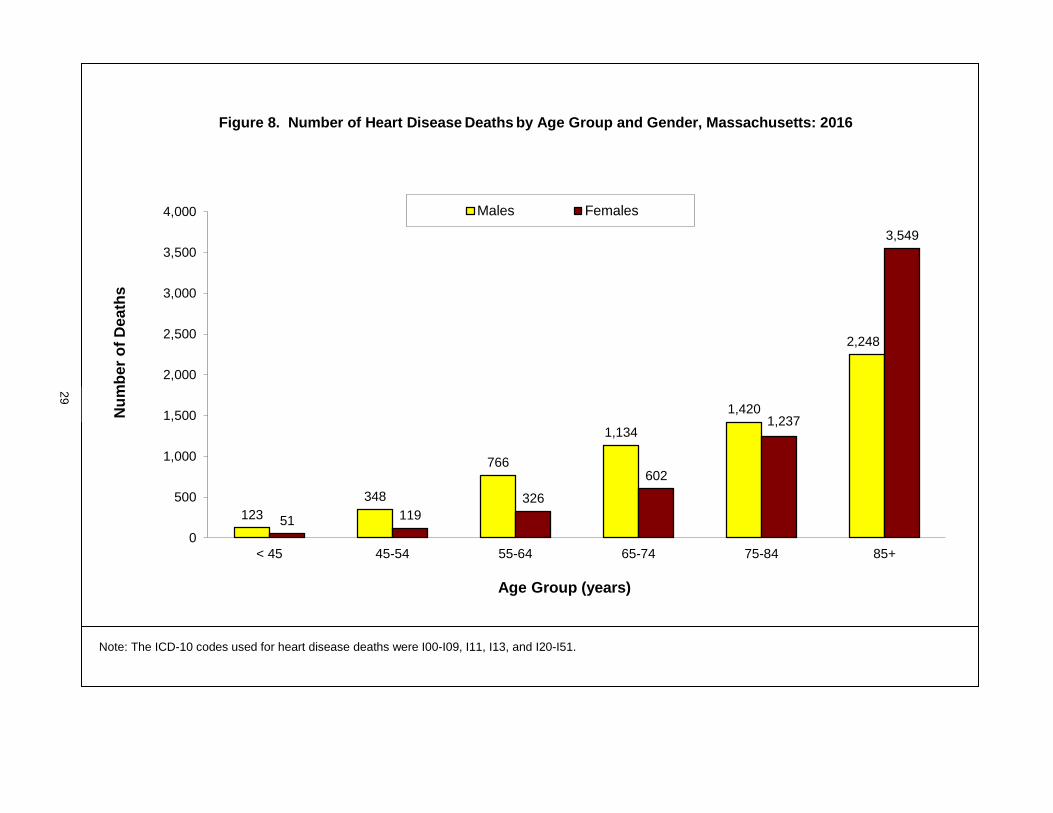
Figure 8. Number of Heart Disease Deaths by Age Group and Gender, Massachusetts: 2016
123
348
766
1,134
1,420
2,248
51 119
326
602
1,237
3,549
0
500
1,000
1,500
2,000
2,500
3,000
3,500
4,000
< 45 45-54 55-64 65-74 75-84 85+
Nu
mb
er
of
Death
s
Age Group (years)
Males Females
Note: The ICD-10 codes used for heart disease deaths were I00-I09, I11, I13, and I20-I51.
29

30
Figure 9. Age Distribution by Race and Hispanic Ethnicity for Heart Disease Deaths, Massachusetts: 2016
85% 87%
69%
78%
66%
13% 12%
26% 15%
28%
1% 1% 5% 7% 6%
TOTAL White non-Hispanic Black non-Hispanic Asian non-Hispanic Hispanic
Pe
rce
nt
Race/Ethnicity
1-44
45-64
65+
Note: The ICD-10 codes used for heart disease deaths were I00-I09, I11, I13, and I20-I51.
30

31
Figure 10. Number of Cancer Deaths by Age Group and Gender, Massachusetts: 2016
134
372
1,208
1,797 1,769
1,246
172
419
985
1,519
1,642
1,428
0
200
400
600
800
1,000
1,200
1,400
1,600
1,800
2,000
< 45 45-54 55-64 65-74 75-84 85+
Nu
mb
er
of
De
ath
s
Age Group (years)
Males Females
31
Note: The ICD-10 codes used for cancer deaths were C00-C97.
32
Figure 11. Age Distribution by Race and Hispanic Ethnicity for Cancer Deaths, Massachusetts: 2016
74% 76%
60% 57% 51%
23% 22%
36% 36%
37%
2% 2% 5% 6% 12%
TOTAL White non-Hispanic Black non-Hispanic Asian non-Hispanic Hispanic
Pe
rce
nt
Race/Ethnicity
1-44
45-64
65+
Note: The ICD-10 codes used for cancer deaths were C00-C97.
32

33
Table 10. Heart Disease and Cancer Deaths by Race and Hispanic Ethnicity and Gender, Age-Adjusted Rates1, Massachusetts: 2003-2016
Heart Disease
White non-Hispanic2 Black non-Hispanic2 Year Male Female Total Male Female Total
2003 250.3 160.2 198.5 272.1 188.5 223.9
2004 233.1 150.3 185.7 268.1 148.3 198.8
2005 220.6 139.1 174.9 233.7 174.5 199.8
2006 216.5 138.8 172.2 222.3 127.6 165.3
2007 216.2 134.2 168.5 233.5 142.7 180.8
2008 217.1 133.1 167.9 226.7 151.7 181.7
2009 211.3 122.6 158.4 217.3 157.3 181.6
2010 197.5 119.6 152.9 222.3 119.4 159.7
2011 196.0 113.0 148.0 185.6 114.1 143.7
2012 187.5 113.0 144.7 167.3 125.2 144.3
2013 192.3 114.3 147.4 164.6 99.1 128.3
2014 185.5 109.4 142.0 168.3 98.0 127.9
2015 184.8 111.1 142.7 156.6 85.6 114.3
2016 179.8 109.1 139.2 147.5 90.8 113.9
Asian non-Hispanic2
Hispanic2 Year Male Female Total Male Female Total
2003 115.2 65.0 87.6 124.8 96.2 109.7
2004 56.9 54.3 56.1 129.9 77.4 100.3
2005 77.5 48.2 61.3 118.5 83.7 99.2
2006 73.6 70.0 72.8 124.2 84.9 102.3
2007 83.3 52.9 67.4 124.9 61.8 88.3
2008 86.0 51.7 66.3 93.2 66.1 78.3
2009 69.6 51.3 60.1 111.6 62.7 83.8
2010 64.8 50.4 57.1 90.8 66.8 76.9
2011 74.1 61.0 67.5 114.9 72.0 89.7
2012 74.7 43.2 57.1 106.8 70.5 85.8
2013 67.7 43.2 54.4 81.3 56.4 67.7
2014 74.3 42.6 57.5 83.4 65.4 72.9
2015 78.6 47.2 60.6 104.6 77.6 90.0
2016 61.5 50.4 55.3 103.7 73.2 87.5
33

34
Table 10 (continued). Heart Disease and Cancer Deaths by Race and Hispanic Ethnicity and Gender, Age-Adjusted Rates, Massachusetts: 2003-2016
Cancer
White non-Hispanic2 Black non-Hispanic2 Year Male Female Total Male Female Total
2003 237.1 169.4 195.7 304.5 199.0 238.7 2004 230.4 168.4 192.5 277.6 155.7 200.1
2005 226.1 163.2 188.1 264.2 168.1 204.1
2006 234.9 161.5 190.0 265.6 180.9 212.4
2007 226.0 156.5 183.2 270.7 159.7 201.7 2008 221.4 154.8 180.6 255.0 163.7 197.9 2009 212.7 157.0 177.7 244.7 164.7 193.1 2010 211.9 150.8 174.9 244.0 131.3 174.3 2011 206.5 145.9 170.4 209.9 162.3 178.0
2012 201.3 149.1 170.2 229.4 150.7 180.6 2013 193.2 144.0 163.8 207.0 141.7 166.3 2014 192.1 137.4 159.8 194.0 114.1 145.0 2015 185.2 138.6 157.3 161.8 116.3 133.2 2016 185.2 133.2 154.3 165.3 113.6 133.7
Asian non-Hispanic2 Hispanic2 Year Male Female Total Male Female Total
2003 134.6 87.4 109.3 110.0 76.6 90.0
2004 109.5 79.7 93.1 125.6 82.5 100.4
2005 138.9 79.5 106.1 118.2 97.3 105.7
2006 126.0 91.7 107.2 119.9 74.3 93.7
2007 124.4 76.4 98.4 125.0 90.0 104.7
2008 132.1 89.3 109.0 141.2 83.1 107.8
2009 123.2 71.0 94.3 129.9 98.2 111.8
2010 128.0 98.1 111.8 129.9 87.2 103.9
2011 127.1 92.6 107.3 125.6 84.0 101.1
2012 137.3 78.8 104.6 150.5 94.4 117.7
2013 106.3 66.3 84.4 122.6 91.7 105.1
2014 131.0 83.3 104.7 115.9 89.3 100.2
2015 112.9 86.5 97.9 114.3 83.3 95.6
2016 124.8 71.9 95.0 109.2 80.3 91.7
1. Rates are per 100,000 age-adjusted to the 2000 US standard population. 2. Race and ethnicity data in this table are presented as mutually exclusive categories. Persons of Hispanic ethnicity are not included in a race category. Please see Technical Notes in the Appendix for a more detailed explanation.
34
35
Table 11. Number and Age-Adjusted Rates of Cancer Deaths by Selected Causes
and Gender, Massachusetts: 2016
Cause of Death1 ICD-10
Code Total Female Male
# Rate2,3 # Rate2 # Rate2
Total Cancer Deaths C00-C97 12,691 149.8 6,165 129.0 6,526 180.5
Bladder C67 430 5.0 115 2.3 315 9.2
Brain and nervous system C70-C72 393 4.8 171 3.9 222 5.9
Cervix C53 48 1.1 48 1.1 NA NA
Colorectal C18-C21 974 11.6 516 10.9 458 12.8
Esophageal C15 372 4.3 85 1.7 287 7.5
Female breast4 C50
4 775 16.8 775 16.8 NA NA
Hodgkin’s disease C81 20 0.2 10 0.2 10 0.3
Kidney and other urinary organs
C64, C65 263 3.1 99 2.0 164 4.5
Leukemia C91-C95 477 5.7 219 4.5 258 7.5
Lung C33, C34 3,168 37.3 1,570 32.5 1,598 43.8
Melanoma of the skin C43 187 2.2 69 1.4 118 3.3
Multiple myeloma C88, C90 269 3.1 119 2.3 150 4.2
Non-Hodgkin’s lymphoma C82-C85 433 5.2 204 4.2 229 6.5
Ovarian C56 313 6.6 313 6.6 NA NA
Pancreatic C25 985 11.6 477 9.9 508 13.7
Prostate C61 633 18.6 NA NA 633 18.6
Stomach C16 250 2.9 98 2.0 152 4.1
Uterus C54, C55 210 4.3 210 4.3 NA NA
All other cancers Residual 2,491 29.2 1,067 22.2 1,424 38.5
1. Common terms are used to describe the causes of cancer deaths. For detailed terminology of cancer sites, please see the ICD-10 code list in the Appendix. 2. Rates are per 100,000 age-adjusted to the 2000 US standard population. 3. The total resident population is used to calculate all "Total Rates" except for ICD-10 codes C50, C53-C56, which are based on the total female population, and ICD-10 C61, which is based on the total male population. 4. Includes only female breast cancer.
36
Table 12. Selected Causes of Cancer Deaths by Age, Massachusetts: 2016
Age Cause of Death1 ICD-10 Code Number Age-Specific Rate
2
1-14 years Total 20 1.9
Brain and nervous system C70-C72 7 0.7 Leukemia C91-C95 2 --
3
Non-Hodgkin’s lymphoma C82-C85 1 --3
15-24 years Total 25 2.6
Leukemia C91-C95 6 0.6
Brain and nervous system C70-C72 5 0.5
Colorectal C18-C21 1 --3
Melanoma of the skin C43 1 --3
25-44 years Total 261 14.7
Female breast4 C50 48 5.4
Colorectal C18-C21 39 2.2
Brain and nervous system C70-C72 27 1.5
Leukemia C91-C95 20 1.1
45-64 years Total 2,984 158.9
Lung C33, C34 723 38.5 Colorectal C18-C21 247 13.2 Female breast
4 C50 243 25.0
Pancreas C25 240 12.8
65+ years Total 9,401 875.4
Lung C33, C34 2,429 226.2
Pancreas C25 737 68.6
Colorectal C18-C21 687 64.0
Prostate5 C61 574 123.9
65-74 years Total 3,316 541.4 Lung C33, C34 966 157.7 Pancreas C25 280 45.7
Colorectal C18-C21 203 33.1
Female breast4 C50 168 51.1
75-84 years Total 3,411 1,127.1 Lung C33, C34 947 312.9 Pancreas C25 284 93.8 Colorectal C18-C21 244 80.6 Prostate
5 C61 192 150.3
85+ years Total 2,674 1,683.8 Lung C33, C34 516 324.9 Prostate
5 C61 264 507.1
Colorectal C18-C21 240 151.1 Pancreas C25 173 108.9
1. Common terms are used to describe causes of cancer death. For detailed terminology, please see the ICD-10 codes listed in the Appendix. 2. Number of deaths per 100,000 residents in each age group. 3. Calculations based on values 1-4 are excluded. 4. Calculation based on female population in specified age group. 5. Calculation based on male population in specified age group.
37
Table 13. Leading Causes of Cancer Deaths and Age-Adjusted Rates by Race and Hispanic Ethnicity, Massachusetts: 2016
White non-Hispanic1
Black non-Hispanic1 Asian non-Hispanic1 Hispanic1
Cause2 # Rate3 Cause2 # Rate3 Cause2 # Rate3 Cause2 # Rate3
Lung 2,895 39.5 Lung 113 26.5 Lung 93 29.1 Lung 50 12.4
Pancreatic 883 12.1 Colorectal 53 12.7 Stomach 25 6.9 Colorectal 33 6.7
Colorectal 853 11.9 Pancreatic 52 12.2 Colorectal 24 6.8 Female Breast
4
29 9.8
Female Breast4 670 17.2 Prostate
5 50 37.3 Female Breast
4 23 10.3 Pancreatic 27 6.9
Prostate5 551 18.3 Female Breast
4 40 15.5 Pancreatic 13 4.1
Non-Hodgkin’s Lymphoma
20 4.6
Total Cancer 11,265 154.3 Total Cancer 566 133.7 Total Cancer 326 95.0 Total Cancer 403 91.7
1. Race and ethnicity data in this table are presented as mutually exclusive categories. Persons of Hispanic ethnicity are not included in a race category. Please see the Technical Notes in the Appendix for a more detailed explanation. 2. ICD-10 codes used. Please see the ICD-10 codes listing in the Appendix for detailed terminology. 3. Rates are per 100,000 age-adjusted to the 2000 US standard population. 4. Calculation based on female population. 5. Calculation based on male population.
37
38
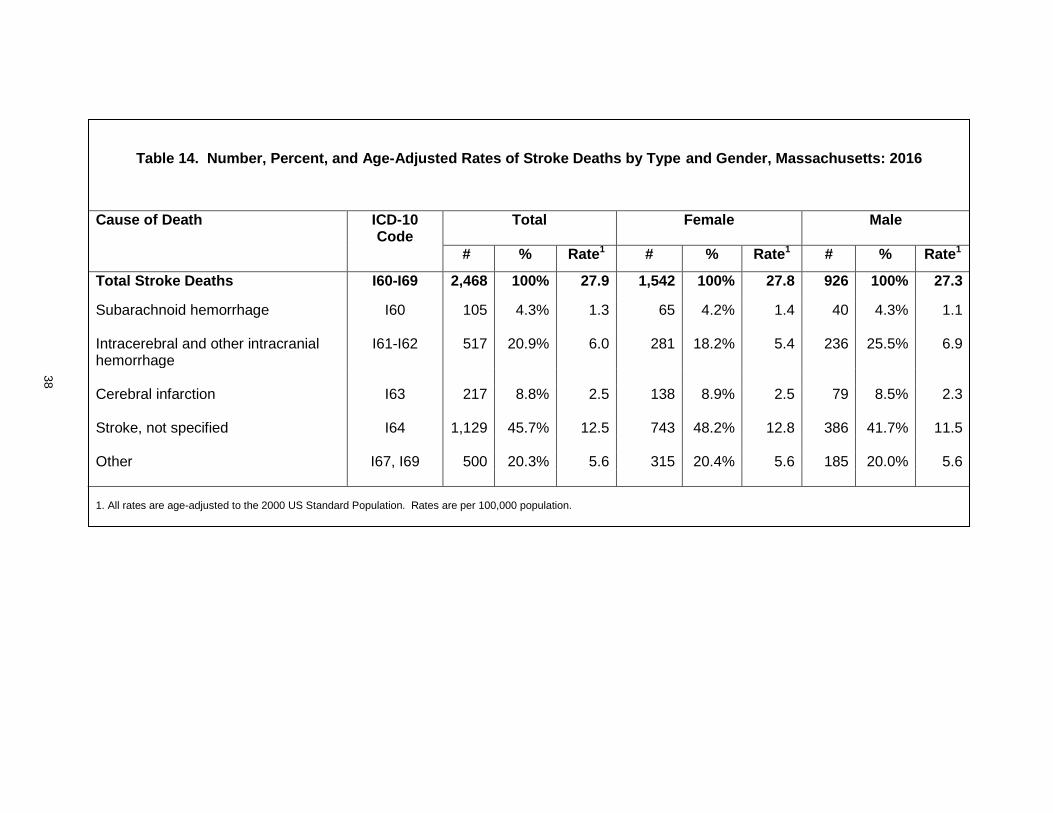
1. All rates are age-adjusted to the 2000 US Standard Population. Rates are per 100,000 population.
Table 14. Number, Percent, and Age-Adjusted Rates of Stroke Deaths by Type and Gender, Massachusetts: 2016
Cause of Death ICD-10 Code
Total
Female Male
# %
Rate1 # % Rate1 # % Rate1
Total Stroke Deaths
I60-I69 2,468 100% 27.9 1,542 100% 27.8 926 100% 27.3
Subarachnoid hemorrhage I60 105 4.3% 1.3 65 4.2% 1.4 40 4.3% 1.1 Intracerebral and other intracranial hemorrhage
I61-I62 517 20.9% 6.0 281 18.2% 5.4 236 25.5% 6.9
Cerebral infarction I63 217 8.8% 2.5 138 8.9% 2.5 79 8.5% 2.3 Stroke, not specified I64 1,129 45.7% 12.5 743 48.2% 12.8 386 41.7% 11.5 Other I67, I69 500 20.3% 5.6 315 20.4% 5.6 185 20.0% 5.6
38
39
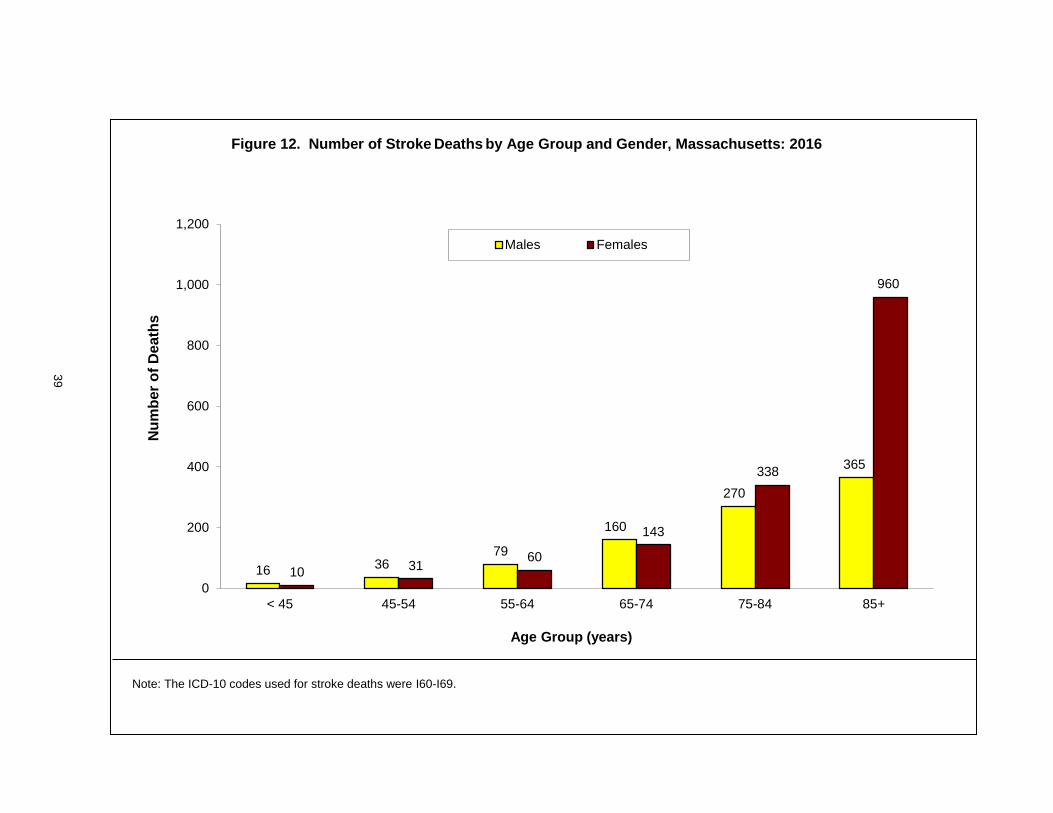
Figure 12. Number of Stroke Deaths by Age Group and Gender, Massachusetts: 2016
16 36 79
160
270
365
10 31
60
143
338
960
0
200
400
600
800
1,000
1,200
< 45 45-54 55-64 65-74 75-84 85+
Nu
mb
er
of
De
ath
s
Age Group (years)
Males Females
39
Note: The ICD-10 codes used for stroke deaths were I60-I69.
40
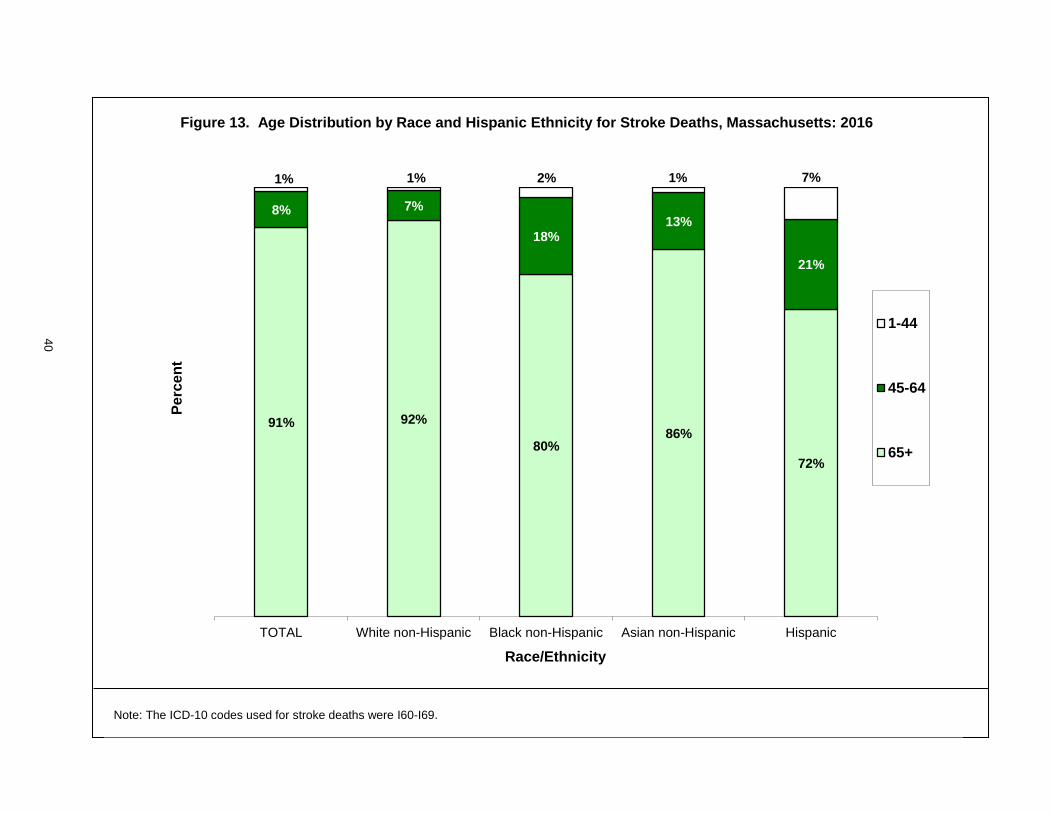
Figure 13. Age Distribution by Race and Hispanic Ethnicity for Stroke Deaths, Massachusetts: 2016
91% 92%
80% 86%
72%
8% 7%
18% 13%
21%
1% 1% 2% 1% 7%
TOTAL White non-Hispanic Black non-Hispanic Asian non-Hispanic Hispanic
Pe
rce
nt
Race/Ethnicity
1-44
45-64
65+
Note: The ICD-10 codes used for stroke deaths were I60-I69.
40
41
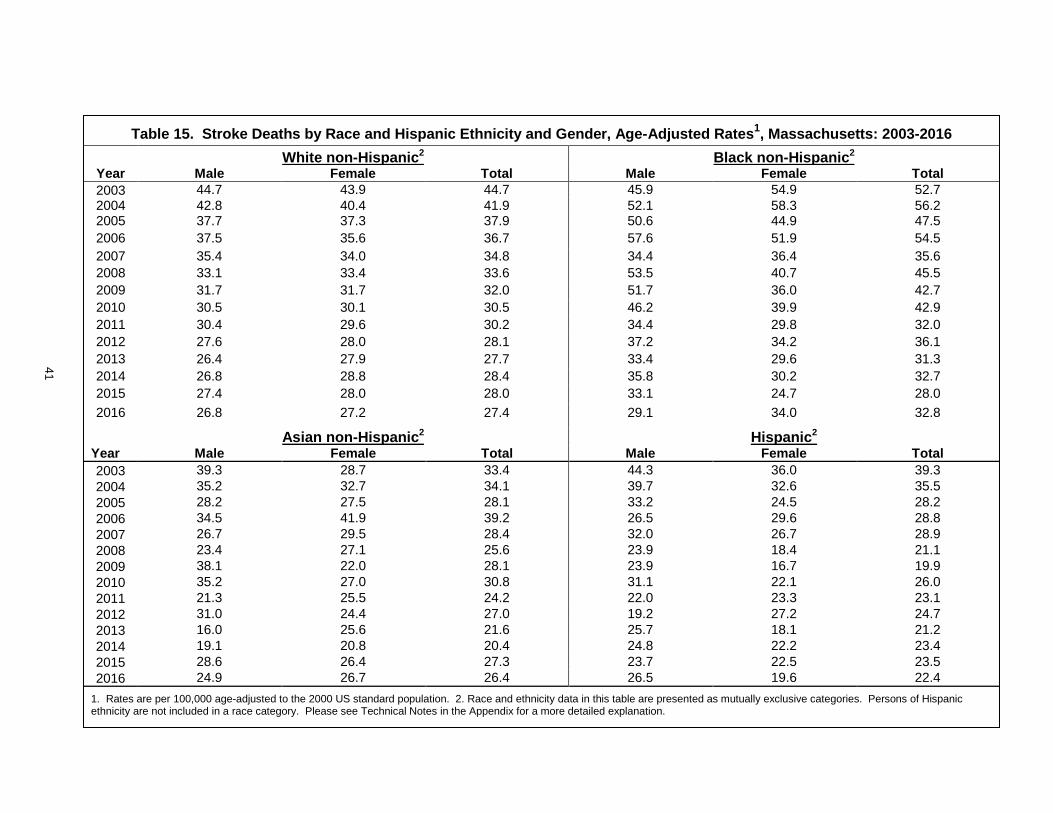
Table 15. Stroke Deaths by Race and Hispanic Ethnicity and Gender, Age-Adjusted Rates1, Massachusetts: 2003-2016
White non-Hispanic2 Black non-Hispanic2 Year Male Female Total Male Female Total
2003 44.7 43.9 44.7 45.9 54.9 52.7
2004 42.8 40.4 41.9 52.1 58.3 56.2 2005 37.7 37.3 37.9 50.6 44.9 47.5
2006 37.5 35.6 36.7 57.6 51.9 54.5
2007 35.4 34.0 34.8 34.4 36.4 35.6
2008 33.1 33.4 33.6 53.5 40.7 45.5
2009 31.7 31.7 32.0 51.7 36.0 42.7
2010 30.5 30.1 30.5 46.2 39.9 42.9
2011 30.4 29.6 30.2 34.4 29.8 32.0
2012 27.6 28.0 28.1 37.2 34.2 36.1
2013 26.4 27.9 27.7 33.4 29.6 31.3
2014 26.8 28.8 28.4 35.8 30.2 32.7
2015 27.4 28.0 28.0 33.1 24.7 28.0
2016 26.8 27.2 27.4 29.1 34.0 32.8
Asian non-Hispanic2 Hispanic2 Year Male Female Total Male Female Total
2003 39.3 28.7 33.4 44.3 36.0 39.3
2004 35.2 32.7 34.1 39.7 32.6 35.5
2005 28.2 27.5 28.1 33.2 24.5 28.2
2006 34.5 41.9 39.2 26.5 29.6 28.8
2007 26.7 29.5 28.4 32.0 26.7 28.9
2008 23.4 27.1 25.6 23.9 18.4 21.1
2009 38.1 22.0 28.1 23.9 16.7 19.9
2010 35.2 27.0 30.8 31.1 22.1 26.0
2011 21.3 25.5 24.2 22.0 23.3 23.1
2012 31.0 24.4 27.0 19.2 27.2 24.7
2013 16.0 25.6 21.6 25.7 18.1 21.2
2014 19.1 20.8 20.4 24.8 22.2 23.4
2015 28.6 26.4 27.3 23.7 22.5 23.5
2016 24.9 26.7 26.4 26.5 19.6 22.4
1. Rates are per 100,000 age-adjusted to the 2000 US standard population. 2. Race and ethnicity data in this table are presented as mutually exclusive categories. Persons of Hispanic ethnicity are not included in a race category. Please see Technical Notes in the Appendix for a more detailed explanation.
41
42
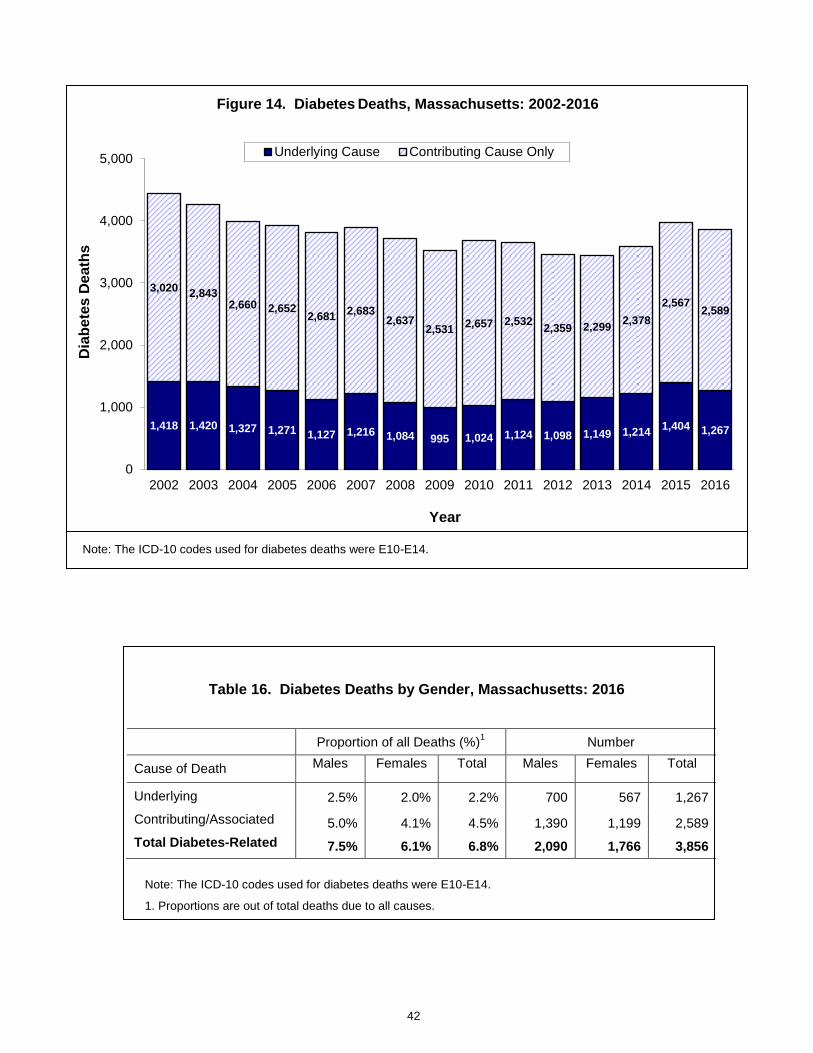
Figure 14. Diabetes Deaths, Massachusetts: 2002-2016
Table 16. Diabetes Deaths by Gender, Massachusetts: 2016
Proportion of all Deaths (%)1 Number
Cause of Death
Males Females Total Males Females Total
Underlying 2.5% 2.0% 2.2% 700 567 1,267
Contributing/Associated 5.0% 4.1% 4.5% 1,390 1,199 2,589
Total Diabetes-Related 7.5% 6.1% 6.8% 2,090 1,766 3,856
1,418 1,420 1,327 1,271 1,127 1,216 1,084 995 1,024 1,124 1,098 1,149 1,214 1,404 1,267
3,020 2,843
2,660 2,652 2,681
2,683 2,637
2,531 2,657 2,532
2,359 2,299 2,378
2,567 2,589
0
1,000
2,000
3,000
4,000
5,000
2002 2003 2004 2005 2006 2007 2008 2009 2010 2011 2012 2013 2014 2015 2016
Dia
be
tes
De
ath
s
Year
Underlying Cause Contributing Cause Only
Note: The ICD-10 codes used for diabetes deaths were E10-E14.
1. Proportions are out of total deaths due to all causes.
Note: The ICD-10 codes used for diabetes deaths were E10-E14.

43
Table 17. Diabetes Deaths by Race and Hispanic Ethnicity, Massachusetts: 2016
Race/Hispanic Ethnicity
Cause of Death
White non-Hispanic
Black non-Hispanic
Hispanic Asian non-Hispanic
Total
Number
Underlying 1,012 132 79 24 1,267 Contributing/Associated 2,185 181 134 53 2,589 Total Diabetes-Related 3,197 313 213 77 3,856 Total Deaths (All Causes) 50,654 2,504 2,126 1,028 56,953
Proportion of all deaths (%)
Underlying 2.0 5.3 3.7 2.3 2.2 Contributing/Associated 4.3 7.2 6.3 5.2 4.5 Total Diabetes-Related 6.3 12.5 10.0 7.5 6.8
Death Rates1
Underlying 13.7 32.9 21.8 8.4 14.9 Contributing/Associated 29.3 46.5 35.8 17.7 30.3 Total Diabetes-Related 43.0 79.4 57.6 26.1 45.2
Figure 15. Age Distribution of Diabetes Deaths, Massachusetts: 2016
30 85
169 299 317 367
39 127
315
542
731
835
0
200
400
600
800
1,000
1,200
15-44 45- 54 55-64 65- 74 75-84 85+
Dia
be
tes
De
ath
s
Age Groups (years)
Underlying Contributing
Note: The ICD-10 codes used for diabetes deaths were E10-E14.
1. Rates are per 100,000 age-adjusted to the 2000 U.S. standard population
Note: The ICD-10 codes used for diabetes deaths were E10-E14.
44
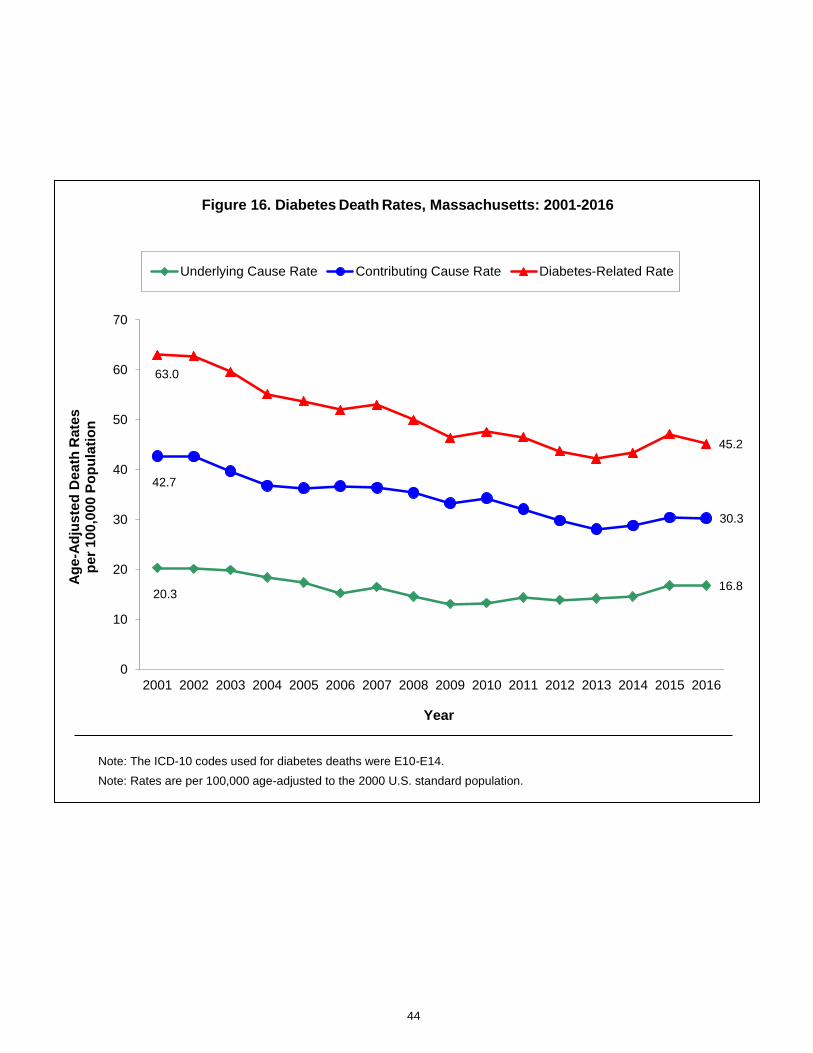
Figure 16. Diabetes Death Rates, Massachusetts: 2001-2016
20.3 16.8
42.7
30.3
63.0
45.2
0
10
20
30
40
50
60
70
2001 2002 2003 2004 2005 2006 2007 2008 2009 2010 2011 2012 2013 2014 2015 2016
Ag
e-A
dju
ste
d D
ea
th R
ate
s
pe
r 1
00
,00
0 P
op
ula
tio
n
Year
Underlying Cause Rate Contributing Cause Rate Diabetes-Related Rate
Note: The ICD-10 codes used for diabetes deaths were E10-E14.
Note: Rates are per 100,000 age-adjusted to the 2000 U.S. standard population.
45
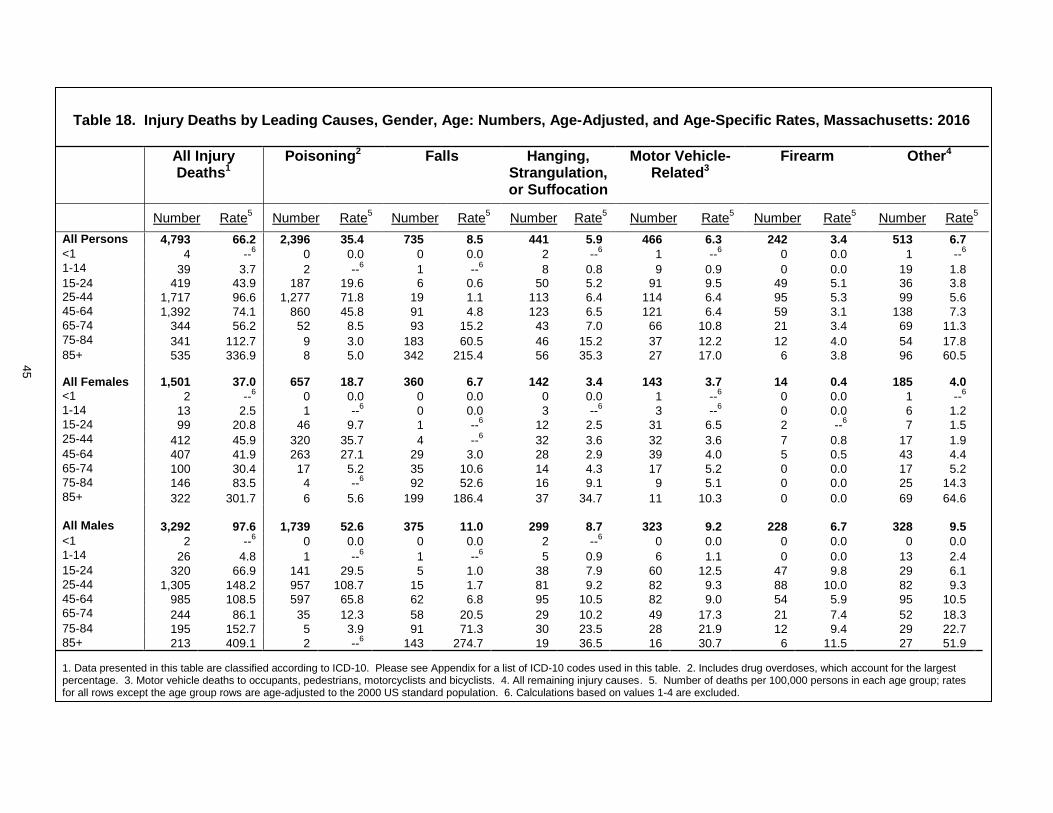
Table 18. Injury Deaths by Leading Causes, Gender, Age: Numbers, Age-Adjusted, and Age-Specific Rates, Massachusetts: 2016
All Injury Deaths1
Poisoning2 Falls Hanging, Strangulation, or Suffocation
Motor Vehicle-Related3
Firearm Other4
Number Rate5 Number Rate
5 Number Rate
5 Number Rate
5 Number Rate
5 Number Rate
5 Number Rate
5
All Persons 4,793 66.2 2,396 35.4 735 8.5 441 5.9 466 6.3 242 3.4 513 6.7
<1 4 --6 0 0.0 0 0.0 2 --
6 1 --
6 0 0.0 1 --
6
1-14 39 3.7 2 --6 1 --
6 8 0.8 9 0.9 0 0.0 19 1.8
15-24 419 43.9 187 19.6 6 0.6 50 5.2 91 9.5 49 5.1 36 3.8 25-44 1,717 96.6 1,277 71.8 19 1.1 113 6.4 114 6.4 95 5.3 99 5.6 45-64 1,392 74.1 860 45.8 91 4.8 123 6.5 121 6.4 59 3.1 138 7.3 65-74 344 56.2 52 8.5 93 15.2 43 7.0 66 10.8 21 3.4 69 11.3 75-84 341 112.7 9 3.0 183 60.5 46 15.2 37 12.2 12 4.0 54 17.8 85+ 535 336.9 8 5.0 342 215.4 56 35.3 27 17.0 6 3.8 96 60.5
All Females 1,501 37.0 657 18.7 360 6.7 142 3.4 143 3.7 14 0.4 185 4.0
<1 2 --6 0 0.0 0 0.0 0 0.0 1 --
6 0 0.0 1 --
6
1-14 13 2.5 1 --6 0 0.0 3 --
6 3 --
6 0 0.0 6 1.2
15-24 99 20.8 46 9.7 1 --6 12 2.5 31 6.5 2 --
6 7 1.5
25-44 412 45.9 320 35.7 4 --6 32 3.6 32 3.6 7 0.8 17 1.9
45-64 407 41.9 263 27.1 29 3.0 28 2.9 39 4.0 5 0.5 43 4.4 65-74 100 30.4 17 5.2 35 10.6 14 4.3 17 5.2 0 0.0 17 5.2 75-84 146 83.5 4 --
6 92 52.6 16 9.1 9 5.1 0 0.0 25 14.3
85+ 322 301.7 6 5.6 199 186.4 37 34.7 11 10.3 0 0.0 69 64.6 All Males 3,292 97.6 1,739 52.6 375 11.0 299 8.7 323 9.2 228 6.7 328 9.5
<1 2 --6 0 0.0 0 0.0 2 --
6 0 0.0 0 0.0 0 0.0
1-14 26 4.8 1 --6 1 --
6 5 0.9 6 1.1 0 0.0 13 2.4
15-24 320 66.9 141 29.5 5 1.0 38 7.9 60 12.5 47 9.8 29 6.1 25-44 1,305 148.2 957 108.7 15 1.7 81 9.2 82 9.3 88 10.0 82 9.3 45-64 985 108.5 597 65.8 62 6.8 95 10.5 82 9.0 54 5.9 95 10.5 65-74 244 86.1 35 12.3 58 20.5 29 10.2 49 17.3 21 7.4 52 18.3 75-84 195 152.7 5 3.9 91 71.3 30 23.5 28 21.9 12 9.4 29 22.7 85+ 213 409.1 2 --
6 143 274.7 19 36.5 16 30.7 6 11.5 27 51.9
1. Data presented in this table are classified according to ICD-10. Please see Appendix for a list of ICD-10 codes used in this table. 2. Includes drug overdoses, which account for the largest percentage. 3. Motor vehicle deaths to occupants, pedestrians, motorcyclists and bicyclists. 4. All remaining injury causes. 5. Number of deaths per 100,000 persons in each age group; rates for all rows except the age group rows are age-adjusted to the 2000 US standard population. 6. Calculations based on values 1-4 are excluded.
45

46
Table 19. Injury Deaths by Leading Causes, Gender and Race and Hispanic Ethnicity: Numbers and Age Adjusted Rates, Massachusetts: 2016
All Injury
Deaths1 Poisoning2 Falls Hanging,
Strangulation, or Suffocation
Motor Vehicle-Related3
Firearm Other4
Number Rate
5 Number Rate
5 Number Rate
5 Number Rate
5 Number Rate
5 Number Rate
5 Number Rate
5
White non-Hispanic 3,903 71.0 1,968 40.4 667 8.8 352 6.2 359 6.3 150 2.7 407 6.6
Females 1,277 40.7 562 22.1 332 7.0 109 3.4 105 3.6 10 0.4 159 4.2 Males 2,626 103.3 1,406 59.2 335 11.3 243 9.2 254 9.3 140 5.3 248 9.1 Black non-Hispanic 262 52.0 95 18.3 20 5.0 20 4.2 36 6.9 49 9.0 42 8.7
Females 78 30.4 34 13.0 9 3.8 7 2.8 15 5.7 1 --6 12 4.7
Males 184 75.5 61 24.2 11 6.6 13 5.8 21 7.9 48 18.0 30 12.8 Asian non-Hispanic 86 21.1 22 4.0 16 5.4 23 5.5 12 3.0 1 --
6 12 3.0
Females 23 11.1 4 --6 4 --
6 8 3.0 5 2.4 0 0.0 2 --
6
Males 63 32.6 18 6.7 12 8.4 15 8.4 7 3.8 1 --6 10 4.9
Hispanic 451 63.8 274 36.9 22 5.2 31 5.3 47 6.2 35 4.0 42 6.3
Females 99 29.5 49 12.5 11 4.8 12 4.4 15 4.0 3 --6 9 3.1
Males 352 99.4 225 62.8 11 5.5 19 6.0 32 8.4 32 7.3 33 9.3 1. Data presented in this table are classified according to ICD-10. Please see Appendix for a list of ICD-10 codes used in this table. 2. Includes drug overdoses, which account for the largest percentage. 3. Motor vehicle deaths to occupants, pedestrians, motorcyclists and bicyclists. 4. All remaining injury causes. 5. Number of deaths per 100,000 persons in each group; rates are age-adjusted to the 2000 US standard population. 6. Calculations based on values 1-4 are excluded.
46
47
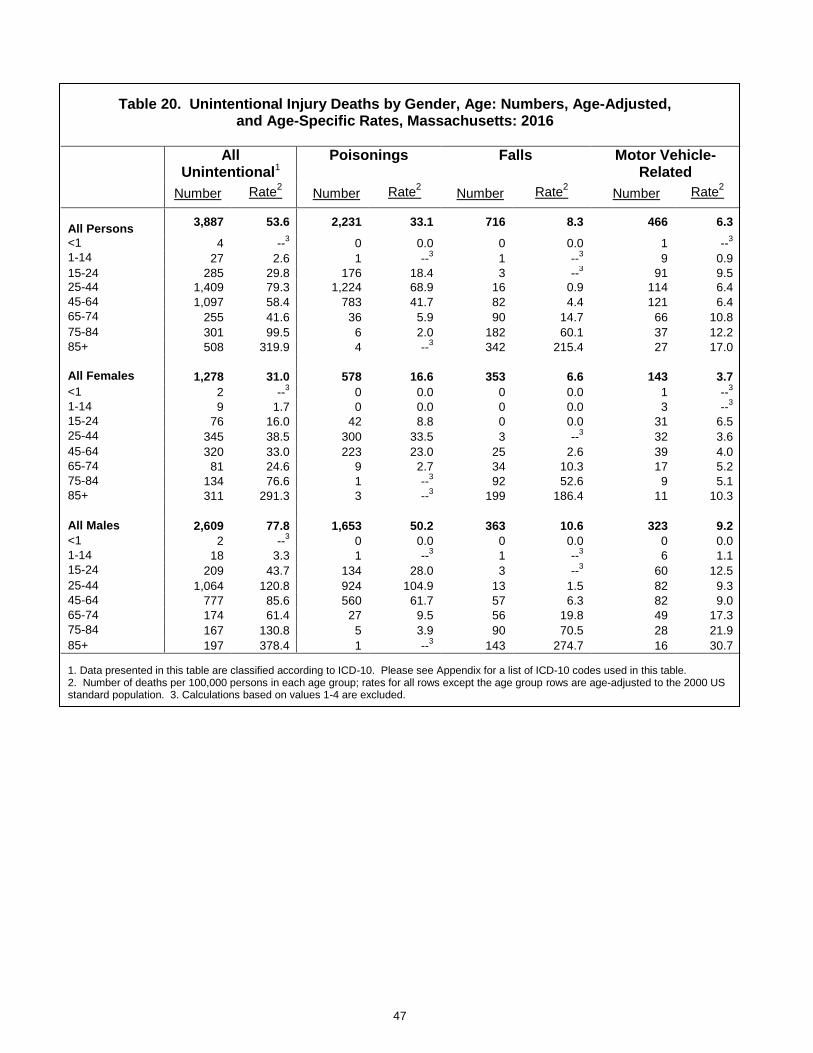
Table 20. Unintentional Injury Deaths by Gender, Age: Numbers, Age-Adjusted, and Age-Specific Rates, Massachusetts: 2016
All
Unintentional1 Poisonings Falls
Motor Vehicle-
Related Number Rate
2 Number Rate
2 Number Rate
2 Number Rate
2
All Persons
3,887 53.6 2,231 33.1 716 8.3 466 6.3
<1 4 --3 0 0.0 0 0.0 1 --
3
1-14 27 2.6 1 --3 1 --
3 9 0.9
15-24 285 29.8 176 18.4 3 --3 91 9.5
25-44 1,409 79.3 1,224 68.9 16 0.9 114 6.4
45-64 1,097 58.4 783 41.7 82 4.4 121 6.4
65-74 255 41.6 36 5.9 90 14.7 66 10.8
75-84 301 99.5 6 2.0 182 60.1 37 12.2
85+ 508 319.9 4 --3 342 215.4 27 17.0
All Females 1,278 31.0 578 16.6 353 6.6 143 3.7
<1 2 --3 0 0.0 0 0.0 1 --
3
1-14 9 1.7 0 0.0 0 0.0 3 --3
15-24 76 16.0 42 8.8 0 0.0 31 6.5
25-44 345 38.5 300 33.5 3 --3 32 3.6
45-64 320 33.0 223 23.0 25 2.6 39 4.0
65-74 81 24.6 9 2.7 34 10.3 17 5.2
75-84 134 76.6 1 --3 92 52.6 9 5.1
85+ 311 291.3 3 --3 199 186.4 11 10.3
All Males 2,609 77.8 1,653 50.2 363 10.6 323 9.2
<1 2 --3 0 0.0 0 0.0 0 0.0
1-14 18 3.3 1 --3 1 --
3 6 1.1
15-24 209 43.7 134 28.0 3 --3 60 12.5
25-44 1,064 120.8 924 104.9 13 1.5 82 9.3
45-64 777 85.6 560 61.7 57 6.3 82 9.0
65-74 174 61.4 27 9.5 56 19.8 49 17.3
75-84 167 130.8 5 3.9 90 70.5 28 21.9
85+ 197 378.4 1 --3 143 274.7 16 30.7
1. Data presented in this table are classified according to ICD-10. Please see Appendix for a list of ICD-10 codes used in this table. 2. Number of deaths per 100,000 persons in each age group; rates for all rows except the age group rows are age-adjusted to the 2000 US standard population. 3. Calculations based on values 1-4 are excluded.

48
Table 21. Unintentional Injury Deaths by Gender and Race and Hispanic Ethnicity: Numbers and Age-Adjusted Rates, Massachusetts: 2016
All
Unintentional1 Poisonings Falls
Motor Vehicle-
Related Number Rate
2 Number Rate
2 Number Rate
2 Number Rate
2
White non-Hispanic
3,217 58.3 1,816 37.7 657 8.6 359 6.3
Females 1,094 34.2 489 19.7 329 6.9 105 3.6 Males 2,123 83.9 1,327 56.2 328 11.1 254 9.3 Black non-Hispanic 174 35.5 89 17.1 17 4.4 36 6.9
Females 70 27.3 33 12.6 7 3.1 15 5.7 Males 104 44.7 56 22.1 10 6.3 21 7.9 Asian non-Hispanic 58 14.8 19 3.4 14 4.8 12 3.0
Females 12 6.5 2 --3 4 --
3 5 2.4
Males 46 24.2 17 6.3 10 7.2 7 3.8 Hispanic 370 53.7 271 36.6 19 4.8 47 6.2
Females 82 25.3 47 12.0 10 4.5 15 4.0 Males 288 83.1 224 62.5 9 5.0 32 8.4
1. Data presented in this table are classified according to ICD-10. Please see Appendix for a list of ICD-10 codes used in this table. 2. Number of deaths per 100,000 persons in each group; rates are age-adjusted to the 2000 US standard population. 3. Calculations based on values 1-4 are excluded.
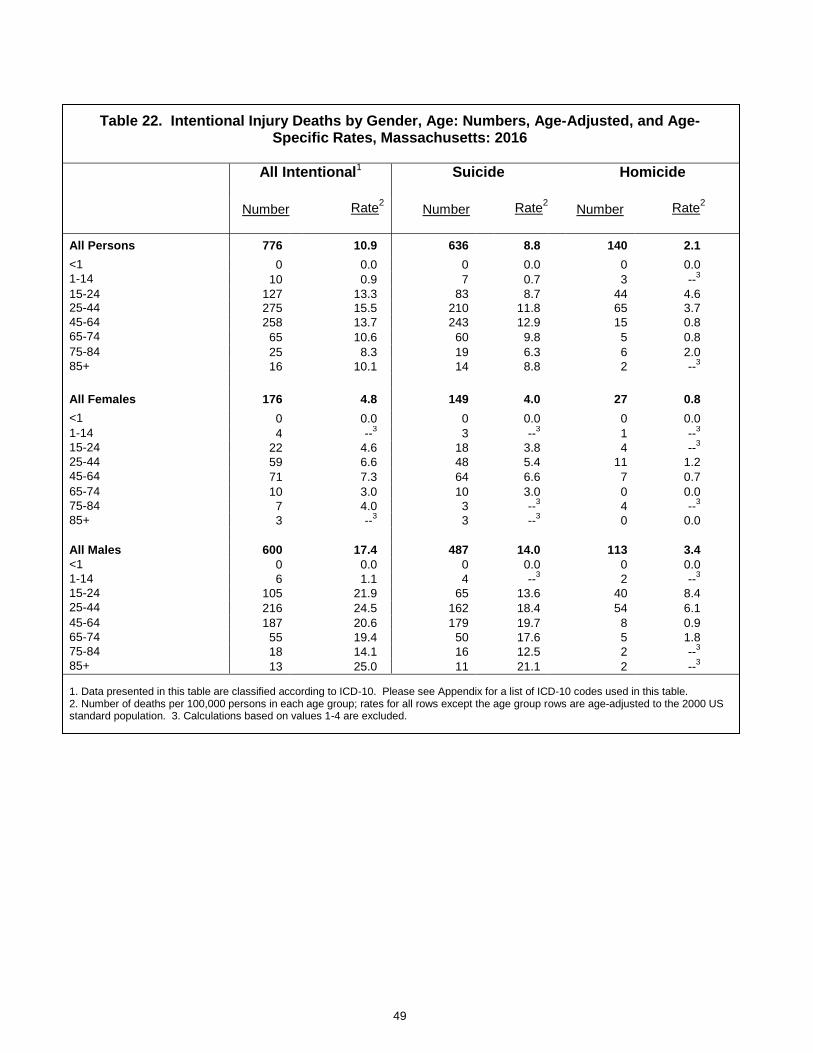
49
Table 22. Intentional Injury Deaths by Gender, Age: Numbers, Age-Adjusted, and Age-
Specific Rates, Massachusetts: 2016
All Intentional1 Suicide Homicide
Number Rate2 Number Rate
2 Number Rate
2
All Persons 776 10.9 636 8.8 140 2.1
<1 0 0.0 0 0.0 0 0.0
1-14 10 0.9 7 0.7 3 --3
15-24 127 13.3 83 8.7 44 4.6 25-44 275 15.5 210 11.8 65 3.7
45-64 258 13.7 243 12.9 15 0.8
65-74 65 10.6 60 9.8 5 0.8
75-84 25 8.3 19 6.3 6 2.0
85+ 16 10.1 14 8.8 2 --3
All Females 176 4.8 149 4.0 27 0.8
<1 0 0.0 0 0.0 0 0.0
1-14 4 --3 3 --
3 1 --
3
15-24 22 4.6 18 3.8 4 --3
25-44 59 6.6 48 5.4 11 1.2
45-64 71 7.3 64 6.6 7 0.7
65-74 10 3.0 10 3.0 0 0.0
75-84 7 4.0 3 --3 4 --
3
85+ 3 --3 3 --
3 0 0.0
All Males 600 17.4 487 14.0 113 3.4
<1 0 0.0 0 0.0 0 0.0
1-14 6 1.1 4 --3 2 --
3
15-24 105 21.9 65 13.6 40 8.4
25-44 216 24.5 162 18.4 54 6.1
45-64 187 20.6 179 19.7 8 0.9
65-74 55 19.4 50 17.6 5 1.8
75-84 18 14.1 16 12.5 2 --3
85+ 13 25.0 11 21.1 2 --3
1. Data presented in this table are classified according to ICD-10. Please see Appendix for a list of ICD-10 codes used in this table. 2. Number of deaths per 100,000 persons in each age group; rates for all rows except the age group rows are age-adjusted to the 2000 US standard population. 3. Calculations based on values 1-4 are excluded.
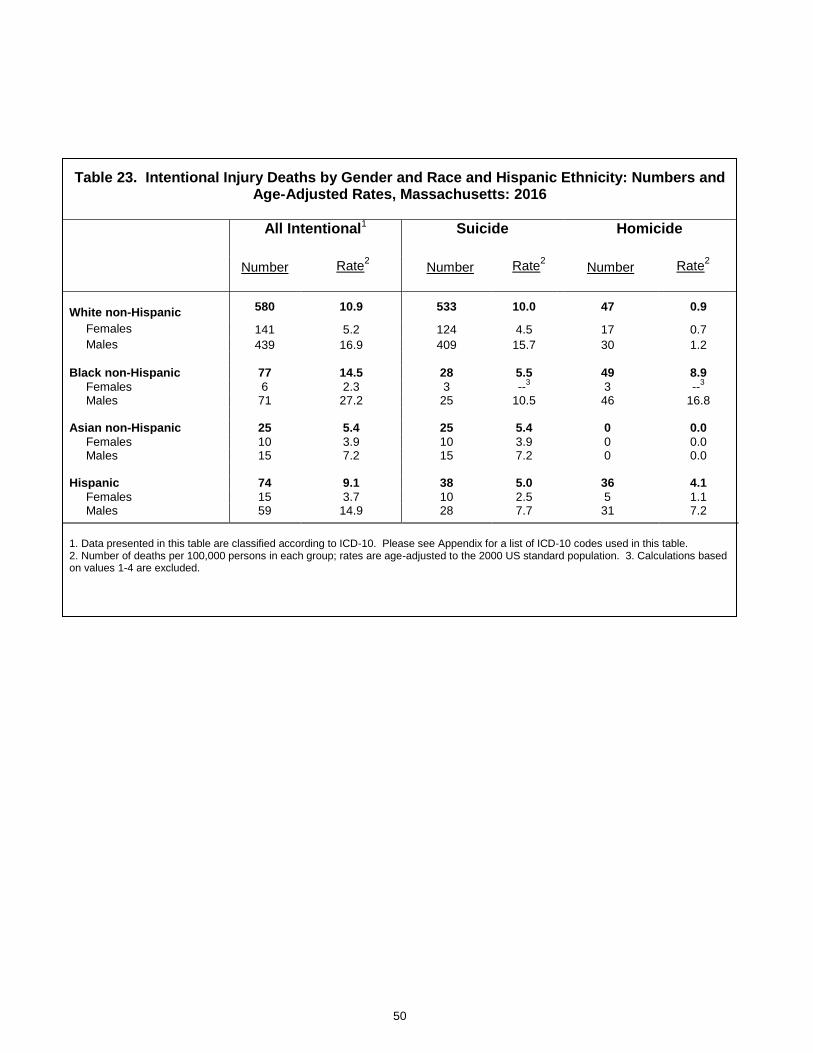
50
Table 23. Intentional Injury Deaths by Gender and Race and Hispanic Ethnicity: Numbers and Age-Adjusted Rates, Massachusetts: 2016
All Intentional1 Suicide Homicide
Number Rate2 Number Rate
2 Number Rate
2
White non-Hispanic
580 10.9 533 10.0 47 0.9
Females 141 5.2 124 4.5 17 0.7
Males 439 16.9 409 15.7 30 1.2
Black non-Hispanic 77 14.5 28 5.5 49 8.9
Females 6 2.3 3 --3 3 --
3 Males 71 27.2 25 10.5 46 16.8 Asian non-Hispanic 25 5.4 25 5.4 0 0.0
Females 10 3.9 10 3.9 0 0.0 Males 15 7.2 15 7.2 0 0.0 Hispanic 74 9.1 38 5.0 36 4.1
Females 15 3.7 10 2.5 5 1.1 Males 59 14.9 28 7.7 31 7.2
1. Data presented in this table are classified according to ICD-10. Please see Appendix for a list of ICD-10 codes used in this table. 2. Number of deaths per 100,000 persons in each group; rates are age-adjusted to the 2000 US standard population. 3. Calculations based on values 1-4 are excluded.

51
Table 24. Injury Deaths by Intent, Method and Gender: Numbers and Age-Adjusted Rates, Massachusetts: 2016
Type of Injury1 All Injury Deaths Female Male
Number Rate2 Number Rate
2 Number Rate
2
Unintentional Injuries (Accidents) 3,887 53.6 1,278 31.0 2,609 77.8
Motor vehicle-related 466 6.3 143 3.7 323 9.2 Injury to pedestrian 107 1.4 37 0.9 70 2 Injury to pedal cyclist 12 0.1 2 --
3 10 0.2
Injury to motorcyclist 43 0.6 6 0.2 37 1.1 Injury to occupant 53 0.8 8 0.2 45 1.3 Other and unspecified 251 3.4 90 2.4 161 4.6
Poisoning 2231 33.1 578 16.6 1653 50.2 Falls 716 8.3 353 6.6 363 10.6 Hanging, strangulation or suffocation 156 1.9 76 1.5 80 2.3 Cut or pierce 1 --
3 0 0.0 1 --
3
Firearm 1 --3 0 0.0 1 --
3
Drowning and submersion 63 0.9 8 0.2 55 1.6 Smoke, fire and flames 41 0.5 22 0.5 19 0.5
Other and unspecified 197 2.4 97 1.8 100 2.9
Suicide 636 8.8 149 4.0 487 14.0
Poisoning 132 1.8 62 1.6 70 2.0 Hanging, strangulation or suffocation 281 4.0 62 1.8 219 6.4 Firearm 141 1.9 7 0.2 134 3.8 Other and unspecified 82 1.1 18 0.4 64 1.8
Homicide 140 2.1 27 0.8 113 3.4
Firearm 88 1.3 7 0.2 81 2.4 Cut or pierce 24 0.4 10 0.3 14 0.4
Other and unspecified 28 0.4 10 0.3 18 0.5
Injury Deaths of Undetermined Intent 69 1.0 23 0.6 46 1.3
Poisoning 32 0.4 17 0.4 15 0.4 Other and unspecified
37 0.5 6 0.2 31 0.9
Legal Intervention 12 0.2 0.0 0.0 12 0.4
Firearm 11 0.2 0 0.0 11 0.3 Other and unspecified 1 --
3 0 0.0 1 --
3
Adverse Effects 49 0.6 24 0.5 25 0.7
Medical care 47 0.6 23 0.5 24 0.7 Drugs 2 --
3 1 --
3 1 --
3
ALL INJURIES 4,793 66.2 1,501 37.0 3,292 97.6
1. Data presented in this table are classified according to ICD-10. Please see Appendix for a list of ICD-10 codes used in this table. 2. Number of deaths per 100,000 persons; rates are adjusted to the 2000 US standard population. 3. Calculations based on values 1-4 are excluded.
51
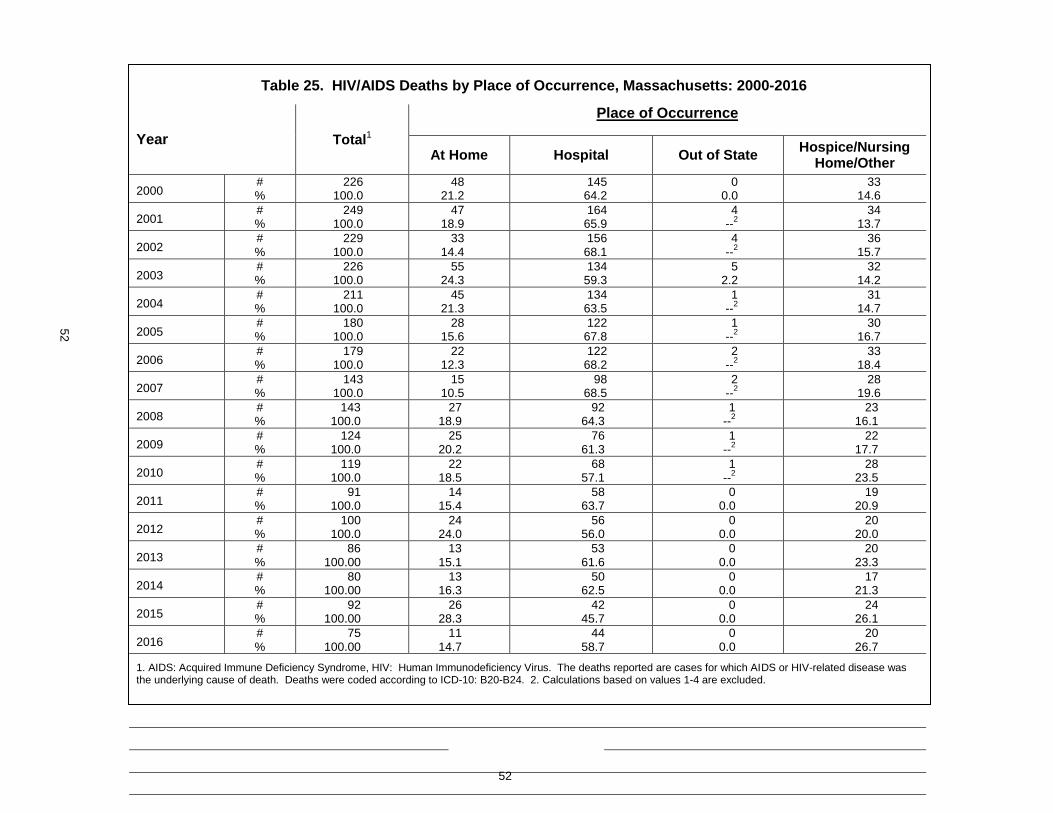
52
Table 25. HIV/AIDS Deaths by Place of Occurrence, Massachusetts: 2000-2016
Year Total1
Place of Occurrence
At Home Hospital Out of State Hospice/Nursing
Home/Other
2000 # %
226 100.0
48 21.2
145 64.2
0 0.0
33 14.6
2001 # %
249 100.0
47 18.9
164 65.9
4 --
2
34 13.7
2002 # %
229 100.0
33 14.4
156 68.1
4 --
2
36 15.7
2003 # %
226 100.0
55 24.3
134 59.3
5 2.2
32 14.2
2004 # %
211 100.0
45 21.3
134 63.5
1 --
2
31 14.7
2005 # %
180 100.0
28 15.6
122 67.8
1 --
2
30 16.7
2006 # %
179 100.0
22 12.3
122 68.2
2 --
2
33 18.4
2007 # %
143 100.0
15 10.5
98 68.5
2 --
2
28 19.6
2008 # %
143 100.0
27 18.9
92 64.3
1 --
2
23 16.1
2009 # %
124 100.0
25 20.2
76 61.3
1 --
2
22 17.7
2010 # %
119 100.0
22 18.5
68 57.1
1 --
2
28 23.5
2011 # %
91 100.0
14 15.4
58 63.7
0 0.0
19 20.9
2012 # %
100 100.0
24 24.0
56 56.0
0 0.0
20 20.0
2013 # %
86 100.00
13 15.1
53 61.6
0 0.0
20 23.3
2014 # %
80 100.00
13 16.3
50 62.5
0 0.0
17 21.3
2015 # %
92 100.00
26 28.3
42 45.7
0 0.0
24 26.1
2016 # %
75 100.00
11 14.7
44 58.7
0 0.0
20 26.7
1. AIDS: Acquired Immune Deficiency Syndrome, HIV: Human Immunodeficiency Virus. The deaths reported are cases for which AIDS or HIV-related disease was the underlying cause of death. Deaths were coded according to ICD-10: B20-B24. 2. Calculations based on values 1-4 are excluded.
52

53
Table 26. HIV/AIDS1 Deaths by Age, Massachusetts: 2000-2016
Year Age (in years)
<15 15-24 25-34 35-44 45+
2000 # %
4 --
2
0 0.0
26 11.5
104 46.0
92 40.7
2001 # %
1 --
2
2 --
2
25 10.0
111 44.6
110 44.2
2002 # %
1 --
2
1 --
2
10 4.4
91 39.7
126 55.0
2003 # %
1 --
2
3 --
2
14 6.2
94 41.6
114 50.4
2004 # %
0 0.0
2 --
2
9 4.3
79 37.4
121 57.4
2005 # %
0 0.0
1 --
2
6 3.3
64 35.6
109 60.6
2006 # %
0 0.0
1 --
2
6 3.4
71 39.7
101 56.4
2007 # %
0 0.0
0 0.0
5 3.5
34 32.7
104 72.7
2008 # %
0 0.0
1 --
2
6 4.2
32 22.4
104 72.7
2009 # %
0 0.0
0 0.0
6 4.8
25 20.2
93 75.0
2010 # %
0 0.0
1 --
2
4 --
2
24 20.2
90 75.6
2011 # %
0 0.0
2 --
2
1 --
2
19 20.9
69 75.8
2012 # %
0 0.0
0 0.0
2 --
2
16 16.0
82 82.0
2013 # %
0 0.0
2 --
2
3 --
2
3 --
2
78 90.7
2014 # %
0 0.0
1 --
2
6 7.5
9 11.3
64 80.0
2015 # %
0 0.0
0 0.0
4 --
2
7 7.6
81 88.0
2016 # %
0 0.0
0 0.0
2 --
2
5 6.7
68 90.7
1. AIDS: Acquired Immune Deficiency Syndrome, HIV: Human Immunodeficiency Virus. The deaths reported are cases for which AIDS or HIV-related disease was the underlying cause of death. Deaths were coded according to ICD-10: B20-B24. 2. Calculations based on values 1-4 are excluded.
53

54
Table 27. HIV/AIDS1 Deaths by Gender, Race and Hispanic Ethnicity, Massachusetts: 2000-2016
Year
Gender
Race and Ethnicity
Male Female White non-Hispanic
2 Black
non-Hispanic2 Other
3 Hispanic2
2000 # %
161 71.2
65 28.8
104 46.0
61 27.0
2 --
4
59 26.1
2001 # %
182 73.1
67 26.9
125 50.2
73 29.3
0 0.0
51 20.5
2002 # %
163 71.2
66 28.8
108 47.1
68 29.7
1 --
4
52 22.7
2003 # %
150 66.4
76 33.6
113 50.0
58 25.7
2 --
4
53 23.5
2004 # %
151 71.6
60 28.4
976 46.0
55 26.1
4 --
4
55 26.1
2005 # %
122 67.8
58 32.2
75 41.7
56 31.1
4 --
4
45 25.0
2006 # %
122 68.2
57 31.8
91 50.8
49 27.4
2 --
4
37 20.7
2007 # %
96 67.4
47 32.9
58 40.6
48 33.6
0 0.0
37 25.9
2008 # %
101 70.6
42 29.4
69 48.6
37 26.1
5 3.5
31 21.8
2009 # %
89 71.8
35 28.2
48 38.7
37 29.8
6 4.8
33 26.6
2010 # %
80 67.2
39 32.8
58 48.7
34 28.6
1 --
4
26 21.8
2011 # %
64 70.3
27 29.7
36 39.6
30 33.0
1 --
4
24 26.4
2012 # %
62 62.0
38 38.0
50 50.0
26 26.0
1 --
4
23 23.0
2013 # %
58 67.4
28 32.6
35 41.2
32 37.6
0 0.0
18 21.2
2014 # %
59 73.8
21 26.3
41 51.3
21 26.3
1 --
4
16 20.0
2015 #
% 74
80.4 18
19.6 41
44.6 28
30.4 2
--4
21 22.8
2016 #
% 49
65.3 26
34.7 36
48.0 23
30.7 5
6.7 11
14.7
1. AIDS: Acquired Immune Deficiency Syndrome, HIV: Human Immunodeficiency Virus. The deaths reported are cases for which AIDS or HIV-related disease was the underlying cause of death. Deaths were coded according to ICD-10: B20-B24. 2. Race and ethnicity data in this table are presented as mutually exclusive categories. Persons of Hispanic ethnicity are not included in a race category. Please see Technical Notes in the Appendix for a more detailed explanation. 3. The “Other” category represents Asian non-Hispanics, American Indian non-Hispanics, and other non-Hispanics. 4. Calculations based on values 1-4 are excluded.
54

55
Table 28. HIV/AIDS1 Deaths by Gender, Race and Hispanic Ethnicity: Numbers, Percent and Age-Adjusted Rates, Massachusetts: 2003-2016
White non-Hispanic2
Black non-Hispanic2
Hispanic2
Year # Percent Rate3 # Percent Rate3 # Percent Rate3 2003 113 50% 2.0 58 26% 17.2 53 23% 14.9 2004 97 46% 1.7 55 26% 15.8 55 26% 13.9 2005 75 42% 1.3 56 31% 16.0 45 25% 11.5 2006 91 51% 1.6 49 27% 13.7 37 21% 8.4 2007 58 41% 1.0 48 34% 13.0 37 26% 8.9 2008 69 50% 1.2 37 27% 10.6 31 23% 8.3 2009 48 41% 0.5 37 31% 15.2 33 28% 11.6 2010 58 49% 0.5 34 29% 15.2 26 22% 11.6 2011 36 40% 0.6 30 33% 6.9 24 27% 4.7 2012 50 51% 0.8 26 26% 6.1 23 23% 4.6 2013 35 41% 0.5 32 38% 6.7 18 21% 3.2 2014 41 51% 0.6 21 26% 4.4 16 20% 3.2 2015 41 46% 0.6 28 31% 5.9 21 23% 3.6 2016 36 51% 0.5 23 33% 4.7 11 16% 1.8
MALE
2003 74 49% 2.7 36 24% 23.4 39 26% 23.8 2004 74 49% 2.7 39 26% 24.0 34 23% 18.4
2005 52 43% 1.9 34 28% 20.9 33 27% 18.4
2006 67 55% 2.4 33 27% 20.0 21 17% 9.8 2007 48 50% 1.7 23 24% 13.4 25 26% 13.3
2008 55 56% 1.9 25 26% 16.0 18 18% 11.0
2009 32 38% 1.1 29 34% 15.6 24 28% 12.4 2010 40 51% 1.1 20 25% 15.6 19 24% 12.4 2011 30 48% 1.1 14 22% 6.6 19 30% 8.2 2012 35 57% 1.2 14 23% 7.8 12 20% 5.6 2013 24 69% 0.7 21 21% 9.8 12 12% 4.3 2014 34 59% 1.0 14 24% 6.5 10 17% 4.7 2015 33 45% 1.0 23 32% 10.3 17 23% 6.4 2016 28 61% 0.9 12 26% 5.7 6 13% 2.2
FEMALE
2003 39 51% 1.4 22 29% 12.0 14 18% 7.1
2004 23 38% 0.8 16 27% 8.7 21 35% 10.0 2005 23 40% 0.8 22 38% 11.8 12 21% 5.4
2006 24 42% 0.9 16 28% 8.3 16 28% 7.1
2007 10 21% 0.3 25 53% 12.8 12 26% 5.2
2008 14 36% 0.5 12 31% 6.4 13 33% 6.4
2009 16 48% 0.5 8 24% 3.8 9 27% 3.8 2010 18 46% 0.5 14 36% 3.8 7 18% 3.8
2011 6 22% 0.2 16 59% 7.1 5 19% 1.6 2012 15 39% 0.4 12 32% 4.9 11 29% 3.9
2013 11 11% 0.3 11 11% 4.4 6 6% 2.1 2014 7 35% 0.2 7 35% 2.7 6 30% 2.0
2015 8 47% 0.3 5 29% 2.1 4 --4 --
4 2016 8 33% 0.2 11 46% 4.0 5 21% 1.5
1. AIDS and HIV disease deaths coded using ICD-10: B20-B24. 2. Race and ethnicity data in this table are presented as mutually exclusive categories. Persons of Hispanic ethnicity are not included in a race category. Please see Technical Notes in the Appendix for a more detailed explanation. 3. Number of deaths per 100,000 persons; rates are age-adjusted to the 2000 US standard population. 4. Calculations based on values 1-4 are excluded

56
Table 29. HIV/AIDS1 Deaths by Race, Hispanic Ethnicity, and Gender of Persons Ages 25-44, Massachusetts: 2003-2016
White non-Hispanic2 Black non-Hispanic2 Hispanic2
Year # Rate3
#
Rate3 #
Rate
3
2003 63 4.1 19 15.8 25 15.1
2004 38 2.6 17 14.0 31 18.0
2005 29 2.0 22 18.2 19 10.7
2006 35 2.5 17 14.2 23 12.9
2007 16 1.2 11 9.1 12 6.6
2008 19 1.4 9 7.4 8 4.3
2009 11 0.8 7 5.7 12 6.3
2010 9 0.7 6 4.7 12 6.1
2011 6 0.5 7 5.4 7 3.4
2012 6 0.5 3 --4 9 4.4
2013 1 --4 3 --
4 2 --
4
2014 1 --4 9 6.4 5 2.2
2015 2 --4 6 4.2 3 --
4
2016 2 --4 2 --
4 2 --
4
MALE
2003 42 5.6 10 17.3 19 23.1 2004 30 4.1 11 18.9 19 22.1
2005 21 2.9 12 20.4 11 12.3
2006 22 3.2 12 20.5 12 13.3 2007 16 2.4 5 8.5 9 9.7
2008 13 2.0 3 --4 6 6.2
2009 8 1.2 4 --4 5 5.5
2010 3 --4 3 --
4 3 --
4
2011 4 --4 4 --
4 3 --
4
2012 5 0.8 1 --4 5 4.8
2013 1 --4 2 --
4 1 --
4
2014 1 --4 6 8.8 3 --
4
2015 1 --4 4 --
4 1 --
4
2016 1 --4 2 --
4 2 --
4
FEMALE
2003 21 2.7 9 14.4 6 7.2
2004 8 1.1 6 9.6 12 13.9
2005 8 1.1 10 16.0 8 9.0
2006 13 1.8 5 8.2 11 12.5
2007 0 0.0 6 9.8 3 --4
2008 6 0.9 6 9.8 2 --4
2009 3 --4 3 --
4 7 7.0
2010 6 0.9 3 --4 9 9.3
2011 2 --4 3 --
4 4 --
4
2012 1 --4 2 --
4 4 --
4
2013 0 0.0 1 --4 1 --
4
2014 0 0.0 3 --4 2 --
4
2015 1 --4 2 --
4 2 --
4
2016 1 --4 0 0.0 0 0.0
1. AIDS and HIV disease deaths coded using ICD-10: B20-B24. 2. Race and ethnicity data in this table are presented as mutually exclusive categories. Persons of Hispanic ethnicity are not included in a race category. Please see Technical Notes in the Appendix for a more detailed explanation. 3. Number of deaths per 100,000 residents in the specified population group. 4. Calculations based on values 1-4 are excluded.

57
Table 30. Trends in Infant, Neonatal, and Post Neonatal Mortality, by Race and Hispanic Ethnicity, Massachusetts: 2006-2016
INFANT MORTALITY (less than one year of age)
State Total1
White non-Hispanic
Black non-Hispanic Hispanic
Asian non-Hispanic Other
2
Year # Rate3 # Rate
3 # Rate
3 # Rate
3 # Rate
3 # Rate
3
2006 369 4.8 220 4.1 72 11.1 63 5.9 10 1.8 3 --4
2007 380 4.9 206 3.9 66 10.2 81 7.4 18 3.1 4 --4
2008 381 5.0 192 3.7 79 11.9 86 7.9 16 2.7 8 5.1
2009 366 4.9 205 4.1 54 7.8 78 7.1 20 3.4 9 7.8
2010 319 4.4 163 3.4 56 8.2 65 6.1 25 4.3 7 4.4
2011 310 4.2 158 3.4 47 6.7 75 5.8 22 3.6 6 4.2
2012 309 4.3 158 3.5 57 8.2 71 5.4 17 2.6 4 --4
2013 298 4.2 161 3.6 63 8.9 49 3.9 15 2.4 3 --4
2014 321 4.5 169 3.8 54 7.6 62 5.0 20 3.2 8 10.5
2015 310
4.3
146
3.3
59
8.3
75
5.7
15
2.3
14
21.8 2016 283 4.0 119 2.8 56 7.7 78 5.8 18 2.7 10 13.7
NEONATAL MORTALITY (birth to 27 days)
State Total
1
White non-Hispanic
Black non-Hispanic Hispanic
Asian, non-Hispanic Other
2
Year # Rate3 # Rate
3 # Rate
3 # Rate
3 # Rate
3 # Rate
3
2006 279 3.6 173 3.3 53 8.2 42 3.9 7 1.3 3 --4
2007 263 3.4 141 2.7 48 7.4 53 4.9 15 2.6 4 --4
2008 290 3.8 152 2.9 57 8.6 65 6.0 10 1.7 6 3.8
2009 276 3.7 162 3.2 36 5.2 54 4.9 17 2.9 7 6.0
2010 238 3.3 121 2.5 43 6.3 47 4.4 20 3.4 5 4.6
2011 230 3.1 111 2.4 33 4.7 60 4.7 19 3.1 3 --4
2012 216 3.0 111 2.5 41 5.9 46 3.5 13 2.0 3 --4
2013 221 3.1 119 2.6 45 6.3 39 3.1 10 1.6 0 0.0
2014 236 3.3 122 2.7 38 5.3 50 3.9 15 2.3 6 9.5
2015 237
3.3
106
2.4
45
6.4
59
4.5
15
2.3
11
17.1 2016 214 3.0 87 2.0 47 6.5 64 4.8 9 1.3 5 6.8
POST NEONATAL MORTALITY (28-365 days)
State Total1
White non-Hispanic
Black non-Hispanic Hispanic
Asian non-Hispanic Other
2
Year # Rate3 # Rate
3 # Rate
3 # Rate
3 # Rate
3 # Rate
3
2006 90 1.2 47 0.9 19 2.9 21 2.0 3 --4 0 0.0
2007 117 1.5 65 1.2 18 2.8 28 2.6 3 --4 0 0.0
2008 91 1.2 40 0.8 22 3.3 21 1.9 6 1.0 2 --4
2009 90 1.2 43 0.9 18 2.6 24 2.2 3 --4 2 --
4
2010 81 1.1 42 0.9 13 1.9 18 1.7 5 0.9 2 --4
2011 80 1.1 47 1.0 14 2.0 15 1.2 3 --4 3 --
4
2012 93 1.3 47 1.0 16 2.3 25 1.9 4 --4 1 --
4
2013 77 1.1 42 0.9 18 2.5 10 0.8 5 0.8 1 --4
2014 85 1.2 47 1.1 16 2.2 12 0.9 5 0.8 2 --4
2015 73
1.0
40
0.9
14
2.0
16
1.2
0
0.0
3
--4
2016 69 1.0 32 0.7 9 1.2 14 1.0 9 1.3 5 6.8
1. Deaths of infants of unknown race are included in the total calculation. For rate computations, births of infants of unknown race are allocated into the race categories according to the distribution of births of known race. 2. Other: American Indian and Other races. 3. Rates are expressed per 1,000 live births. 4. Calculations based on values 1-4 are excluded.

Table 31. Infant, Neonatal, and Post Neonatal Deaths by Cause, Massachusetts: 2016
Infant
(<1 year)
Neonatal (<28 days)
Post Neonatal (28-365 days)
Cause of Death1 ICD-10 Code # % # % # %
TOTAL 283 100.0 214 100.0 69 100.0
Infectious and parasitic diseases A00-B99 5 1.8 0 0.0 5 7.2 Cancer C00-C97 0 0.0 0 0.0 0 0.0 Diseases of the blood and blood forming organs (anemia) D50-D89 0 0.0 0 0.0 0 0.0 Diseases of nervous system and ear G00-G98, H60-H93 4 --
2 3 --
2 1 --
2
Diseases of the respiratory system J00-J98 7 2.5 1 --2 6 8.7
Diseases of digestive system K00-K92 2 --2 2 --
2 0 0.0
Congenital malformations Q00-Q99 50 17.7 34 15.9 16 23.2 Congenital malformations of nervous system Q00-Q07 11 3.9 7 3.3 4 --
2
Anencephalus and similar malformations Q00 4 --2 4 --
2 0 0.0
Congenital malformations of heart Q20-Q24 9 3.2 6 2.8 3 --2
Other congenital malformations of circulatory system Q25-Q28 5 1.8 2 --2 3 --
2
Congenital malformations of respiratory system Q30-Q34 9 3.2 7 3.3 2 --2
Congenital malformations of genitourinary system Q50-Q64 3 --2 3 --
2 0 0.0
Congenital malformations of musculoskeletal system Q65-Q85 3 --2 3 --
2 0 0.0
Chromosomal abnormalities Q90-Q99 7 2.5 6 2.8 1 --2
Certain conditions originating in the perinatal period P00-P96 180 63.6 170 79.4 10 14.5 Newborn affected by maternal conditions which may be unrelated to present pregnancy
P00 1 --2 1 --
2 0 0.0
Newborn affected by maternal complications of pregnancy P01 28 9.9 28 13.1 0 0.0 Newborn affected by complications of placenta, cord and membrane
P02 11 3.9 10 4.7 1 --2
Newborn affected by other complications of labor and delivery P03 2 --2 2 --
2 0 0.0
Disorders relating to short gestation and low birthweight P07 70 24.7 69 32.2 1 --2
Intrauterine hypoxia and birth asphyxia P20-P21 6 2.1 6 2.8 0 0.0 Respiratory distress of newborn P22 9 3.2 8 3.7 1 --
2
Other respiratory conditions of newborn P23-P28 13 4.6 10 4.7 3 --2
Infections specific to the perinatal period P35-P39 5 1.8 3 --2 2 --
2
Neonatal hemorrhage P50-P52, P54 4 --2 4 --
2 0 0.0
Other and ill-defined conditions originating in the perinatal period
P90-P96 5 1.8 5 2.3 0 0.0
Symptoms, signs, and ill-defined conditions R00-R99 26 9.2 2 --2 24 34.8
Sudden Infant Death Syndrome (SIDS) R95 14 4.9 0 0.0 14 20.3 Unintentional injuries V01-X59 4 --
2 1 --
2 3 --
2
Homicide X85-Y09 0 0.0 0 0.0 0 0.0 All other causes Residual 5 1.8 1 --
2 4 --
2
1. Please see Technical Notes in the Appendix for an explanation of ICD-10 codes. 2. Calculations based on values 1-4 are excluded.
58

59
Table 32. Infant Deaths by Major Causes, Race and Hispanic Ethnicity1, Massachusetts: 2016
White non-Hispanic
Black non-Hispanic
Asian non-Hispanic
Hispanic
Cause of Death1 ICD-10 Code
# % # % # % # %
TOTAL
119 100.0% 56 100.0% 18 100.0% 78 100.0%
Certain conditions originating in the perinatal period
P00- P96 76 63.9% 38 67.9% 11 61.1% 49 62.8%
Congenital malformations
Q00-Q99 22 18.5% 9 16.1% 1 --
2 16 20.5%
Symptoms, signs, and ill-defined conditions R00-R99 14 11.8% 4 --
2 2 --
2 5 6.4%
SIDS
R95 8 6.7% 2 --
2 1 --
2 3 --
2
Unintentional Injuries
V01-X59 1 --
2 2 --
2 0 0.0% 1 --
2
Homicide
X85-Y09 0 0.0% 0 0.0% 0 0.0% 0 0.0%
All other causes Residual 6 5.0% 3 --2 4 --
2 7 9.0%
1. Deaths are coded according to ICD-10. Please see Appendix for comparability ratios. 2. Calculations based on values 1-4 are excluded.
59
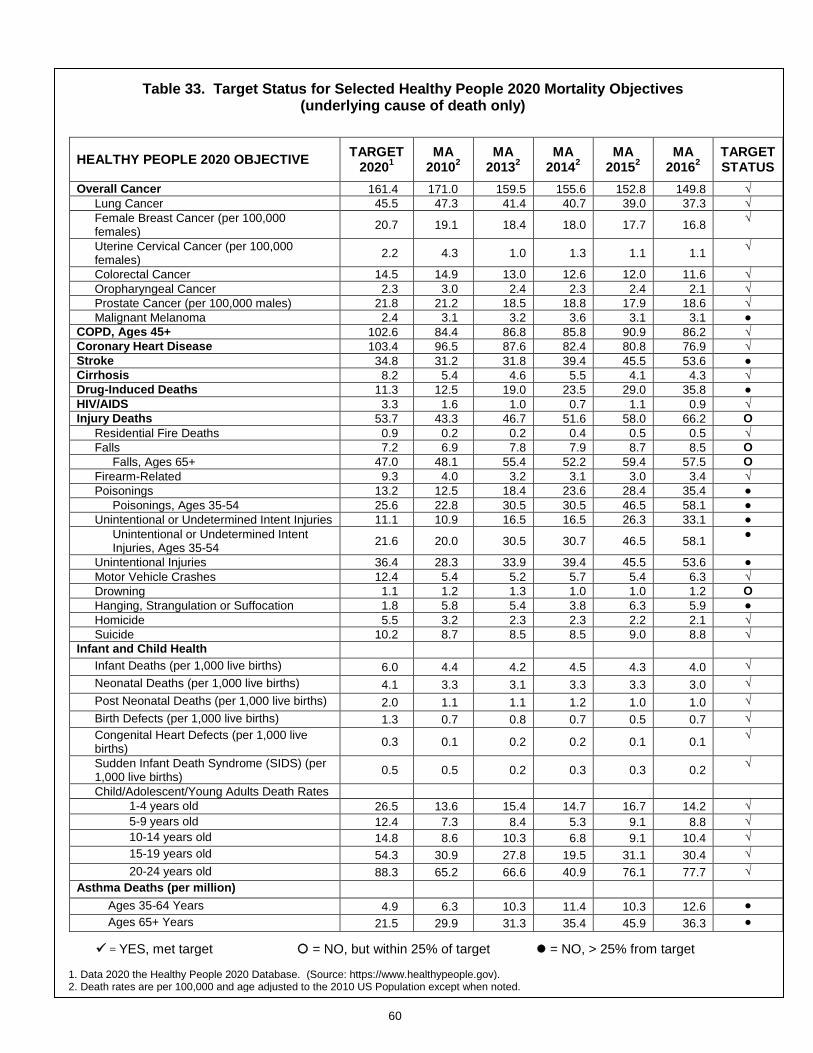
60
Table 33. Target Status for Selected Healthy People 2020 Mortality Objectives (underlying cause of death only)
HEALTHY PEOPLE 2020 OBJECTIVE TARGET
20201
MA 2010
2 MA
20132
MA 2014
2 MA
20152
MA 2016
2
TARGET STATUS
Overall Cancer 161.4 171.0 159.5 155.6 152.8 149.8 √
Lung Cancer 45.5 47.3 41.4 40.7 39.0 37.3 √
Female Breast Cancer (per 100,000 females)
20.7 19.1 18.4 18.0 17.7 16.8 √
Uterine Cervical Cancer (per 100,000 females)
2.2 4.3 1.0 1.3 1.1 1.1 √
Colorectal Cancer 14.5 14.9 13.0 12.6 12.0 11.6 √
Oropharyngeal Cancer 2.3 3.0 2.4 2.3 2.4 2.1 √
Prostate Cancer (per 100,000 males) 21.8 21.2 18.5 18.8 17.9 18.6 √
Malignant Melanoma 2.4 3.1 3.2 3.6 3.1 3.1 ●
COPD, Ages 45+ 102.6 84.4 86.8 85.8 90.9 86.2 √
Coronary Heart Disease 103.4 96.5 87.6 82.4 80.8 76.9 √
Stroke 34.8 31.2 31.8 39.4 45.5 53.6 ●
Cirrhosis 8.2 5.4 4.6 5.5 4.1 4.3 √
Drug-Induced Deaths 11.3 12.5 19.0 23.5 29.0 35.8 ●
HIV/AIDS 3.3 1.6 1.0 0.7 1.1 0.9 √
Injury Deaths 53.7 43.3 46.7 51.6 58.0 66.2 O
Residential Fire Deaths 0.9 0.2 0.2 0.4 0.5 0.5 √
Falls 7.2 6.9 7.8 7.9 8.7 8.5 O
Falls, Ages 65+ 47.0 48.1 55.4 52.2 59.4 57.5 O
Firearm-Related 9.3 4.0 3.2 3.1 3.0 3.4 √
Poisonings 13.2 12.5 18.4 23.6 28.4 35.4 ●
Poisonings, Ages 35-54 25.6 22.8 30.5 30.5 46.5 58.1 ●
Unintentional or Undetermined Intent Injuries 11.1 10.9 16.5 16.5 26.3 33.1 ●
Unintentional or Undetermined Intent Injuries, Ages 35-54
21.6 20.0 30.5 30.7 46.5 58.1 ●
Unintentional Injuries 36.4 28.3 33.9 39.4 45.5 53.6 ●
Motor Vehicle Crashes 12.4 5.4 5.2 5.7 5.4 6.3 √
Drowning 1.1 1.2 1.3 1.0 1.0 1.2 O
Hanging, Strangulation or Suffocation 1.8 5.8 5.4 3.8 6.3 5.9 ●
Homicide 5.5 3.2 2.3 2.3 2.2 2.1 √
Suicide 10.2 8.7 8.5 8.5 9.0 8.8 √
Infant and Child Health Infant Deaths (per 1,000 live births) 6.0 4.4 4.2 4.5 4.3 4.0 √
Neonatal Deaths (per 1,000 live births) 4.1 3.3 3.1 3.3 3.3 3.0 √
Post Neonatal Deaths (per 1,000 live births) 2.0 1.1 1.1 1.2 1.0 1.0 √
Birth Defects (per 1,000 live births) 1.3 0.7 0.8 0.7 0.5 0.7 √
Congenital Heart Defects (per 1,000 live births)
0.3 0.1 0.2 0.2 0.1 0.1 √
Sudden Infant Death Syndrome (SIDS) (per 1,000 live births)
0.5 0.5 0.2 0.3 0.3 0.2 √
Child/Adolescent/Young Adults Death Rates
1-4 years old 26.5 13.6 15.4 14.7 16.7 14.2 √
5-9 years old 12.4 7.3 8.4 5.3 9.1 8.8 √
10-14 years old 14.8 8.6 10.3 6.8 9.1 10.4 √
15-19 years old 54.3 30.9 27.8 19.5 31.1 30.4 √
20-24 years old 88.3 65.2 66.6 40.9 76.1 77.7 √
Asthma Deaths (per million)
Ages 35-64 Years 4.9 6.3 10.3 11.4 10.3 12.6 ●
Ages 65+ Years 21.5 29.9 31.3 35.4 45.9 36.3 ●
1. Data 2020 the Healthy People 2020 Database. (Source: https://www.healthypeople.gov). 2. Death rates are per 100,000 and age adjusted to the 2010 US Population except when noted.
= YES, met target = NO, but within 25% of target = NO, > 25% from target

61
Table 34. Rank of Premature Mortality Rates for the Largest 30 Communities,
Massachusetts: 2016 (Sorted by PMR)
Largest 30 Communities1 Number of Premature
Deaths PMR2
(per 100,000)
Fall River 467 517.7*
New Bedford 469 502.8*
Pittsfield 250 500.0*
Lowell 450 485.7*
Worcester 771 477.2*
Brockton 429 467.6*
Haverhill 279 462.0*
Springfield 612 441.0*
Taunton 246 428.2*
Chicopee 251 417.3*
Weymouth 244 405.9*
Lawrence 256 403.1*
Attleboro 177 399.2*
Revere 207 389.9*
Lynn 331 383.4*
Methuen 180 375.5*
Quincy 348 350.1*
Barnstable 187 349.5*
Boston 1816 345.4*
Malden 196 340.5*
Somerville 187 326.6
Plymouth 216 324.9
Peabody 187 317.1
Medford 179 311.3
Framingham 178 261.8
Waltham 151 261.5
Cambridge 217 250.7
Arlington 90 193.3*
Newton 148 166.8*
Brookline 81 149.8*
STATE 22,268 282.2
1. These communities had the largest populations in Massachusetts, based on 2010 Census. Rates for cities and towns were calculated using MDPH population estimates for 2010, which are the most up-to-date information available on the number of persons by age, race, and sex at the sub-state level. 2. Rates are age-adjusted to the 2000 US Standard Population for person ages 0-74 years.
* Significantly different from State PMR.
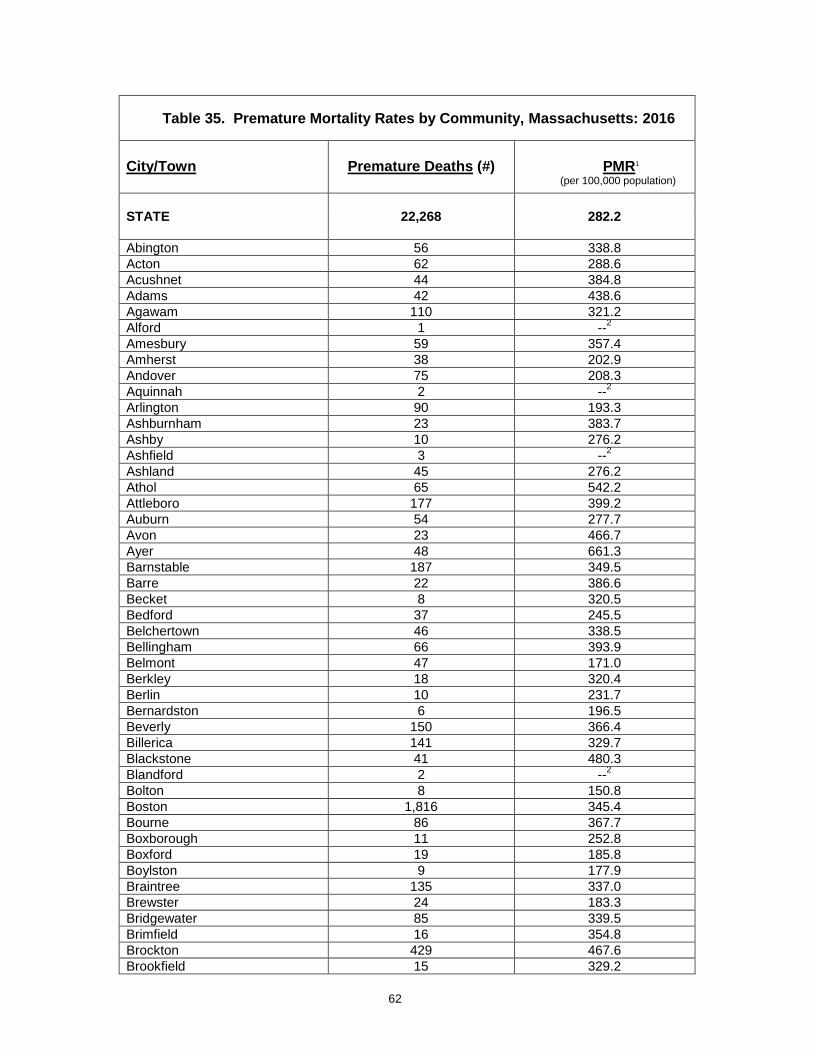
62
Table 35. Premature Mortality Rates by Community, Massachusetts: 2016
City/Town
Premature Deaths (#)
PMR1
(per 100,000 population)
STATE
22,268 282.2
Abington 56 338.8
Acton 62 288.6
Acushnet 44 384.8
Adams 42 438.6
Agawam 110 321.2
Alford 1 --2
Amesbury 59 357.4
Amherst 38 202.9
Andover 75 208.3
Aquinnah 2 --2
Arlington 90 193.3
Ashburnham 23 383.7
Ashby 10 276.2
Ashfield 3 --2
Ashland 45 276.2
Athol 65 542.2
Attleboro 177 399.2
Auburn 54 277.7
Avon 23 466.7
Ayer 48 661.3
Barnstable 187 349.5
Barre 22 386.6
Becket 8 320.5
Bedford 37 245.5
Belchertown 46 338.5
Bellingham 66 393.9
Belmont 47 171.0
Berkley 18 320.4
Berlin 10 231.7
Bernardston 6 196.5
Beverly 150 366.4
Billerica 141 329.7
Blackstone 41 480.3
Blandford 2 --2
Bolton 8 150.8
Boston 1,816 345.4
Bourne 86 367.7
Boxborough 11 252.8
Boxford 19 185.8
Boylston 9 177.9
Braintree 135 337.0
Brewster 24 183.3
Bridgewater 85 339.5
Brimfield 16 354.8
Brockton 429 467.6
Brookfield 15 329.2

63
Table 34 (continued). Premature Mortality Rates by Community, Massachusetts: 2015
City/Town
Premature Deaths (#)
PMR1
(per 100,000 population)
Brookline 81 149.8
Buckland 10 537.8
Burlington 60 214.2
Cambridge 217 250.7
Canton 70 299.4
Carlisle 7 103.6
Carver 66 539.9
Charlemont 3 --2
Charlton 44 367.5
Chatham 21 242.7
Chelmsford 97 248.9
Chelsea 129 471.5
Cheshire 10 258.4
Chester 2 --2
Chesterfield 7 404.3
Chicopee 251 417.3
Chilmark 2 --2
Clarksburg 2 --2
Clinton 58 419.9
Cohasset 17 258.0
Colrain 9 348.2
Concord 35 154.5
Conway 4 --2
Cummington 2 --2
Dalton 18 223.0
Danvers 124 407.3
Dartmouth 111 308.5
Dedham 97 353.6
Deerfield 13 179.2
Dennis 82 373.0
Dighton 23 288.4
Douglas 22 288.1
Dover 8 180.5
Dracut 116 374.2
Dudley 40 356.1
Dunstable 8 242.2
Duxbury 42 248.5
East Bridgewater 55 354.9
East Brookfield 12 466.8
East Longmeadow 39 222.8
Eastham 14 175.4
Easthampton 60 341.6
Easton 68 290.3
Edgartown 13 253.9
Egremont 5 220.9
Erving 8 355.2
Essex 13 397.6
Everett 151 387.7
Fairhaven 53 261.6
Table 35 (continued). Premature Mortality Rates by Community,
Massachusetts: 2016
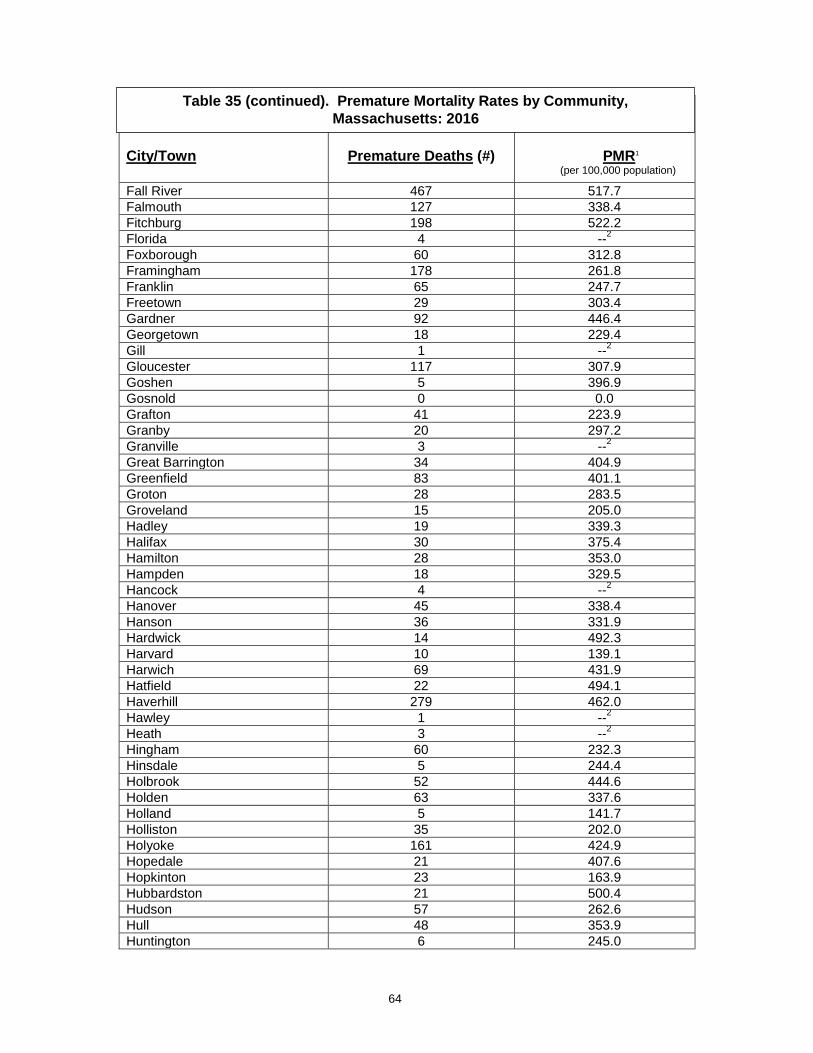
64
Table 294 (continued). Premature Mortality Rates by Community, Massachusetts: 2015
City/Town
Premature Deaths (#)
PMR1
(per 100,000 population)
Fall River 467 517.7
Falmouth 127 338.4
Fitchburg 198 522.2
Florida 4 --2
Foxborough 60 312.8
Framingham 178 261.8
Franklin 65 247.7
Freetown 29 303.4
Gardner 92 446.4
Georgetown 18 229.4
Gill 1 --2
Gloucester 117 307.9
Goshen 5 396.9
Gosnold 0 0.0
Grafton 41 223.9
Granby 20 297.2
Granville 3 --2
Great Barrington 34 404.9
Greenfield 83 401.1
Groton 28 283.5
Groveland 15 205.0
Hadley 19 339.3
Halifax 30 375.4
Hamilton 28 353.0
Hampden 18 329.5
Hancock 4 --2
Hanover 45 338.4
Hanson 36 331.9
Hardwick 14 492.3
Harvard 10 139.1
Harwich 69 431.9
Hatfield 22 494.1
Haverhill 279 462.0
Hawley 1 --2
Heath 3 --2
Hingham 60 232.3
Hinsdale 5 244.4
Holbrook 52 444.6
Holden 63 337.6
Holland 5 141.7
Holliston 35 202.0
Holyoke 161 424.9
Hopedale 21 407.6
Hopkinton 23 163.9
Hubbardston 21 500.4
Hudson 57 262.6
Hull 48 353.9
Huntington 6 245.0
Table 35 (continued). Premature Mortality Rates by Community,
Massachusetts: 2016
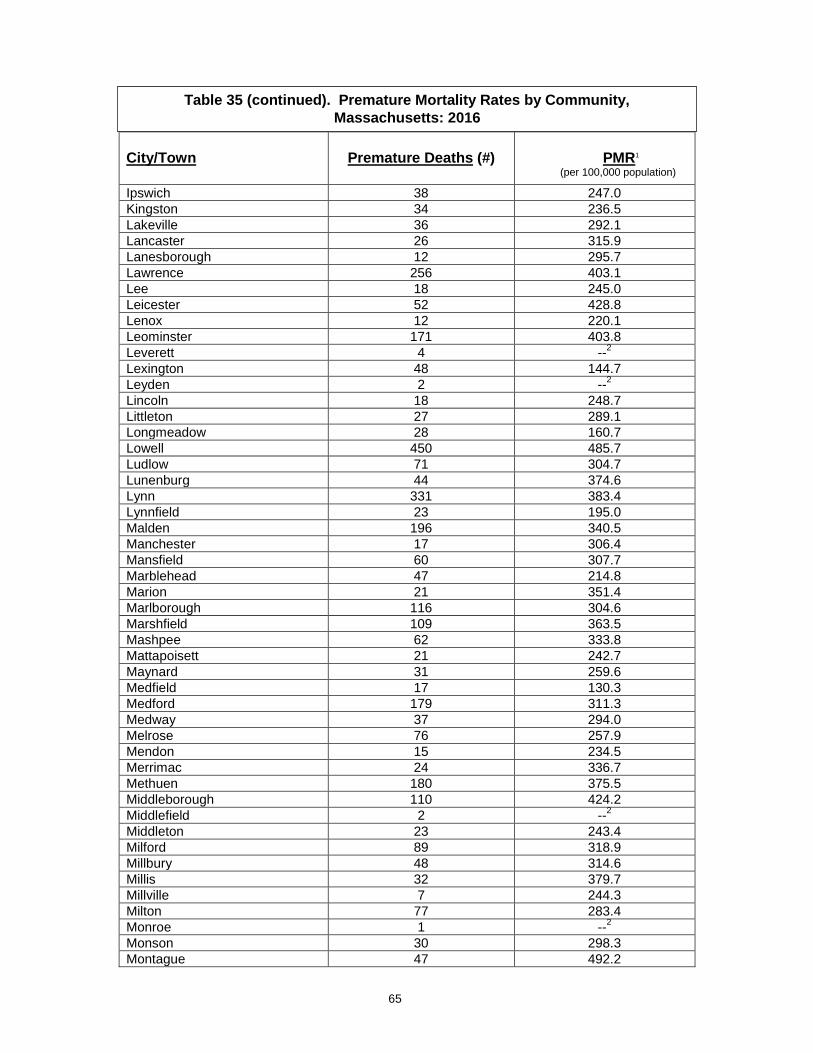
65
Table 30 (continued). Premature Mortality Rates by Community, Massachusetts: 2015
City/Town
Premature Deaths (#)
PMR1
(per 100,000 population)
Ipswich 38 247.0
Kingston 34 236.5
Lakeville 36 292.1
Lancaster 26 315.9
Lanesborough 12 295.7
Lawrence 256 403.1
Lee 18 245.0
Leicester 52 428.8
Lenox 12 220.1
Leominster 171 403.8
Leverett 4 --2
Lexington 48 144.7
Leyden 2 --2
Lincoln 18 248.7
Littleton 27 289.1
Longmeadow 28 160.7
Lowell 450 485.7
Ludlow 71 304.7
Lunenburg 44 374.6
Lynn 331 383.4
Lynnfield 23 195.0
Malden 196 340.5
Manchester 17 306.4
Mansfield 60 307.7
Marblehead 47 214.8
Marion 21 351.4
Marlborough 116 304.6
Marshfield 109 363.5
Mashpee 62 333.8
Mattapoisett 21 242.7
Maynard 31 259.6
Medfield 17 130.3
Medford 179 311.3
Medway 37 294.0
Melrose 76 257.9
Mendon 15 234.5
Merrimac 24 336.7
Methuen 180 375.5
Middleborough 110 424.2
Middlefield 2 --2
Middleton 23 243.4
Milford 89 318.9
Millbury 48 314.6
Millis 32 379.7
Millville 7 244.3
Milton 77 283.4
Monroe 1 --2
Monson 30 298.3
Montague 47 492.2
Table 35 (continued). Premature Mortality Rates by Community,
Massachusetts: 2016
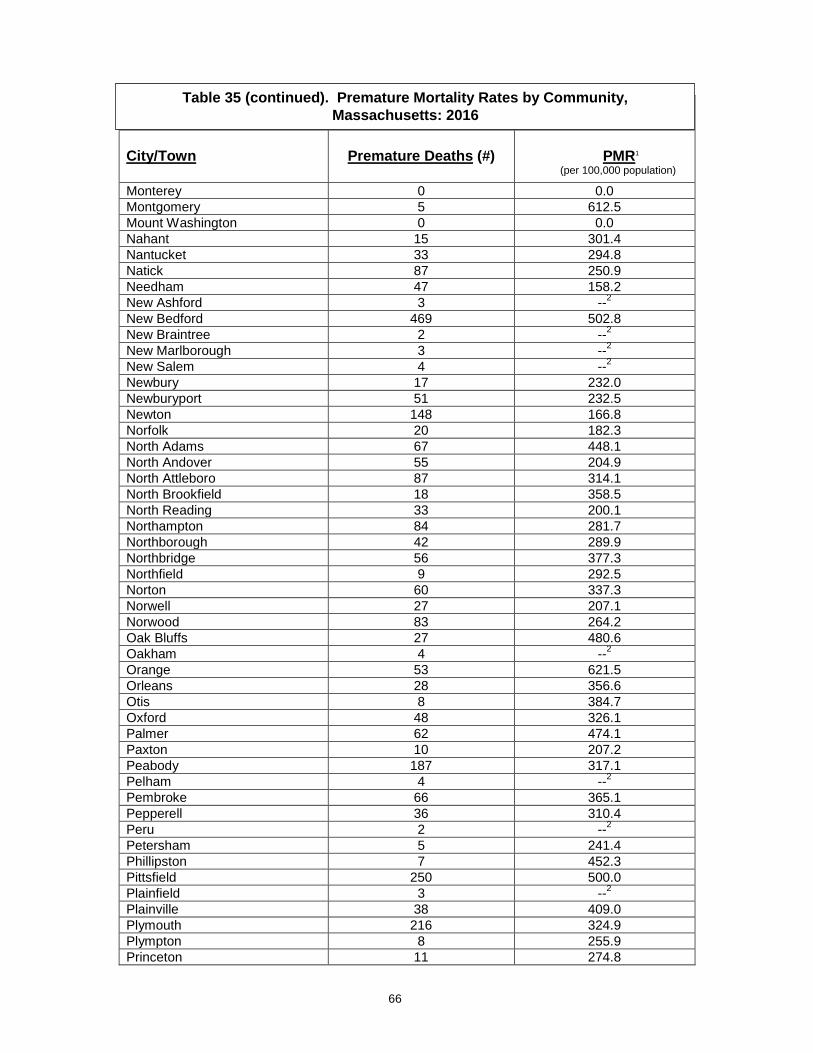
66
Table 31 (continued). Premature Mortality Rates by Community, Massachusetts: 2015
City/Town
Premature Deaths (#)
PMR1
(per 100,000 population)
Monterey 0 0.0
Montgomery 5 612.5
Mount Washington 0 0.0
Nahant 15 301.4
Nantucket 33 294.8
Natick 87 250.9
Needham 47 158.2
New Ashford 3 --2
New Bedford 469 502.8
New Braintree 2 --2
New Marlborough 3 --2
New Salem 4 --2
Newbury 17 232.0
Newburyport 51 232.5
Newton 148 166.8
Norfolk 20 182.3
North Adams 67 448.1
North Andover 55 204.9
North Attleboro 87 314.1
North Brookfield 18 358.5
North Reading 33 200.1
Northampton 84 281.7
Northborough 42 289.9
Northbridge 56 377.3
Northfield 9 292.5
Norton 60 337.3
Norwell 27 207.1
Norwood 83 264.2
Oak Bluffs 27 480.6
Oakham 4 --2
Orange 53 621.5
Orleans 28 356.6
Otis 8 384.7
Oxford 48 326.1
Palmer 62 474.1
Paxton 10 207.2
Peabody 187 317.1
Pelham 4 --2
Pembroke 66 365.1
Pepperell 36 310.4
Peru 2 --2
Petersham 5 241.4
Phillipston 7 452.3
Pittsfield 250 500.0
Plainfield 3 --2
Plainville 38 409.0
Plymouth 216 324.9
Plympton 8 255.9
Princeton 11 274.8
Table 35 (continued). Premature Mortality Rates by Community,
Massachusetts: 2016

67
Table 32 (continued). Premature Mortality Rates by Community, Massachusetts: 2015
City/Town
Premature Deaths (#)
PMR1
(per 100,000 population)
Provincetown 12 214.2
Quincy 348 350.1
Randolph 116 349.0
Raynham 53 359.2
Reading 54 207.9
Rehoboth 31 249.0
Revere 207 389.9
Richmond 2 --2
Rochester 16 297.2
Rockland 108 601.6
Rockport 19 176.8
Rowe 1 --2
Rowley 9 135.5
Royalston 3 --2
Russell 8 437.5
Rutland 26 354.6
Salem 139 331.7
Salisbury 51 533.2
Sandisfield 7 406.5
Sandwich 60 239.9
Saugus 93 304.9
Savoy 4 --2
Scituate 59 273.3
Seekonk 49 322.1
Sharon 26 124.7
Sheffield 13 289.3
Shelburne 13 621.1
Sherborn 9 281.9
Shirley 24 342.8
Shrewsbury 69 201.8
Shutesbury 3 --2
Somerset 70 325.0
Somerville 187 326.6
South Hadley 50 270.7
Southampton 14 204.0
Southborough 14 125.8
Southbridge 85 509.2
Southwick 29 269.0
Spencer 51 398.7
Springfield 612 441.0
Sterling 17 195.7
Stockbridge 6 214.2
Stoneham 71 302.2
Stoughton 103 350.7
Stow 12 177.5
Sturbridge 34 304.3
Sudbury 34 195.4
Sunderland 10 311.9
Sutton 19 194.6
Table 35 (continued). Premature Mortality Rates by Community,
Massachusetts: 2016
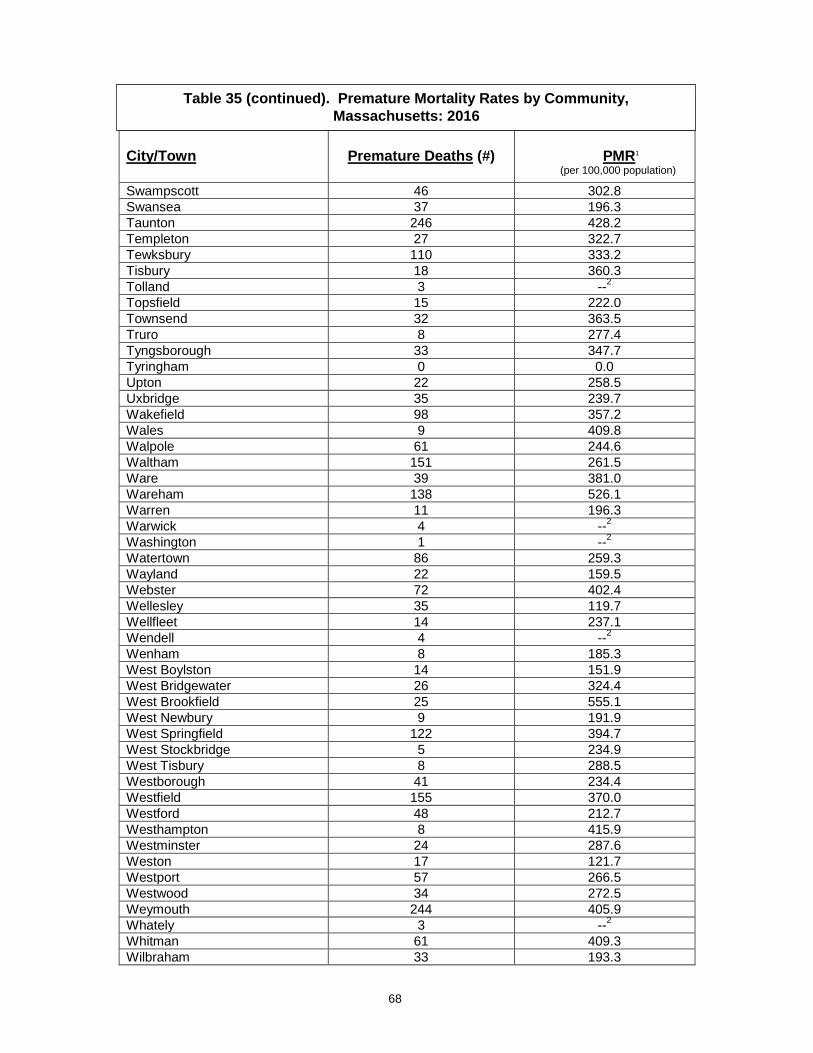
68
Table 33 (continued). Premature Mortality Rates by Community, Massachusetts: 2015
City/Town
Premature Deaths (#)
PMR1
(per 100,000 population)
Swampscott 46 302.8
Swansea 37 196.3
Taunton 246 428.2
Templeton 27 322.7
Tewksbury 110 333.2
Tisbury 18 360.3
Tolland 3 --2
Topsfield 15 222.0
Townsend 32 363.5
Truro 8 277.4
Tyngsborough 33 347.7
Tyringham 0 0.0
Upton 22 258.5
Uxbridge 35 239.7
Wakefield 98 357.2
Wales 9 409.8
Walpole 61 244.6
Waltham 151 261.5
Ware 39 381.0
Wareham 138 526.1
Warren 11 196.3
Warwick 4 --2
Washington 1 --2
Watertown 86 259.3
Wayland 22 159.5
Webster 72 402.4
Wellesley 35 119.7
Wellfleet 14 237.1
Wendell 4 --2
Wenham 8 185.3
West Boylston 14 151.9
West Bridgewater 26 324.4
West Brookfield 25 555.1
West Newbury 9 191.9
West Springfield 122 394.7
West Stockbridge 5 234.9
West Tisbury 8 288.5
Westborough 41 234.4
Westfield 155 370.0
Westford 48 212.7
Westhampton 8 415.9
Westminster 24 287.6
Weston 17 121.7
Westport 57 266.5
Westwood 34 272.5
Weymouth 244 405.9
Whately 3 --2
Whitman 61 409.3
Wilbraham 33 193.3
Table 35 (continued). Premature Mortality Rates by Community,
Massachusetts: 2016
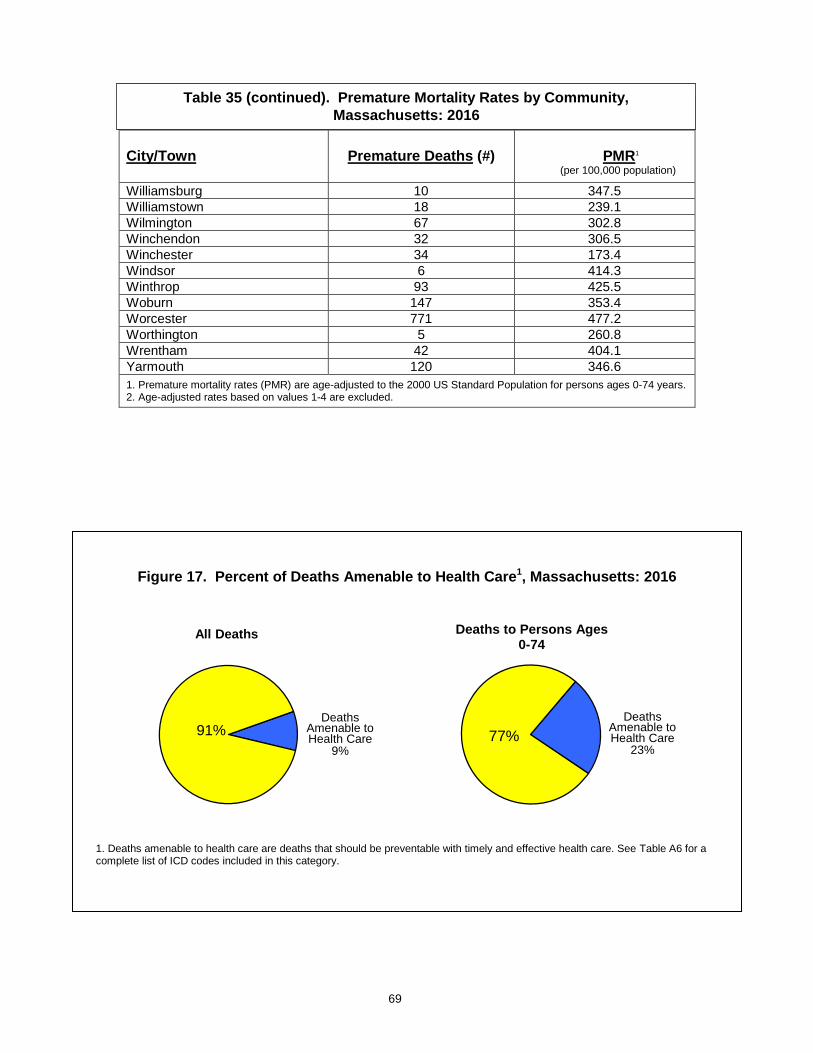
69
Table 34 (continued). Premature Mortality Rates by Community, Massachusetts: 2015
City/Town
Premature Deaths (#)
PMR1
(per 100,000 population)
Williamsburg 10 347.5
Williamstown 18 239.1
Wilmington 67 302.8
Winchendon 32 306.5
Winchester 34 173.4
Windsor 6 414.3
Winthrop 93 425.5
Woburn 147 353.4
Worcester 771 477.2
Worthington 5 260.8
Wrentham 42 404.1
Yarmouth 120 346.6
1. Premature mortality rates (PMR) are age-adjusted to the 2000 US Standard Population for persons ages 0-74 years. 2. Age-adjusted rates based on values 1-4 are excluded.
Figure 17. Percent of Deaths Amenable to Health Care1, Massachusetts: 2016
1. Deaths amenable to health care are deaths that should be preventable with timely and effective health care. See Table A6 for a complete list of ICD codes included in this category.
Table 35 (continued). Premature Mortality Rates by Community,
Massachusetts: 2016
91%
All Deaths
Deaths
Amenable to Health Care
9% 77%
Deaths to Persons Ages 0-74
Deaths Amenable to Health Care
23%

70
Figure 18. Amenable Mortality1 by Race and Hispanic Ethnicity2, Massachusetts: 2002-2016
1. Deaths amenable to health care are deaths that should be preventable with timely and effective health care. See Table A6 for a complete list of ICD codes included in this category. 2. Race and ethnicity data in this table are presented as mutually exclusive categories. Persons of Hispanic ethnicity are not included in a race category. Please see Technical Notes in the Appendix for a more detailed explanation.
101.6
63.1
162.6
80.1
48.8 36.8
83.5
57.4
0
20
40
60
80
100
120
140
160
180
2002 2003 2004 2005 2006 2007 2008 2009 2010 2011 2012 2013 2014 2015 2016
Ag
e-A
dju
ste
d D
eath
s p
er
100,0
00
Year
White non-Hispanic Black non-Hispanic
Asian non-Hispanic Hispanic

71
APPENDIX
Additional Tables & Figures
Technical Notes
Glossary
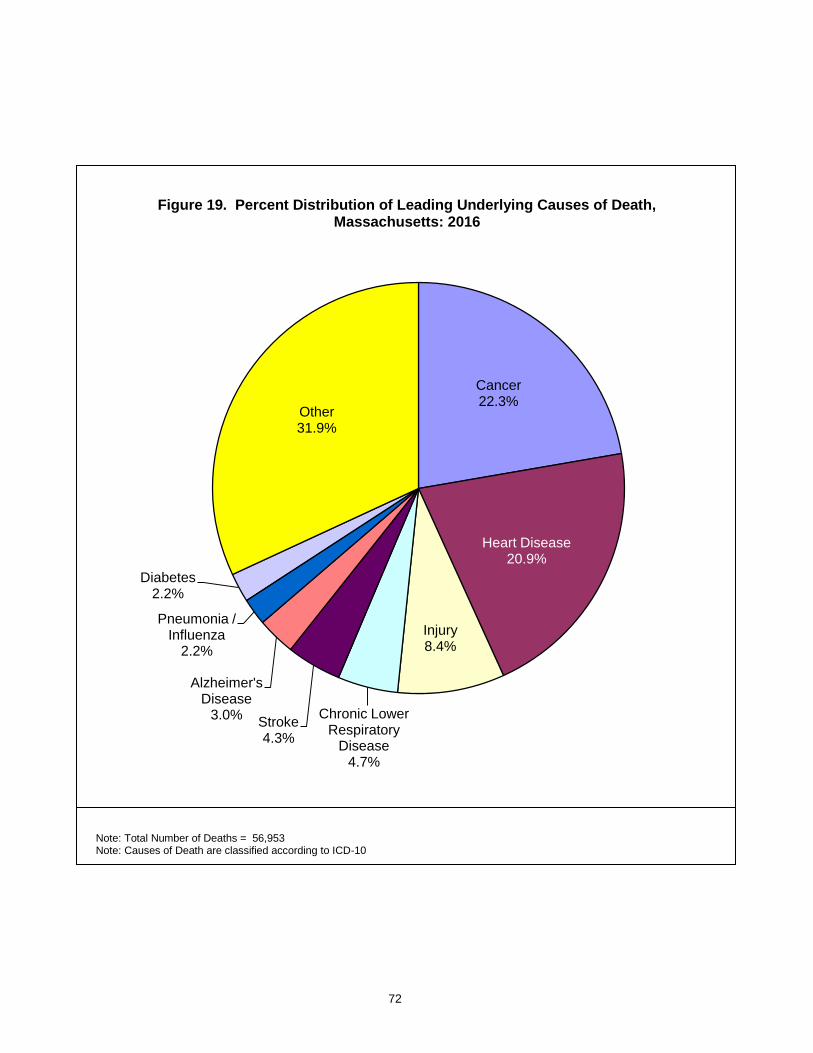
72
Figure 19. Percent Distribution of Leading Underlying Causes of Death, Massachusetts: 2016
Note: Total Number of Deaths = 56,953 Note: Causes of Death are classified according to ICD-10
Cancer 22.3%
Heart Disease 20.9%
Injury 8.4%
Chronic Lower Respiratory
Disease 4.7%
Stroke 4.3%
Alzheimer's Disease
3.0%
Pneumonia / Influenza
2.2%
Diabetes 2.2%
Other 31.9%

73
Table 36. Number and Age-Specific Rates for Leading Underlying Causes of Death by Race and Hispanic Ethnicity,
Massachusetts: 2016
Total
White non-Hispanic1
Black non-Hispanic1
Asian non-Hispanic1
Hispanic1
Selected Causes2 # Rate3 # Rate
3 # Rate
3 # Rate
3 # Rate
3
Age: 1-14, TOTAL 115 10.9 68 10.0 17 16.6 7 8.8 16 8.4
Unintentional Injuries4 27 2.6 16 2.4 5 4.9 1 --
6 3 --6
Cancer 20 1.9 9 1.3 2 --6 3 --
6 6 3.1
Heart Disease 8 0.8 6 0.9 1 --6 1 --
6 0 0.0
Congenital malformations 8 0.8 4 --6 1 --
6 1 --6 1 --
6
Age: 15-24, TOTAL 526 55.1 346 53.3 58 67.6 25 33.3 82 57.6
Unintentional Injuries4 285 29.8 203 31.3 22 25.6 8 10.7 44 30.9
Suicide 83 8.7 62 9.5 4 --6 8 10.7 9 6.3
Homicide 44 4.6 10 1.5 19 22.2 0 0.0 15 10.5
Cancer 25 2.6 15 2.3 1 --6 4 --
6 3 --
6
Age: 25-44, TOTAL 2,742 154.3 2,054 169.5 201 135.7 58 34.4 359 146.7
Unintentional Injuries4 1,409 79.3 1,135 93.7 50 33.8 13 7.7 185 75.6
Cancer 261 14.7 174 14.4 23 15.5 14 8.3 41 16.7
Suicide 210 11.8 172 14.2 12 8.1 6 3.6 15 6.1
Heart Disease 150 8.4 98 8.1 20 13.5 9 5.3 20 8.2
Age: 45-64, TOTAL 9,270 493.6 7,674 507.8 655 545.5 209 208.4 603 424.4
Cancer 2,984 158.9 2,470 163.4 201 167.4 118 117.6 148 104.2 Heart Disease 1,559 83.0 1,320 87.3 114 94.9 25 24.9 91 64.0
Unintentional Injuries4 1,097 58.4 902 59.7 61 50.8 13 13.0 105 73.9
Chronic Liver Disease 389 20.7 329 21.8 17 14.2 1 --6 35 24.6
Age: 65+, TOTAL 44,015 4,098.4 40,392 4,297.4 1,517 3,148.0 711 1,815.5 987 2,203.6
Heart Disease 10,190 948.8 9,438 1,004.1 307 637.1 129 329.4 215 480.0
Cancer 9,401 875.4 8,597 914.7 339 703.5 187 477.5 205 457.7
Chronic Lower Respiratory Disease 2,343 218.2 2,232 237.5 44 91.3 21 53.6 29 64.7
Stroke 2,236 208.2 1,982 210.9 98 203.4 65 166.0 58 129.5
73
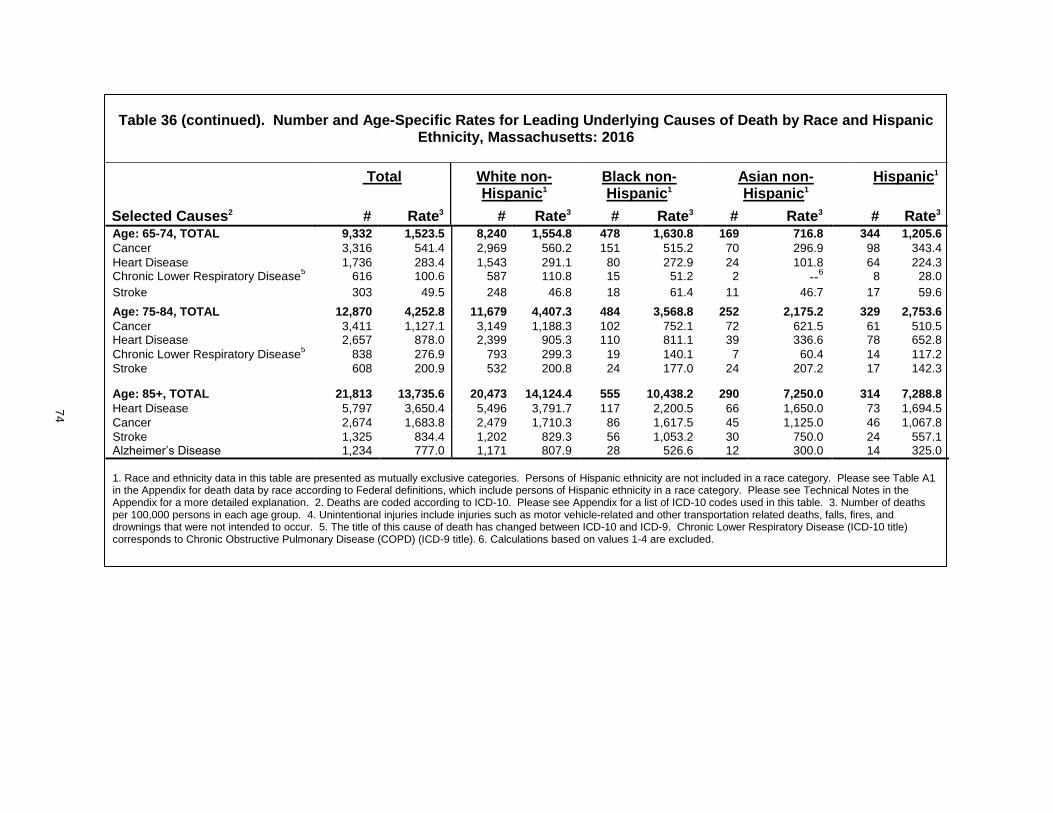
74
Table 36 (continued). Number and Age-Specific Rates for Leading Underlying Causes of Death by Race and Hispanic
Ethnicity, Massachusetts: 2016
Total White non-Hispanic1
Black non-Hispanic1
Asian non- Hispanic1
Hispanic1
Selected Causes2 # Rate3 # Rate3 # Rate3 # Rate3 # Rate3 Age: 65-74, TOTAL 9,332 1,523.5 8,240 1,554.8 478 1,630.8 169 716.8 344 1,205.6
Cancer 3,316 541.4 2,969 560.2 151 515.2 70 296.9 98 343.4
Heart Disease 1,736 283.4 1,543 291.1 80 272.9 24 101.8 64 224.3 Chronic Lower Respiratory Disease
5 616 100.6 587 110.8 15 51.2 2 --
6 8 28.0
Stroke 303 49.5 248 46.8 18 61.4 11 46.7 17 59.6
Age: 75-84, TOTAL 12,870 4,252.8 11,679 4,407.3 484 3,568.8 252 2,175.2 329 2,753.6
Cancer 3,411 1,127.1 3,149 1,188.3 102 752.1 72 621.5 61 510.5 Heart Disease 2,657 878.0 2,399 905.3 110 811.1 39 336.6 78 652.8
Chronic Lower Respiratory Disease5 838 276.9 793 299.3 19 140.1 7 60.4 14 117.2
Stroke 608 200.9 532 200.8 24 177.0 24 207.2 17 142.3
Age: 85+, TOTAL 21,813 13,735.6 20,473 14,124.4 555 10,438.2 290 7,250.0 314 7,288.8
Heart Disease 5,797 3,650.4 5,496 3,791.7 117 2,200.5 66 1,650.0 73 1,694.5
Cancer 2,674 1,683.8 2,479 1,710.3 86 1,617.5 45 1,125.0 46 1,067.8
Stroke 1,325 834.4 1,202 829.3 56 1,053.2 30 750.0 24 557.1 Alzheimer’s Disease 1,234 777.0 1,171 807.9 28 526.6 12 300.0 14 325.0
1. Race and ethnicity data in this table are presented as mutually exclusive categories. Persons of Hispanic ethnicity are not included in a race category. Please see Table A1 in the Appendix for death data by race according to Federal definitions, which include persons of Hispanic ethnicity in a race category. Please see Technical Notes in the Appendix for a more detailed explanation. 2. Deaths are coded according to ICD-10. Please see Appendix for a list of ICD-10 codes used in this table. 3. Number of deaths per 100,000 persons in each age group. 4. Unintentional injuries include injuries such as motor vehicle-related and other transportation related deaths, falls, fires, and drownings that were not intended to occur. 5. The title of this cause of death has changed between ICD-10 and ICD-9. Chronic Lower Respiratory Disease (ICD-10 title) corresponds to Chronic Obstructive Pulmonary Disease (COPD) (ICD-9 title). 6. Calculations based on values 1-4 are excluded.
74

75
151.7
85.7 0
100
200
300
400
Age-a
dju
ste
d r
ate
per
100,0
00
Asian non-Hispanic
Male Female
134.0 103.7
77.8 73.2 0
100
200
300
400
Age-a
dju
ste
d r
ate
per
100,0
00
Hispanic
Male Female
Figure 20. Heart Disease Death Rates1 by Race and Hispanic Ethnicity and Gender, Massachusetts: 1996-20162
1. Rates are per 100,000 population, age-adjusted to the 2010 U.S. Standard Population. 2. For 1996-1998 the comparability-modified rates were used.
75
332.2
179.8
204.1
109.1
0
100
200
300
400
Age-a
dju
ste
d r
ate
per
100,0
00
White non-Hispanics
Male Female
335.2
147.5 231.1
90.8
0
100
200
300
400
Ag
e-a
dju
ste
d r
ate
pe
r 100,0
00
Black non-Hispanics
Male Female
61.5
50.4
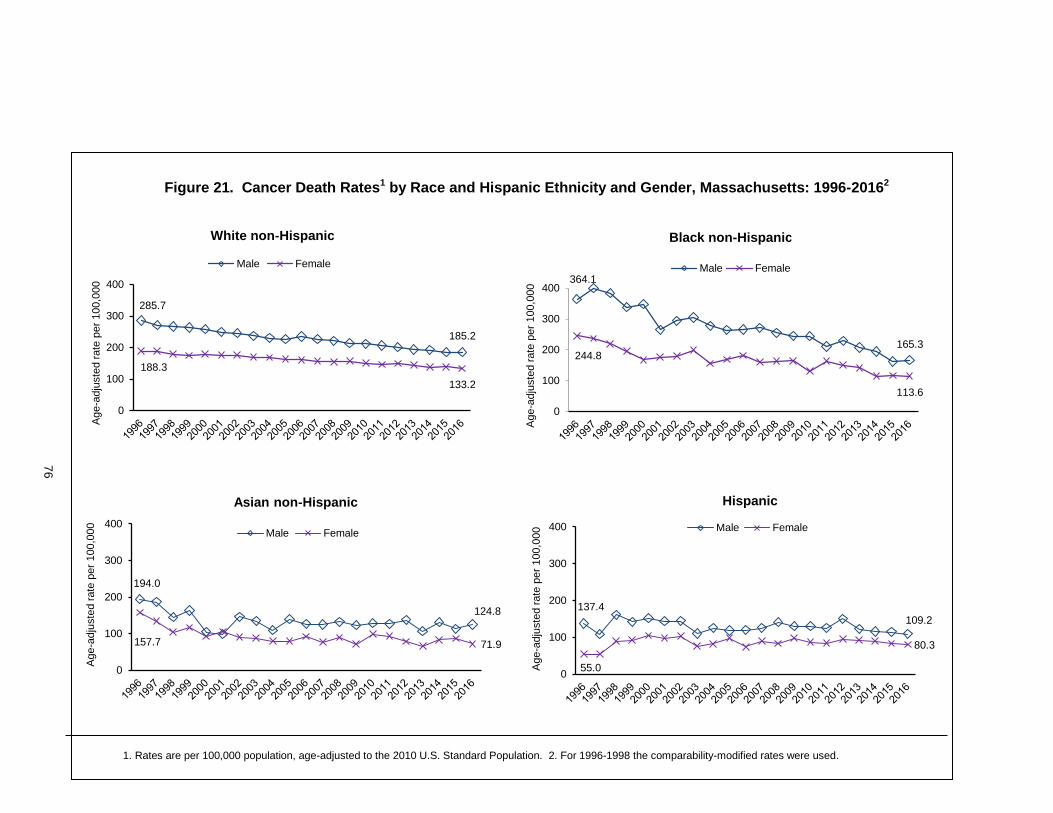
76
194.0
124.8
157.7 71.9
0
100
200
300
400
Age-a
dju
ste
d r
ate
per
100,0
00
Asian non-Hispanic
Male Female
137.4
109.2
55.0
80.3
0
100
200
300
400A
ge
-adju
ste
d r
ate
per
100,0
00
Hispanic
Male Female
Figure 21. Cancer Death Rates1 by Race and Hispanic Ethnicity and Gender, Massachusetts: 1996-20162
76
1. Rates are per 100,000 population, age-adjusted to the 2010 U.S. Standard Population. 2. For 1996-1998 the comparability-modified rates were used.
364.1
165.3 244.8
113.6
0
100
200
300
400
Age-a
dju
ste
d r
ate
per
100,0
00
Black non-Hispanics
Male Female
285.7
185.2
188.3
133.2
0
100
200
300
400
Age-a
dju
ste
d r
ate
per
100,0
00
White non-Hispanics
Male Female

77
Table 37. Premature Mortality Rates by Community Health Network Area (CHNA), Massachusetts: 2016
CHNA (Name and Number)
Number of Deaths
PMR1
(per 100,000 population)
Massachusetts 22,268 282.2
1. Community Health Network of Berkshire 570 363.1 2. Upper Valley Health Web (Franklin County) 382 376.5 3. Partnership for Health in Hampshire County (Northampton) 438 292.3 4. The Community Health Connection (Springfield) 1,104 363.5 5. Community Health Network of Southern Worcester County 485 380.2 6. Community Partners for Health (Milford) 495 308.4 7. Community Health Network of Greater Metro West (Framingham) 1,016 249.5 8. Common Pathways (Worcester) 1,131 377.1 9. Community Health Network of North Central Massachusetts 1,018 375.4 10. Greater Lowell Community Health Network 1,003 362.7 11. Greater Lawrence Community Health Network 589 321.4 12. Greater Haverhill Community Health Network 551 347.5 13. Community Health Network North (Beverly/Gloucester) 405 305.2 14. North Shore Community Health Network 1,005 328.6 15. Northwest Suburban Health Alliance 553 236.5 16. North Suburban Health Alliance (Medford/Malden/Melrose) 858 307.0 17. Greater Cambridge/Somerville Community Health Network 627 246.6 18. West Suburban Health Network (Newton/Waltham) 537 199.4 19. Alliance for Community Health (Boston/Chelsea/Revere/Winthrop) 2,326 340.3 20. Blue Hills Community Health Alliance (Greater Quincy) 1,310 313.8 21. Community Health Network of Chicopee, Holyoke, Ludlow, Westfield 646 382.9 22. Greater Brockton Community Health Network 958 395.1 23. South Shore Community Health Network 760 361.3 24. Greater Attleboro-Taunton Health & Education Response 950 361.9 25. Partners for Healthier Communities (Fall River) 631 419.9 26. Greater New Bedford Community Health Network 902 414.0 27. Cape Cod and Islands Health Network
1,017 318.9
1. Rates are per 100,000 population age-adjusted to the 2000 US Standard Population for persons ages 0-74 years.

78
Table 38. Premature Mortality Rates by County, Massachusetts: 2016
County Number of Deaths
PMR1
(per 100,000 population)
Massachusetts 22,2682 282.2
Barnstable 914 305.1
Berkshire 570 339.3
Bristol 2,209 341.0
Dukes 70 279.8
Essex 2,550 280.2
Franklin 302 305.3
Hampden 1,774 329.3
Hampshire 444 247.6
Middlesex 4,184 234.2
Nantucket 33 244.1
Norfolk 2,034 248.8
Plymouth 2,008 319.7
Suffolk 2,245 301.1
Worcester 2,930 311.0
1. Rates are per 100,000 population age-adjusted to the 2000 US Standard Population for persons ages 0-74 years. 2. Includes one death with an unknown county of residence.

79
Table 39. Selected Causes of Death by Community, Massachusetts: 2016
CITY/TOWN Total Deaths
Age-Adjusted Death Rate
1 Heart
Disease Total
Cancer Lung
Cancer Female Breast
Cancer2
Stroke CLRD3
Diabetes Influenza & Pneumonia
Motor Vehicle
Homicide Suicide Opioid- related
5
Massachusetts 56,953 668.9 11,923 12,691 3,168 775 2,468 2,676 1,267 1,243 466 140 636 2,034
Abington 127 803.5 34 26 7 4 5 7 3 5 0 0 2 2
Acton 144 725.4 24 44 11 2 4 7 5 1 2 0 5 7
Acushnet 101 798.1 22 28 9 1 7 4 1 0 4 0 1 4
Adams 103 769.0 26 19 6 1 8 5 1 0 0 0 1 1
Agawam 339 714.7 83 67 15 3 17 19 10 7 3 0 1 3
Alford 2 --4 1 0 0 0 0 0 0 0 0 0 0 0
Amesbury 146 818.5 35 25 5 3 9 7 5 3 0 0 1 7
Amherst 132 515.3 26 29 7 2 4 6 0 4 1 0 1 2
Andover 223 559.1 56 48 13 1 7 12 4 2 2 0 2 3
Aquinnah 3 --4 1 0 0 0 0 0 0 1 0 0 0 0
Arlington 345 560.3 63 77 19 5 8 13 10 6 5 0 2 5
Ashburnham 40 787.3 5 14 0 0 4 0 0 0 1 0 1 2
Ashby 27 1,129.9 8 3 0 1 4 1 1 1 0 0 2 0
Ashfield 10 490.9 5 2 1 0 0 0 0 1 0 0 0 0
Ashland 93 618.8 20 28 3 1 5 4 1 1 1 0 2 4
Athol 147 964.4 35 32 10 2 8 6 2 2 1 0 1 3
Attleboro 389 789.1 84 73 20 4 17 22 13 16 2 0 5 18
Auburn 180 684.6 46 38 7 3 7 11 1 8 0 0 2 2
Avon 51 880.3 16 9 1 0 2 4 0 0 0 0 1 3
Ayer 105 1,434.6 22 20 8 1 7 2 1 3 0 0 3 6
Barnstable 514 721.3 116 107 30 7 35 29 9 13 9 1 3 21
Barre 48 799.8 11 10 5 1 5 4 2 1 1 0 0 0
Becket 19 1,085.4 5 3 1 0 2 1 1 0 1 0 0 0
Bedford 142 629.0 24 33 6 3 3 3 4 1 1 0 0 6
Belchertown 98 796.1 17 19 5 0 8 6 2 2 0 1 0 2
Bellingham 126 826.9 35 28 6 3 4 8 3 2 3 0 1 5
Belmont 167 485.3 28 32 4 3 4 6 2 0 0 1 3 4
Berkley 36 881.3 6 6 1 1 2 4 2 1 2 0 0 5
Berlin 22 558.7 8 5 0 0 1 0 0 0 1 0 0 0
Bernardston 19 597.0 3 5 3 0 0 0 0 1 1 0 0 1
79

80
Table 39 (continued). Selected Causes of Death by Community, Massachusetts: 2016
CITY/TOWN Total Deaths
Age-Adjusted Death Rate
1 Heart
Disease Total
Cancer Lung
Cancer Female Breast
Cancer2
Stroke CLRD3
Diabetes Influenza & Pneumonia
Motor Vehicle
Homicide Suicide Opioid- related
5
Beverly 416 810.4 107 69 16 4 14 27 6 7 1 1 5 16
Billerica 317 877.8 67 79 28 2 8 13 2 6 3 0 3 15
Blackstone 80 914.8 12 16 3 0 2 5 1 0 0 0 1 7
Blandford 7 554.7 2 2 1 0 0 0 0 0 0 0 0 0
Bolton 23 711.5 7 7 0 0 1 1 0 0 0 0 0 1
Boston 3,799 702.56 707 910 226 57 154 133 123 58 45 35 44 189
Bourne 267 901.9 55 54 12 1 11 18 3 6 2 0 2 9
Boxborough 21 603.7 6 4 1 0 1 0 1 1 0 0 2 1
Boxford 48 576.8 13 15 5 1 0 2 0 1 0 0 0 0
Boylston 30 625.4 12 9 3 0 0 1 1 0 0 0 0 0
Braintree 411 786.2 79 90 22 8 23 19 7 10 3 0 2 8
Brewster 151 583.2 45 26 5 3 4 9 7 4 0 0 2 3
Bridgewater 191 835.6 40 48 15 4 1 11 3 4 2 0 2 10
Brimfield 34 857.3 9 5 2 0 1 2 0 2 0 0 1 1
Brockton 830 870.5 177 175 44 11 38 26 24 24 7 4 6 41
Brookfield 37 974.8 6 11 4 0 4 2 2 1 0 0 0 1
Brookline 305 457.9 64 84 13 5 16 6 9 8 1 0 4 2
Buckland 21 999.0 5 5 1 1 1 2 0 0 3 0 0 0
Burlington 246 786.3 54 54 12 2 9 11 5 4 1 1 2 7
Cambridge 477 554.7 97 128 32 5 16 13 10 7 3 0 6 27
Canton 234 684.1 51 29 8 1 10 9 6 6 2 0 1 6
Carlisle 29 910.6 4 10 1 1 2 0 0 0 0 0 1 0
Carver 132 1,002.7 21 37 14 2 6 12 2 2 4 0 3 8
Charlemont 4 --4 1 0 0 0 1 1 0 0 0 0 0 0
Charlton 127 878.8 30 23 5 1 5 4 3 0 4 0 4 4
Chatham 108 601.0 25 15 5 1 2 8 2 3 2 0 1 1
Chelmsford 322 719.9 76 64 14 6 16 18 6 9 0 0 7 6
Chelsea 280 963.8 47 54 6 6 9 14 5 2 2 4 4 13
Cheshire 29 737.6 6 9 3 3 1 3 0 0 1 0 0 1
Chester 6 404.4 1 1 1 0 1 1 0 0 0 0 0 0
Chesterfield 14 922.6 5 3 1 0 0 0 0 0 0 0 0 0
Chicopee 604 819.4 132 122 40 8 20 38 11 14 9 1 6 26
Chilmark 5 288.7 2 2 1 1 0 0 0 0 0 0 0 0
Clarksburg 15 741.6 3 5 1 0 2 1 0 0 0 0 0 0
80
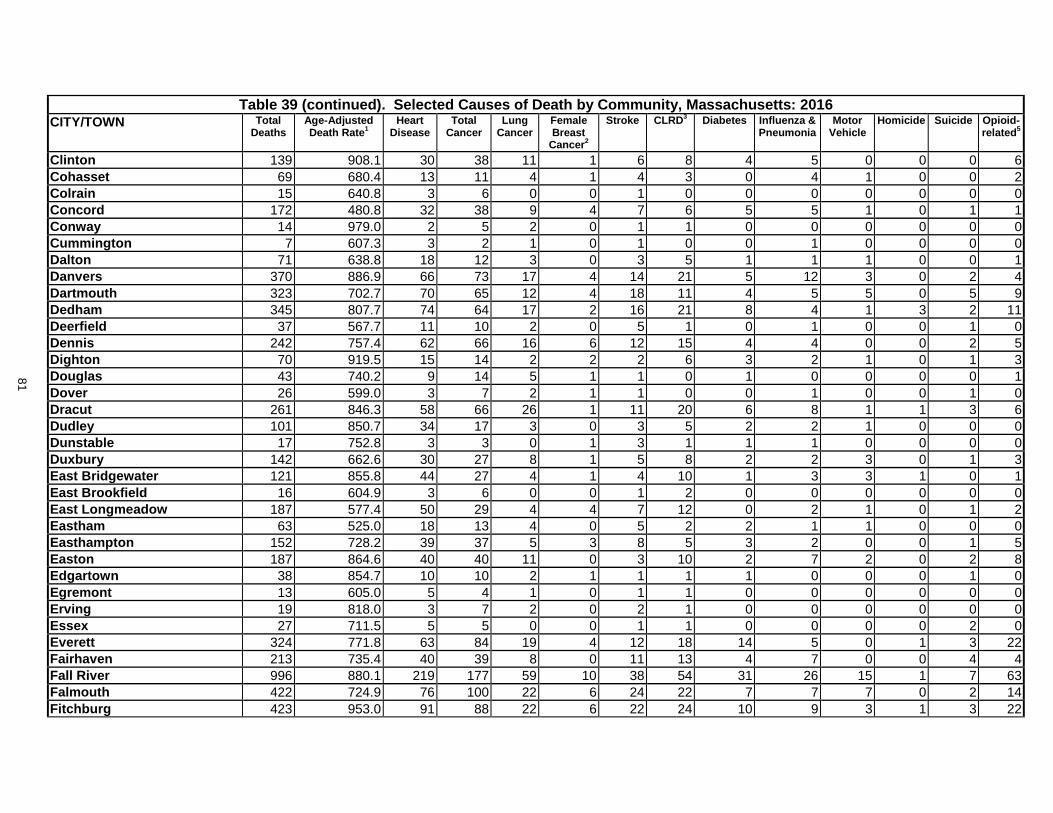
81
Table 39 (continued). Selected Causes of Death by Community, Massachusetts: 2016
CITY/TOWN Total Deaths
Age-Adjusted Death Rate
1 Heart
Disease Total
Cancer Lung
Cancer Female Breast
Cancer2
Stroke CLRD3
Diabetes Influenza & Pneumonia
Motor Vehicle
Homicide Suicide Opioid- related
5
Clinton 139 908.1 30 38 11 1 6 8 4 5 0 0 0 6
Cohasset 69 680.4 13 11 4 1 4 3 0 4 1 0 0 2
Colrain 15 640.8 3 6 0 0 1 0 0 0 0 0 0 0
Concord 172 480.8 32 38 9 4 7 6 5 5 1 0 1 1
Conway 14 979.0 2 5 2 0 1 1 0 0 0 0 0 0
Cummington 7 607.3 3 2 1 0 1 0 0 1 0 0 0 0
Dalton 71 638.8 18 12 3 0 3 5 1 1 1 0 0 1
Danvers 370 886.9 66 73 17 4 14 21 5 12 3 0 2 4
Dartmouth 323 702.7 70 65 12 4 18 11 4 5 5 0 5 9
Dedham 345 807.7 74 64 17 2 16 21 8 4 1 3 2 11
Deerfield 37 567.7 11 10 2 0 5 1 0 1 0 0 1 0
Dennis 242 757.4 62 66 16 6 12 15 4 4 0 0 2 5
Dighton 70 919.5 15 14 2 2 2 6 3 2 1 0 1 3
Douglas 43 740.2 9 14 5 1 1 0 1 0 0 0 0 1
Dover 26 599.0 3 7 2 1 1 0 0 1 0 0 1 0
Dracut 261 846.3 58 66 26 1 11 20 6 8 1 1 3 6
Dudley 101 850.7 34 17 3 0 3 5 2 2 1 0 0 0
Dunstable 17 752.8 3 3 0 1 3 1 1 1 0 0 0 0
Duxbury 142 662.6 30 27 8 1 5 8 2 2 3 0 1 3
East Bridgewater 121 855.8 44 27 4 1 4 10 1 3 3 1 0 1
East Brookfield 16 604.9 3 6 0 0 1 2 0 0 0 0 0 0
East Longmeadow 187 577.4 50 29 4 4 7 12 0 2 1 0 1 2
Eastham 63 525.0 18 13 4 0 5 2 2 1 1 0 0 0
Easthampton 152 728.2 39 37 5 3 8 5 3 2 0 0 1 5
Easton 187 864.6 40 40 11 0 3 10 2 7 2 0 2 8
Edgartown 38 854.7 10 10 2 1 1 1 1 0 0 0 1 0
Egremont 13 605.0 5 4 1 0 1 1 0 0 0 0 0 0
Erving 19 818.0 3 7 2 0 2 1 0 0 0 0 0 0
Essex 27 711.5 5 5 0 0 1 1 0 0 0 0 2 0
Everett 324 771.8 63 84 19 4 12 18 14 5 0 1 3 22
Fairhaven 213 735.4 40 39 8 0 11 13 4 7 0 0 4 4
Fall River 996 880.1 219 177 59 10 38 54 31 26 15 1 7 63
Falmouth 422 724.9 76 100 22 6 24 22 7 7 7 0 2 14
Fitchburg 423 953.0 91 88 22 6 22 24 10 9 3 1 3 22
81
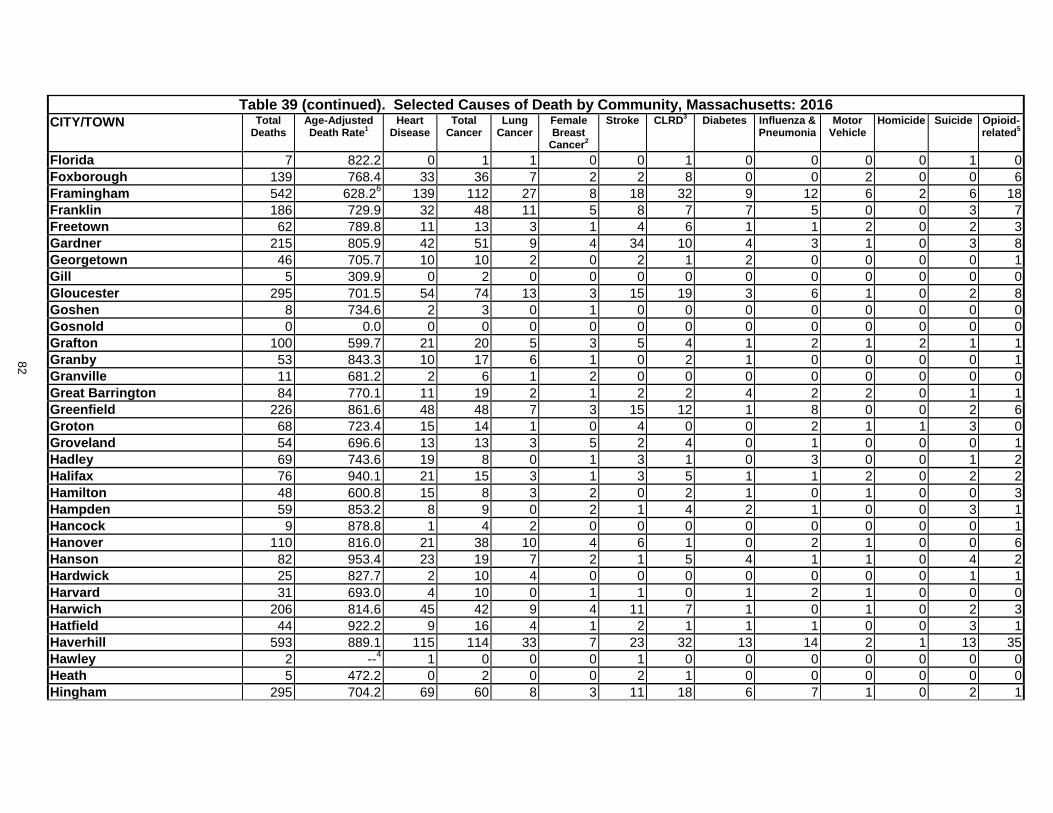
82
Table 39 (continued). Selected Causes of Death by Community, Massachusetts: 2016
CITY/TOWN Total Deaths
Age-Adjusted Death Rate
1 Heart
Disease Total
Cancer Lung
Cancer Female Breast
Cancer2
Stroke CLRD3
Diabetes Influenza & Pneumonia
Motor Vehicle
Homicide Suicide Opioid- related
5
Florida 7 822.2 0 1 1 0 0 1 0 0 0 0 1 0
Foxborough 139 768.4 33 36 7 2 2 8 0 0 2 0 0 6
Framingham 542 628.26 139 112 27 8 18 32 9 12 6 2 6 18
Franklin 186 729.9 32 48 11 5 8 7 7 5 0 0 3 7
Freetown 62 789.8 11 13 3 1 4 6 1 1 2 0 2 3
Gardner 215 805.9 42 51 9 4 34 10 4 3 1 0 3 8
Georgetown 46 705.7 10 10 2 0 2 1 2 0 0 0 0 1
Gill 5 309.9 0 2 0 0 0 0 0 0 0 0 0 0
Gloucester 295 701.5 54 74 13 3 15 19 3 6 1 0 2 8
Goshen 8 734.6 2 3 0 1 0 0 0 0 0 0 0 0
Gosnold 0 0.0 0 0 0 0 0 0 0 0 0 0 0 0
Grafton 100 599.7 21 20 5 3 5 4 1 2 1 2 1 1
Granby 53 843.3 10 17 6 1 0 2 1 0 0 0 0 1
Granville 11 681.2 2 6 1 2 0 0 0 0 0 0 0 0
Great Barrington 84 770.1 11 19 2 1 2 2 4 2 2 0 1 1
Greenfield 226 861.6 48 48 7 3 15 12 1 8 0 0 2 6
Groton 68 723.4 15 14 1 0 4 0 0 2 1 1 3 0
Groveland 54 696.6 13 13 3 5 2 4 0 1 0 0 0 1
Hadley 69 743.6 19 8 0 1 3 1 0 3 0 0 1 2
Halifax 76 940.1 21 15 3 1 3 5 1 1 2 0 2 2
Hamilton 48 600.8 15 8 3 2 0 2 1 0 1 0 0 3
Hampden 59 853.2 8 9 0 2 1 4 2 1 0 0 3 1
Hancock 9 878.8 1 4 2 0 0 0 0 0 0 0 0 1
Hanover 110 816.0 21 38 10 4 6 1 0 2 1 0 0 6
Hanson 82 953.4 23 19 7 2 1 5 4 1 1 0 4 2
Hardwick 25 827.7 2 10 4 0 0 0 0 0 0 0 1 1
Harvard 31 693.0 4 10 0 1 1 0 1 2 1 0 0 0
Harwich 206 814.6 45 42 9 4 11 7 1 0 1 0 2 3
Hatfield 44 922.2 9 16 4 1 2 1 1 1 0 0 3 1
Haverhill 593 889.1 115 114 33 7 23 32 13 14 2 1 13 35
Hawley 2 --4 1 0 0 0 1 0 0 0 0 0 0 0
Heath 5 472.2 0 2 0 0 2 1 0 0 0 0 0 0
Hingham 295 704.2 69 60 8 3 11 18 6 7 1 0 2 1
82

83
Table 39 (continued). Selected Causes of Death by Community, Massachusetts: 2016
CITY/TOWN Total Deaths
Age-Adjusted Death Rate
1 Heart
Disease Total
Cancer Lung
Cancer Female Breast
Cancer2
Stroke CLRD3
Diabetes Influenza & Pneumonia
Motor Vehicle
Homicide Suicide Opioid- related
5
Hinsdale 11 484.7 1 4 1 0 0 2 0 0 0 0 0 2
Holbrook 105 821.2 22 27 7 2 4 7 1 0 1 0 1 7
Holden 163 776.9 32 40 5 2 8 7 4 4 1 0 2 5
Holland 11 484.2 5 3 1 0 0 0 1 0 0 0 0 0
Holliston 96 728.2 17 28 6 2 2 3 4 3 1 0 2 1
Holyoke 468 902.8 112 85 21 4 18 27 7 11 5 3 2 10
Hopedale 49 666.9 9 11 5 1 0 5 2 2 0 0 0 0
Hopkinton 73 748.8 20 18 4 1 0 3 1 2 2 0 2 0
Hubbardston 37 1,084.0 6 13 3 1 2 2 1 1 2 1 0 1
Hudson 153 744.1 41 31 5 5 7 6 3 0 1 0 2 2
Hull 117 1,007.7 28 30 9 1 4 3 1 3 0 0 1 5
Huntington 15 776.2 4 4 0 0 0 0 1 1 0 0 0 0
Ipswich 103 537.8 25 20 5 3 1 3 3 1 0 0 1 3
Kingston 127 711.0 20 36 8 1 6 9 0 1 1 1 0 1
Lakeville 113 1,066.9 20 26 10 1 7 8 4 2 0 0 1 1
Lancaster 69 868.5 11 15 2 1 9 2 1 2 2 0 2 1
Lanesborough 18 457.3 5 3 1 0 2 1 0 0 0 0 1 1
Lawrence 477 769.4 96 90 20 3 15 18 21 5 6 4 4 44
Lee 55 584.7 11 12 5 1 3 1 0 1 2 0 0 1
Leicester 117 969.5 25 34 11 2 2 8 2 2 0 1 1 1
Lenox 89 591.7 23 18 2 2 5 3 2 0 1 0 0 0
Leominster 406 805.4 77 97 25 3 35 13 9 5 0 0 4 13
Leverett 9 522.4 2 1 0 0 0 1 0 0 0 0 0 0
Lexington 222 423.4 42 51 12 4 10 3 3 5 2 0 2 2
Leyden 5 1,177.1 1 2 0 0 0 1 0 0 1 0 0 0
Lincoln 49 591.5 12 9 1 0 3 1 0 0 0 0 0 0
Littleton 65 596.2 10 17 2 0 3 2 0 1 0 0 2 2
Longmeadow 176 576.8 42 26 8 0 6 7 0 2 0 0 2 3
Lowell 893 939.1 165 198 57 13 28 29 22 25 4 1 12 67
Ludlow 217 740.8 48 37 11 3 16 4 4 6 4 2 1 6
Lunenburg 82 732.8 15 22 6 3 5 1 0 2 3 0 2 1
Lynn 708 784.5 147 166 38 17 26 36 25 13 3 3 5 43
Lynnfield 105 622.6 20 16 5 1 11 8 1 4 0 0 1 1
Malden 411 675.3 85 104 29 4 16 13 14 9 5 1 3 15
83
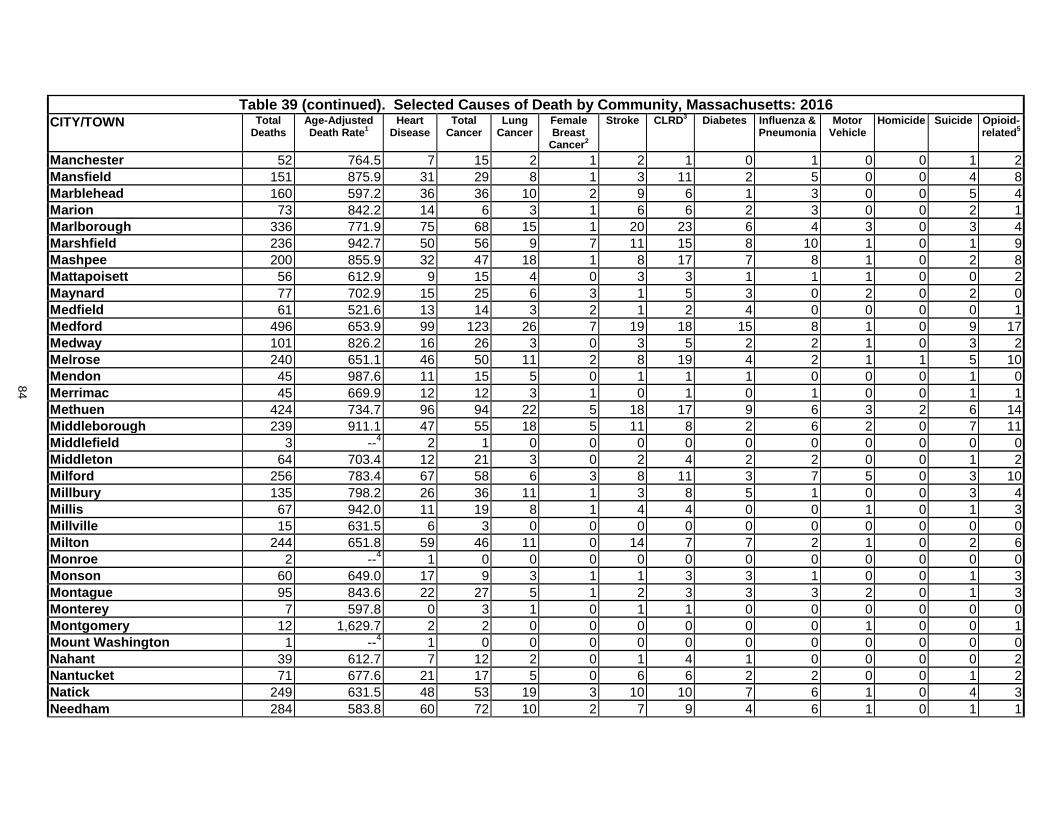
84
Table 39 (continued). Selected Causes of Death by Community, Massachusetts: 2016
CITY/TOWN Total Deaths
Age-Adjusted Death Rate
1 Heart
Disease Total
Cancer Lung
Cancer Female Breast
Cancer2
Stroke CLRD3
Diabetes Influenza & Pneumonia
Motor Vehicle
Homicide Suicide Opioid- related
5
Manchester 52 764.5 7 15 2 1 2 1 0 1 0 0 1 2
Mansfield 151 875.9 31 29 8 1 3 11 2 5 0 0 4 8
Marblehead 160 597.2 36 36 10 2 9 6 1 3 0 0 5 4
Marion 73 842.2 14 6 3 1 6 6 2 3 0 0 2 1
Marlborough 336 771.9 75 68 15 1 20 23 6 4 3 0 3 4
Marshfield 236 942.7 50 56 9 7 11 15 8 10 1 0 1 9
Mashpee 200 855.9 32 47 18 1 8 17 7 8 1 0 2 8
Mattapoisett 56 612.9 9 15 4 0 3 3 1 1 1 0 0 2
Maynard 77 702.9 15 25 6 3 1 5 3 0 2 0 2 0
Medfield 61 521.6 13 14 3 2 1 2 4 0 0 0 0 1
Medford 496 653.9 99 123 26 7 19 18 15 8 1 0 9 17
Medway 101 826.2 16 26 3 0 3 5 2 2 1 0 3 2
Melrose 240 651.1 46 50 11 2 8 19 4 2 1 1 5 10
Mendon 45 987.6 11 15 5 0 1 1 1 0 0 0 1 0
Merrimac 45 669.9 12 12 3 1 0 1 0 1 0 0 1 1
Methuen 424 734.7 96 94 22 5 18 17 9 6 3 2 6 14
Middleborough 239 911.1 47 55 18 5 11 8 2 6 2 0 7 11
Middlefield 3 --4 2 1 0 0 0 0 0 0 0 0 0 0
Middleton 64 703.4 12 21 3 0 2 4 2 2 0 0 1 2
Milford 256 783.4 67 58 6 3 8 11 3 7 5 0 3 10
Millbury 135 798.2 26 36 11 1 3 8 5 1 0 0 3 4
Millis 67 942.0 11 19 8 1 4 4 0 0 1 0 1 3
Millville 15 631.5 6 3 0 0 0 0 0 0 0 0 0 0
Milton 244 651.8 59 46 11 0 14 7 7 2 1 0 2 6
Monroe 2 --4 1 0 0 0 0 0 0 0 0 0 0 0
Monson 60 649.0 17 9 3 1 1 3 3 1 0 0 1 3
Montague 95 843.6 22 27 5 1 2 3 3 3 2 0 1 3
Monterey 7 597.8 0 3 1 0 1 1 0 0 0 0 0 0
Montgomery 12 1,629.7 2 2 0 0 0 0 0 0 1 0 0 1
Mount Washington 1 --4 1 0 0 0 0 0 0 0 0 0 0 0
Nahant 39 612.7 7 12 2 0 1 4 1 0 0 0 0 2
Nantucket 71 677.6 21 17 5 0 6 6 2 2 0 0 1 2
Natick 249 631.5 48 53 19 3 10 10 7 6 1 0 4 3
Needham 284 583.8 60 72 10 2 7 9 4 6 1 0 1 1
84

85
Table 39 (continued). Selected Causes of Death by Community, Massachusetts: 2016
CITY/TOWN Total Deaths
Age-Adjusted Death Rate
1 Heart
Disease Total
Cancer Lung
Cancer Female Breast
Cancer2
Stroke CLRD3
Diabetes Influenza & Pneumonia
Motor Vehicle
Homicide Suicide Opioid- related
5
New Ashford 5 1,380.2 0 2 0 0 0 0 0 0 0 0 0 0
New Bedford 1,084 909.1 210 222 67 10 47 53 27 29 11 3 7 56
New Braintree 10 1,525.5 2 3 0 0 0 0 0 1 0 0 0 0
New Marlborough 7 314.5 1 0 0 0 0 0 0 0 0 0 0 0
New Salem 8 933.3 1 2 0 0 0 1 1 0 0 0 0 0
Newbury 51 782.2 9 12 3 1 3 3 1 1 1 0 0 1
Newburyport 182 711.6 48 34 7 1 4 7 6 1 3 0 2 4
Newton 565 467.2 122 120 19 9 29 13 8 12 1 0 7 16
Norfolk 58 906.5 15 13 4 1 2 3 1 2 0 0 2 3
North Adams 151 798.9 35 33 14 1 6 9 4 4 1 0 2 6
North Andover 243 611.0 45 37 3 1 15 10 2 6 1 0 3 3
North Attleboro 221 859.8 60 46 17 6 10 17 9 6 1 0 2 7
North Brookfield 40 734.5 5 11 1 2 2 1 1 1 0 0 0 3
North Reading 101 678.1 20 19 5 4 6 6 3 3 0 0 3 2
Northampton 264 728.2 58 57 12 6 12 11 4 10 3 0 5 8
Northborough 129 820.5 25 26 4 2 6 4 3 5 0 0 2 3
Northbridge 159 827.5 27 32 15 0 9 6 3 3 3 0 2 2
Northfield 30 821.1 7 7 2 1 0 0 0 1 0 0 1 0
Norton 127 772.5 26 28 11 0 9 6 1 1 1 1 4 7
Norwell 86 582.7 13 13 2 0 3 6 0 1 0 0 1 1
Norwood 305 675.3 62 65 14 3 21 15 2 5 2 1 3 6
Oak Bluffs 58 904.0 7 18 7 0 3 4 2 3 0 0 0 1
Oakham 10 725.4 2 1 0 1 0 1 0 0 0 0 1 0
Orange 98 1,082.1 15 24 9 4 5 13 4 0 0 2 2 1
Orleans 112 708.2 30 32 7 1 4 7 4 3 1 0 1 2
Otis 15 751.3 4 2 0 0 2 0 0 0 1 0 0 1
Oxford 113 862.6 24 27 3 1 5 10 5 2 1 0 1 7
Palmer 134 859.6 31 34 9 2 2 6 3 2 1 0 0 4
Paxton 30 571.8 7 13 1 0 1 0 0 0 0 0 0 0
Peabody 729 754.6 134 154 45 9 41 34 20 12 3 3 4 11
Pelham 9 530.6 4 2 1 0 1 0 0 0 0 0 0 0
Pembroke 143 984.1 29 37 13 0 6 11 2 1 1 0 4 8
Pepperell 79 839.7 13 24 7 1 1 3 2 0 0 0 0 1
Peru 7 1,453.1 3 2 1 0 0 0 0 1 0 0 0 0
85
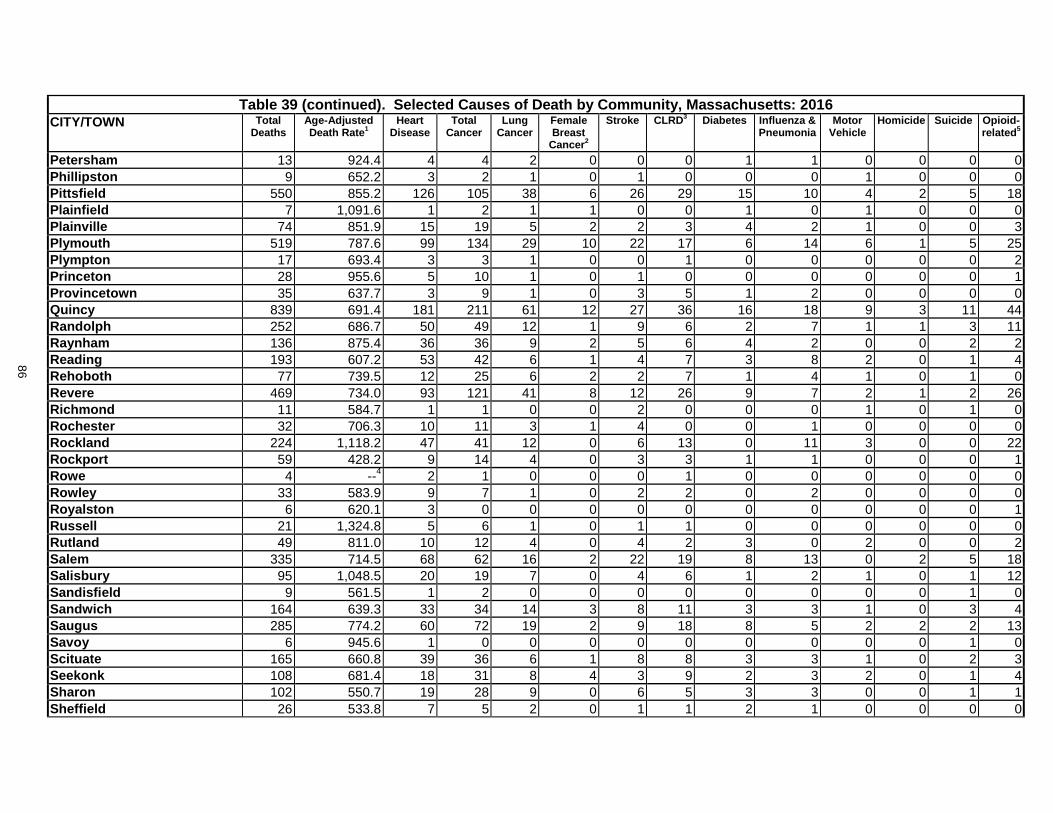
86
Table 39 (continued). Selected Causes of Death by Community, Massachusetts: 2016
CITY/TOWN Total Deaths
Age-Adjusted Death Rate
1 Heart
Disease Total
Cancer Lung
Cancer Female Breast
Cancer2
Stroke CLRD3
Diabetes Influenza & Pneumonia
Motor Vehicle
Homicide Suicide Opioid- related
5
Petersham 13 924.4 4 4 2 0 0 0 1 1 0 0 0 0
Phillipston 9 652.2 3 2 1 0 1 0 0 0 1 0 0 0
Pittsfield 550 855.2 126 105 38 6 26 29 15 10 4 2 5 18
Plainfield 7 1,091.6 1 2 1 1 0 0 1 0 1 0 0 0
Plainville 74 851.9 15 19 5 2 2 3 4 2 1 0 0 3
Plymouth 519 787.6 99 134 29 10 22 17 6 14 6 1 5 25
Plympton 17 693.4 3 3 1 0 0 1 0 0 0 0 0 2
Princeton 28 955.6 5 10 1 0 1 0 0 0 0 0 0 1
Provincetown 35 637.7 3 9 1 0 3 5 1 2 0 0 0 0
Quincy 839 691.4 181 211 61 12 27 36 16 18 9 3 11 44
Randolph 252 686.7 50 49 12 1 9 6 2 7 1 1 3 11
Raynham 136 875.4 36 36 9 2 5 6 4 2 0 0 2 2
Reading 193 607.2 53 42 6 1 4 7 3 8 2 0 1 4
Rehoboth 77 739.5 12 25 6 2 2 7 1 4 1 0 1 0
Revere 469 734.0 93 121 41 8 12 26 9 7 2 1 2 26
Richmond 11 584.7 1 1 0 0 2 0 0 0 1 0 1 0
Rochester 32 706.3 10 11 3 1 4 0 0 1 0 0 0 0
Rockland 224 1,118.2 47 41 12 0 6 13 0 11 3 0 0 22
Rockport 59 428.2 9 14 4 0 3 3 1 1 0 0 0 1
Rowe 4 --4 2 1 0 0 0 1 0 0 0 0 0 0
Rowley 33 583.9 9 7 1 0 2 2 0 2 0 0 0 0
Royalston 6 620.1 3 0 0 0 0 0 0 0 0 0 0 1
Russell 21 1,324.8 5 6 1 0 1 1 0 0 0 0 0 0
Rutland 49 811.0 10 12 4 0 4 2 3 0 2 0 0 2
Salem 335 714.5 68 62 16 2 22 19 8 13 0 2 5 18
Salisbury 95 1,048.5 20 19 7 0 4 6 1 2 1 0 1 12
Sandisfield 9 561.5 1 2 0 0 0 0 0 0 0 0 1 0
Sandwich 164 639.3 33 34 14 3 8 11 3 3 1 0 3 4
Saugus 285 774.2 60 72 19 2 9 18 8 5 2 2 2 13
Savoy 6 945.6 1 0 0 0 0 0 0 0 0 0 1 0
Scituate 165 660.8 39 36 6 1 8 8 3 3 1 0 2 3
Seekonk 108 681.4 18 31 8 4 3 9 2 3 2 0 1 4
Sharon 102 550.7 19 28 9 0 6 5 3 3 0 0 1 1
Sheffield 26 533.8 7 5 2 0 1 1 2 1 0 0 0 0
86
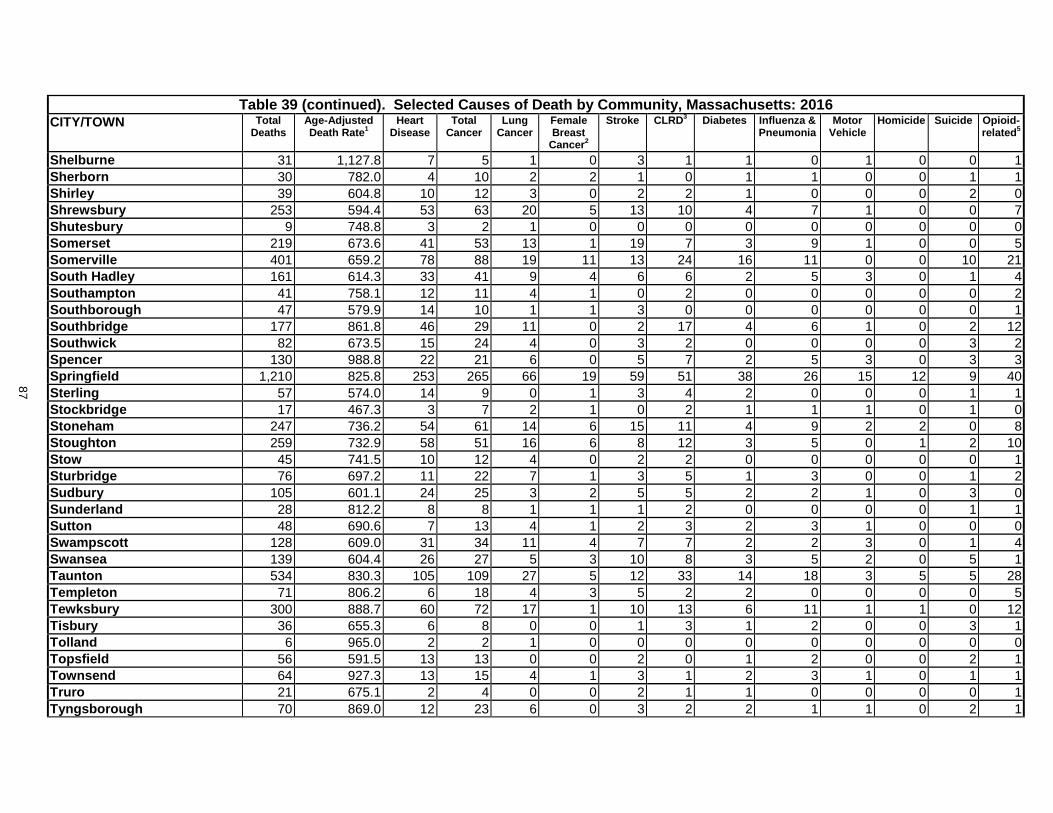
87
Table 39 (continued). Selected Causes of Death by Community, Massachusetts: 2016
CITY/TOWN Total Deaths
Age-Adjusted Death Rate
1 Heart
Disease Total
Cancer Lung
Cancer Female Breast
Cancer2
Stroke CLRD3
Diabetes Influenza & Pneumonia
Motor Vehicle
Homicide Suicide Opioid- related
5
Shelburne 31 1,127.8 7 5 1 0 3 1 1 0 1 0 0 1
Sherborn 30 782.0 4 10 2 2 1 0 1 1 0 0 1 1
Shirley 39 604.8 10 12 3 0 2 2 1 0 0 0 2 0
Shrewsbury 253 594.4 53 63 20 5 13 10 4 7 1 0 0 7
Shutesbury 9 748.8 3 2 1 0 0 0 0 0 0 0 0 0
Somerset 219 673.6 41 53 13 1 19 7 3 9 1 0 0 5
Somerville 401 659.2 78 88 19 11 13 24 16 11 0 0 10 21
South Hadley 161 614.3 33 41 9 4 6 6 2 5 3 0 1 4
Southampton 41 758.1 12 11 4 1 0 2 0 0 0 0 0 2
Southborough 47 579.9 14 10 1 1 3 0 0 0 0 0 0 1
Southbridge 177 861.8 46 29 11 0 2 17 4 6 1 0 2 12
Southwick 82 673.5 15 24 4 0 3 2 0 0 0 0 3 2
Spencer 130 988.8 22 21 6 0 5 7 2 5 3 0 3 3
Springfield 1,210 825.8 253 265 66 19 59 51 38 26 15 12 9 40
Sterling 57 574.0 14 9 0 1 3 4 2 0 0 0 1 1
Stockbridge 17 467.3 3 7 2 1 0 2 1 1 1 0 1 0
Stoneham 247 736.2 54 61 14 6 15 11 4 9 2 2 0 8
Stoughton 259 732.9 58 51 16 6 8 12 3 5 0 1 2 10
Stow 45 741.5 10 12 4 0 2 2 0 0 0 0 0 1
Sturbridge 76 697.2 11 22 7 1 3 5 1 3 0 0 1 2
Sudbury 105 601.1 24 25 3 2 5 5 2 2 1 0 3 0
Sunderland 28 812.2 8 8 1 1 1 2 0 0 0 0 1 1
Sutton 48 690.6 7 13 4 1 2 3 2 3 1 0 0 0
Swampscott 128 609.0 31 34 11 4 7 7 2 2 3 0 1 4
Swansea 139 604.4 26 27 5 3 10 8 3 5 2 0 5 1
Taunton 534 830.3 105 109 27 5 12 33 14 18 3 5 5 28
Templeton 71 806.2 6 18 4 3 5 2 2 0 0 0 0 5
Tewksbury 300 888.7 60 72 17 1 10 13 6 11 1 1 0 12
Tisbury 36 655.3 6 8 0 0 1 3 1 2 0 0 3 1
Tolland 6 965.0 2 2 1 0 0 0 0 0 0 0 0 0
Topsfield 56 591.5 13 13 0 0 2 0 1 2 0 0 2 1
Townsend 64 927.3 13 15 4 1 3 1 2 3 1 0 1 1
Truro 21 675.1 2 4 0 0 2 1 1 0 0 0 0 1
Tyngsborough 70 869.0 12 23 6 0 3 2 2 1 1 0 2 1
87
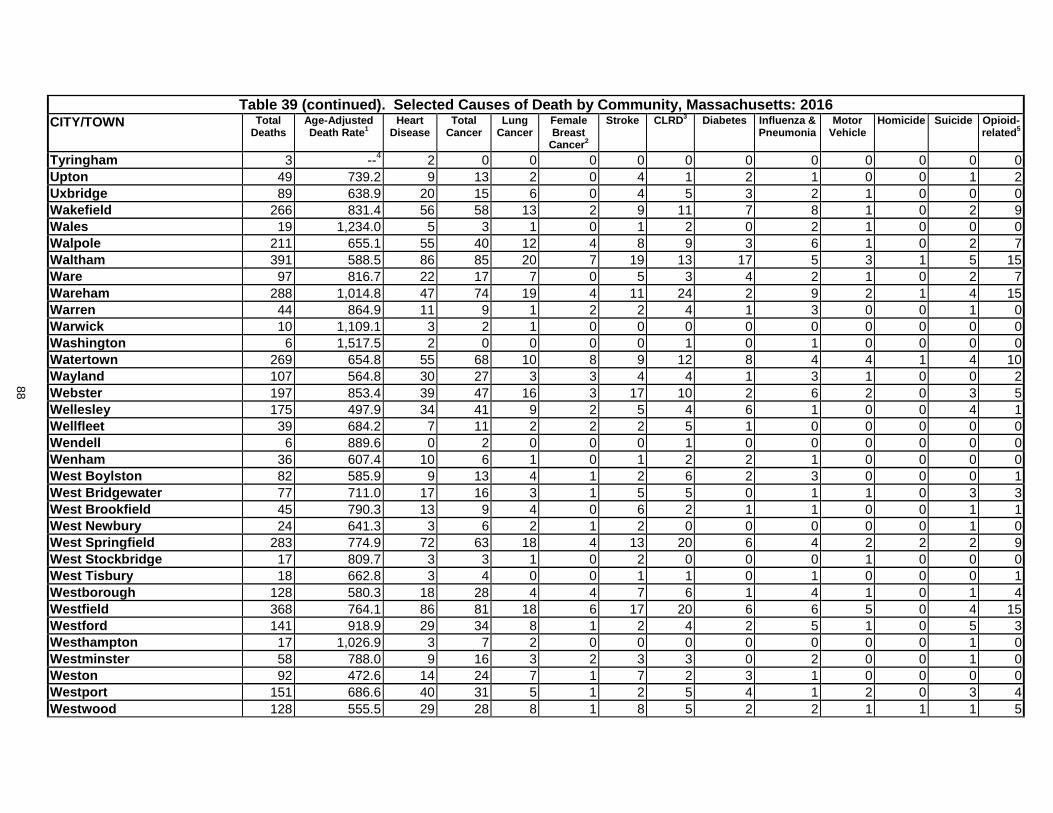
88
Table 39 (continued). Selected Causes of Death by Community, Massachusetts: 2016
CITY/TOWN Total Deaths
Age-Adjusted Death Rate
1 Heart
Disease Total
Cancer Lung
Cancer Female Breast
Cancer2
Stroke CLRD3
Diabetes Influenza & Pneumonia
Motor Vehicle
Homicide Suicide Opioid- related
5
Tyringham 3 --4 2 0 0 0 0 0 0 0 0 0 0 0
Upton 49 739.2 9 13 2 0 4 1 2 1 0 0 1 2
Uxbridge 89 638.9 20 15 6 0 4 5 3 2 1 0 0 0
Wakefield 266 831.4 56 58 13 2 9 11 7 8 1 0 2 9
Wales 19 1,234.0 5 3 1 0 1 2 0 2 1 0 0 0
Walpole 211 655.1 55 40 12 4 8 9 3 6 1 0 2 7
Waltham 391 588.5 86 85 20 7 19 13 17 5 3 1 5 15
Ware 97 816.7 22 17 7 0 5 3 4 2 1 0 2 7
Wareham 288 1,014.8 47 74 19 4 11 24 2 9 2 1 4 15
Warren 44 864.9 11 9 1 2 2 4 1 3 0 0 1 0
Warwick 10 1,109.1 3 2 1 0 0 0 0 0 0 0 0 0
Washington 6 1,517.5 2 0 0 0 0 1 0 1 0 0 0 0
Watertown 269 654.8 55 68 10 8 9 12 8 4 4 1 4 10
Wayland 107 564.8 30 27 3 3 4 4 1 3 1 0 0 2
Webster 197 853.4 39 47 16 3 17 10 2 6 2 0 3 5
Wellesley 175 497.9 34 41 9 2 5 4 6 1 0 0 4 1
Wellfleet 39 684.2 7 11 2 2 2 5 1 0 0 0 0 0
Wendell 6 889.6 0 2 0 0 0 1 0 0 0 0 0 0
Wenham 36 607.4 10 6 1 0 1 2 2 1 0 0 0 0
West Boylston 82 585.9 9 13 4 1 2 6 2 3 0 0 0 1
West Bridgewater 77 711.0 17 16 3 1 5 5 0 1 1 0 3 3
West Brookfield 45 790.3 13 9 4 0 6 2 1 1 0 0 1 1
West Newbury 24 641.3 3 6 2 1 2 0 0 0 0 0 1 0
West Springfield 283 774.9 72 63 18 4 13 20 6 4 2 2 2 9
West Stockbridge 17 809.7 3 3 1 0 2 0 0 0 1 0 0 0
West Tisbury 18 662.8 3 4 0 0 1 1 0 1 0 0 0 1
Westborough 128 580.3 18 28 4 4 7 6 1 4 1 0 1 4
Westfield 368 764.1 86 81 18 6 17 20 6 6 5 0 4 15
Westford 141 918.9 29 34 8 1 2 4 2 5 1 0 5 3
Westhampton 17 1,026.9 3 7 2 0 0 0 0 0 0 0 1 0
Westminster 58 788.0 9 16 3 2 3 3 0 2 0 0 1 0
Weston 92 472.6 14 24 7 1 7 2 3 1 0 0 0 0
Westport 151 686.6 40 31 5 1 2 5 4 1 2 0 3 4
Westwood 128 555.5 29 28 8 1 8 5 2 2 1 1 1 5
88
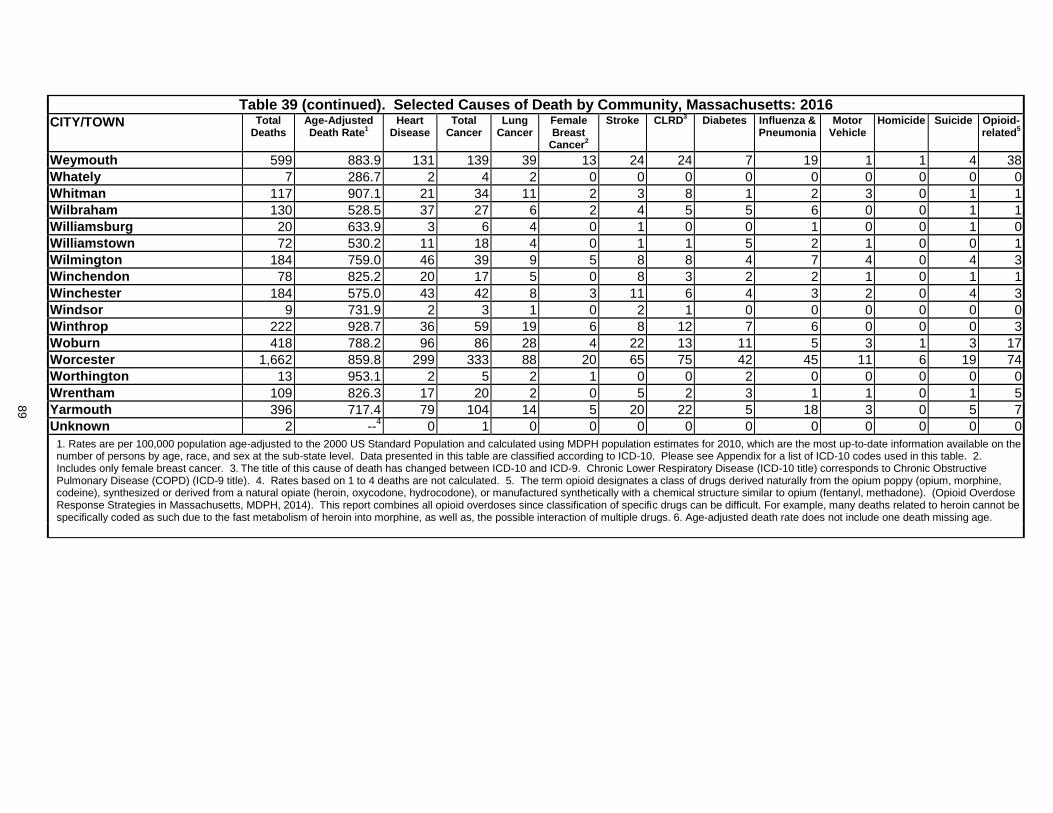
89
Table 39 (continued). Selected Causes of Death by Community, Massachusetts: 2016
CITY/TOWN Total Deaths
Age-Adjusted Death Rate
1 Heart
Disease Total
Cancer Lung
Cancer Female Breast
Cancer2
Stroke CLRD3
Diabetes Influenza & Pneumonia
Motor Vehicle
Homicide Suicide Opioid- related
5
Weymouth 599 883.9 131 139 39 13 24 24 7 19 1 1 4 38
Whately 7 286.7 2 4 2 0 0 0 0 0 0 0 0 0
Whitman 117 907.1 21 34 11 2 3 8 1 2 3 0 1 1
Wilbraham 130 528.5 37 27 6 2 4 5 5 6 0 0 1 1
Williamsburg 20 633.9 3 6 4 0 1 0 0 1 0 0 1 0
Williamstown 72 530.2 11 18 4 0 1 1 5 2 1 0 0 1
Wilmington 184 759.0 46 39 9 5 8 8 4 7 4 0 4 3
Winchendon 78 825.2 20 17 5 0 8 3 2 2 1 0 1 1
Winchester 184 575.0 43 42 8 3 11 6 4 3 2 0 4 3
Windsor 9 731.9 2 3 1 0 2 1 0 0 0 0 0 0
Winthrop 222 928.7 36 59 19 6 8 12 7 6 0 0 0 3
Woburn 418 788.2 96 86 28 4 22 13 11 5 3 1 3 17
Worcester 1,662 859.8 299 333 88 20 65 75 42 45 11 6 19 74
Worthington 13 953.1 2 5 2 1 0 0 2 0 0 0 0 0
Wrentham 109 826.3 17 20 2 0 5 2 3 1 1 0 1 5
Yarmouth 396 717.4 79 104 14 5 20 22 5 18 3 0 5 7
Unknown 2 --4 0 1 0 0 0 0 0 0 0 0 0 0
1. Rates are per 100,000 population age-adjusted to the 2000 US Standard Population and calculated using MDPH population estimates for 2010, which are the most up-to-date information available on the number of persons by age, race, and sex at the sub-state level. Data presented in this table are classified according to ICD-10. Please see Appendix for a list of ICD-10 codes used in this table. 2.
Includes only female breast cancer. 3. The title of this cause of death has changed between ICD-10 and ICD-9. Chronic Lower Respiratory Disease (ICD-10 title) corresponds to Chronic Obstructive
Pulmonary Disease (COPD) (ICD-9 title). 4. Rates based on 1 to 4 deaths are not calculated. 5. The term opioid designates a class of drugs derived naturally from the opium poppy (opium, morphine, codeine), synthesized or derived from a natural opiate (heroin, oxycodone, hydrocodone), or manufactured synthetically with a chemical structure similar to opium (fentanyl, methadone). (Opioid Overdose Response Strategies in Massachusetts, MDPH, 2014). This report combines all opioid overdoses since classification of specific drugs can be difficult. For example, many deaths related to heroin cannot be specifically coded as such due to the fast metabolism of heroin into morphine, as well as, the possible interaction of multiple drugs. 6. Age-adjusted death rate does not include one death missing age.
89
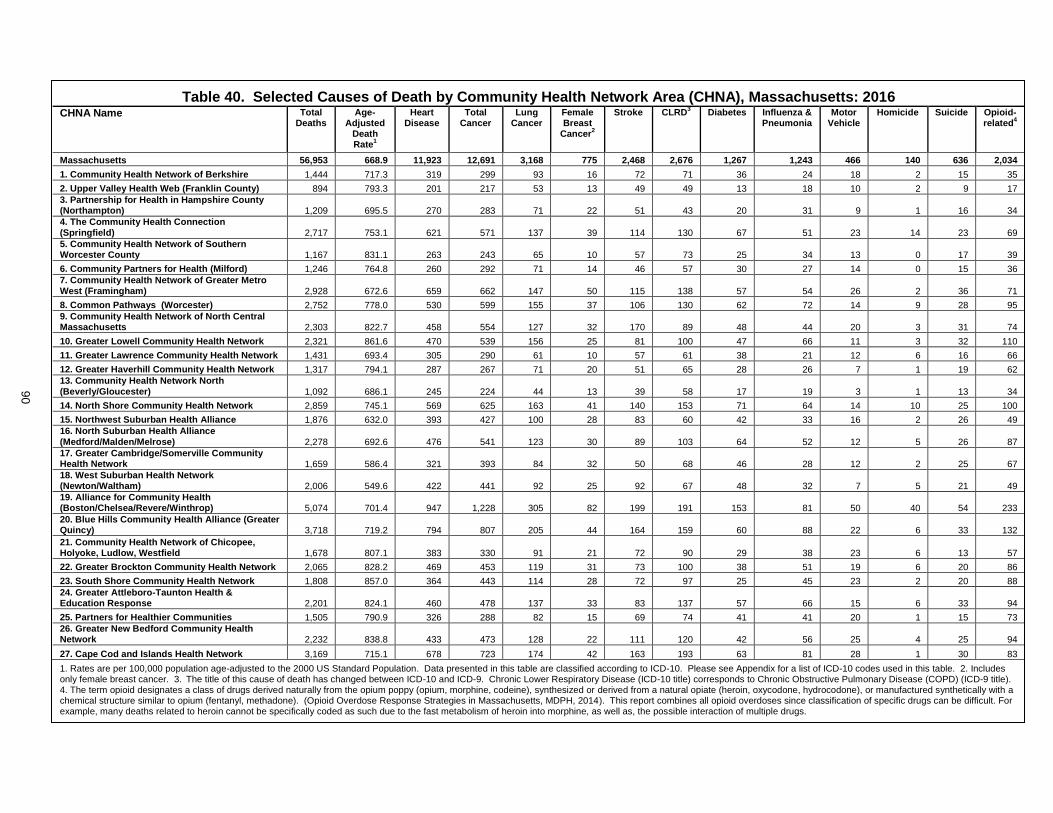
90
1. Rates are per 100,000 population age-adjusted to the 2000 US Standard Population. Data presented in this table are classified according to ICD-10. Please see Appendix for a list of ICD-10 codes used in this table. 2. Includes only female breast cancer. 3.
The title of this cause of death has changed between ICD-10 and ICD-9. Chronic Lower Respiratory Disease (ICD-10 title) corresponds to Chronic Obstructive Pulmonary Disease (COPD) (ICD-9 title).
4. The term opioid designates a class of drugs derived naturally from the opium poppy (opium, morphine, codeine), synthesized or derived from a natural opiate (heroin, oxycodone, hydrocodone), or manufactured synthetically with a chemical structure similar to opium (fentanyl, methadone). (Opioid Overdose Response Strategies in Massachusetts, MDPH, 2014). This report combines all opioid overdoses since classification of specific drugs can be difficult. For example, many deaths related to heroin cannot be specifically coded as such due to the fast metabolism of heroin into morphine, as well as, the possible interaction of multiple drugs.
Table 40. Selected Causes of Death by Community Health Network Area (CHNA), Massachusetts: 2016 CHNA Name Total
Deaths Age-
Adjusted Death Rate
1
Heart Disease
Total Cancer
Lung Cancer
Female Breast
Cancer2
Stroke CLRD3 Diabetes Influenza &
Pneumonia Motor
Vehicle Homicide Suicide Opioid-
related4
Massachusetts 56,953 668.9 11,923 12,691 3,168 775 2,468 2,676 1,267 1,243 466 140 636 2,034
1. Community Health Network of Berkshire 1,444 717.3 319 299 93 16 72 71 36 24 18 2 15 35
2. Upper Valley Health Web (Franklin County) 894 793.3 201 217 53 13 49 49 13 18 10 2 9 17
3. Partnership for Health in Hampshire County (Northampton) 1,209 695.5 270 283 71 22 51 43 20 31 9 1 16 34
4. The Community Health Connection (Springfield) 2,717 753.1 621 571 137 39 114 130 67 51 23 14 23 69
5. Community Health Network of Southern Worcester County 1,167 831.1 263 243 65 10 57 73 25 34 13 0 17 39
6. Community Partners for Health (Milford) 1,246 764.8 260 292 71 14 46 57 30 27 14 0 15 36
7. Community Health Network of Greater Metro West (Framingham) 2,928 672.6 659 662 147 50 115 138 57 54 26 2 36 71
8. Common Pathways (Worcester) 2,752 778.0 530 599 155 37 106 130 62 72 14 9 28 95
9. Community Health Network of North Central Massachusetts 2,303 822.7 458 554 127 32 170 89 48 44 20 3 31 74
10. Greater Lowell Community Health Network 2,321 861.6 470 539 156 25 81 100 47 66 11 3 32 110
11. Greater Lawrence Community Health Network 1,431 693.4 305 290 61 10 57 61 38 21 12 6 16 66
12. Greater Haverhill Community Health Network 1,317 794.1 287 267 71 20 51 65 28 26 7 1 19 62
13. Community Health Network North (Beverly/Gloucester) 1,092 686.1 245 224 44 13 39 58 17 19 3 1 13 34
14. North Shore Community Health Network 2,859 745.1 569 625 163 41 140 153 71 64 14 10 25 100
15. Northwest Suburban Health Alliance 1,876 632.0 393 427 100 28 83 60 42 33 16 2 26 49
16. North Suburban Health Alliance
(Medford/Malden/Melrose) 2,278 692.6 476 541 123 30 89 103 64 52 12 5 26 87
17. Greater Cambridge/Somerville Community Health Network 1,659 586.4 321 393 84 32 50 68 46 28 12 2 25 67
18. West Suburban Health Network (Newton/Waltham) 2,006 549.6 422 441 92 25 92 67 48 32 7 5 21 49
19. Alliance for Community Health (Boston/Chelsea/Revere/Winthrop) 5,074 701.4 947 1,228 305 82 199 191 153 81 50 40 54 233
20. Blue Hills Community Health Alliance (Greater Quincy) 3,718 719.2 794 807 205 44 164 159 60 88 22 6 33 132
21. Community Health Network of Chicopee, Holyoke, Ludlow, Westfield 1,678 807.1 383 330 91 21 72 90 29 38 23 6 13 57
22. Greater Brockton Community Health Network 2,065 828.2 469 453 119 31 73 100 38 51 19 6 20 86
23. South Shore Community Health Network 1,808 857.0 364 443 114 28 72 97 25 45 23 2 20 88
24. Greater Attleboro-Taunton Health & Education Response 2,201 824.1 460 478 137 33 83 137 57 66 15 6 33 94
25. Partners for Healthier Communities 1,505 790.9 326 288 82 15 69 74 41 41 20 1 15 73
26. Greater New Bedford Community Health Network 2,232 838.8 433 473 128 22 111 120 42 56 25 4 25 94
27. Cape Cod and Islands Health Network 3,169 715.1 678 723 174 42 163 193 63 81 28 1 30 83
90
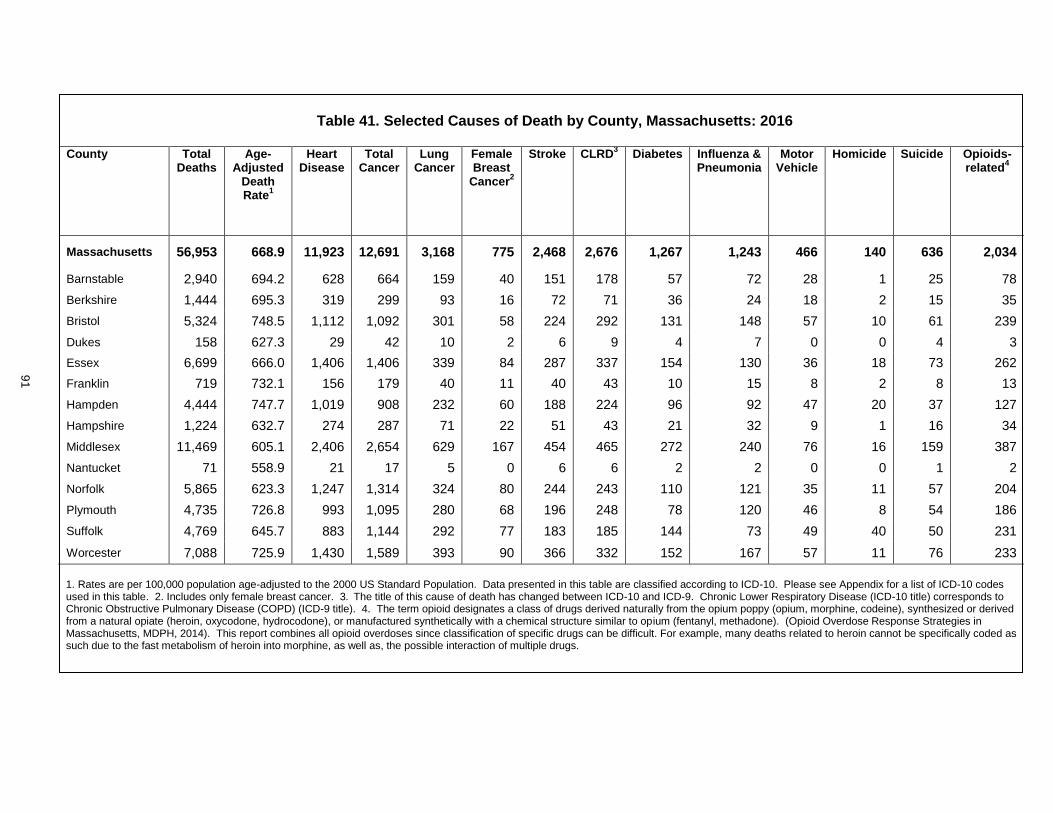
91
Table 41. Selected Causes of Death by County, Massachusetts: 2016 County Total
Deaths Age-
Adjusted Death Rate
1
Heart Disease
Total Cancer
Lung Cancer
Female Breast
Cancer2
Stroke CLRD3 Diabetes Influenza &
Pneumonia Motor
Vehicle Homicide Suicide Opioids-
related4
Massachusetts 56,953 668.9 11,923 12,691 3,168 775 2,468 2,676 1,267 1,243 466 140 636 2,034
Barnstable 2,940 694.2 628 664 159 40 151 178 57 72 28 1 25 78
Berkshire 1,444 695.3 319 299 93 16 72 71 36 24 18 2 15 35
Bristol 5,324 748.5 1,112 1,092 301 58 224 292 131 148 57 10 61 239
Dukes 158 627.3 29 42 10 2 6 9 4 7 0 0 4 3
Essex 6,699 666.0 1,406 1,406 339 84 287 337 154 130 36 18 73 262
Franklin 719 732.1 156 179 40 11 40 43 10 15 8 2 8 13
Hampden 4,444 747.7 1,019 908 232 60 188 224 96 92 47 20 37 127
Hampshire 1,224 632.7 274 287 71 22 51 43 21 32 9 1 16 34
Middlesex 11,469 605.1 2,406 2,654 629 167 454 465 272 240 76 16 159 387
Nantucket 71 558.9 21 17 5 0 6 6 2 2 0 0 1 2
Norfolk 5,865 623.3 1,247 1,314 324 80 244 243 110 121 35 11 57 204
Plymouth 4,735 726.8 993 1,095 280 68 196 248 78 120 46 8 54 186
Suffolk 4,769 645.7 883 1,144 292 77 183 185 144 73 49 40 50 231
Worcester 7,088 725.9 1,430 1,589 393 90 366 332 152 167 57 11 76 233
1. Rates are per 100,000 population age-adjusted to the 2000 US Standard Population. Data presented in this table are classified according to ICD-10. Please see Appendix for a list of ICD-10 codes used in this table. 2. Includes only female breast cancer. 3.
The title of this cause of death has changed between ICD-10 and ICD-9. Chronic Lower Respiratory Disease (ICD-10 title) corresponds to
Chronic Obstructive Pulmonary Disease (COPD) (ICD-9 title). 4. The term opioid designates a class of drugs derived naturally from the opium poppy (opium, morphine, codeine), synthesized or derived from a natural opiate (heroin, oxycodone, hydrocodone), or manufactured synthetically with a chemical structure similar to opium (fentanyl, methadone). (Opioid Overdose Response Strategies in Massachusetts, MDPH, 2014). This report combines all opioid overdoses since classification of specific drugs can be difficult. For example, many deaths related to heroin cannot be specifically coded as such due to the fast metabolism of heroin into morphine, as well as, the possible interaction of multiple drugs.
91

92
TECHNICAL NOTES DATA SOURCES Data for this document are derived from Massachusetts death certificates, Massachusetts birth certificates, the US Census, the Massachusetts Institute for Social and Economic Research (MISER) (population data pre-2000), and the National Center for Health Statistics (NCHS). CHANGES TO MORTALITY DATA, EFFECTIVE 1999 Beginning with data year 1999, two major changes in Federal classification and tabulation procedures occurred that affects the tabulation and analyses of mortality data over time. First, a new revision for classifying causes of death was implemented: The International Classification of Diseases, Tenth Revision (ICD-10) replaced the International Classification of Diseases, Ninth Revision (ICD-9) for coding all mortality data. Second, a new standard population for the tabulation of age-adjusted mortality rates was also implemented. CHANGES TO THE PRESENTATION OF RACE AND ETHNICITY DATA The 2003 revision of the Standard Certificate of Death allows the reporting of more than one race in accordance with the revised standards issued by the Office of Management and Budget (OMB) in 1997. The revised standards require federal data collection programs to allow respondents to select one or more race categories. In order to provide uniformity and comparability of the data during the transition period, before multiple-race data are available for all reporting areas, it is necessary to “bridge” the responses of those who reported more than one race to a single-race. The method used to bridge responses for those who report more than one race to a single race is based on a procedure whereby multiple races are assigned to the smallest minority group first (i.e. Asian and White becomes Asian or Black and Native American becomes Native American). All multiple races that include Hispanic will be assigned as Hispanic and this group also includes all respondents who reported Hispanic ethnicities as well.
Decedent Race
American Indian/Alaska Native (specify tribal
nation): __________
Asian
Black
Guamanian or Chamorro
Hispanic/Latino/Black
Hispanic/Latino/White
Hispanic/Latino/Other(specify): __________
Native Hawaiian
Samoan
White
Other Pacific Islander (specify):__________
Other race not listed (specify): __________
Refused
Not obtainable
Unknown
Decedent Race
Enter race to appear on death certificate: _______________________________
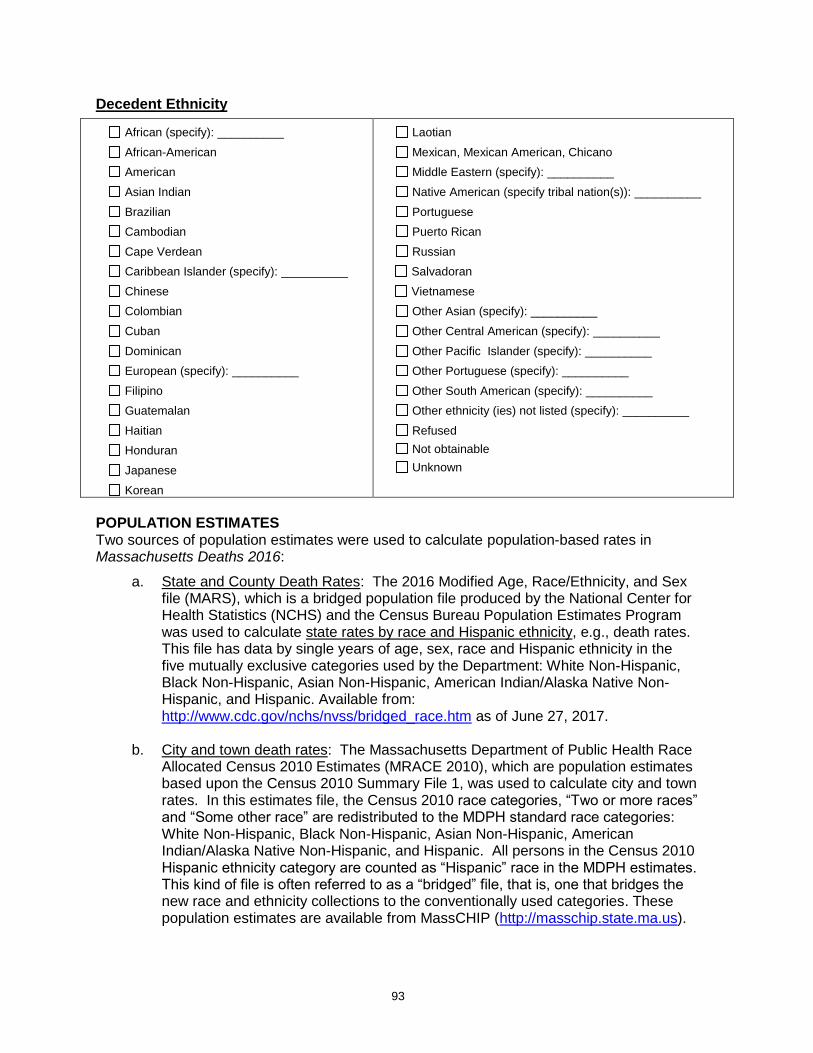
93
Decedent Ethnicity
African (specify): __________
African-American
American
Asian Indian
Brazilian
Cambodian
Cape Verdean
Caribbean Islander (specify): __________
Chinese
Colombian
Cuban
Dominican
European (specify): __________
Filipino
Guatemalan
Haitian
Honduran
Japanese
Korean
Laotian
Mexican, Mexican American, Chicano
Middle Eastern (specify): __________
Native American (specify tribal nation(s)): __________
Portuguese
Puerto Rican
Russian
Salvadoran
Vietnamese
Other Asian (specify): __________
Other Central American (specify): __________
Other Pacific Islander (specify): __________
Other Portuguese (specify): __________
Other South American (specify): __________
Other ethnicity (ies) not listed (specify): __________
Refused
Not obtainable
Unknown
POPULATION ESTIMATES Two sources of population estimates were used to calculate population-based rates in Massachusetts Deaths 2016:
a. State and County Death Rates: The 2016 Modified Age, Race/Ethnicity, and Sex file (MARS), which is a bridged population file produced by the National Center for Health Statistics (NCHS) and the Census Bureau Population Estimates Program was used to calculate state rates by race and Hispanic ethnicity, e.g., death rates. This file has data by single years of age, sex, race and Hispanic ethnicity in the five mutually exclusive categories used by the Department: White Non-Hispanic, Black Non-Hispanic, Asian Non-Hispanic, American Indian/Alaska Native Non-Hispanic, and Hispanic. Available from: http://www.cdc.gov/nchs/nvss/bridged_race.htm as of June 27, 2017.
b. City and town death rates: The Massachusetts Department of Public Health Race Allocated Census 2010 Estimates (MRACE 2010), which are population estimates based upon the Census 2010 Summary File 1, was used to calculate city and town rates. In this estimates file, the Census 2010 race categories, “Two or more races” and “Some other race” are redistributed to the MDPH standard race categories: White Non-Hispanic, Black Non-Hispanic, Asian Non-Hispanic, American Indian/Alaska Native Non-Hispanic, and Hispanic. All persons in the Census 2010 Hispanic ethnicity category are counted as “Hispanic” race in the MDPH estimates. This kind of file is often referred to as a “bridged” file, that is, one that bridges the new race and ethnicity collections to the conventionally used categories. These population estimates are available from MassCHIP (http://masschip.state.ma.us).

94
LIMITATIONS OF SMALL NUMBERS Cells in some tables contain small numbers. Rates and proportions based on fewer than five observations are suppressed, and trends based upon small numbers should be interpreted cautiously. APPLYING COMPARABILITY RATIOS TO EXAMINE TRENDS IN MORTALITY Beginning with 1999, mortality data are coded according to the International Classification of Diseases Tenth Revision (ICD-10). Due to the changes in coding rules, comparison of mortality trends over time using different revisions of ICD is challenging. A method was devised to assess if changes in causes of death are “real” changes, or due to the new classification system. Using this method, death data for 1996 were coded twice; once according to ICD-9 and again according to ICD-10. A comparability ratio (CR) was then calculated by dividing the number of deaths coded according to ICD-10 by the number of deaths coded according to the most similar codes in ICD-9 (please refer to Table A4. Preliminary Comparability Ratios for a list of codes and CR used in this publication). A CR of 1.00 indicates that the same number of deaths was assigned to a cause of death whether ICD-9 or ICD-10 was used. A CR of less than 1.00 results from 1) a decrease in the number of deaths assigned to a cause in ICD-10 compared with ICD-9 or 2) the cause described in ICD-10 is only a part of the ICD-9 title to which it is being compared. A CR of more than 1.00 results from 1) an increase in the assignments of deaths to a cause in ICD-10 compared with ICD-9 or 2) the ICD-10 title is broader than the ICD-9 title to which it is being compared. EXAMPLE: Influenza and Pneumonia
1 Deaths: Massachusetts, 1996-2000
Year Age-adjusted
rate2
Comparability Ratio Comparability Modified Rate (=Age-Adjusted Rate*Comparability Ratio)
1996 41.5 0.6982 29.0 1997 39.1 0.6982 27.3 1998 40.2 0.6982 28.1
1999 30.3 2000 29.3 1. Influenza and pneumonia defined as ICD-9: 480-487 for years 1996-1998 and ICD-10: J10-J18 for year 1999 and 2000. 2. Age-adjusted to the 2000 US standard population, per 100,000.
If you look only at the age-adjusted rate over time, not taking the ICD coding changes into account, it appears that deaths from influenza and pneumonia have decreased between 1996-1999. However, because the coding rules changed between ICD-9 and ICD-10 revisions, we need to apply the comparability ratio to the rates for 1996-1998. (This is done by multiplying the age-adjusted rate by the comparability ratio.) Now we can make a fairer comparison and examine the changes between the comparability modified rate and the 1999 or 2000 rate. We see that deaths to influenza and pneumonia have remained constant between 1996-2000, and have actually increased between 1998 and 1999 (28.1 to 30.3 per 100,000, respectively) after taking the changes in the classification system into account. PLEASE NOTE: the comparability ratios used in this report are based on the Preliminary Comparability Study conducted by the National Center for Health Statistics (NCHS), February 2001, and are subject to change once the Final Comparability Study is completed.

95
TESTS OF STATISTICAL SIGNIFICANCE Beginning with Massachusetts Deaths 2004, statistics presented in the text section have been tested to determine whether they differ significantly from a target statistic. For example, the number of deaths in 2008 was compared with the number of deaths in 2007 to determine whether their difference was unlikely to have occurred by chance. When a difference is unlikely to have occurred by chance, it is referred to as “significant.” Note: With respect to statistical difference, the language of this year’s report differs from the language of reports prior to 2004, and caution must be used when comparing the text of previous reports with this year’s report. In testing for statistical significance, we have used the testing methods from the National Center for Health Statistics (NCHS). These methods are presented in the following document:
National Vital Statistics Reports, Volume 52, Number 10 Births: Final Data for 2002 by Joyce A. Martin, M.P.H.; Brady E. Hamilton, Ph.D.; Paul D. Sutton, Ph.D.; Stephanie J. Ventura, M.A.; Fay Menacker, Dr. P.H.; and Martha L. Munson, M.S.; From the Division of Vital Statistics, NCHS. (Technical Notes, “Significance testing” section begins on page 110).
This document is available from the following website: http://www.cdc.gov/nchs/products/pubs/pubd/nvsr/52/52-23.htm For comparisons of more than 100 events, whether they are rates, proportions, or numbers, the binomial distribution is assumed, and confidence intervals are examined to see whether they overlap (Refer to the “Confidence Intervals” section in the next page for an explanation of using confidence intervals to determine statistical significance). When the number of events is less than 100, a Poisson distribution is assumed, and confidence intervals are constructed based upon the Poisson distribution. For more details and exact formulas for calculating confidence intervals or other tests of statistical significance, refer to the publication listed above. When two statistics are determined to differ significantly, they are referred to in the text as being “significantly” different, either lower or higher than the statistic of comparison.

96
CONFIDENCE INTERVALS The confidence interval (CI) provides a measure of rate stability and a basis for comparing rates to determine if they are statistically different. Rates can be compared for the same group in different years or for different groups in the same year. The width of the CI reflects the stability of the rate. For example, a narrow CI reflects high stability, and a wide CI reflects low stability. If the CIs around two rates being compared do not overlap, the difference between the two rates is statistically significant. The following table and chart illustrate the concept of statistically significant differences using actual infant mortality data from 1989, 1993, 1996, and 2000.
Comparison of Infant Mortality Rates and Confidence Intervals for Selected Years
Year IMR (per 1,000 births) 95% Confidence Interval
1989 7.6 (7.0-8.2)
1993 6.2 (5.7-6.7)
1996 5.0 (4.5-5.5)
2000 4.6 (4.2-5.1)
(1989) 7.0 7.6 8.2
(1993) 5.7 6.2 6.7
(1996) 4.5 5.0 5.5
(2000) 4.2 4.6 5.1
4.5 5.0 6.0 7.0 8.0 8.5
Infant Deaths per 1,000 Live Births
The difference between the 1993 IMR and 1996 IMR is statistically significant – the confidence intervals do not overlap. The same is true for the differences between the 1989 IMR and each annual IMR for 1993, 1996, and 2000. However, the difference between the 1996 and 2000 IMRs is not statistically significant, since their confidence intervals overlap.

97
GLOSSARY
Age-Adjusted Rate A summary rate designed to minimize the distortions created by differences in age distribution when comparing rates for populations with different age compositions. Age-adjusted rates are useful when comparing death rates from different populations or in the same population over time. For example, if one wished to compare the 1998 death rates between Barnstable County and Hampshire County, the age-adjusted formula would account for the fact that 24% of the Barnstable County residents were 65 years of age or older, whereas only 11% of the Hampshire County residents were in this age group. Age-adjusted rates are calculated by weighting the age-specific rates for a given year by the age distribution of a standard population. The weighted age-specific rates are then added to produce the adjusted rate for all ages combined. (Please see example below). The 2000 US projected population is used as the standard population in this document for consistency with data published by the National Center for Health Statistics (NCHS). Only rates using the same standard population can be compared. All age-adjusted rates published in this report have been re-calculated using the 2000 US standard population. These rates should NOT be compared with age-adjusted rates previously published that used the 1940 US standard population.
Example: Calculation of 1999 Age-Adjusted Mortality Rate Massachusetts: All Causes of Death
A B C D E F G
Age group
(in years)
# of deaths (1999)
Population (1998)
1940 US standard
2000 US standard
Age-adjusted rate (using1940 standard)
=[((B/C)*D)*100,000]
Age-adjusted rate (using 2000 standard)
=[((B/C)*E)*100,000]
< 1 418 79,860 0.015343 0.013818 8.0 7.2 1-4 65 320,000 0.064718 0.055317 1.3 1.1
5-14 100 806,670 0.170355 0.145565 2.1 1.8 15-24 407 883,830 0.181677 0.138646 8.4 6.4 25-34 701 1,005,337 0.162066 0.135573 11.3 9.5 35-44 1,696 1,019,365 0.139237 0.162613 23.2 27.1 45-54 2,870 818,660 0.117811 0.134834 41.3 47.3 55-64 4,561 495,555 0.080294 0.087247 73.9 80.3 65-74 9,782 442,003 0.048426 0.066037 107.2 146.1 75-84 17,397 299,482 0.017303 0.044842 100.5 260.5
85+ 17,765 120,501 0.002770 0.015508 40.8 228.6
Total 418.0 815.9
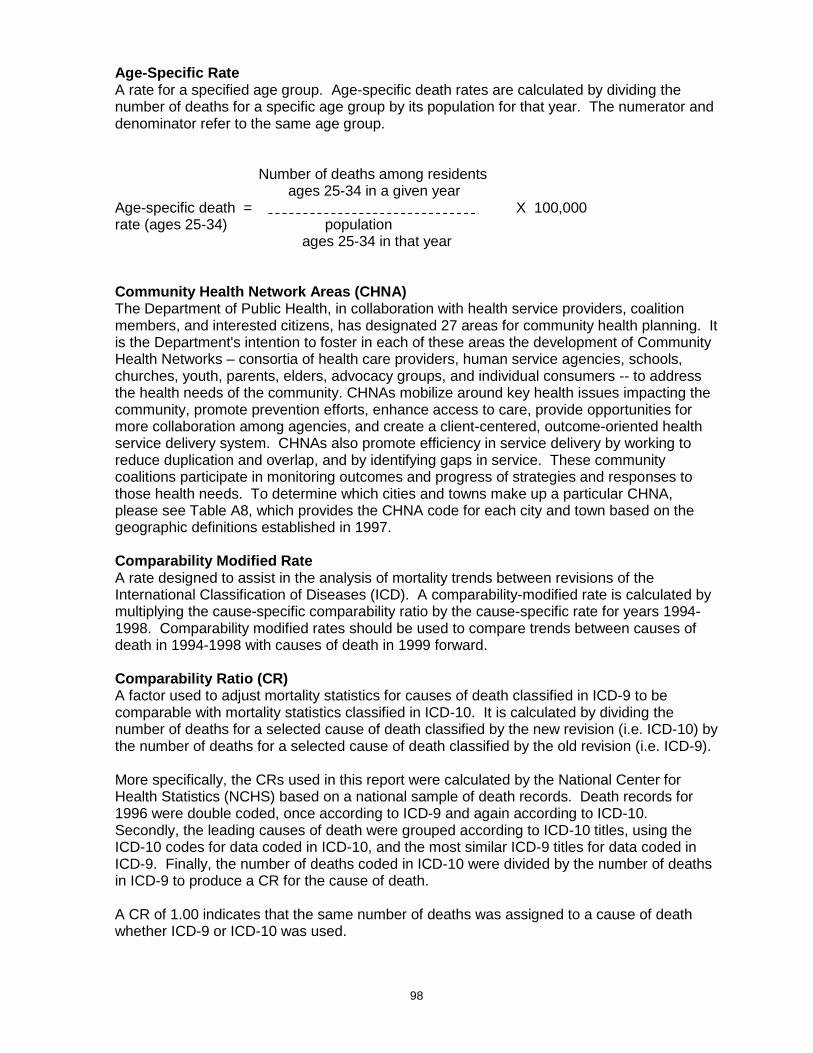
98
Age-Specific Rate A rate for a specified age group. Age-specific death rates are calculated by dividing the number of deaths for a specific age group by its population for that year. The numerator and denominator refer to the same age group.
Number of deaths among residents ages 25-34 in a given year Age-specific death = X 100,000 rate (ages 25-34) population ages 25-34 in that year Community Health Network Areas (CHNA) The Department of Public Health, in collaboration with health service providers, coalition members, and interested citizens, has designated 27 areas for community health planning. It is the Department's intention to foster in each of these areas the development of Community Health Networks – consortia of health care providers, human service agencies, schools, churches, youth, parents, elders, advocacy groups, and individual consumers -- to address the health needs of the community. CHNAs mobilize around key health issues impacting the community, promote prevention efforts, enhance access to care, provide opportunities for more collaboration among agencies, and create a client-centered, outcome-oriented health service delivery system. CHNAs also promote efficiency in service delivery by working to reduce duplication and overlap, and by identifying gaps in service. These community coalitions participate in monitoring outcomes and progress of strategies and responses to those health needs. To determine which cities and towns make up a particular CHNA, please see Table A8, which provides the CHNA code for each city and town based on the geographic definitions established in 1997. Comparability Modified Rate A rate designed to assist in the analysis of mortality trends between revisions of the International Classification of Diseases (ICD). A comparability-modified rate is calculated by multiplying the cause-specific comparability ratio by the cause-specific rate for years 1994-1998. Comparability modified rates should be used to compare trends between causes of death in 1994-1998 with causes of death in 1999 forward. Comparability Ratio (CR) A factor used to adjust mortality statistics for causes of death classified in ICD-9 to be comparable with mortality statistics classified in ICD-10. It is calculated by dividing the number of deaths for a selected cause of death classified by the new revision (i.e. ICD-10) by the number of deaths for a selected cause of death classified by the old revision (i.e. ICD-9). More specifically, the CRs used in this report were calculated by the National Center for Health Statistics (NCHS) based on a national sample of death records. Death records for 1996 were double coded, once according to ICD-9 and again according to ICD-10. Secondly, the leading causes of death were grouped according to ICD-10 titles, using the ICD-10 codes for data coded in ICD-10, and the most similar ICD-9 titles for data coded in ICD-9. Finally, the number of deaths coded in ICD-10 were divided by the number of deaths in ICD-9 to produce a CR for the cause of death. A CR of 1.00 indicates that the same number of deaths was assigned to a cause of death whether ICD-9 or ICD-10 was used.
99
A CR of less than 1.00 results from 1) a decrease in the number of deaths assigned to a cause in ICD-10 compared with ICD-9 or 2) the cause described in ICD-10 is only a part of the ICD-9 title to which it is being compared. A CR of more than 1.00 results from 1) an increase in the assignments of deaths to a cause in ICD-10 compared with ICD-9 or 2) the ICD-10 title is broader than the ICD-9 title to which it is being compared. Preliminary comparability ratios supplied by the National Center for Health Statistics (NCHS) in February 2001 are used in this report (see Table A4 and A5). See also, comparability modified rate. Crude Death Rate An estimate of the proportion of a population that died during the year. The numerator is the number of persons who died during the year and the denominator is the size of the population. The death rate in a population is calculated by the formula: Number of resident deaths in a year Crude death rate = X 100,000 Number of residents Death Certificate A vital record can be signed by a licensed physician doctor (which includes ME’s) or a Nurse Practitioner. Starting in 2016 Physician Assistants (PA) could also sign. Some of the data elements found on the death certificate are cause of death, decedent's name, gender, birth date, place of residence, and place of occurrence. (A copy of the Massachusetts death certificate used is in the Appendix). In a properly completed death certificate, the immediate cause of death is recorded on line 29a. The other mentioned causes are written on lines 29 b-d. The underlying cause of death is the disease or injury that initiated the events leading to the death. All causes of death are data entered and processed by a software program supplied by NCHS. This software assigns the appropriate ICD-10 codes. Trained nosologists review the ICD-10 codes assigned. International Classification of Diseases, Ninth Revision (ICD-9) The International Classification of Diseases (ICD) classifies mortality information for statistical purposes. The ICD was first used in 1900 and has since been revised about every 10 years, with the exception of the ICD-9, which was in use between 1979-1998. Mortality data in this report was coded using ICD-10 codes, though a comparison between these ICD-10 codes and their corresponding ICD-9 codes is presented in Tables A1-A6. Because of coding changes between the Ninth and Tenth revision, caution should be used when comparing data coded under ICD-9 and ICD-10. International Classification of Diseases, Tenth Revision (ICD-10) Since 1999, the tenth revision of the International Classification of Diseases has been used to code mortality data. For a list of ICD-10 codes used in the publication, please see Tables A1, A4, and A5. Because of coding changes between the Ninth and Tenth revision, caution should be used when comparing data coded under ICD-9 and ICD-10.
100
Life Expectancy at Birth Life expectancy at birth is based on the expected age at death for a newborn infant, based upon the actual experience of mortality of the population in Massachusetts. NCHS National Center for Health Statistics (US Department of Health and Human Services, Centers for Disease Control and Prevention). Occurrence Death Occurrence deaths include all deaths that occur within the state, including deaths of nonresidents. An interstate exchange agreement among the 50 states, Washington, DC, Canada, the US Virgin Islands, and Guam provides for exchanges of copies of birth and death records. These out-of-state records are used for statistical purposes only and allow each state or province to track the births and deaths of residents. Opioid The term opioid designates a class of drugs derived naturally from the opium poppy (opium, morphine, codeine), synthesized or derived from a natural opiate (heroin, oxycodone, hydrocodone), or manufactured synthetically with a chemical structure similar to opium (fentanyl, methadone). (Opioid Overdose Response Strategies in Massachusetts, MDPH, 2014) This report combines all opioid overdoses since classification of specific drugs can be difficult. For example, many deaths related to heroin cannot be specifically coded as such due to the fast metabolism of heroin into morphine, as well as, the possible interaction of multiple drugs. Other and Unspecified Narcotics (T40.6) The Injury Surveillance Workgroup (ISW7) Consensus Recommendations for national and state poisoning surveillance (Safe States Alliance, 2012) states that this category is intended for other and unspecified drugs classified pharmacologically as narcotics (opioids/opiates). However, in practice it may also be used for drugs classified legally as narcotics such as cocaine. The proportion of this category made up by opioids/opiates varies by jurisdiction, so inclusion of this code depends on more detailed analysis of death certificate text and/or medical examiner records. Reviews in Massachusetts indicate that most deaths classified as T40.6 were opioid-related overdose deaths. For that reason, we include T40.6 in our opioid-related definition. Premature Mortality Rate Premature mortality rate (PMR) measures the rate of premature death, that is, death before the age of 75 years, and it is given as a rate per 100,000 and it is adjusted to the 2000 US population. PMR is considered the best single measure to reflect the health status of a population. Resident Death The death of a person whose usual place of residence or permanent address (as reported by the informant) is in one of the 351 cities or towns of Massachusetts, regardless of where the death took place. Unless otherwise noted, all data in this publication are resident data. An interstate exchange agreement among the 50 states, Washington, DC, Canada, the US Virgin Islands, and Guam provides for exchange of copies of birth and death records. These records are used for statistical purposes only and allow each state or province to track the births and deaths of residents.
101
Underlying Cause of Death The disease or injury that initiated the series of events leading to death, or the circumstances of the unintentional or intentional injury that resulted in the death. The underlying cause of death is used for all analyses published in this report except for diabetes mortality.
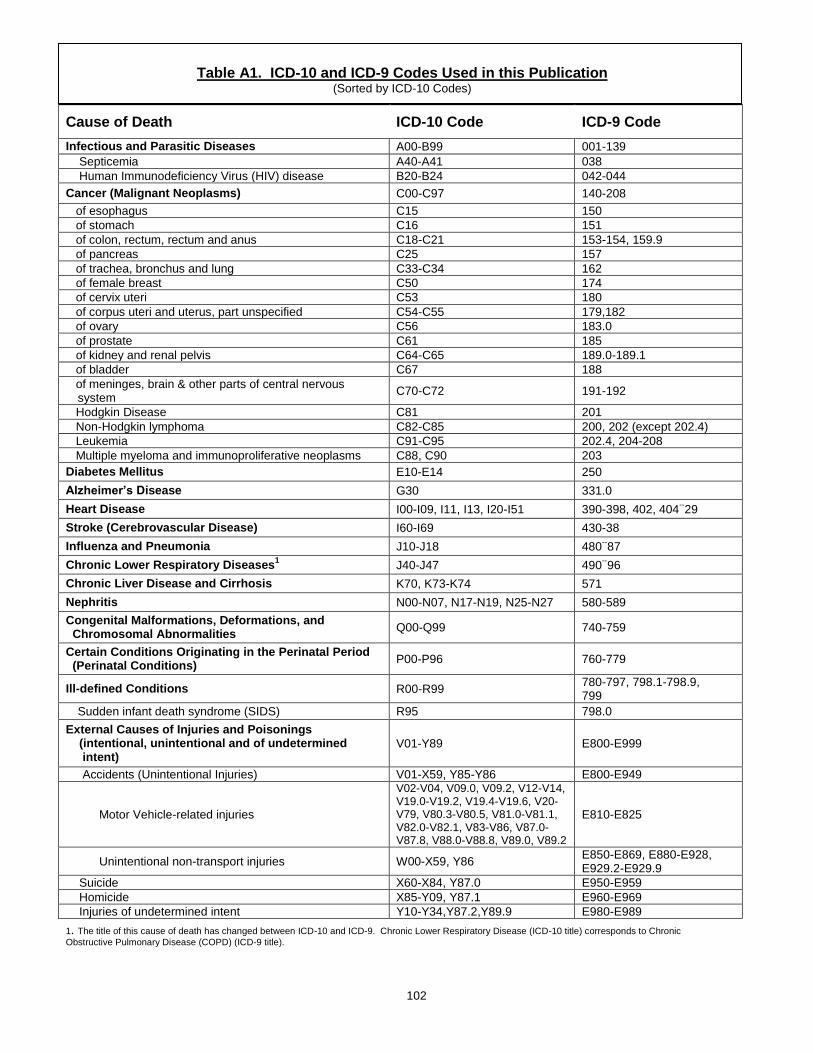
102
Table A1. ICD-10 and ICD-9 Codes Used in this Publication (Sorted by ICD-10 Codes)
Cause of Death ICD-10 Code ICD-9 Code
Infectious and Parasitic Diseases A00-B99 001-139
Septicemia A40-A41 038
Human Immunodeficiency Virus (HIV) disease B20-B24 042-044
Cancer (Malignant Neoplasms) C00-C97 140-208
of esophagus C15 150
of stomach C16 151
of colon, rectum, rectum and anus C18-C21 153-154, 159.9
of pancreas C25 157
of trachea, bronchus and lung C33-C34 162
of female breast C50 174
of cervix uteri C53 180
of corpus uteri and uterus, part unspecified C54-C55 179,182
of ovary C56 183.0
of prostate C61 185
of kidney and renal pelvis C64-C65 189.0-189.1
of bladder C67 188
of meninges, brain & other parts of central nervous system
C70-C72 191-192
Hodgkin Disease C81 201
Non-Hodgkin lymphoma C82-C85 200, 202 (except 202.4)
Leukemia C91-C95 202.4, 204-208
Multiple myeloma and immunoproliferative neoplasms C88, C90 203
Diabetes Mellitus E10-E14 250
Alzheimer’s Disease G30 331.0
Heart Disease I00-I09, I11, I13, I20-I51 390-398, 402, 404--29
Stroke (Cerebrovascular Disease) I60-I69 430-38
Influenza and Pneumonia J10-J18 480--87
Chronic Lower Respiratory Diseases1 J40-J47 490
--96
Chronic Liver Disease and Cirrhosis K70, K73-K74 571
Nephritis N00-N07, N17-N19, N25-N27 580-589
Congenital Malformations, Deformations, and Chromosomal Abnormalities
Q00-Q99 740-759
Certain Conditions Originating in the Perinatal Period (Perinatal Conditions)
P00-P96 760-779
Ill-defined Conditions R00-R99 780-797, 798.1-798.9, 799
Sudden infant death syndrome (SIDS) R95 798.0
External Causes of Injuries and Poisonings (intentional, unintentional and of undetermined intent)
V01-Y89 E800-E999
Accidents (Unintentional Injuries) V01-X59, Y85-Y86 E800-E949
Motor Vehicle-related injuries
V02-V04, V09.0, V09.2, V12-V14, V19.0-V19.2, V19.4-V19.6, V20-V79, V80.3-V80.5, V81.0-V81.1, V82.0-V82.1, V83-V86, V87.0-V87.8, V88.0-V88.8, V89.0, V89.2
E810-E825
Unintentional non-transport injuries W00-X59, Y86 E850-E869, E880-E928, E929.2-E929.9
Suicide X60-X84, Y87.0 E950-E959
Homicide X85-Y09, Y87.1 E960-E969
Injuries of undetermined intent Y10-Y34,Y87.2,Y89.9 E980-E989
1. The title of this cause of death has changed between ICD-10 and ICD-9. Chronic Lower Respiratory Disease (ICD-10 title) corresponds to Chronic
Obstructive Pulmonary Disease (COPD) (ICD-9 title).
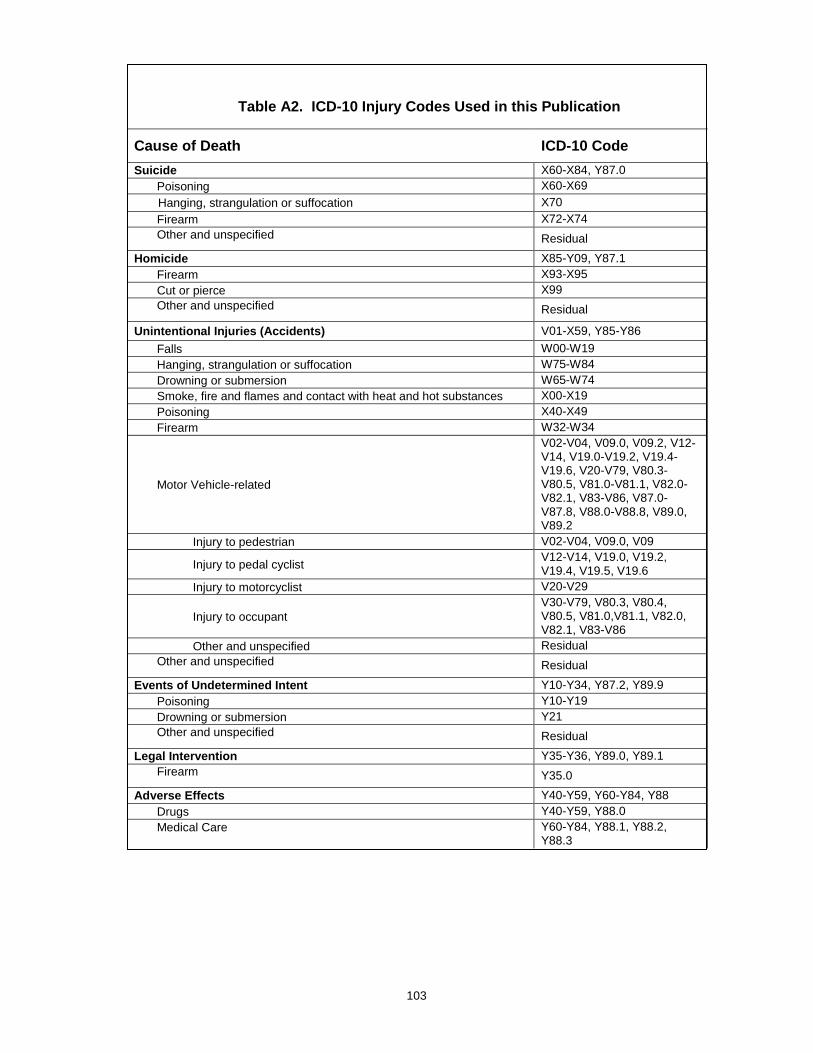
103
Table A2. ICD-10 Injury Codes Used in this Publication
Cause of Death ICD-10 Code
Suicide X60-X84, Y87.0
Poisoning X60-X69
Hanging, strangulation or suffocation X70
Firearm X72-X74
Other and unspecified
Residual
Homicide X85-Y09, Y87.1
Firearm X93-X95
Cut or pierce X99
Other and unspecified
Residual
Unintentional Injuries (Accidents) V01-X59, Y85-Y86
Falls W00-W19
Hanging, strangulation or suffocation W75-W84
Drowning or submersion W65-W74
Smoke, fire and flames and contact with heat and hot substances X00-X19
Poisoning X40-X49
Firearm W32-W34
Motor Vehicle-related
V02-V04, V09.0, V09.2, V12-V14, V19.0-V19.2, V19.4-V19.6, V20-V79, V80.3-V80.5, V81.0-V81.1, V82.0-V82.1, V83-V86, V87.0-V87.8, V88.0-V88.8, V89.0, V89.2
Injury to pedestrian V02-V04, V09.0, V09
Injury to pedal cyclist V12-V14, V19.0, V19.2, V19.4, V19.5, V19.6
Injury to motorcyclist V20-V29
Injury to occupant
V30-V79, V80.3, V80.4, V80.5, V81.0,V81.1, V82.0, V82.1, V83-V86
Other and unspecified Residual
Other and unspecified
Residual
Events of Undetermined Intent Y10-Y34, Y87.2, Y89.9
Poisoning Y10-Y19
Drowning or submersion Y21
Other and unspecified
Residual
Legal Intervention Y35-Y36, Y89.0, Y89.1
Firearm
Y35.0
Adverse Effects Y40-Y59, Y60-Y84, Y88
Drugs Y40-Y59, Y88.0
Medical Care
Y60-Y84, Y88.1, Y88.2, Y88.3
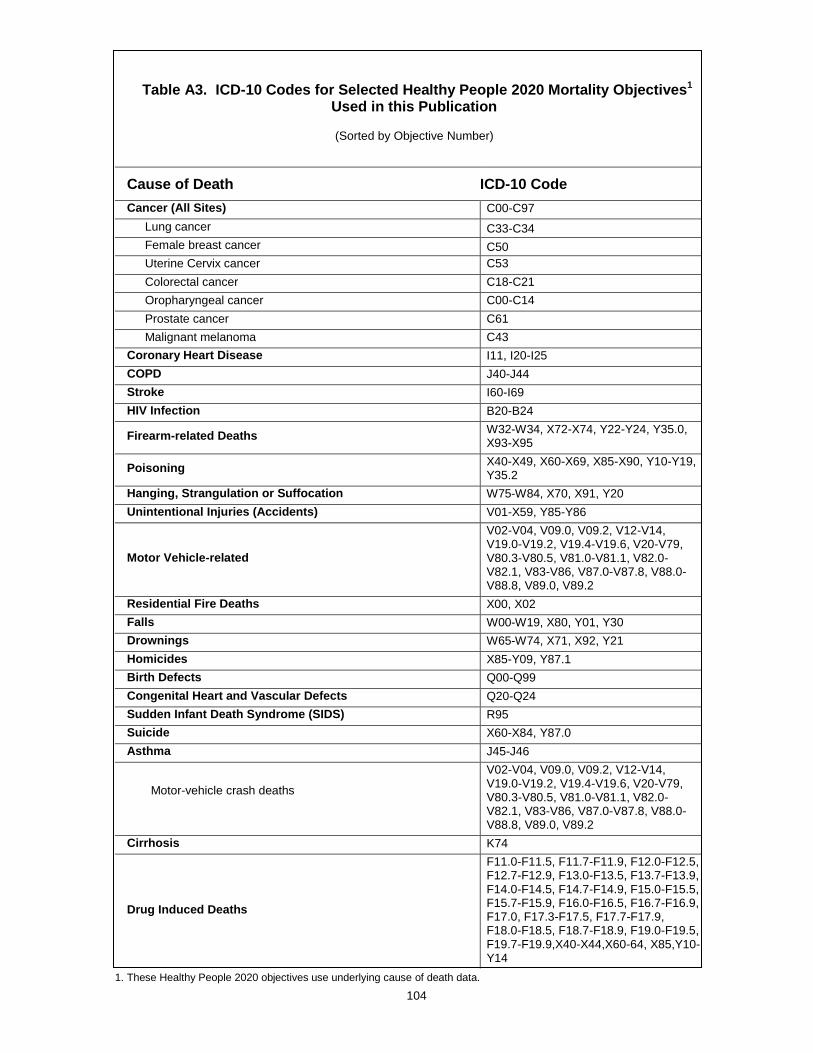
104
Table A3. ICD-10 Codes for Selected Healthy People 2020 Mortality Objectives1
Used in this Publication
(Sorted by Objective Number)
Cause of Death ICD-10 Code
Cancer (All Sites) C00-C97
Lung cancer C33-C34
Female breast cancer C50
Uterine Cervix cancer C53
Colorectal cancer C18-C21
Oropharyngeal cancer C00-C14
Prostate cancer C61
Malignant melanoma C43
Coronary Heart Disease I11, I20-I25
COPD J40-J44
Stroke I60-I69
HIV Infection B20-B24
Firearm-related Deaths W32-W34, X72-X74, Y22-Y24, Y35.0, X93-X95
Poisoning X40-X49, X60-X69, X85-X90, Y10-Y19, Y35.2
Hanging, Strangulation or Suffocation W75-W84, X70, X91, Y20
Unintentional Injuries (Accidents) V01-X59, Y85-Y86
Motor Vehicle-related
V02-V04, V09.0, V09.2, V12-V14, V19.0-V19.2, V19.4-V19.6, V20-V79, V80.3-V80.5, V81.0-V81.1, V82.0-V82.1, V83-V86, V87.0-V87.8, V88.0-V88.8, V89.0, V89.2
Residential Fire Deaths X00, X02
Falls W00-W19, X80, Y01, Y30
Drownings W65-W74, X71, X92, Y21
Homicides X85-Y09, Y87.1
Birth Defects Q00-Q99
Congenital Heart and Vascular Defects Q20-Q24
Sudden Infant Death Syndrome (SIDS) R95
Suicide X60-X84, Y87.0
Asthma J45-J46
Motor-vehicle crash deaths
V02-V04, V09.0, V09.2, V12-V14, V19.0-V19.2, V19.4-V19.6, V20-V79, V80.3-V80.5, V81.0-V81.1, V82.0-V82.1, V83-V86, V87.0-V87.8, V88.0-V88.8, V89.0, V89.2
Cirrhosis K74
Drug Induced Deaths
F11.0-F11.5, F11.7-F11.9, F12.0-F12.5, F12.7-F12.9, F13.0-F13.5, F13.7-F13.9, F14.0-F14.5, F14.7-F14.9, F15.0-F15.5, F15.7-F15.9, F16.0-F16.5, F16.7-F16.9, F17.0, F17.3-F17.5, F17.7-F17.9, F18.0-F18.5, F18.7-F18.9, F19.0-F19.5, F19.7-F19.9,X40-X44,X60-64, X85,Y10-Y14
1. These Healthy People 2020 objectives use underlying cause of death data.
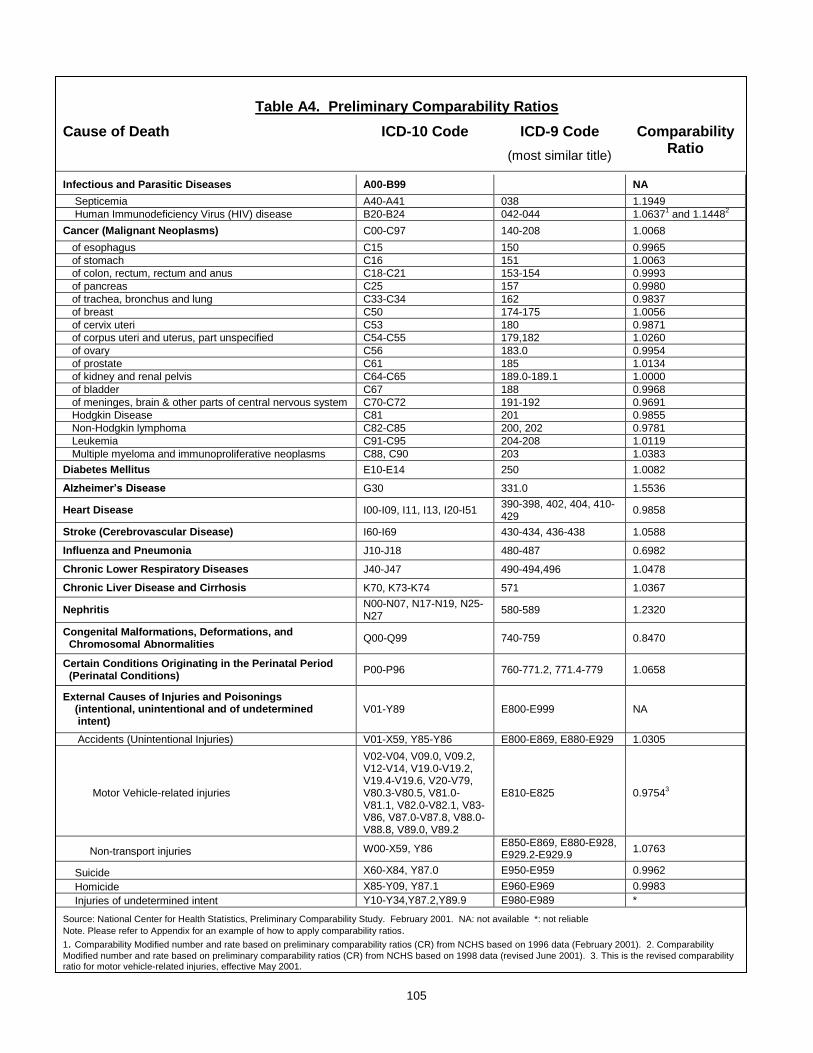
105
Table A4. Preliminary Comparability Ratios
Cause of Death ICD-10 Code ICD-9 Code
(most similar title)
Comparability Ratio
Infectious and Parasitic Diseases A00-B99 NA
Septicemia A40-A41 038 1.1949
Human Immunodeficiency Virus (HIV) disease B20-B24 042-044 1.06371 and 1.1448
2
Cancer (Malignant Neoplasms) C00-C97 140-208 1.0068
of esophagus C15 150 0.9965
of stomach C16 151 1.0063
of colon, rectum, rectum and anus C18-C21 153-154 0.9993
of pancreas C25 157 0.9980
of trachea, bronchus and lung C33-C34 162 0.9837
of breast C50 174-175 1.0056
of cervix uteri C53 180 0.9871
of corpus uteri and uterus, part unspecified C54-C55 179,182 1.0260
of ovary C56 183.0 0.9954
of prostate C61 185 1.0134
of kidney and renal pelvis C64-C65 189.0-189.1 1.0000
of bladder C67 188 0.9968
of meninges, brain & other parts of central nervous system C70-C72 191-192 0.9691
Hodgkin Disease C81 201 0.9855
Non-Hodgkin lymphoma C82-C85 200, 202 0.9781
Leukemia C91-C95 204-208 1.0119
Multiple myeloma and immunoproliferative neoplasms C88, C90 203 1.0383
Diabetes Mellitus E10-E14 250 1.0082
Alzheimer’s Disease G30 331.0 1.5536
Heart Disease I00-I09, I11, I13, I20-I51 390-398, 402, 404, 410-429
0.9858
Stroke (Cerebrovascular Disease) I60-I69 430-434, 436-438 1.0588
Influenza and Pneumonia J10-J18 480-487 0.6982
Chronic Lower Respiratory Diseases J40-J47 490-494,496 1.0478
Chronic Liver Disease and Cirrhosis K70, K73-K74 571 1.0367
Nephritis N00-N07, N17-N19, N25-N27
580-589 1.2320
Congenital Malformations, Deformations, and Chromosomal Abnormalities
Q00-Q99 740-759 0.8470
Certain Conditions Originating in the Perinatal Period (Perinatal Conditions)
P00-P96 760-771.2, 771.4-779 1.0658
External Causes of Injuries and Poisonings (intentional, unintentional and of undetermined intent)
V01-Y89 E800-E999 NA
Accidents (Unintentional Injuries) V01-X59, Y85-Y86 E800-E869, E880-E929 1.0305
Motor Vehicle-related injuries
V02-V04, V09.0, V09.2, V12-V14, V19.0-V19.2, V19.4-V19.6, V20-V79, V80.3-V80.5, V81.0-V81.1, V82.0-V82.1, V83-V86, V87.0-V87.8, V88.0-V88.8, V89.0, V89.2
E810-E825 0.97543
Non-transport injuries W00-X59, Y86 E850-E869, E880-E928, E929.2-E929.9
1.0763
Suicide X60-X84, Y87.0 E950-E959 0.9962
Homicide X85-Y09, Y87.1 E960-E969 0.9983
Injuries of undetermined intent Y10-Y34,Y87.2,Y89.9 E980-E989 *
Source: National Center for Health Statistics, Preliminary Comparability Study. February 2001. NA: not available *: not reliable
Note. Please refer to Appendix for an example of how to apply comparability ratios.
1. Comparability Modified number and rate based on preliminary comparability ratios (CR) from NCHS based on 1996 data (February 2001). 2. Comparability
Modified number and rate based on preliminary comparability ratios (CR) from NCHS based on 1998 data (revised June 2001). 3. This is the revised comparability ratio for motor vehicle-related injuries, effective May 2001.

106
Table A5. Preliminary Comparability Ratios: Causes of Infant Death
Cause of Death ICD-10 Code ICD-9 Code
(most similar title)
Comparability Ratio
Certain Infectious and Parasitic Diseases A00-B99 001-033, 034.1-134, 136-139, 771.3
0.7339
Septicemia A40-A41 038 1.3802
Human Immunodeficiency Virus (HIV) disease B20-B24 042-044 1.0455
Cancer (Malignant Neoplasms) C00-C97 140-208 1.0435
Influenza and Pneumonia J10-J18 480-487 0.7624
Certain Conditions Originating in the Perinatal Period (Perinatal Conditions)
P00-P96 760-771.2, 771.4-779 1.0581
Newborn affected by maternal complications of pregnancy P01 761 1.0295
Newborn affected by complications of placenta, cord and membranes P02 762 1.0470
Disorders relating to short gestation and low birthweight P07 765 1.1060
Intrauterine hypoxia and birth asphyxia P20-P21 768 1.4477
Respiratory distress of newborn P22 769 1.0257
Other respiratory conditions originating in perinatal period P23-P28 770 0.8455
Infections specific to the perinatal period P35-P39 771.0-771.2, 771.4-771.8
1.0199
Neonatal hemorrhage P50-P52, P54 772 1.4369
Congenital Malformations, Deformations, and Chromosomal Abnormalities
Q00-Q99 740-759 0.9064
Anencephaly and similar malformations Q00 740 1.0000
Congenital malformations of heart Q20-Q24 745-746 0.9951
Congenital malformations of respiratory system Q30-Q34 748 0.6322
Congenital malformations of digestive system Q35-Q45 749-751 *
Congenital malformations of genitourinary system Q50-Q64 752-753 0.9432
Congenital malformations of musculoskeletal system Q65-Q85 754-757 0.8650
Sudden Infant Death Syndrome (SIDS) R95 798.0 1.0362
External Causes of Injuries and Poisonings (intentional, unintentional and of undetermined intent)
V01-Y89 E800-E999 NA
Accidents (Unintentional Injuries) V01-X59 E800-E869, E880-
E929 1.0246
Motor Vehicle-related injuries
V02-V04, V09.0, V09.2, V12-V14, V19.0-V19.2, V19.4-V19.6, V20-V79, V80.3-V80.5, V81.0-V81.1, V82.0-V82.1, V83-V86, V87.0-V87.8, V88.0-V88.8, V89.0, V89.2
E810-E825 0.9167
Homicide X85-Y09 E960-E969 0.9481
Injuries of undetermined intent Y10-Y34,Y87.2,Y89.9 E980-E989 *
Source: National Center for Health Statistics, Preliminary Comparability Study. February 2001. NA: not available *: not reliable Note: Please refer to Appendix for an example of how to apply comparability ratios.
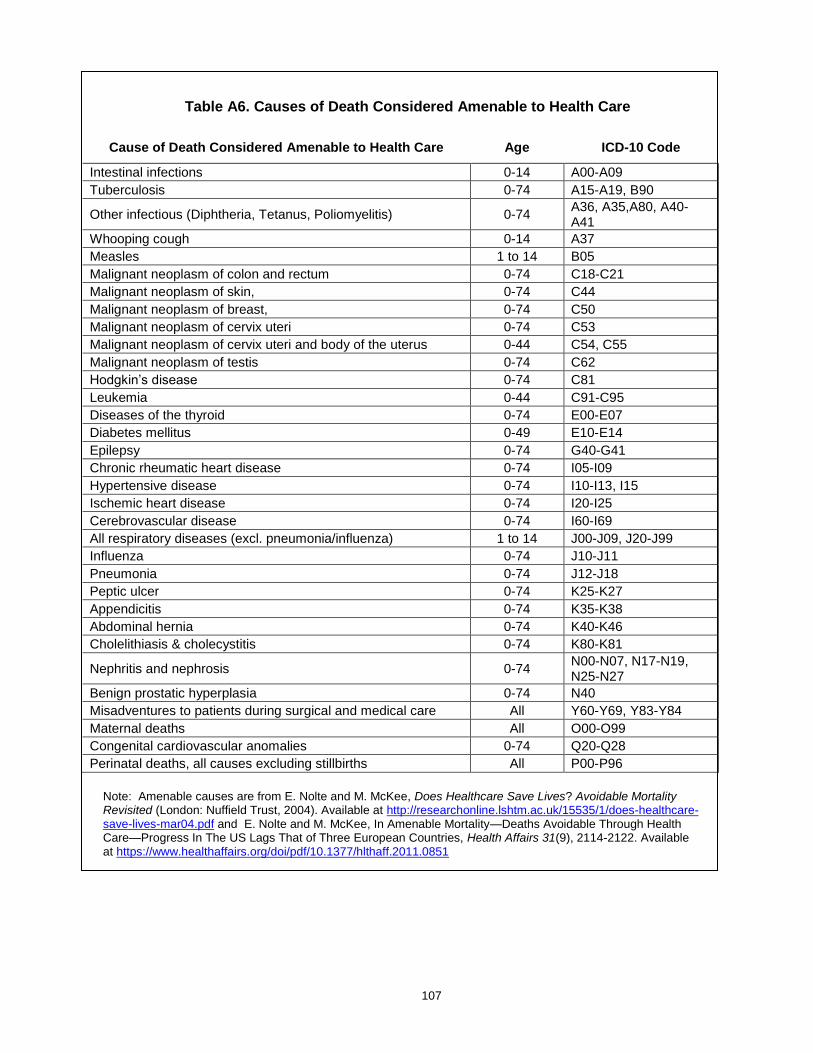
107
Table A6. Causes of Death Considered Amenable to Health Care
Cause of Death Considered Amenable to Health Care Age ICD-10 Code
Intestinal infections 0-14 A00-A09
Tuberculosis 0-74 A15-A19, B90
Other infectious (Diphtheria, Tetanus, Poliomyelitis) 0-74 A36, A35,A80, A40-A41
Whooping cough 0-14 A37
Measles 1 to 14 B05
Malignant neoplasm of colon and rectum 0-74 C18-C21
Malignant neoplasm of skin, 0-74 C44
Malignant neoplasm of breast, 0-74 C50
Malignant neoplasm of cervix uteri 0-74 C53
Malignant neoplasm of cervix uteri and body of the uterus 0-44 C54, C55
Malignant neoplasm of testis 0-74 C62
Hodgkin’s disease 0-74 C81
Leukemia 0-44 C91-C95
Diseases of the thyroid 0-74 E00-E07
Diabetes mellitus 0-49 E10-E14
Epilepsy 0-74 G40-G41
Chronic rheumatic heart disease 0-74 I05-I09
Hypertensive disease 0-74 I10-I13, I15
Ischemic heart disease 0-74 I20-I25
Cerebrovascular disease 0-74 I60-I69
All respiratory diseases (excl. pneumonia/influenza) 1 to 14 J00-J09, J20-J99
Influenza 0-74 J10-J11
Pneumonia 0-74 J12-J18
Peptic ulcer 0-74 K25-K27
Appendicitis 0-74 K35-K38
Abdominal hernia 0-74 K40-K46
Cholelithiasis & cholecystitis 0-74 K80-K81
Nephritis and nephrosis 0-74 N00-N07, N17-N19, N25-N27
Benign prostatic hyperplasia 0-74 N40
Misadventures to patients during surgical and medical care All Y60-Y69, Y83-Y84
Maternal deaths All O00-O99
Congenital cardiovascular anomalies 0-74 Q20-Q28
Perinatal deaths, all causes excluding stillbirths All P00-P96
Note: Amenable causes are from E. Nolte and M. McKee, Does Healthcare Save Lives? Avoidable Mortality Revisited (London: Nuffield Trust, 2004). Available at http://researchonline.lshtm.ac.uk/15535/1/does-healthcare-save-lives-mar04.pdf and E. Nolte and M. McKee, In Amenable Mortality—Deaths Avoidable Through Health Care—Progress In The US Lags That of Three European Countries, Health Affairs 31(9), 2114-2122. Available at https://www.healthaffairs.org/doi/pdf/10.1377/hlthaff.2011.0851
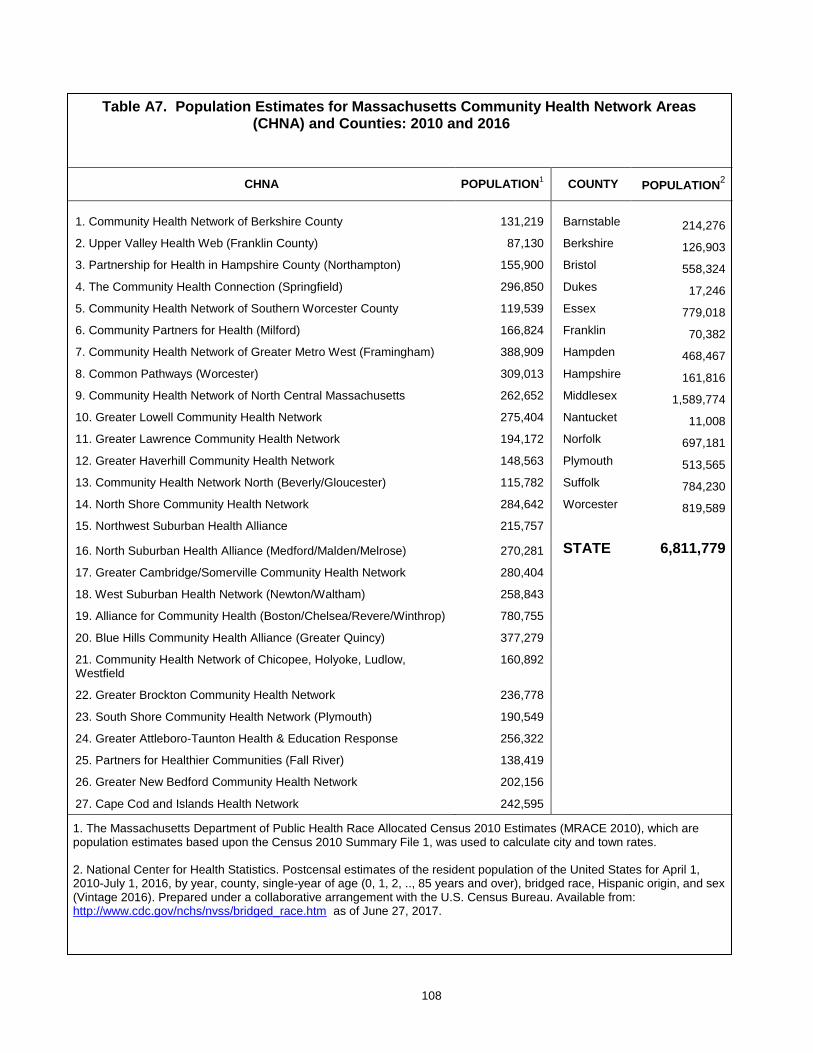
108
Table A7. Population Estimates for Massachusetts Community Health Network Areas (CHNA) and Counties: 2010 and 2016
CHNA POPULATION1 COUNTY POPULATION
2
1. Community Health Network of Berkshire County 131,219 Barnstable 214,276
2. Upper Valley Health Web (Franklin County) 87,130 Berkshire 126,903
3. Partnership for Health in Hampshire County (Northampton) 155,900 Bristol 558,324
4. The Community Health Connection (Springfield) 296,850 Dukes 17,246
5. Community Health Network of Southern Worcester County 119,539 Essex 779,018
6. Community Partners for Health (Milford) 166,824 Franklin 70,382
7. Community Health Network of Greater Metro West (Framingham) 388,909 Hampden 468,467
8. Common Pathways (Worcester) 309,013 Hampshire 161,816
9. Community Health Network of North Central Massachusetts 262,652 Middlesex 1,589,774
10. Greater Lowell Community Health Network 275,404 Nantucket 11,008
11. Greater Lawrence Community Health Network 194,172 Norfolk 697,181
12. Greater Haverhill Community Health Network 148,563 Plymouth 513,565
13. Community Health Network North (Beverly/Gloucester) 115,782 Suffolk 784,230
14. North Shore Community Health Network 284,642 Worcester 819,589
15. Northwest Suburban Health Alliance 215,757
16. North Suburban Health Alliance (Medford/Malden/Melrose) 270,281 STATE 6,811,779
17. Greater Cambridge/Somerville Community Health Network 280,404
18. West Suburban Health Network (Newton/Waltham) 258,843
19. Alliance for Community Health (Boston/Chelsea/Revere/Winthrop) 780,755
20. Blue Hills Community Health Alliance (Greater Quincy) 377,279
21. Community Health Network of Chicopee, Holyoke, Ludlow, Westfield
160,892
22. Greater Brockton Community Health Network 236,778
23. South Shore Community Health Network (Plymouth) 190,549
24. Greater Attleboro-Taunton Health & Education Response 256,322
25. Partners for Healthier Communities (Fall River) 138,419
26. Greater New Bedford Community Health Network 202,156
27. Cape Cod and Islands Health Network 242,595
1. The Massachusetts Department of Public Health Race Allocated Census 2010 Estimates (MRACE 2010), which are population estimates based upon the Census 2010 Summary File 1, was used to calculate city and town rates. 2. National Center for Health Statistics. Postcensal estimates of the resident population of the United States for April 1, 2010-July 1, 2016, by year, county, single-year of age (0, 1, 2, .., 85 years and over), bridged race, Hispanic origin, and sex (Vintage 2016). Prepared under a collaborative arrangement with the U.S. Census Bureau. Available from: http://www.cdc.gov/nchs/nvss/bridged_race.htm as of June 27, 2017.
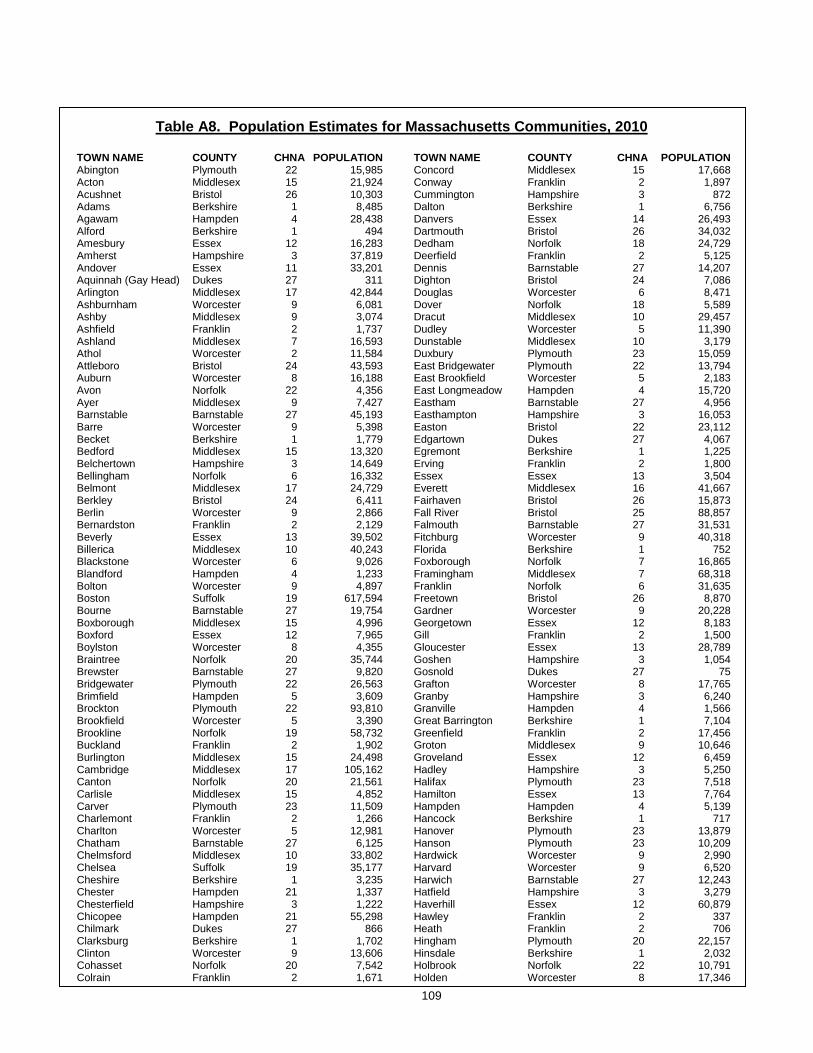
109
Table A8. Population Estimates for Massachusetts Communities, 2010
TOWN NAME COUNTY CHNA POPULATION TOWN NAME COUNTY CHNA POPULATION Abington Plymouth 22 15,985 Concord Middlesex 15 17,668 Acton Middlesex 15 21,924 Conway Franklin 2 1,897 Acushnet Bristol 26 10,303 Cummington Hampshire 3 872 Adams Berkshire 1 8,485 Dalton Berkshire 1 6,756 Agawam Hampden 4 28,438 Danvers Essex 14 26,493 Alford Berkshire 1 494 Dartmouth Bristol 26 34,032 Amesbury Essex 12 16,283 Dedham Norfolk 18 24,729 Amherst Hampshire 3 37,819 Deerfield Franklin 2 5,125 Andover Essex 11 33,201 Dennis Barnstable 27 14,207 Aquinnah (Gay Head) Dukes 27 311 Dighton Bristol 24 7,086 Arlington Middlesex 17 42,844 Douglas Worcester 6 8,471 Ashburnham Worcester 9 6,081 Dover Norfolk 18 5,589 Ashby Middlesex 9 3,074 Dracut Middlesex 10 29,457 Ashfield Franklin 2 1,737 Dudley Worcester 5 11,390 Ashland Middlesex 7 16,593 Dunstable Middlesex 10 3,179 Athol Worcester 2 11,584 Duxbury Plymouth 23 15,059 Attleboro Bristol 24 43,593 East Bridgewater Plymouth 22 13,794 Auburn Worcester 8 16,188 East Brookfield Worcester 5 2,183 Avon Norfolk 22 4,356 East Longmeadow Hampden 4 15,720 Ayer Middlesex 9 7,427 Eastham Barnstable 27 4,956 Barnstable Barnstable 27 45,193 Easthampton Hampshire 3 16,053 Barre Worcester 9 5,398 Easton Bristol 22 23,112 Becket Berkshire 1 1,779 Edgartown Dukes 27 4,067 Bedford Middlesex 15 13,320 Egremont Berkshire 1 1,225 Belchertown Hampshire 3 14,649 Erving Franklin 2 1,800 Bellingham Norfolk 6 16,332 Essex Essex 13 3,504 Belmont Middlesex 17 24,729 Everett Middlesex 16 41,667 Berkley Bristol 24 6,411 Fairhaven Bristol 26 15,873 Berlin Worcester 9 2,866 Fall River Bristol 25 88,857 Bernardston Franklin 2 2,129 Falmouth Barnstable 27 31,531 Beverly Essex 13 39,502 Fitchburg Worcester 9 40,318 Billerica Middlesex 10 40,243 Florida Berkshire 1 752 Blackstone Worcester 6 9,026 Foxborough Norfolk 7 16,865 Blandford Hampden 4 1,233 Framingham Middlesex 7 68,318 Bolton Worcester 9 4,897 Franklin Norfolk 6 31,635 Boston Suffolk 19 617,594 Freetown Bristol 26 8,870 Bourne Barnstable 27 19,754 Gardner Worcester 9 20,228 Boxborough Middlesex 15 4,996 Georgetown Essex 12 8,183 Boxford Essex 12 7,965 Gill Franklin 2 1,500 Boylston Worcester 8 4,355 Gloucester Essex 13 28,789 Braintree Norfolk 20 35,744 Goshen Hampshire 3 1,054 Brewster Barnstable 27 9,820 Gosnold Dukes 27 75 Bridgewater Plymouth 22 26,563 Grafton Worcester 8 17,765 Brimfield Hampden 5 3,609 Granby Hampshire 3 6,240 Brockton Plymouth 22 93,810 Granville Hampden 4 1,566 Brookfield Worcester 5 3,390 Great Barrington Berkshire 1 7,104 Brookline Norfolk 19 58,732 Greenfield Franklin 2 17,456 Buckland Franklin 2 1,902 Groton Middlesex 9 10,646 Burlington Middlesex 15 24,498 Groveland Essex 12 6,459 Cambridge Middlesex 17 105,162 Hadley Hampshire 3 5,250 Canton Norfolk 20 21,561 Halifax Plymouth 23 7,518 Carlisle Middlesex 15 4,852 Hamilton Essex 13 7,764 Carver Plymouth 23 11,509 Hampden Hampden 4 5,139 Charlemont Franklin 2 1,266 Hancock Berkshire 1 717 Charlton Worcester 5 12,981 Hanover Plymouth 23 13,879 Chatham Barnstable 27 6,125 Hanson Plymouth 23 10,209 Chelmsford Middlesex 10 33,802 Hardwick Worcester 9 2,990 Chelsea Suffolk 19 35,177 Harvard Worcester 9 6,520 Cheshire Berkshire 1 3,235 Harwich Barnstable 27 12,243 Chester Hampden 21 1,337 Hatfield Hampshire 3 3,279 Chesterfield Hampshire 3 1,222 Haverhill Essex 12 60,879 Chicopee Hampden 21 55,298 Hawley Franklin 2 337 Chilmark Dukes 27 866 Heath Franklin 2 706 Clarksburg Berkshire 1 1,702 Hingham Plymouth 20 22,157 Clinton Worcester 9 13,606 Hinsdale Berkshire 1 2,032 Cohasset Norfolk 20 7,542 Holbrook Norfolk 22 10,791 Colrain Franklin 2 1,671 Holden Worcester 8 17,346

110
Table A8 (continued). Population Estimates for Massachusetts Communities, 2010
TOWN NAME COUNTY CHNA POPULATION TOWN NAME COUNTY CHNA POPULATION Holland Hampden 5 2,481 New Marlborough Berkshire 1 1,509 Holliston Middlesex 7 13,547 New Salem Franklin 2 990 Holyoke Hampden 21 39,880 Newbury Essex 12 6,666 Hopedale Worcester 6 5,911 Newburyport Essex 12 17,416 Hopkinton Middlesex 7 14,925 Newton Middlesex 18 85,146 Hubbardston Worcester 9 4,382 Norfolk Norfolk 7 11,227 Hudson Middlesex 7 19,063 North Adams Berkshire 1 13,708 Hull Plymouth 20 10,293 North Andover Essex 11 28,352 Huntington Hampshire 21 2,180 North Attleboro Bristol 24 28,712 Ipswich Essex 13 13,175 North Brookfield Worcester 5 4,680 Kingston Plymouth 23 12,629 North Reading Middlesex 16 14,892 Lakeville Plymouth 24 10,602 Northampton Hampshire 3 28,549 Lancaster Worcester 9 8,055 Northborough Worcester 7 14,155 Lanesborough Berkshire 1 3,091 Northbridge Worcester 6 15,707 Lawrence Essex 11 76,377 Northfield Franklin 2 3,032 Lee Berkshire 1 5,943 Norton Bristol 24 19,031 Leicester Worcester 8 10,970 Norwell Plymouth 20 10,506 Lenox Berkshire 1 5,025 Norwood Norfolk 20 28,602 Leominster Worcester 9 40,759 Oak Bluffs Dukes 27 4,527 Leverett Franklin 2 1,851 Oakham Worcester 9 1,902 Lexington Middlesex 15 31,394 Orange Franklin 2 7,839 Leyden Franklin 2 711 Orleans Barnstable 27 5,890 Lincoln Middlesex 15 6,362 Otis Berkshire 1 1,612 Littleton Middlesex 15 8,924 Oxford Worcester 5 13,709 Longmeadow Hampden 4 15,784 Palmer Hampden 4 12,140 Lowell Middlesex 10 106,519 Paxton Worcester 8 4,806 Ludlow Hampden 21 21,103 Peabody Essex 14 51,251 Lunenburg Worcester 9 10,086 Pelham Hampshire 3 1,321 Lynn Essex 14 90,329 Pembroke Plymouth 23 17,837 Lynnfield Essex 14 11,596 Pepperell Middlesex 9 11,497 Malden Middlesex 16 59,450 Peru Berkshire 1 847 Manchester Essex 13 5,136 Petersham Worcester 2 1,234 Mansfield Bristol 24 23,184 Phillipston Worcester 2 1,682 Marblehead Essex 14 19,808 Pittsfield Berkshire 1 44,737 Marion Plymouth 26 4,907 Plainfield Hampshire 3 648 Marlborough Middlesex 7 38,499 Plainville Norfolk 7 8,264 Marshfield Plymouth 23 25,132 Plymouth Plymouth 23 56,468 Mashpee Barnstable 27 14,006 Plympton Plymouth 23 2,820 Mattapoisett Plymouth 26 6,045 Princeton Worcester 9 3,413 Maynard Middlesex 7 10,106 Provincetown Barnstable 27 2,942 Medfield Norfolk 7 12,024 Quincy Norfolk 20 92,271 Medford Middlesex 16 56,173 Randolph Norfolk 20 32,112 Medway Norfolk 6 12,752 Raynham Bristol 24 13,383 Melrose Middlesex 16 26,983 Reading Middlesex 16 24,747 Mendon Worcester 6 5,839 Rehoboth Bristol 24 11,608 Merrimac Essex 12 6,338 Revere Suffolk 19 51,755 Methuen Essex 11 47,255 Richmond Berkshire 1 1,475 Middleborough Plymouth 24 23,116 Rochester Plymouth 26 5,232 Middlefield Hampshire 3 521 Rockland Plymouth 23 17,489 Middleton Essex 11 8,987 Rockport Essex 13 6,952 Milford Worcester 6 27,999 Rowe Franklin 2 393 Millbury Worcester 8 13,261 Rowley Essex 12 5,856 Millis Norfolk 7 7,891 Royalston Worcester 2 1,258 Millville Worcester 6 3,190 Russell Hampden 4 1,775 Milton Norfolk 20 27,003 Rutland Worcester 9 7,973 Monroe Franklin 2 121 Salem Essex 14 41,340 Monson Hampden 4 8,560 Salisbury Essex 12 8,283 Montague Franklin 2 8,437 Sandisfield Berkshire 1 915 Monterey Berkshire 1 961 Sandwich Barnstable 27 20,675 Montgomery Hampden 4 838 Saugus Essex 14 26,628 Mt. Washington Berkshire 1 167 Savoy Berkshire 1 692 Nahant Essex 14 3,410 Scituate Plymouth 20 18,133 Nantucket Nantucket 27 10,172 Seekonk Bristol 24 13,722 Natick Middlesex 7 33,006 Sharon Norfolk 20 17,612 Needham Norfolk 18 28,886 Sheffield Berkshire 1 3,257 New Ashford Berkshire 1 228 Shelburne Franklin 2 1,893 New Bedford Bristol 26 95,072 Sherborn Middlesex 7 4,119 New Braintree Worcester 9 999 Shirley Middlesex 9 7,211
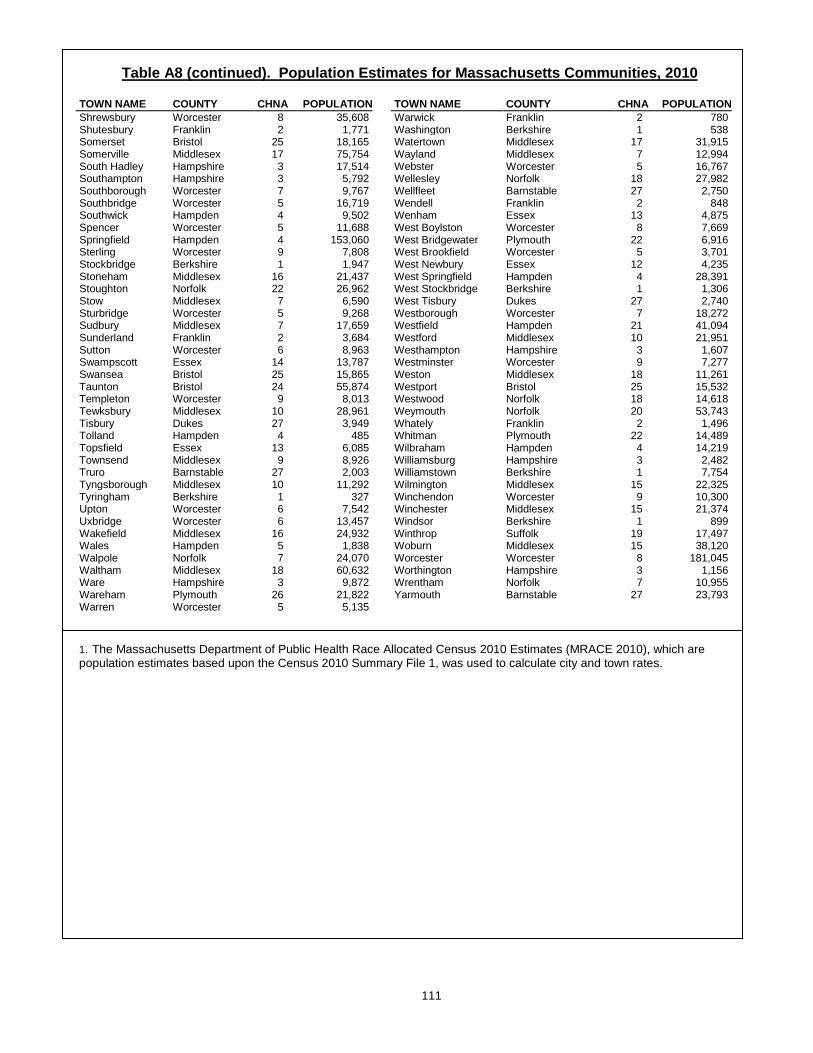
111
Table A8 (continued). Population Estimates for Massachusetts Communities, 2010
TOWN NAME COUNTY CHNA POPULATION TOWN NAME COUNTY CHNA POPULATION
Shrewsbury Worcester 8 35,608 Warwick Franklin 2 780 Shutesbury Franklin 2 1,771 Washington Berkshire 1 538 Somerset Bristol 25 18,165 Watertown Middlesex 17 31,915 Somerville Middlesex 17 75,754 Wayland Middlesex 7 12,994 South Hadley Hampshire 3 17,514 Webster Worcester 5 16,767 Southampton Hampshire 3 5,792 Wellesley Norfolk 18 27,982 Southborough Worcester 7 9,767 Wellfleet Barnstable 27 2,750 Southbridge Worcester 5 16,719 Wendell Franklin 2 848 Southwick Hampden 4 9,502 Wenham Essex 13 4,875 Spencer Worcester 5 11,688 West Boylston Worcester 8 7,669 Springfield Hampden 4 153,060 West Bridgewater Plymouth 22 6,916 Sterling Worcester 9 7,808 West Brookfield Worcester 5 3,701 Stockbridge Berkshire 1 1,947 West Newbury Essex 12 4,235 Stoneham Middlesex 16 21,437 West Springfield Hampden 4 28,391 Stoughton Norfolk 22 26,962 West Stockbridge Berkshire 1 1,306 Stow Middlesex 7 6,590 West Tisbury Dukes 27 2,740 Sturbridge Worcester 5 9,268 Westborough Worcester 7 18,272 Sudbury Middlesex 7 17,659 Westfield Hampden 21 41,094 Sunderland Franklin 2 3,684 Westford Middlesex 10 21,951 Sutton Worcester 6 8,963 Westhampton Hampshire 3 1,607 Swampscott Essex 14 13,787 Westminster Worcester 9 7,277 Swansea Bristol 25 15,865 Weston Middlesex 18 11,261 Taunton Bristol 24 55,874 Westport Bristol 25 15,532 Templeton Worcester 9 8,013 Westwood Norfolk 18 14,618 Tewksbury Middlesex 10 28,961 Weymouth Norfolk 20 53,743 Tisbury Dukes 27 3,949 Whately Franklin 2 1,496 Tolland Hampden 4 485 Whitman Plymouth 22 14,489 Topsfield Essex 13 6,085 Wilbraham Hampden 4 14,219 Townsend Middlesex 9 8,926 Williamsburg Hampshire 3 2,482 Truro Barnstable 27 2,003 Williamstown Berkshire 1 7,754 Tyngsborough Middlesex 10 11,292 Wilmington Middlesex 15 22,325 Tyringham Berkshire 1 327 Winchendon Worcester 9 10,300 Upton Worcester 6 7,542 Winchester Middlesex 15 21,374 Uxbridge Worcester 6 13,457 Windsor Berkshire 1 899 Wakefield Middlesex 16 24,932 Winthrop Suffolk 19 17,497 Wales Hampden 5 1,838 Woburn Middlesex 15 38,120 Walpole Norfolk 7 24,070 Worcester Worcester 8 181,045 Waltham Middlesex 18 60,632 Worthington Hampshire 3 1,156 Ware Hampshire 3 9,872 Wrentham Norfolk 7 10,955 Wareham Plymouth 26 21,822 Yarmouth Barnstable 27 23,793 Warren Worcester 5 5,135
1. The Massachusetts Department of Public Health Race Allocated Census 2010 Estimates (MRACE 2010), which are population estimates based upon the Census 2010 Summary File 1, was used to calculate city and town rates.

112
Table A9. 2016 Massachusetts Population Estimates1 By Age Group, Gender, Race
and Hispanic Ethnicity (mutually exclusive)
AGE GENDER TOTAL
WHITE Non-
Hispanic2
BLACK Non-
Hispanic2
ASIAN Non-
Hispanic2 HISPANIC2
Under 1 Male 36,748 22,794 3,262 2,847 7,765 Female 35,109 21,725 3,100 2,637 7,566 Total 71,857 44,519 6,362 5,484 15,331
1 TO 4 Male 147,501 90,701 15,358 11,463 29,613 Female 142,018 87,165 14,456 11,185 28,850 Total 289,519 177,866 29,814 22,648 58,463
5 TO 14 Male 391,327 256,692 37,707 28,426 67,571 Female 374,712 245,262 35,084 28,066 65,375 Total 766,039 501,954 72,791 56,492 132,946
15 TO 24 Male 478,607 325,150 43,137 35,631 73,454 Female 476,331 324,347 42,635 39,382 68,812 Total 954,938 649,497 85,772 75,013 142,266
25 TO 34 Male 476,869 321,805 40,713 43,894 69,287 Female 475,460 321,196 40,502 48,109 64,577 Total 952,329 643,001 81,215 92,003 133,864
35 TO 44 Male 403,734 279,908 32,366 36,125 54,517 Female 421,279 288,984 34,534 40,525 56,397 Total 825,013 568,892 66,900 76,650 110,914
45 TO 54 Male 466,997 364,454 31,464 28,631 41,349 Female 494,119 381,736 34,758 30,960 45,510 Total 961,116 746,190 66,222 59,591 86,859
55 TO 64 Male 440,593 369,865 25,285 18,938 25,513 Female 476,411 395,220 28,576 21,769 29,715 Total 917,004 765,085 53,861 40,707 55,228
65 TO 74 Male 283,498 247,039 12,718 10,816 12,356 Female 329,033 282,938 16,592 12,762 16,178 Total 612,531 529,977 29,310 23,578 28,534
75 TO 84 Male 127,716 112,326 5,106 5,242 4,783 Female 174,911 152,668 8,456 6,343 7,165 Total 302,627 264,994 13,562 11,585 11,948
85 + Male 52,061 47,218 1,617 1,618 1,505 Female 106,745 97,730 3700 2,382 2,803 Total 158,806 144,948 5,317 4,000 4,308
ALL AGES Male 3,305,651 2,437,952 248,733 223,631 387,713 Female 3,506,128 2,598,971 262,393 244,120 392,948 Total 6,811,779 5,036,923 511,126 467,751 780,661
1. National Center for Health Statistics. Postcensal estimates of the resident population of the United States for April 1, 2010-July 1, 2016, by year, county, single-year of age (0, 1, 2, .., 85 years and over), bridged race, Hispanic origin, and sex (Vintage 2016). Prepared under a collaborative arrangement with the U.S. Census Bureau. Available from: http://www.cdc.gov/nchs/nvss/bridged_race.htm as of June 27, 2017. 2. Persons of Hispanic ethnicity are NOT included in the race categories. These estimates are used to calculate population based rates published in this report.

113
Massachusetts Death Certificate: 2016
Commonwealth of Massachusetts Registry of Vital Records and Statistics
Certificate of DEATH
State File #
Registered #
Form R-301 08012015
D E
C E
D E
N T
Place of Death
Date of Death Age Sex
Current Name
Surname at Birth or Adoption
SSN
AKA
Date of Birth Birthplace
Residence
Race
Education
Marital Status
Occupation/Industry
Last Spouse – Last, First, Middle (Surname at Birth or Adoption)
Decedent: U.S. Veteran (Most Recent)
Mother/Parent Name – Last, First Middle (Surname at Birth or Adoption)
Birthplace
Father/Parent Name – Last, First Middle (Surname at Birth or Adoption)
Birthplace
M E
D I
C A
L
C E
R T
I F
I E
R
Part I. Cause of Death – Sequentially list immediate cause then antecedent causes then underlying cause Interval between onset and death
a. Immediate Cause (Final condition resulting in death)
b. Due to or as a consequence of:.
c. Due to or as a consequence of:
d. Due to or as a consequence of:
Part II. Other significant conditions contributing to death but not resulting in underlying cause
Manner of Death:
Time of Death:
Result of Injury:
Certifier Lic #
Addr.
D I
S P
O S
I T
I O
N
Funeral Licensee/ Designee Lic #
Facility/Addr.
Immediate Disposition
Date of Immediate Disposition
Place/Address
Date of Record
Date of Amendment
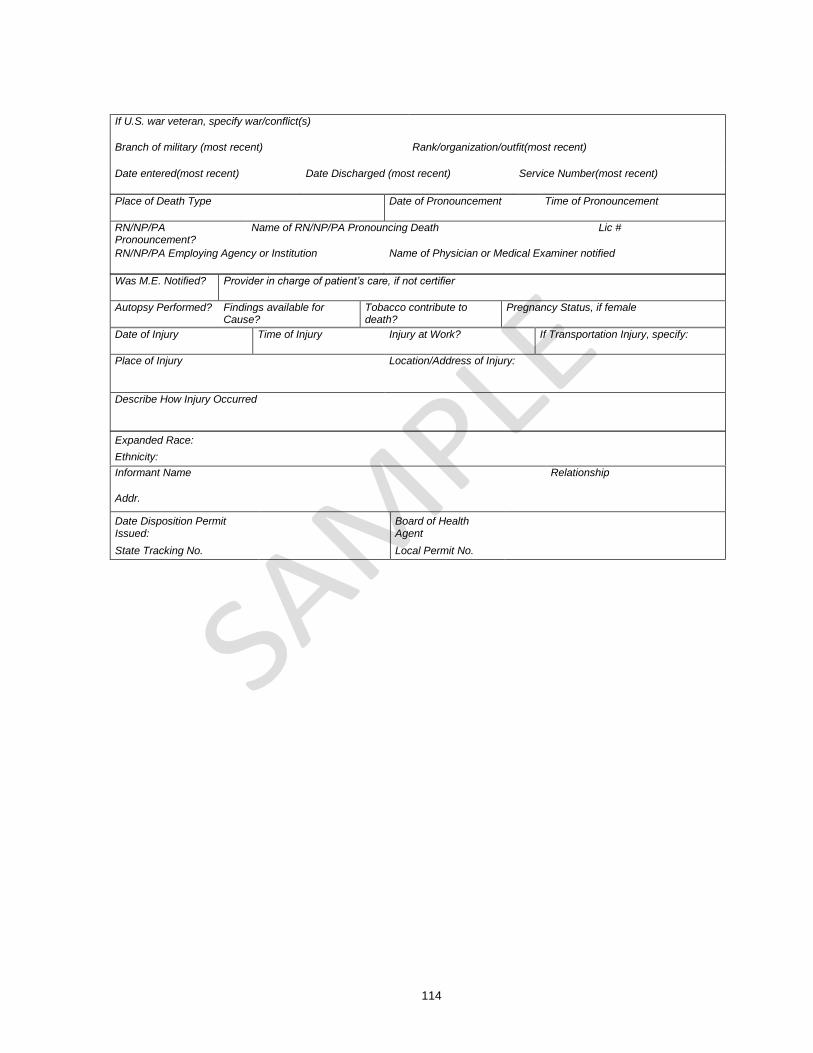
114
If U.S. war veteran, specify war/conflict(s)
Branch of military (most recent)
Rank/organization/outfit(most recent)
Date entered(most recent)
Date Discharged (most recent)
Service Number(most recent)
Place of Death Type
Date of Pronouncement
Time of Pronouncement
RN/NP/PA Pronouncement?
Name of RN/NP/PA Pronouncing Death
Lic #
RN/NP/PA Employing Agency or Institution
Name of Physician or Medical Examiner notified
Was M.E. Notified?
Provider in charge of patient’s care, if not certifier
Autopsy Performed?
Findings available for Cause?
Tobacco contribute to death?
Pregnancy Status, if female
Date of Injury
Time of Injury
Injury at Work?
If Transportation Injury, specify:
Place of Injury
Location/Address of Injury:
Describe How Injury Occurred
Expanded Race:
Ethnicity:
Informant Name
Relationship
Addr.
Date Disposition Permit Issued:
Board of Health Agent
State Tracking No. Local Permit No.
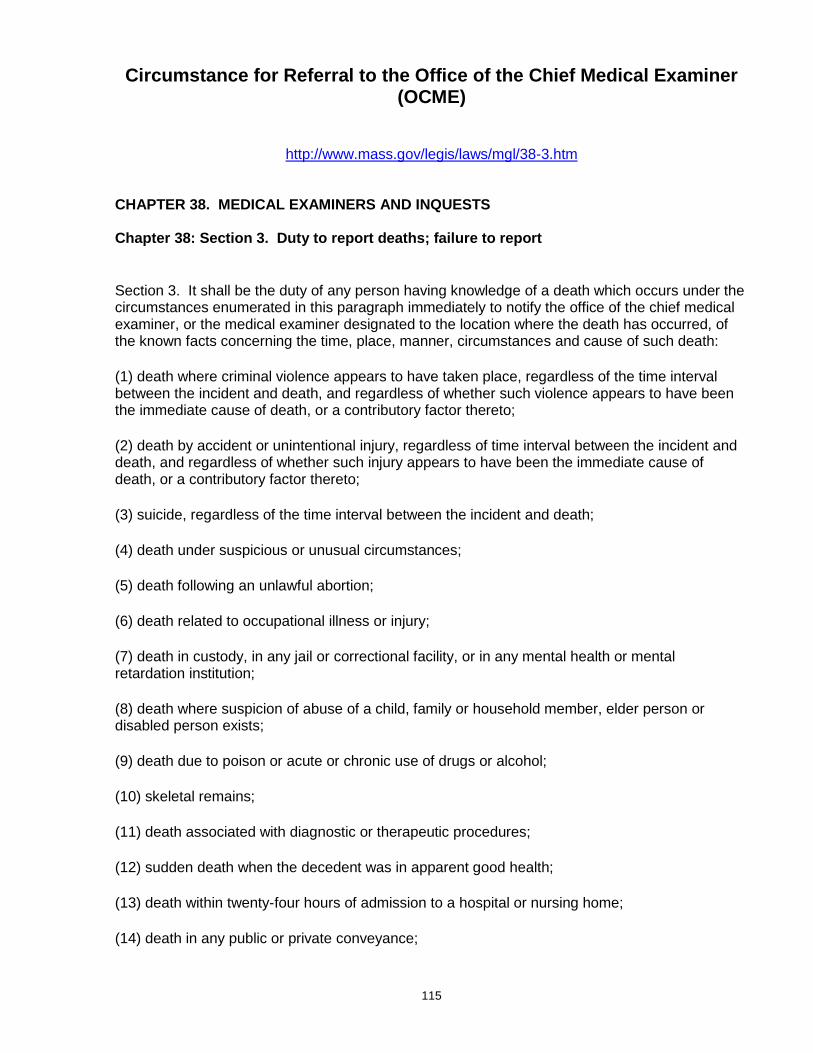
115
Circumstance for Referral to the Office of the Chief Medical Examiner (OCME)
http://www.mass.gov/legis/laws/mgl/38-3.htm
CHAPTER 38. MEDICAL EXAMINERS AND INQUESTS Chapter 38: Section 3. Duty to report deaths; failure to report
Section 3. It shall be the duty of any person having knowledge of a death which occurs under the circumstances enumerated in this paragraph immediately to notify the office of the chief medical examiner, or the medical examiner designated to the location where the death has occurred, of the known facts concerning the time, place, manner, circumstances and cause of such death:
(1) death where criminal violence appears to have taken place, regardless of the time interval between the incident and death, and regardless of whether such violence appears to have been the immediate cause of death, or a contributory factor thereto;
(2) death by accident or unintentional injury, regardless of time interval between the incident and death, and regardless of whether such injury appears to have been the immediate cause of death, or a contributory factor thereto;
(3) suicide, regardless of the time interval between the incident and death;
(4) death under suspicious or unusual circumstances;
(5) death following an unlawful abortion;
(6) death related to occupational illness or injury;
(7) death in custody, in any jail or correctional facility, or in any mental health or mental retardation institution;
(8) death where suspicion of abuse of a child, family or household member, elder person or disabled person exists;
(9) death due to poison or acute or chronic use of drugs or alcohol;
(10) skeletal remains;
(11) death associated with diagnostic or therapeutic procedures;
(12) sudden death when the decedent was in apparent good health;
(13) death within twenty-four hours of admission to a hospital or nursing home;
(14) death in any public or private conveyance;

116
(15) fetal death, as defined by section two hundred and two of chapter one hundred and eleven, where the period of gestation has been twenty weeks or more, or where fetal weight is three hundred and fifty grams or more;
(16) death of children under the age of 18 years from any cause;
(17) any person found dead;
(18) death in any emergency treatment facility, medical walk-in center, day care center, or under foster care; or
(19) deaths occurring under such other circumstances as the chief medical examiner shall prescribe in regulations promulgated pursuant to the provisions of chapter thirty A.
A physician, police officer, hospital administrator, licensed nurse, department of social services social worker, or licensed funeral director, within the commonwealth, who, having knowledge of such an unreported death, fails to notify the office of the chief medical examiner of such death shall be punished by a fine of not more than five hundred dollars. Such failure shall also be reported to the appropriate board of registration, where applicable.
117
Massachusetts Deaths: 2016 Evaluation Form
TO OUR READERS: In an attempt to better serve our users, we are enclosing this evaluation form. Please take the time to complete this questionnaire and return it to the address at the bottom of the page. Thank you.
What tables and charts do you find most useful?
What tables and charts do you find least useful?
Are there other tables and charts that you would like added to this publication? If yes, please describe them in detail.
Do you have other comments or suggestions?
Name (optional): Address: (For those who received the publication by mail) Is the mailing label address correct? If not, please correct the address. Thank you.
Please return your comments to:
Massachusetts Department of Public Health Registry of Vital Records and Statistics
150 Mt. Vernon Street 1st Floor Dorchester, MA 02125
![Massachusetts Military Reservation · Otis Air National Guard/Camp Edwards, Falmouth, Massachusetts (Massachusetts Military Reservation [MMR], Cape Cod, Massachusetts)](https://img.pdfslide.net/doc/110x75/5af853a37f8b9a44658c3974/massachusetts-military-reservation-air-national-guardcamp-edwards-falmouth-massachusetts.jpg)