Embed Size (px)
Citation preview

The Communications Revolution and Health Inequalities in the 21st Century
K. Vish Viswanath, PhD
Harvard School of Public Health Dana-Farber Cancer Institute
Dana-Farber Harvard Cancer Center
The Communications Revolution

New U.S. Research Will Aim at Flood of Digital Data Big data refers to the rising flood of digital data from many sources, including the Web, biological and industrial sensors, video, e-mail and social network communications.
For example, if you buy a used car, your best bet is an orange one. Data scientists at Kaggle, a pattern recognition start-up …., have matched previously separate data sets on buyers, colors and after-purchase problems. They figured out that if a car’s original owner chose an odd color, the car was most likely a means of self-expression. That self-identification raises the odds that the owner cared more than usual for the vehicle.
What Does It Take to Turn Big Data into
Big Dollars?
volume of data now being produced continues to skyrocket, with
something on the order of 2.7 Zettabytes (2.7 x 10²¹) of
information to be produced in 2012

Communication devices and their use
The Pew Research Center’s Project for Excellence in Journalism (2012). The State of the News Media 2012. Accessed on March 31 at: http://stateofthemedia.org/2012/overview-4/key-findings/

Web 2.0- A Key Component to the Growing Media World
Growing from small number of one-way information sources to a complex multi-way exchange
• Potential for low-cost, high reach information exchange
• Facilitates new opportunities for physician communication
• Strengthens social support through online networks • Creates a more engaging patient environment

New platforms


Trends in news consumption

Media use

What do we mean by communications revolution?
Two dimensions: • An enormous capacity to generate, integrate,
manipulate and distribute information across temporal, geographical and disciplinary boundaries.
• Integration of different digital domains – from university libraries to private data archives to research from scientific groups and labs, as well as information on people
Viswanath, 2011

The Communications Revolution What are the consequences? • Democratization of information whose generation
and consumption at one time was limited by specialty and geography
• A shift from a command and control approach to more grass-roots, participatory models
Viswanath, 2011

Health Disparities and Communication Inequalities

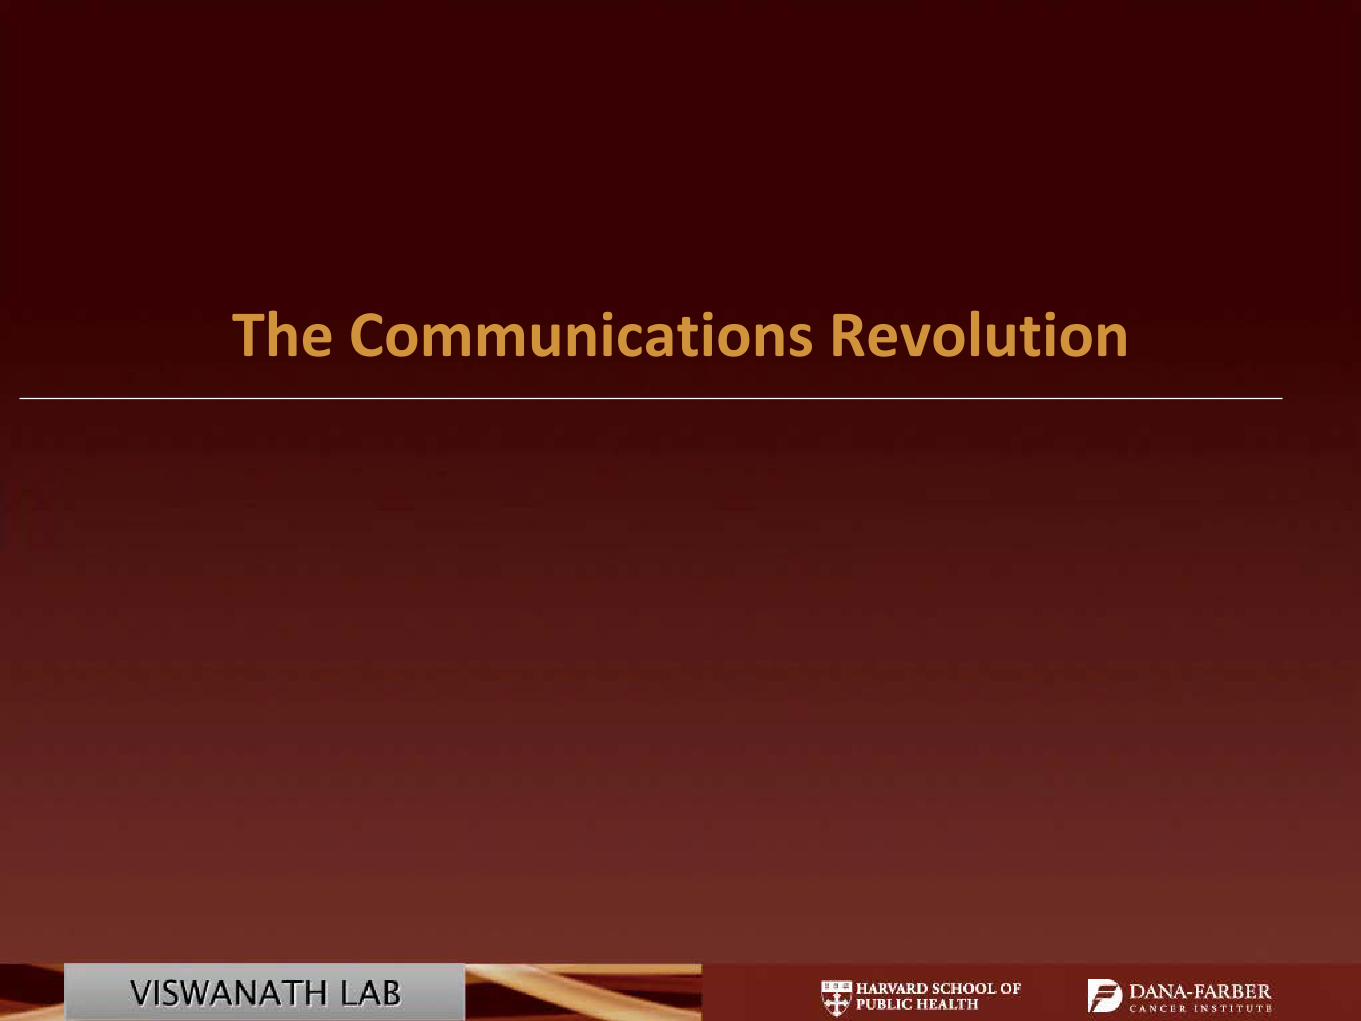
Living conditions
Living conditions

U.S. cigarette smoking prevalence by education level 1980-2010

Tobacco use by wealth in India
Viswanath et al., 2011

Social determinants • Race/ethnicity • Living conditions • Socioeconomic status Income Education Occupation
• Gender • Sexuality • Immigration status • Stressful life events over the lifecourse

Health Disparities: Social determinants framework
ces
Social Determinants Socioeconomic Position •Education •Income •Employment •Occupation Place •Neighborhood •Urban versus rural
Health Outcomes •Knowledge •Health Beliefs •Comprehension •Capacity for action •Incidence •Health Behaviors •Prevention •Screening •Treatment •Survivorship •End-of-life care

Structural Influence Model of Communication (SIM)
ces
•
Health Media Use & Exposure
Social Determinants Socioeconomic Position •Education •Income •Employment •Occupation Place •Neighborhood •Urban versus rural
Mediating/ Moderating Conditions Socio-Demographics •Age •Gender •Race/Ethnicity •Social Capital •Resources
Health Communication
•Media Access •Health Media Use & Exposure •Information seeking •Attention •Information Processing • Capacity to Use Information
Health Outcomes •Knowledge •Health Beliefs •Comprehension •Capacity for action •Incidence •Health Behaviors •Prevention •Screening •Treatment •Survivorship •End-of-life care

…is differences among social classes in the generation, manipulation, and distribution of information at the group level and differences in access to and ability to take advantage of information at the individual level.
Communication Inequality…

Dimensions of communication inequality
Five broad dimensions •Use/Access/Exposure •Attention •Information seeking •Processing •Communication Effects

Use/Access/Exposure

Recent work
• Subscription to cable or satellite TV and the Internet
• Daily readership of newspapers
• Differential time with different media
• Preferences for different media
Viswanath, 2011; Kontos et al., 2011; Blake et al., 2010; Blake et al., 2011; Ackerson & Viswanath, 2009; Ramanadhan & Viswanath, 2006; Arora et al., 2008; Viswanath et al., 2006; Viswanath, 2006; Viswanath & Kreuter, 2007; Kontos, Bennett & Viswanath, 2007
Socioeconomic Status (SES), Race and ethnicity are associated with:
• Attention to health content in different media
• Processing (confusion) of health information
• Trust in media
• Knowledge gaps in health
• Intermittent smoking

Media use by location in India
Viswanath, Sorensen, Gupta & Ackerson, 2011

Mobile-cellular subscriptions per 100 inhabitants, 2001-2011*
0
20
40
60
80
100
120
140
2001 2002 2003 2004 2005 2006 2007 2008 2009 2010 2011*
Per 1
00 in
habi
tant
s
Developed
World
Developing
* Estimate.The developed/developing country classifications are based on the UN M49, see:http://www.itu.int/ITU-D/ict/definitions/regions/index.html
International Telecommunication Union [Report on the Internet]. World Telecommunication/ICT Indicators
Database. www.itu.int/ITU-D/ict/statistics/, Viswanath et al., 2011

Fixed (wired)-broadband subscriptions per 100 inhabitants, 2001-2011*
0
5
10
15
20
25
30
2001 2002 2003 2004 2005 2006 2007 2008 2009 2010 2011*
Per 1
00 in
habi
tant
s
Developed
World
Developin
* Estimate.The developed/developing country classifications are based on the UN M49, see:http://www.itu.int/ITU-D/ict/definitions/regions/index.html
/ International Telecommunication Union [Report on the Internet]. World Telecommunication/ICT Indicators Database. www.itu.int/ITU-D/ict/statistics/, Viswanath et al., 2011

Attention to Health Information

Paying a lot of attention to health in the media by race/ethnicity, (HINTS 2005)
0.000.501.001.502.002.50
3.003.504.004.505.00
Television
Radio
Newspaper
Magazines
Internet
Odds
Ratio Non-Hispanic White
English-speakingHispanic Spanish-speakingHispanic Non-Hispanic Black

Paying a lot of attention to health in the media by education status, 2005
0.00
1.00
2.00
3.00
4.00
5.00
6.00
7.00
8.00
9.00
TelevisionRadio
Newspaper
MagazinesInternet
Odds
Ratio
Less than high school
High school
Some college
College graduate

Information Seeking
Recently there has been an increased emphasis on •Patients gathering information
•Carefully weighing evidence
•Taking into account their personal preferences and values in order to fully participate in clinical decisions

Types of information sought, by education
Galarce, Ramanadhan, Weeks, Schneider, Gray, Viswanath, 2011

Participants seeking work/finance information by level of wealth
Galarce, Ramanadhan, Weeks, Schneider, Gray, Viswanath, 2011

Likelihood of seeking
Galarce, Ramanadhan, Weeks, Schneider, Gray, Viswanath, 2011

Likelihood of seeking
Galarce, Ramanadhan, Weeks, Schneider, Gray, Viswanath, 2011

Communication Effects on Outcomes • Knowledge gaps Skin Cancer Breast Cancer Effects of Tobacco Use
• H1N1 Vaccination • Light and Intermittent smoking

Risk of smoking by media use among Indian women, 2005-2006
0
0.5
1
1.5
2
2.5
Newspaper Radio Television Movie
Risk R
atio Never
Occasionally
Weekly Daily

Risk of smoking by media use among Indian men, 2005-2006
0.8
0.85
0.9
0.95
1
1.05
1.1
1.15
1.2
1.25
1.3
Newspaper Radio Television Movie
Risk R
atio Never
Occasionally
Weekly
Daily

Potential solutions to address disparities: Four exemplar interventions
• Click to Connect (C2C) Individual capacity building to promote internet literacy
among the underserved
• Planet MassCONECT Community-based organization’s capacity building to
promote adoption of evidence-based interventions
• Project IMPACT Transform public agenda about health disparities by
influencing Media agenda
• MassCONECT Build community capacity to address disparities though
intersectoral mobilization in three Massachusetts Communities

Much of this work is informed by the principles of Community-based
Participatory Research (CBPR)

Variety of methods to examine and address inequalities
• Click to Connect (RCT) Pre-post test surveys Usability tests Focus groups Process data Web tracking data
• Project IMPACT Content analyses of media Focus groups Key Informant interviews Public opinion surveys Community Leadership Surveys

Variety of methods to examine and address inequalities
• PLANET MassCONECT Census of health-related CBOs Key Informant Interviews Analyses of Implementation – Grant proposals
• MassCONECT Social Network Analyses Surveys Key Informant Interviews Focus groups

MassCONECT Social Network Analysis
Connections among 38 MassCONECT members at network inception (panel A) and Year 4 (panel B).
Ramanadhan et al., 2012

Click to Connect Does improving access and ability to use the Internet among low literacy, low SEP individuals lead to changes in several factors that comprise health literacy including: •Primary Outcomes Media use and exposure to health information Internet use Health information seeking and information efficacy
•Secondary Outcomes Health knowledge and health beliefs

Click to Connect Intervention

Web portal: First iteration

Web portal: Final iteration

Click to Connect: Variety of Data • Pre- and Post-intervention surveys
• Website tracking
• Monthly surveys
• ALL contact information: logs of visits, emails, calls and mail

Food Marketing • The food and beverage industry spends approximately $2 billion per year
marketing to children. 1
• The fast food industry spends more than $5 million every day marketing unhealthy foods to children. 1
• Kids watch an average of over ten food-related ads every day (nearly 4,000/year). 2
• Ad spending for interactive video games is projected to reach $1 billion by 2014, with six million 3-11 year olds visiting some form of virtual game online each month.3
• Nearly all (98 percent) of food advertisements viewed by children are for products that are high in fat, sugar or sodium. Most (79 percent) are low in fiber. 4
1 Kovacic, W. e. (2008). Marketing food to children and adolescents: A review of industry expenditures, activities, and self-regulation: A Federal Trade Commission report to Congress. Federal Trade Commission.2 Powell LM, S. R. (2011). Trends in the nutritional content of television food advertisements seen by children in the United States: Analyses by age, food categories, and companies. Archives of Pediatric Adolescent Medicine . 3 Chester J, M. K. (2009). Digital marketing: Opportunities for addressing interactive food and beverage marketing to youth. Berkeley Media Studies Group, Berkeley. 4 Story M, L. N. (2008). Food and beverage marketing to children and adolescents research brief. Robert Wood Johnson Foundation.

Food Marketing –Social Media •Eleven of the twelve fast food restaurants with the highest sales in 2009 maintained at least one Facebook account during the period we analyzed.
•33 Beverage makers have facebook pages.
•Coke is number with 34 million fans; Starbucks with 25 million fans
• 23 beverage makers have Twitter accounts; use it as a way to engage customers and make their site participatory
•From @McCafeYourDay, 05/19/09
@xxxxxxx Sorry to hear that! I'd like to send you a card for a FREE McCafe if you'd like to give it another shot - send me a DM
•11/12 top twelve fast food restaurants and 21 of 33 have have atleast one YouTube channel Food Marketing and Social Media: Findings from Fast Food FACTS and Sugary Drink FACTS. Johanna Richardson, M.B.A. and Jennifer L. Harris, Ph.D., M.B.A. Rudd Center for Food Policy & Obesity at Yale University. Paper presented at American University Digital Food Marketing Conference November 5, 2011

Communication inequalities and public health: The future
• Communication inequality as ONE important determinant of health disparities
• Need more work on causal pathways from communication inequality to health disparities
• Inequalities are only likely to increase as ICTs evolve • How do we involve the end-user in the designing
our systems? • How do we engage CBOs and institutions in
Intervening on Communications? • What kind of policies do we need to ensure that
these inequalities are not exacerbated?

Members of the Lab www.viswanathlab.org
• Jaclyn Alexander-Molloy • Cabral Bigman • Carmenza Bruff • Josephine Crisostomo • Rachel Faulkenberry • Minsoo Jung • Leesa Lin
• Lisa Lowery • Sara Minsky • Yudy Muneton • Rebekah Nagler • Shoba Ramanadhan • Megan Rao


![Concentration of Measure Inequalities in Information ... · arXiv:1212.4663v8 [cs.IT] 24 Feb 2015 1 Concentration of Measure Inequalities in Information Theory, Communications and](https://img.pdfslide.net/doc/110x75/5afd76b47f8b9a944d8d8a59/concentration-of-measure-inequalities-in-information-12124663v8-csit-24.jpg)