Embed Size (px)
Citation preview

Monthly Labor Review • January 2011 57
Visual Essay: Compensation-Productivity Gap
The compensation-productivity gap:a visual essay
Susan Fleck, John Glaser, and Shawn Sprague
Productivity and compensation measures yield information on the extent to which the em-ployed benefit from economic growth. Pro-
ductivity growth provides the basis for rising living standards; real hourly compensation is a measure of workers’ purchasing power. Increases in labor pro-ductivity—the most commonly used productivity measure—reflect investments in capital equipment and information technology, and the hiring of more highly skilled workers. Employers’ ability to raise wages and other compensation is tied to increases in labor productivity. Since the 1970s, growth in inflation-adjusted, or real, hourly compensation has lagged behind labor productivity growth. This gap between the two measures is the subject of this visual essay.
The gap between real hourly compensation and labor productivity is one of a number of “wage gaps” that indicate whether workers’ compensation or wag-es keep up with productivity. There are a number of sources for compensation measures, as well as differ-ent ways to apply price indexes to adjust for inflation.1 This visual essay presents real hourly compensation data based on compensation data from the National Income and Product Accounts, which is the same source that the BLS productivity program uses for output. Compensation data are adjusted by using a consumer price index, and output is adjusted by us-ing an implicit price deflator. The gap between real hourly compensation and labor productivity will be referred to in this essay as the compensation–produc-tivity gap.
This visual essay presents relationships that are definitional rather than causal. There are two main
components that account for the magnitude and di-rection of the compensation–productivity gap. The first is the difference between the price indexes used to adjust for inflation in the BLS hourly compensation and productivity measures. The Consumer Price In-dex and the implicit price deflator comprise different baskets of goods and services; if consumer prices rise more quickly than output prices, purchasing power falls and the compensation–productivity gap grows.
The second component, “labor share,” is the share of output accounted for by employees’ compensa-tion. Labor share is a measure of how much of the economic pie goes to all workers. When labor share is constant or rising, workers benefit from economic growth. When labor share falls, the compensation–productivity gap widens. Concurrently, nonlabor costs—which include intermediate inputs into pro-duction and returns to investments, or profits—rep-resent a greater share of output. Because real hourly compensation and labor productivity, which is output per hour, both include hours worked in their calcula-tions, changes in hours worked have no impact on the gap.
The series of charts in this visual essay presents an overview of the growing compensation–productivity gap, using this measure and others to examine the U.S. nonfarm business and manufacturing sectors. The nonfarm business sector accounts for three-fourths of output and employment in the total economy; manufacturing—a portion of nonfarm businesses—produced about 11 percent of U.S. output and ac-counted for just over 8 percent of total U.S. employ-ment in 2009. The data presented are published by the major sector productivity program at BLS.
Visual Essay: Compensation-Productivity Gap
58 Monthly Labor Review • January 2011
More than 60 years of quarterly and annual data, spanning 11 cycles of recessions and expansions, showcase trends in productivity and real hourly com-pensation. Some of the line charts highlight the cy-clical nature of productivity, which generally declines in recessions and rises during expansions. Productiv-ity and compensation trends also reflect long-term changes in production. The bar charts show long-term trends by use of annual data grouped into peri-ods that contain multiple business cycles.
Quarterly data are presented through the third quarter of 2010. Annual data for the nonfarm busi-ness sector are available through 2009. Preliminary manufacturing productivity and real hourly compen-sation measures are available through the most re-cent quarter of 2010 on a quarterly basis and through 2009 on an annual basis, but the data used to calculate price adjustments and labor share are available only through 2008. Furthermore, multifactor productivity measures are published for 1987 through 2008 only. This explains why charts 8 through 11, which include data for the manufacturing sector, end at 2008.
A peak in economic activity marks the end of an economic expansion, and a trough marks the end of a recession. These turning points are officially desig-nated by the National Bureau of Economic Research (see www.nber.org/cycles/cyclesmain.html). In all of the line charts except for chart 11, recessionary periods have been shaded. They are shaded to include the month after the peak month through the trough month. The trough of the most recent recession was June 2009.
Most of the charts focus on labor productivity as it relates to compensation; others show the relative changes in price indexes or labor share of output. Chart 11 uses multifactor productivity measures to show the changing trends in labor costs and other costs. These measures and all others included in this visual essay, except for the implicit price deflator (IPD) for nonfarm business output, are prepared by the Division of Major Sector Productivity in the Of-fice of Productivity and Technology at the Bureau of Labor Statistics. Productivity measures incorporate data published primarily by other Bureau of Labor Statistics programs, the Bureau of Economic Analy-sis (BEA), and the Federal Reserve Board.
The real hourly compensation measures used in this essay differ from other compensation measures published by BLS. The productivity program devel-ops the measures on the basis of BLS and BEA data, making adjustments for coverage. The IPD for non-farm business output is published by the BEA. The consumer price index prepared by the BLS productiv-ity program is the quarterly average of the monthly BLS Consumer Price Index for all Urban Consum-ers Research Series (CPI-U-RS) for 1978 through the most recent full year, currently 2009. Changes in the BLS CPI for all Urban Consumers (CPI-U) are used to estimate an index for years prior to 1978 and for re-cent quarters. The productivity program’s consumer price index based on these measures is displayed in this essay.
Data are presented as indexes and growth rates. Index measures are derived from data on output, hours worked, prices, compensation, and other non-labor inputs. Comparing data which are based on different units and levels—such as billions of dollars and thousands of hours—can skew analysis. To im-prove comparative analysis among widely different measures over long periods of time in the line charts, the indexes were rebased to 100 in the beginning period for easier visual comparison, and then natu-ral logarithms were calculated to ensure constant proportionality of the growth of each index across time. Without this logarithmic transformation, the line graphs would tend to show greater variability towards the end of the period. The growth rates are percent changes in quarterly or annual indexes and are compounded annual growth rates. The com-pensation–productivity gap is the percentage-point difference between the compounded annual growth rates of real hourly compensation and productivity over the same period. All quarterly data are season-ally adjusted.
The charts presented here are based on the De-cember 1, 2010, Productivity and Costs news release prepared by BLS. The data in charts 1 through 10 are updated eight times a year in the Productivity and Costs news release. The data in chart 11 are up-dated once each year in the Multifactor Productivity Trends in Manufacturing news release, most recently published on November 18, 2010. Data are quar-

Monthly Labor Review • January 2011 59
terly or annual, depending on the data series. Data are available by accessing the BLS Web site at www.bls.gov/data/home.htm or by contacting the BLS Division of Major Sector Productivity by telephone at (202) 691–5606 or by e-mail at [email protected]. This essay was prepared by Susan Fleck, divi-sion chief; John Glaser, supervisory economist; and Shawn Sprague, economist; all of whom work in the Division of Major Sector Productivity in the Office
of Productivity and Technology at the Bureau of La-bor Statistics.
Note1 For a comparison of BLS compensation measures, see
Joseph R. Meisenheimer II, “Real compensation, 1979 to 2003: analysis from several data sources,” Monthly Labor Re-view, May 2005, pp. 3–22, on the Internet at www.bls.gov/opub/mlr/2005/05/art1full.pdf (visited Jan. 18, 2011).
1. Productivity and real hourly compensation, nonfarm business sector, first quarter 1947–third quarter 2010
6.4
6.2
6.0
5.8
5.6
5.4
5.2
5.0
4.8
4.6
4.4
4.2
4.0
Productivity
Real hourly compensation
1947 1951 1955 1959 1963 1967 1971 1975 1979 1983 1987 1991 1995 1999 2003 2007 2010
6.4
6.2
6.0
5.8
5.6
5.4
5.2
5.0
4.8
4.6
4.4
4.2
4.0
NOTE: The shaded bars denote National Bureau of Economic Research (NBER)-designated recessions.
Natural logarithm of indexes
Natural logarithm of indexes
• Labor productivity is output, adjusted for price changes, divided by hours worked at all jobs. Productivity in the U.S. nonfarm business sector grew an average of 2.2 percent per year over the past 63 years, despite a pro-longed slowdown from 1973 to 1995.
• Real hourly compensation is the hourly cost to businesses, adjusted for price changes, of wages, salaries, and benefits paid to workers. Real hourly compensation grew at an average annual rate of 1.7 percent over the 63-year period. Since the 1970s, real hourly compensation has grown more slowly than productivity.

Visual Essay: Compensation-Productivity Gap
60 Monthly Labor Review • January 2011
2. Productivity growth and real hourly compensation growth, nonfarm business sector, selected periods, 1947–2009
1947–73 1973–79 1979–90 1990–2000 2000–09
3.0
2.5
2.0
1.5
1.0
0.5
0
3.0
2.5
2.0
1.5
1.0
0.5
0
g Productivityg Real hourly compensation
Average annual percent change
Average annual percent change
• Growth of productivity and real hourly compensation was robust until 1973, at which time growth slowed for both.
• Real hourly compensation growth failed to keep pace with accelerating productivity growth over the past three decades, and the gap between productivity growth and compensation growth widened.

Monthly Labor Review • January 2011 61
3. Changes in price differences, labor share, and the compensation-productivity gap, nonfarm business sector, selected periods, 1947–2009
1947–73 1973–79 1979–90 1990–2000 2000–09
0.2
0.0
–0.2
–0.4
–0.6
–0.8
–1.0
–1.2
–1.4
–1.6
0.2
0.0
–0.2
–0.4
–0.6
–0.8
–1.0
–1.2
–1.4
–1.6
g Change in labor’s share of nominal outputg Growth in real hourly compensation minus growth in productivity
g Growth in implicit price deflator of nonfarm business output minus growth in Consumer Price Index
Average annual percent change
Average annual percent change
• There are two components that account for the gap between real hourly compensation growth and pro-ductivity growth. The first is the difference between the price indexes used to account for inflation in the BLS productivity and hourly compensation measures. The second is the change in “labor share,” which, as explained earlier, is the share of output that is accounted for by workers’ wages, salaries, and benefits.
• Before 2000, the difference between the growth rates of the CPI and the IPD—that is, the difference in inflation rates—explained most of the gap in each period. For 2000 to 2009, an unprecedented decline in labor share accounted for most of the gap.

Visual Essay: Compensation-Productivity Gap
62 Monthly Labor Review • January 2011
4. Price indexes, nonfarm business sector, first quarter 1947–third quarter 2010
7.0
6.5
6.0
5.5
5.0
4.5
7.0
6.5
6.0
5.5
5.0
4.5 1947 1951 1955 1959 1963 1967 1971 1975 1979 1983 1987 1991 1995 1999 2003 2007 2010
Consumer Price Index
Implicit price deflator of nonfarm business output
NOTE: The shaded bars denote National Bureau of Economic Research (NBER)-designated recessions.
Natural logarithm of indexes
Natural logarithm of indexes
• A price index measures the price of a basket of goods and services over time. The compensation–productivity gap is partly accounted for by the difference between the two price indexes used to remove the effect of infla-tion. The implicit price deflator, used to remove the effect of inflation on output, measures price changes in the goods and services produced in the nonfarm business sector. The Consumer Price Index measures price changes in the basket of goods and services purchased by families and workers; it is used to calculate real hourly compensation.
• The Consumer Price Index has grown more quickly than the implicit price deflator in recent decades. The difference can be explained partly by computers. Since the 1990s, computers have represented a larger share of nonfarm business output than of consumer purchases. As the cost of computers fell, the effect of ever-cheaper computers slowed the growth of output prices more than it slowed the growth of the CPI.

Monthly Labor Review • January 2011 63
5. Labor share of nonfarm business sector output, first quarter 1947–third quarter 2010
70
68
66
64
62
60
58
56
54
52
70
68
66
64
62
60
58
56
54
52
NOTE: The shaded bars denote National Bureau of Economic Research (NBER)-designated recessions.
1947 1951 1955 1959 1963 1967 1971 1975 1979 1983 1987 1991 1995 1999 2003 2007 2010
Percent Percent
• Labor share is the portion of output that employers spend on labor costs (wages, salaries, and benefits) valued in each year’s prices. Nonlabor share—the remaining portion of output—includes returns to capital, such as profits, net interest, depreciation, and indirect taxes.
• Labor share averaged 64.3 percent from 1947 to 2000. Labor share has declined over the past decade, falling to its lowest point in the third quarter of 2010, 57.8 percent. The change in labor share from one period to the next has become a major factor contributing to the compensation–productivity gap in the nonfarm busi-ness sector.
Visual Essay: Compensation-Productivity Gap
64 Monthly Labor Review • January 2011
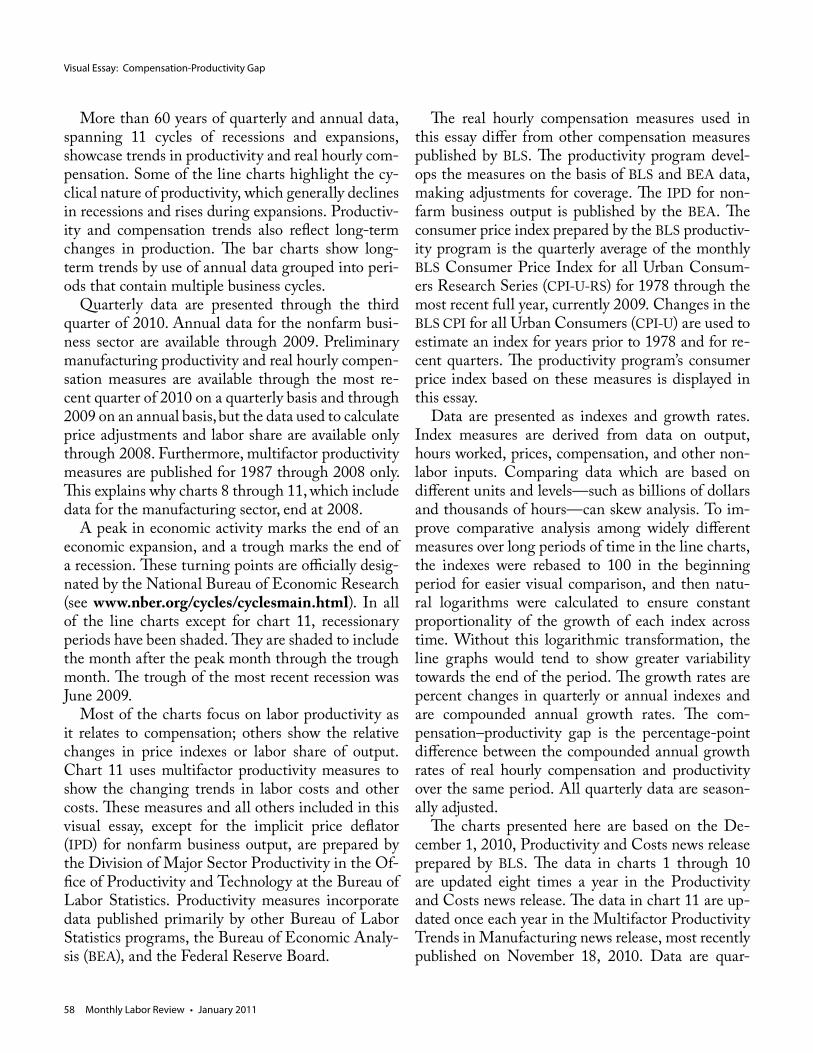
6. Productivity and real hourly compensation, manufacturing sector, first quarter 1949–third quarter 2010
7.0
6.86.6
6.46.2
6.0
5.8
5.65.4
5.2
5.04.84.6
4.4
4.24.0
7.0
6.86.6
6.46.2
6.0
5.8
5.65.4
5.2
5.04.84.6
4.4
4.24.0
Productivity
Real hourly compensation
NOTE: The shaded bars denote National Bureau of Economic Research (NBER)-designated recessions.
1949 1953 1957 1961 1965 1969 1973 1977 1981 1985 1989 1993 1997 2001 2005 2009
Natural logarithm of indexes
Natural logarithm of indexes
• Productivity in the manufacturing sector has risen 2.9 percent on average each year since 1949, despite a slow-down from 1973 through 1981.
• Growth in real hourly compensation kept ahead of productivity growth in the manufacturing sector until the mid-1970s. Subsequently, productivity continued its upward trend, whereas real hourly compensation growth was relatively flat.
Monthly Labor Review • January 2011 65
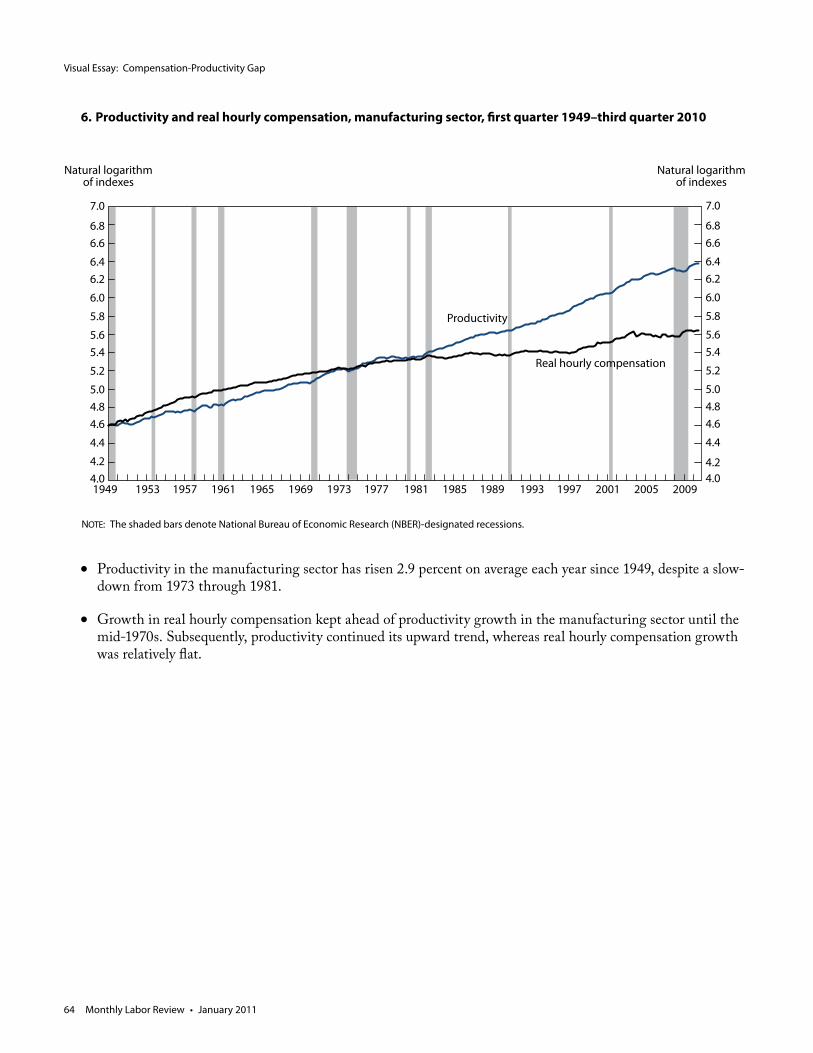
7. Productivity growth and real hourly compensation growth, manufacturing sector, selected periods, 1949–2009
Average hours per day
g Productivityg Real hourly compensation
1949–73 1973–79 1979–90 1990–2000 2000–09
4.5
4.0
3.5
3.0
2.5
2.0
1.5
1.0
0.5
0
4.5
4.0
3.5
3.0
2.5
2.0
1.5
1.0
0.5
0
Average annual percent change
Average annual percent change
• Growth of productivity and real hourly compensation in manufacturing was robust until the 1973–79 period. The productivity slowdown in manufacturing was not as severe as that in nonfarm business as a whole.
• Manufacturing productivity growth rates from the 1980s and after surpassed the sector’s earlier growth rates. Real hourly compensation growth, in contrast, slowed greatly in the 1980s and has not kept up with produc-tivity gains.

Visual Essay: Compensation-Productivity Gap
66 Monthly Labor Review • January 2011
8. Changes in price differences, labor share, and the compensation-productivity gap, manufacturing sector, selected periods, 1949–2008
1949–73 1973–79 1979–90 1990–2000 2000–08
2.0
1.5
1.0
0.5
0.0
–0.5
–1.0
–1.5
–2.0
–2.5
–3.0
g Change in labor’s share of nominal outputg Growth in real hourly compensation minus growth in productivity
2.0
1.5
1.0
0.5
0.0
–0.5
–1.0
–1.5
–2.0
–2.5
–3.0
Average annual percent change
Average annual percent change
• The compensation–productivity gap in the manufacturing sector emerged after 1973.
• The widening gap in the 1980s and 1990s reflected growing differences between the CPI and the IDP. From 2000 to 2008, the decline in labor share had a large effect on the compensation–productivity gap.
g Growth in implicit price deflator of manufacturing output minus growth in Consumer Price Index
Monthly Labor Review • January 2011 67
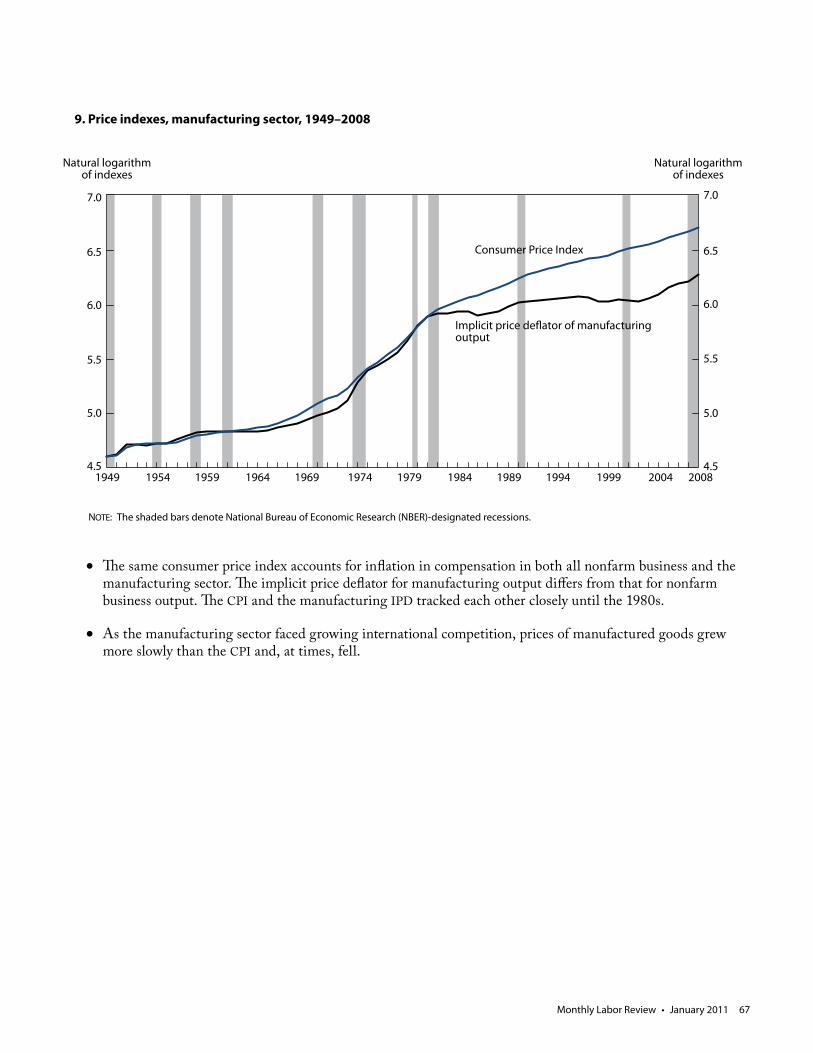
9. Price indexes, manufacturing sector, 1949–2008
1949 1954 1959 1964 1969 1974 1979 1984 1989 1994 1999 2004 2008
Consumer Price Index
Implicit price deflator of manufacturing output
7.0
6.5
6.0
5.5
5.0
4.5
7.0
6.5
6.0
5.5
5.0
4.5
NOTE: The shaded bars denote National Bureau of Economic Research (NBER)-designated recessions.
Natural logarithm of indexes
Natural logarithm of indexes
• The same consumer price index accounts for inflation in compensation in both all nonfarm business and the manufacturing sector. The implicit price deflator for manufacturing output differs from that for nonfarm business output. The CPI and the manufacturing IPD tracked each other closely until the 1980s.
• As the manufacturing sector faced growing international competition, prices of manufactured goods grew more slowly than the CPI and, at times, fell.

Visual Essay: Compensation-Productivity Gap
68 Monthly Labor Review • January 2011
10. Labor share of manufacturing sector output, 1949–2008
1949 1954 1959 1964 1969 1974 1979 1984 1989 1994 1999 2004 2008
45
40
35
30
25
20
NOTE: The shaded bars denote National Bureau of Economic Research (NBER)-designated recessions.
45
40
35
30
25
20
Percent Percent
• Unlike nonfarm business output, which represents the value added by capital and labor, manufacturing sec-tor output counts final output sold to U.S. consumers, output sold as exports, and output sold to businesses in other sectors. Furthermore, manufacturing sector input expands nonlabor costs to include energy, materi-als, and services provided as intermediate inputs from other sectors and from imports. Thus, labor costs, or compensation, in manufacturing account for a smaller share of sectoral output compared with labor costs for all nonfarm businesses.
• Labor share grew quickly in manufacturing during the 1950s and 1960s before falling precipitously during the early 1970s and from 2003 through 2008.
Monthly Labor Review • January 2011 69
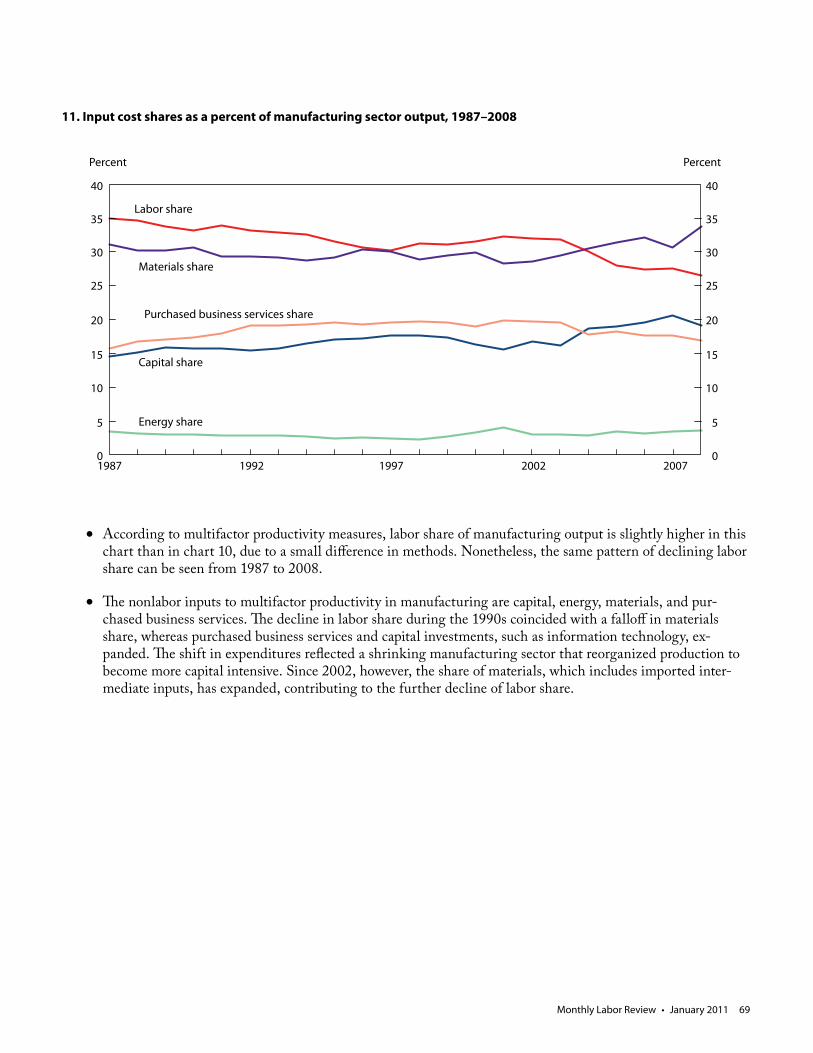
11. Input cost shares as a percent of manufacturing sector output, 1987–2008
40
35
30
25
20
15
10
5
0 1987 1992 1997 2002 2007
40
35
30
25
20
15
10
5
0
Percent Percent
Labor share
Materials share
Purchased business services share
Capital share
Energy share
• According to multifactor productivity measures, labor share of manufacturing output is slightly higher in this chart than in chart 10, due to a small difference in methods. Nonetheless, the same pattern of declining labor share can be seen from 1987 to 2008.
• The nonlabor inputs to multifactor productivity in manufacturing are capital, energy, materials, and pur-chased business services. The decline in labor share during the 1990s coincided with a falloff in materials share, whereas purchased business services and capital investments, such as information technology, ex-panded. The shift in expenditures reflected a shrinking manufacturing sector that reorganized production to become more capital intensive. Since 2002, however, the share of materials, which includes imported inter-mediate inputs, has expanded, contributing to the further decline of labor share.


![BLS Magnet Innovative magnetic materials & solutions · BLS Magnet [8] Attractive technology BLS Magnet [9] Attractive technology BLS Magnet’s magnetic accessories are used in many](https://img.pdfslide.net/doc/110x75/5fe1e8025c38ec6ec573533b/bls-magnet-innovative-magnetic-materials-bls-magnet-8-attractive-technology.jpg)