Embed Size (px)
Citation preview
The Competitive Position of Australian Grains in SE Asian markets -
5 years after deregulationDr. Soon-Bin Neoh
Soon Soon Group of CompaniesMalaysia
24 February 2014
Content1. Competitive trade position of Australian wheat in SE Asia post
deregulation2. Comparison of Australian wheat with wheat from other origins in
Asian food products3. Performance of new varieties of Australian Prime Hard (EGA
Kidman & Gascoigne) developed for sponge and dough bread making
4. Potential use of Australian soybeans in Asian food products5. Potential for Australian canola in SE Asia6. Opportunities for the use of lupins in Asian foods and animal
feeds7. Take home messages
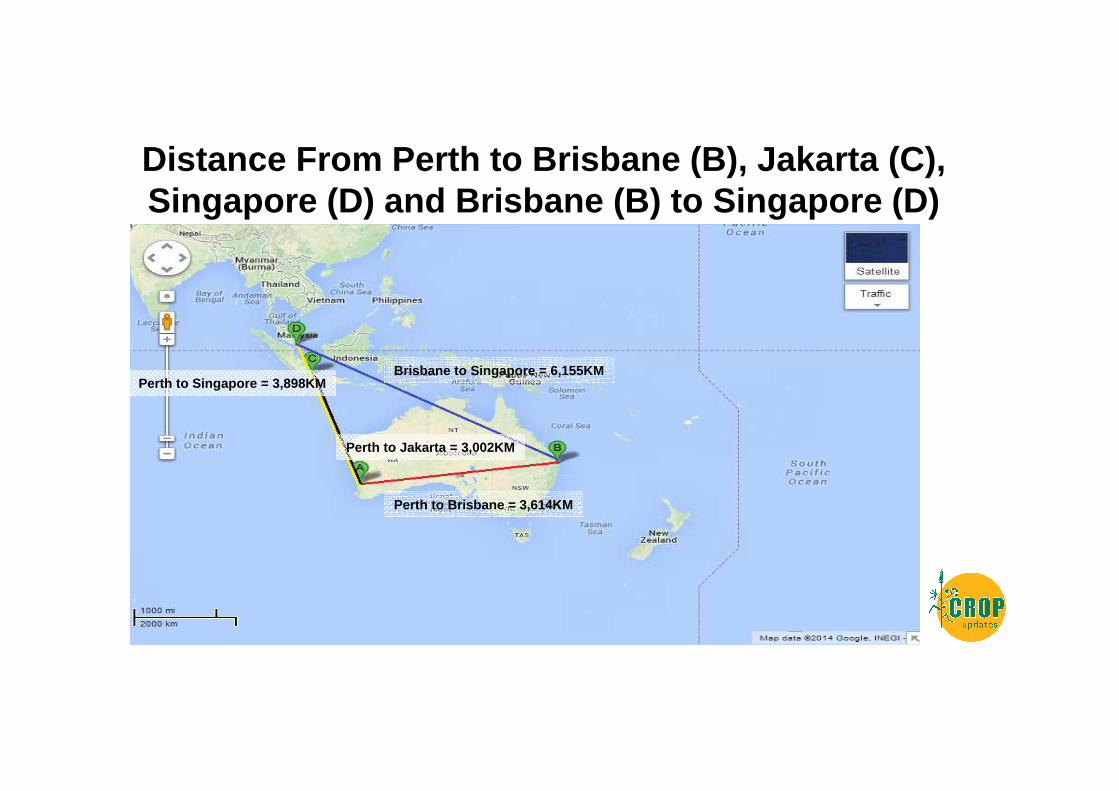
Distance From Perth to Brisbane (B), Jakarta (C), Singapore (D) and Brisbane (B) to Singapore (D)
Brisbane to Singapore = 6,155KM
Perth to Jakarta = 3,002KM
Perth to Brisbane = 3,614KM
Perth to Singapore = 3,898KM
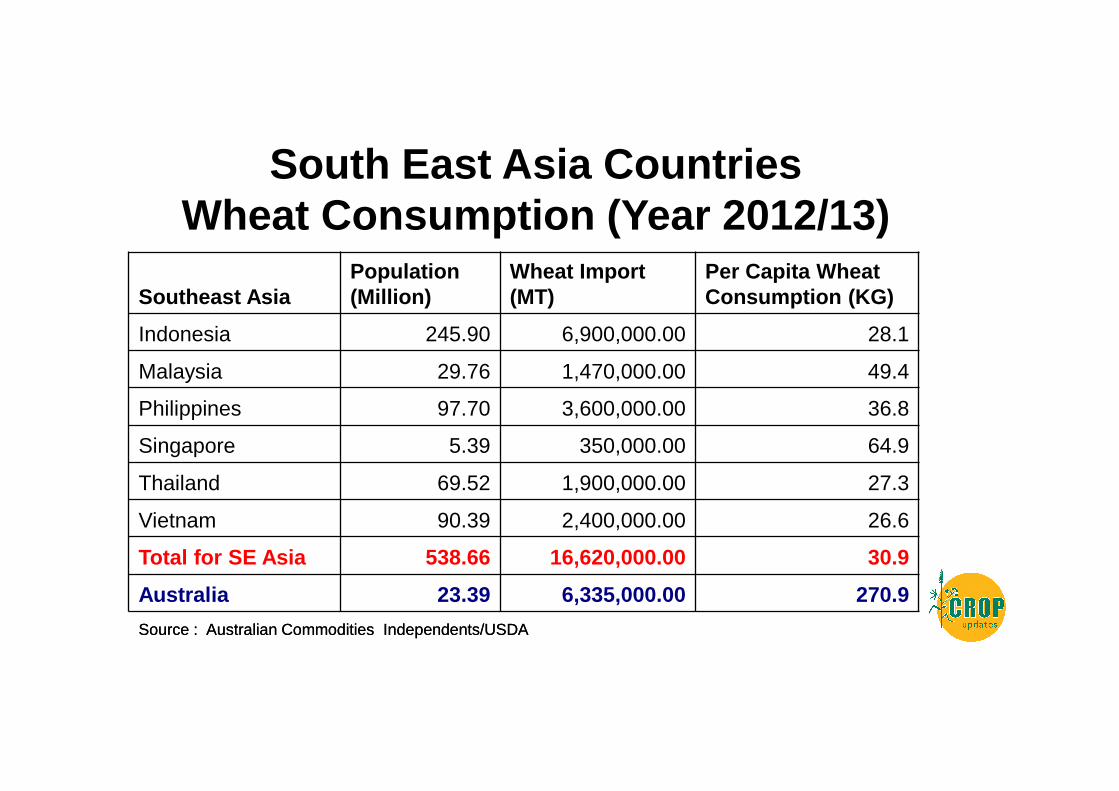
South East Asia Countries Wheat Consumption (Year 2012/13)
Southeast AsiaPopulation (Million)
Wheat Import (MT)
Per Capita Wheat Consumption (KG)
Indonesia 245.90 6,900,000.00 28.1
Malaysia 29.76 1,470,000.00 49.4
Philippines 97.70 3,600,000.00 36.8
Singapore 5.39 350,000.00 64.9
Thailand 69.52 1,900,000.00 27.3
Vietnam 90.39 2,400,000.00 26.6
Total for SE Asia 538.66 16,620,000.00 30.9
Australia 23.39 6,335,000.00 270.9
Source : Australian Commodities Independents/USDASource : Australian Commodities Independents/USDA
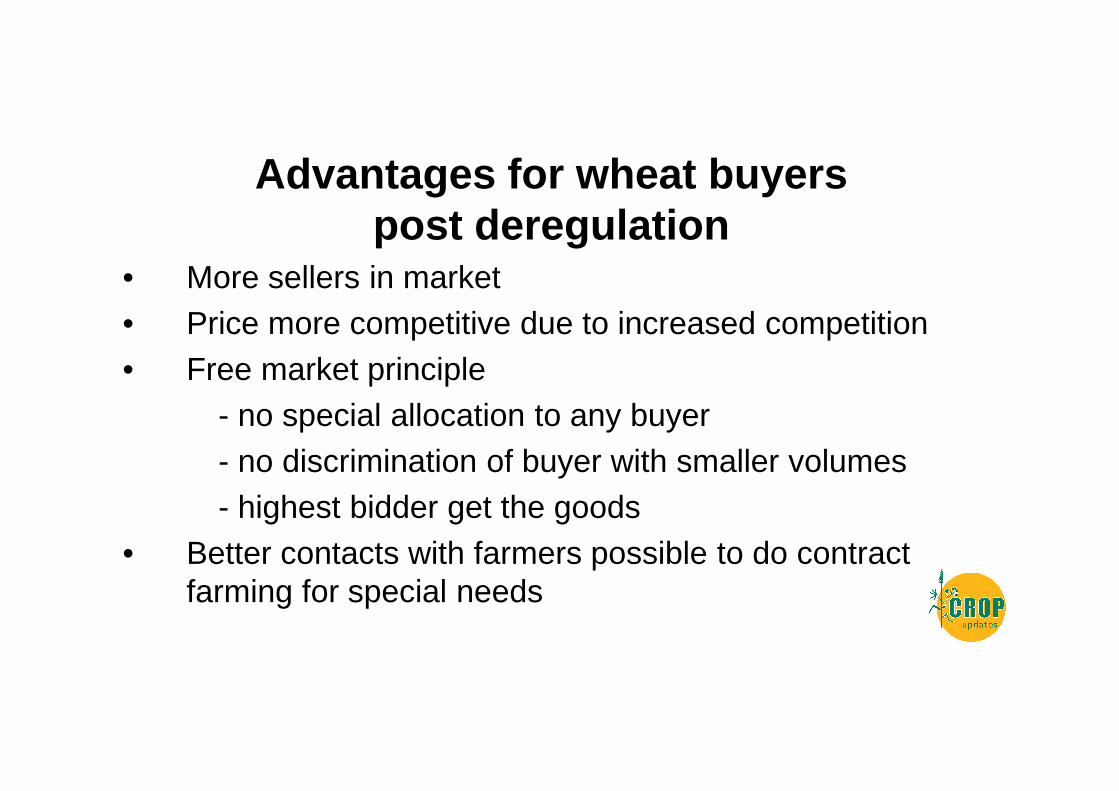
Advantages for wheat buyers post deregulation
• More sellers in market• Price more competitive due to increased competition• Free market principle
- no special allocation to any buyer- no discrimination of buyer with smaller volumes- highest bidder get the goods
• Better contacts with farmers possible to do contract farming for special needs
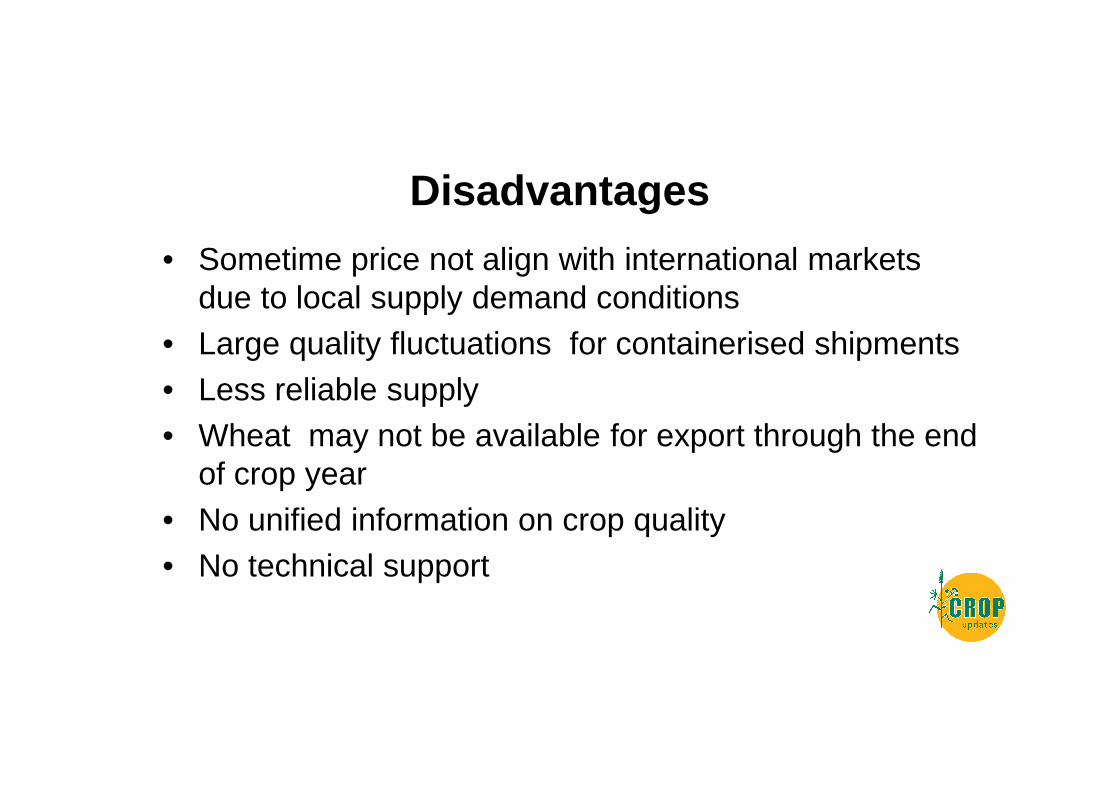
Disadvantages
• Sometime price not align with international markets due to local supply demand conditions
• Large quality fluctuations for containerised shipments• Less reliable supply• Wheat may not be available for export through the end
of crop year• No unified information on crop quality• No technical support
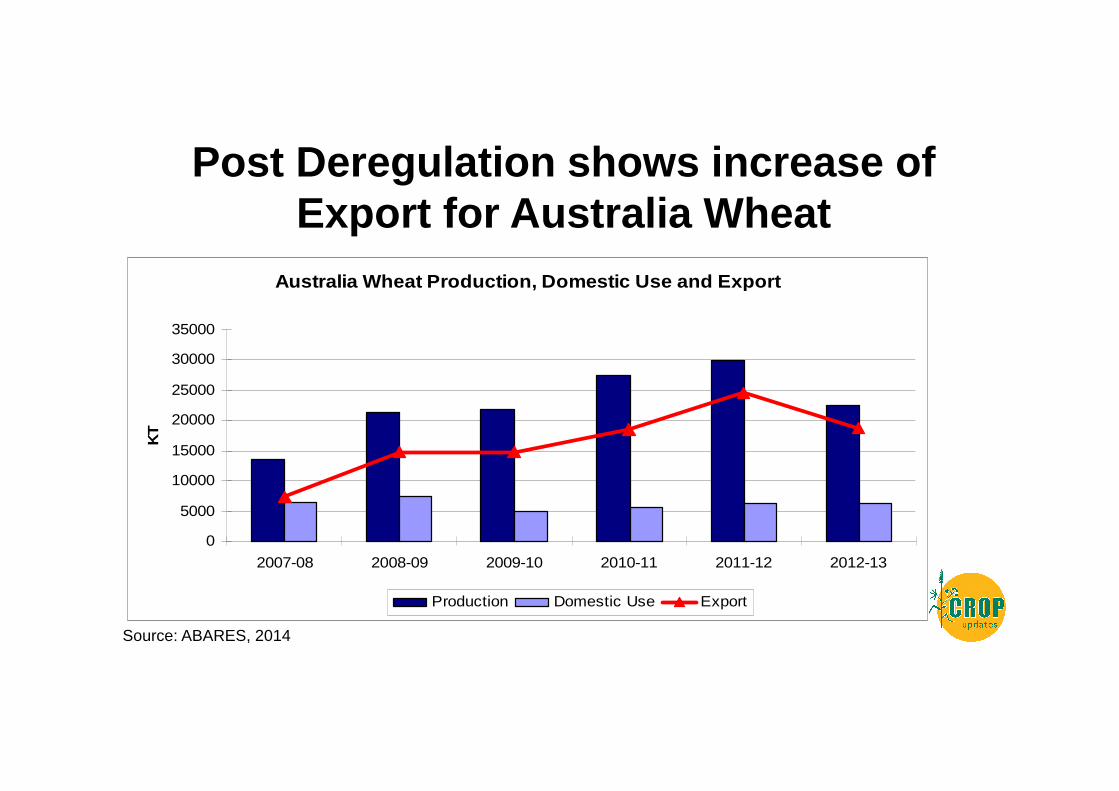
Post Deregulation shows increase of Export for Australia Wheat
Source: ABARES, 2014
Australia Wheat Production, Domestic Use and Export
0
5000
10000
15000
20000
25000
30000
35000
2007-08 2008-09 2009-10 2010-11 2011-12 2012-13
KT
Production Domestic Use Export
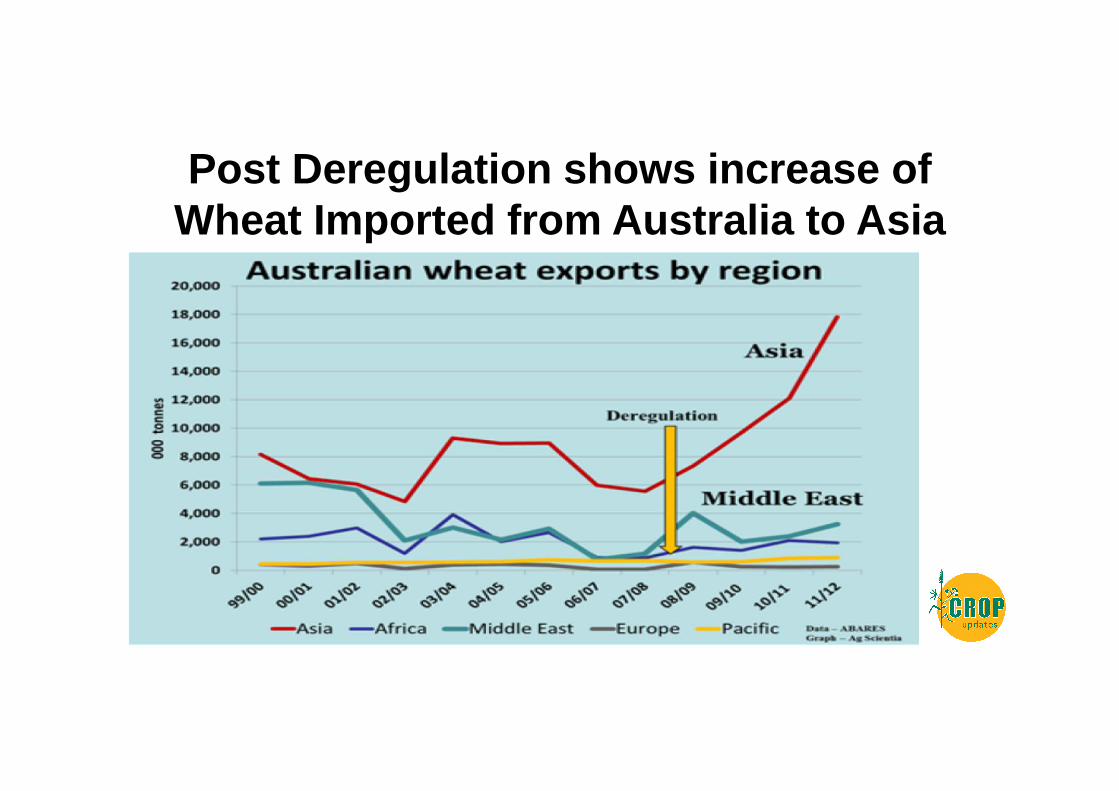
Post Deregulation shows increase of Wheat Imported from Australia to Asia
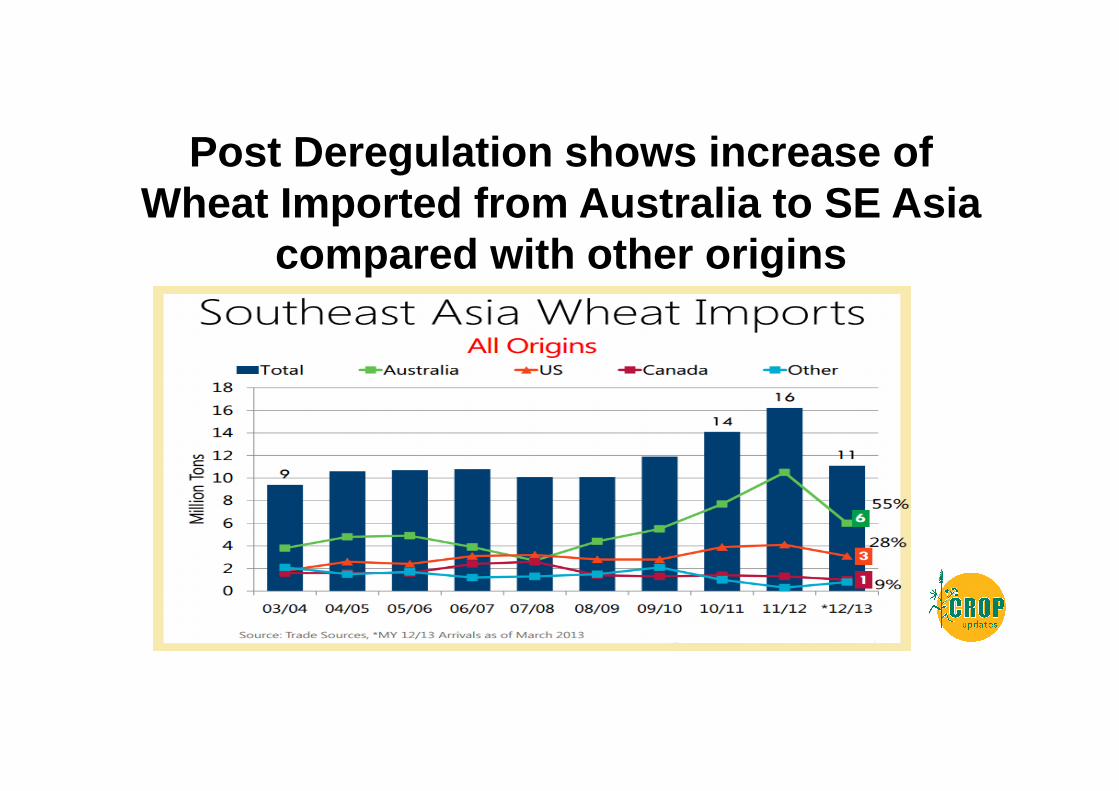
Post Deregulation shows increase of Wheat Imported from Australia to SE Asia
compared with other origins
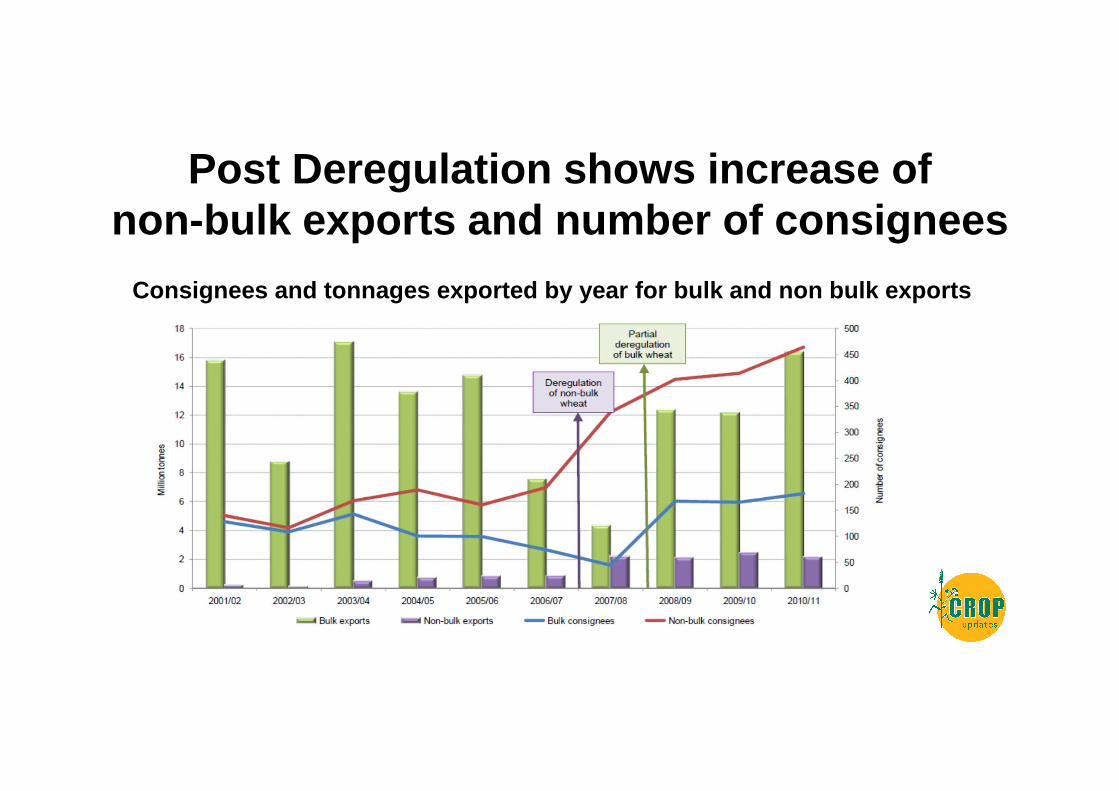
Post Deregulation shows increase of non -bulk exports and number of consignees
Consignees and tonnages exported by year for bulk a nd non bulk exports
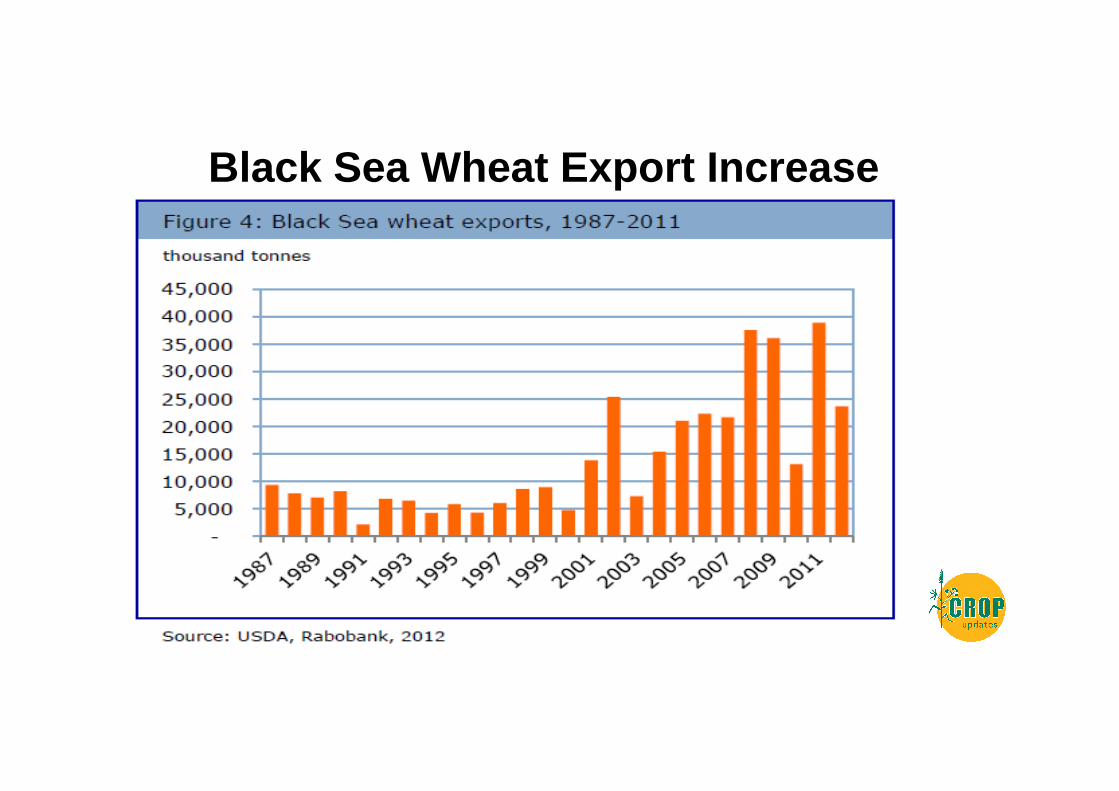
Black Sea Wheat Export Increase
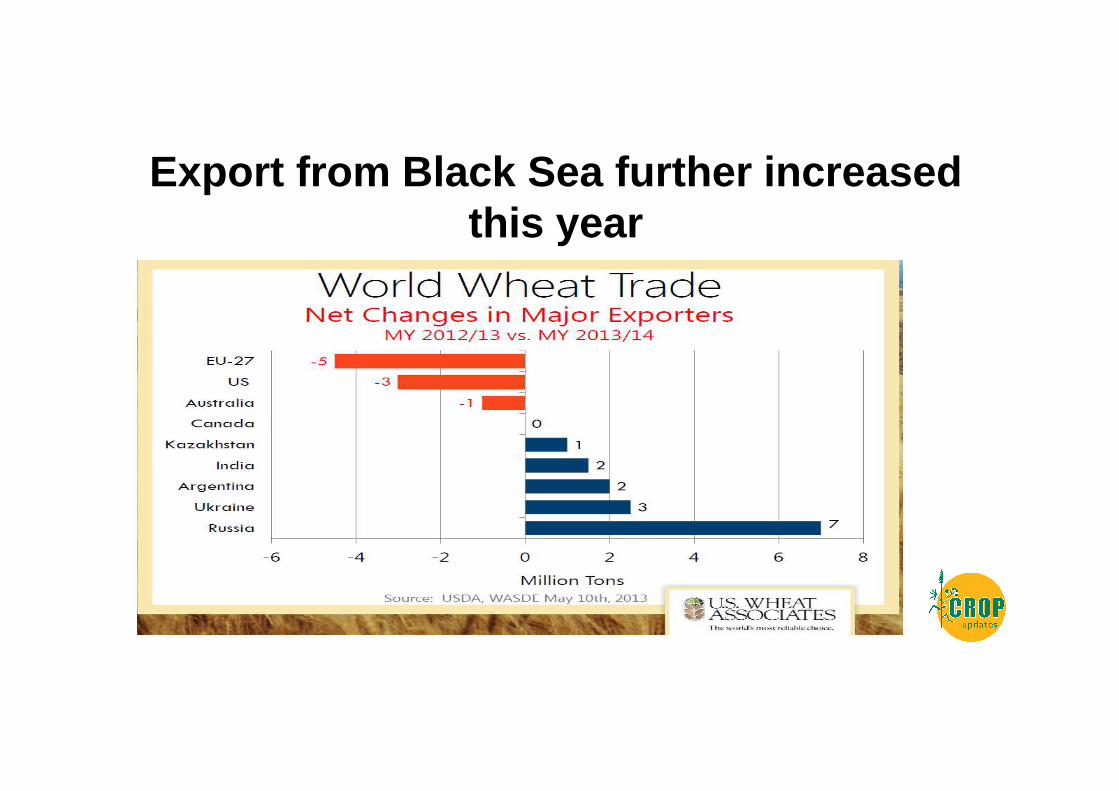
Export from Black Sea further increased this year
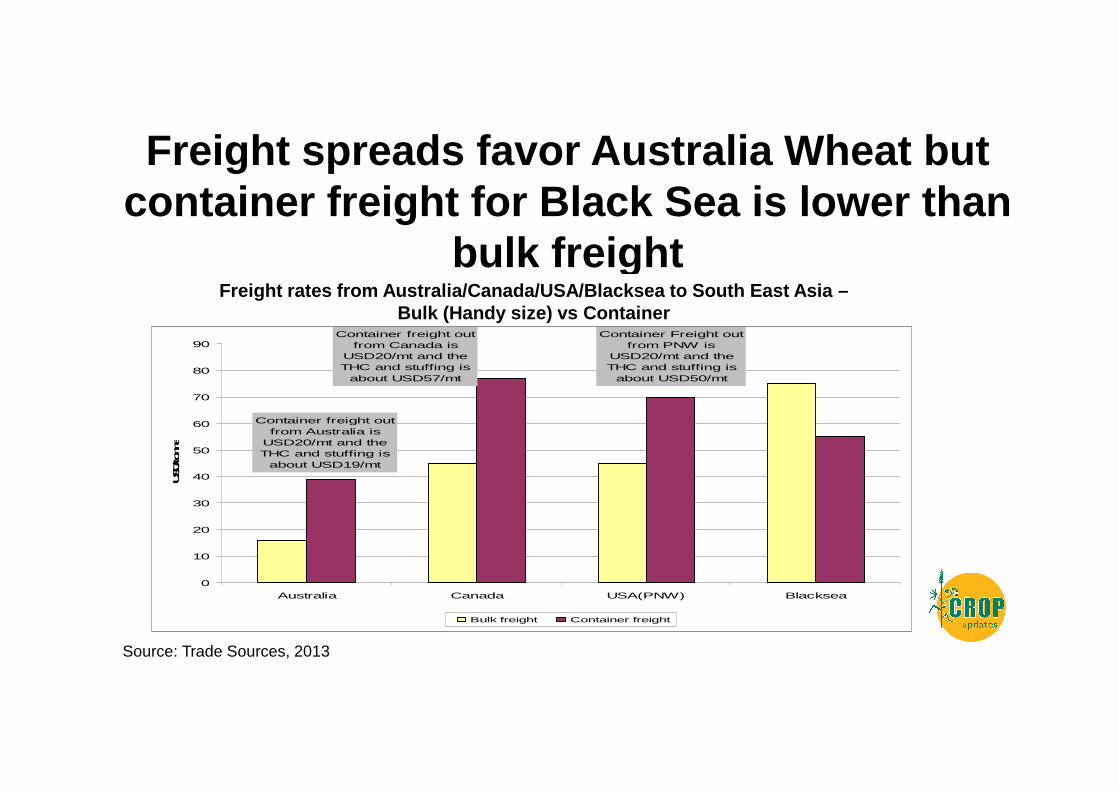
Freight spreads favor Australia Wheat but container freight for Black Sea is lower than
bulk freightFreight rates from Australia/Canada/USA/Blacksea to South East Asia –
Bulk (Handy size) vs ContainerContainer Freight out
from PNW is USD20/mt and the THC and stuffing is
about USD50/mt
Container freight out from Australia is
USD20/mt and the THC and stuffing is
about USD19/mt
Container freight out from Canada is
USD20/mt and the THC and stuffing is
about USD57/mt
0
10
20
30
40
50
60
70
80
90
Australia Canada USA(PNW) Blacksea
USD/tonne
Bulk freight Container freight
Source: Trade Sources, 2013
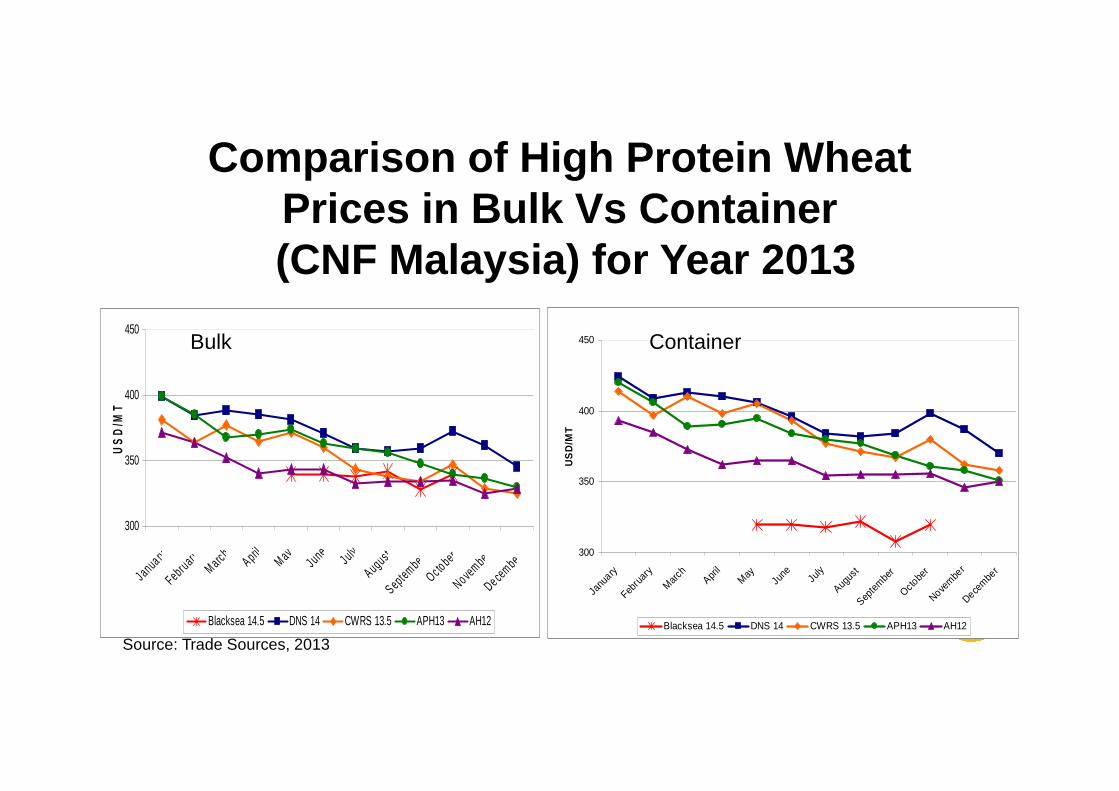
Comparison of High Protein Wheat Prices in Bulk Vs Container(CNF Malaysia) for Year 2013
300
350
400
450
Janua ry February
March April
M ay
June July
August September
Oc to berNo vembe rDe cembe r
US
D/M
T
Blacksea 14.5 DNS 14 CWRS 13.5 APH13 AH12
Source: Trade Sources, 2013
Bulk
300
350
400
450
Janu
ary Feb
ruar
y
March
April
May
June
July
Augus
t Sep
tembe
rOcto
ber
Novembe
rDece
mber
US
D/M
T
Blacksea 14.5 DNS 14 CWRS 13.5 APH13 AH12
Container
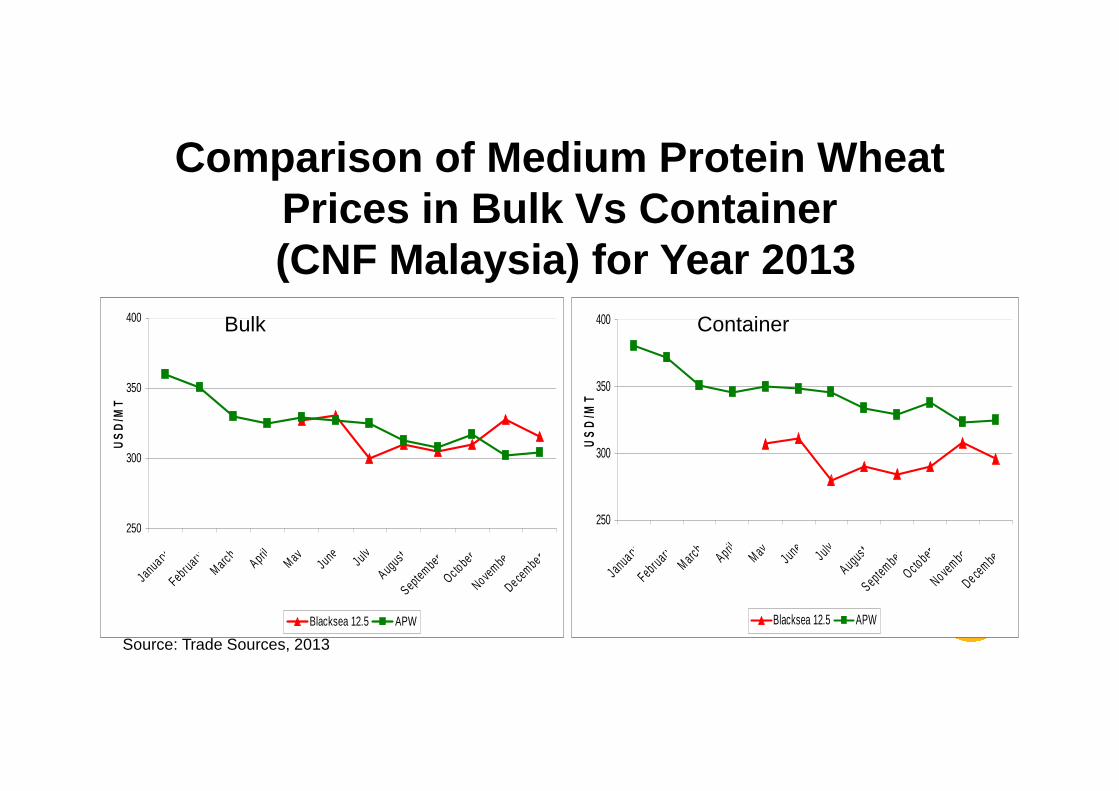
Comparison of Medium Protein Wheat Prices in Bulk Vs Container (CNF Malaysia) for Year 2013
250
300
350
400
Janua ry February
March April
May
June
JulyAugust
SeptemberOc tober
Novembe rDece
mbe r
US
D/M
T
Blacksea 12.5 APW
Source: Trade Sources, 2013
Bulk
250
300
350
400
Janua ry February
March A prilM ay
June J uly
Augus t S eptember
Oc to berNo vembe rDe cembe r
US
D/M
T
Blacksea 12.5 APW
Container
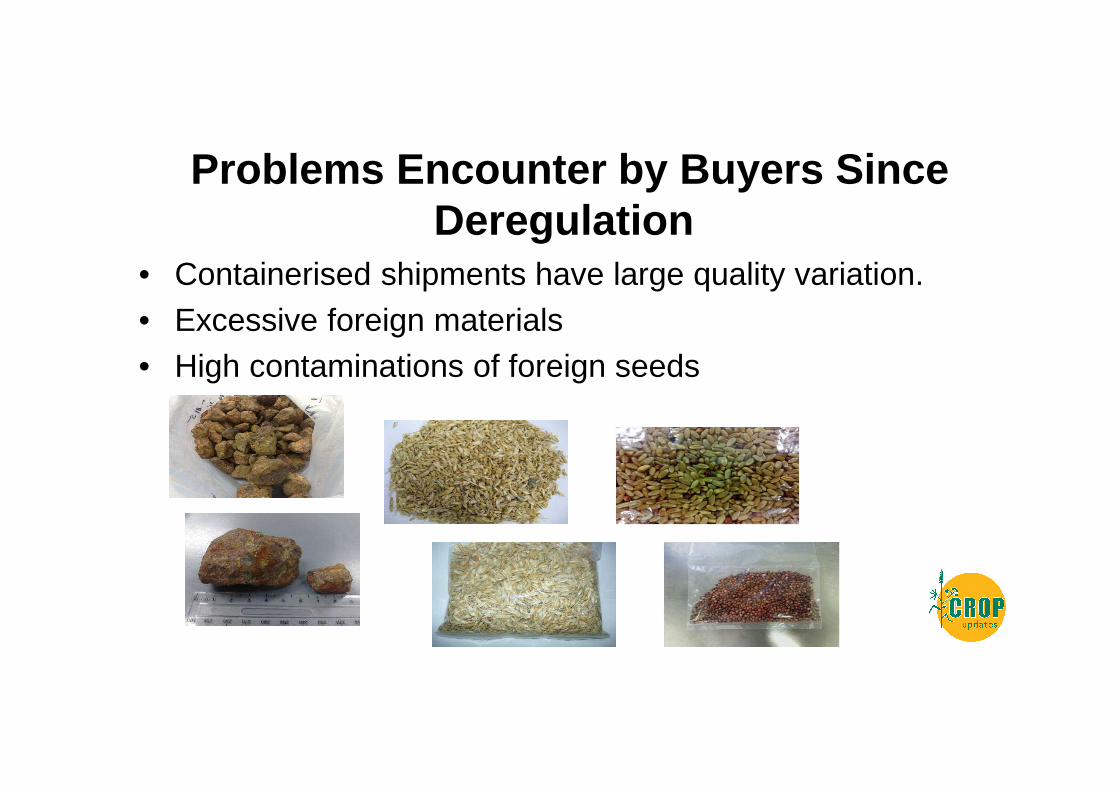
Problems Encounter by Buyers Since Deregulation
• Containerised shipments have large quality variation.• Excessive foreign materials• High contaminations of foreign seeds
Problems Encounter by Buyers Since Deregulation
• Classification of wheat type especially for containerised shipments is uncertain e.g. who will certify what is APH or AH
• Occasionally shortage of containers and container loading facilities
Comparison of Australian wheats with wheats from
other origins in Asian food products
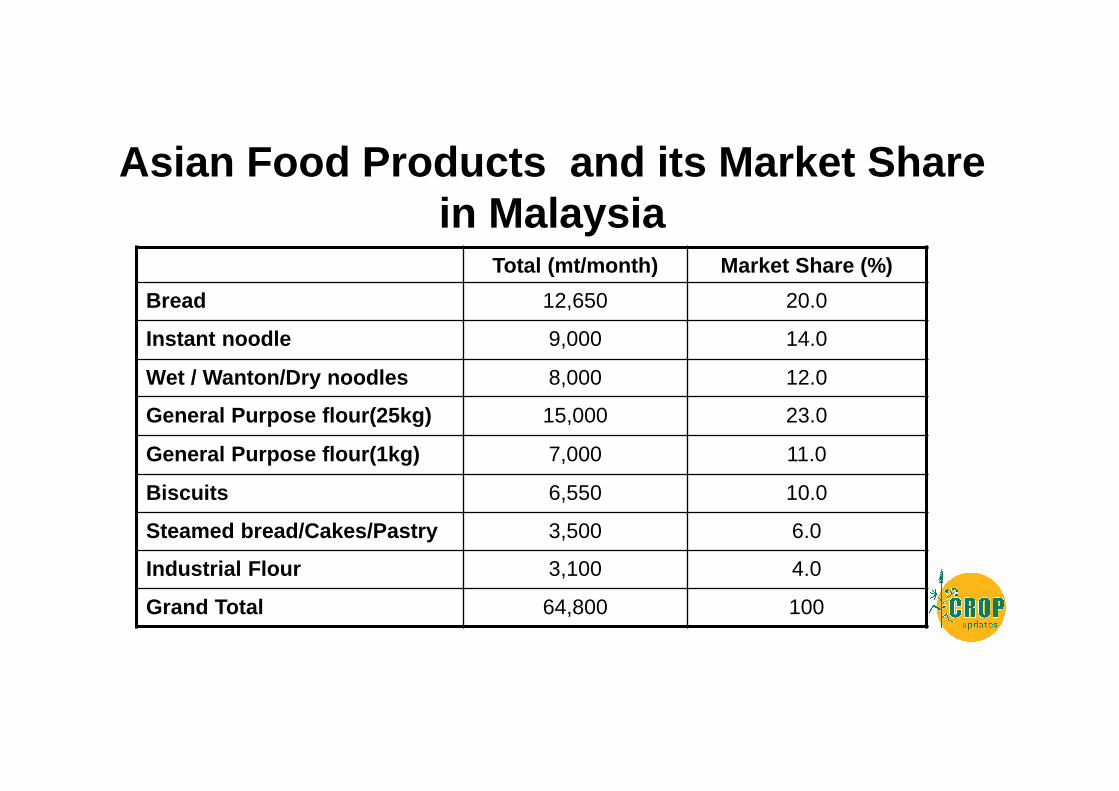
Asian Food Products and its Market Share in Malaysia
Total (mt/month) Market Share (%)
Bread 12,650 20.0
Instant noodle 9,000 14.0
Wet / Wanton/Dry noodles 8,000 12.0
General Purpose flour(25kg) 15,000 23.0
General Purpose flour(1kg) 7,000 11.0
Biscuits 6,550 10.0
Steamed bread/Cakes/Pastry 3,500 6.0
Industrial Flour 3,100 4.0
Grand Total 64,800 100
Asian Food Products Using Wheat Flour
* Noodles (alkaline noodle, Instant noodle, wanton noodle)
* White Bread and buns
* Cracker biscuit
* Marie biscuit
* Steamed bread
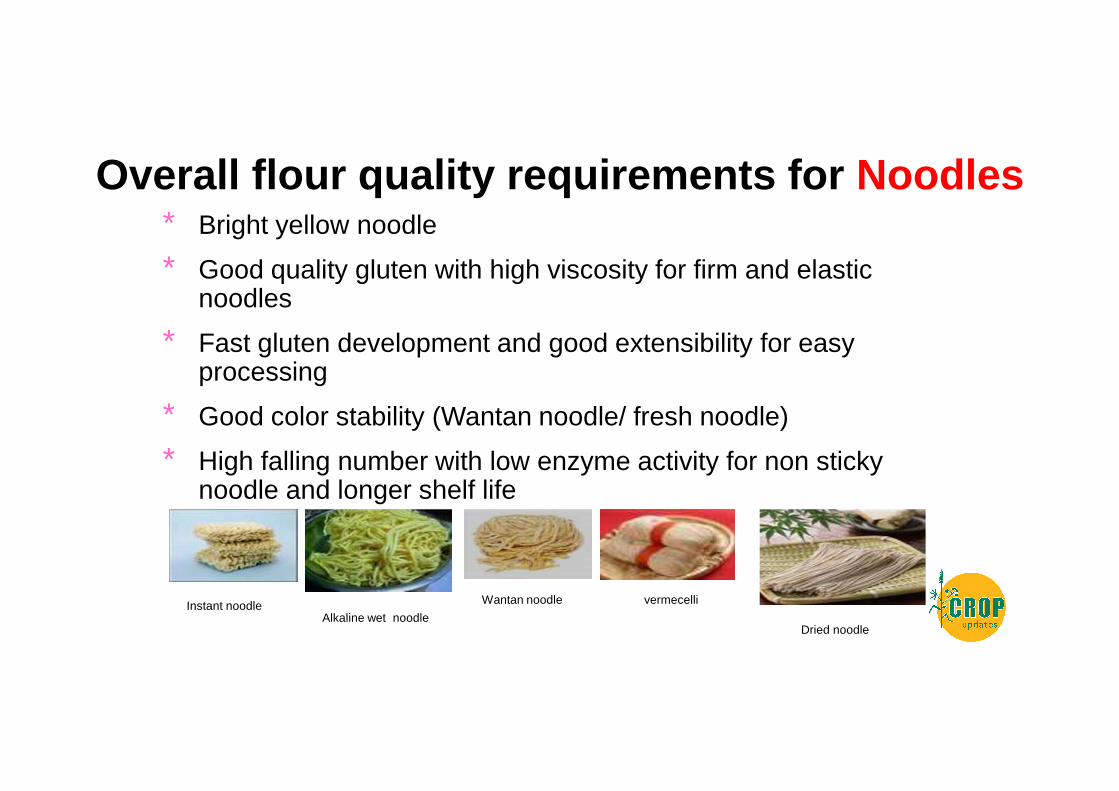
Overall flour quality requirements for Noodles* Bright yellow noodle
* Good quality gluten with high viscosity for firm and elastic noodles
* Fast gluten development and good extensibility for easy processing
* Good color stability (Wantan noodle/ fresh noodle)
* High falling number with low enzyme activity for non sticky noodle and longer shelf life
Instant noodleAlkaline wet noodle
Wantan noodle vermecelli
Dried noodle
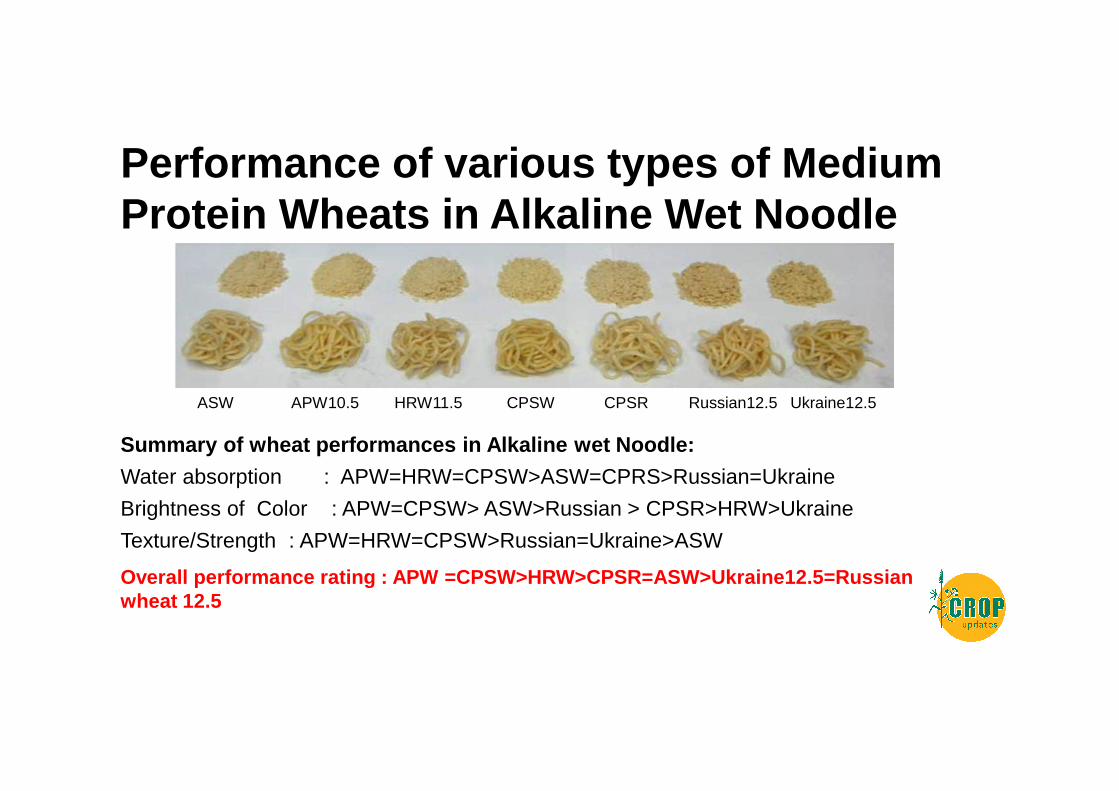
ASW APW10.5 HRW11.5 CPSW CPSR Russian12.5 Ukraine12.5
Summary of wheat performances in Alkaline wet Noodl e:
Water absorption : APW=HRW=CPSW>ASW=CPRS>Russian=Ukraine
Brightness of Color : APW=CPSW> ASW>Russian > CPSR>HRW>Ukraine
Texture/Strength : APW=HRW=CPSW>Russian=Ukraine>ASW
Overall performance rating : APW =CPSW>HRW>CPSR=ASW>Ukraine 12.5=Russian wheat 12.5
Performance of various types of Medium Protein Wheats in Alkaline Wet Noodle
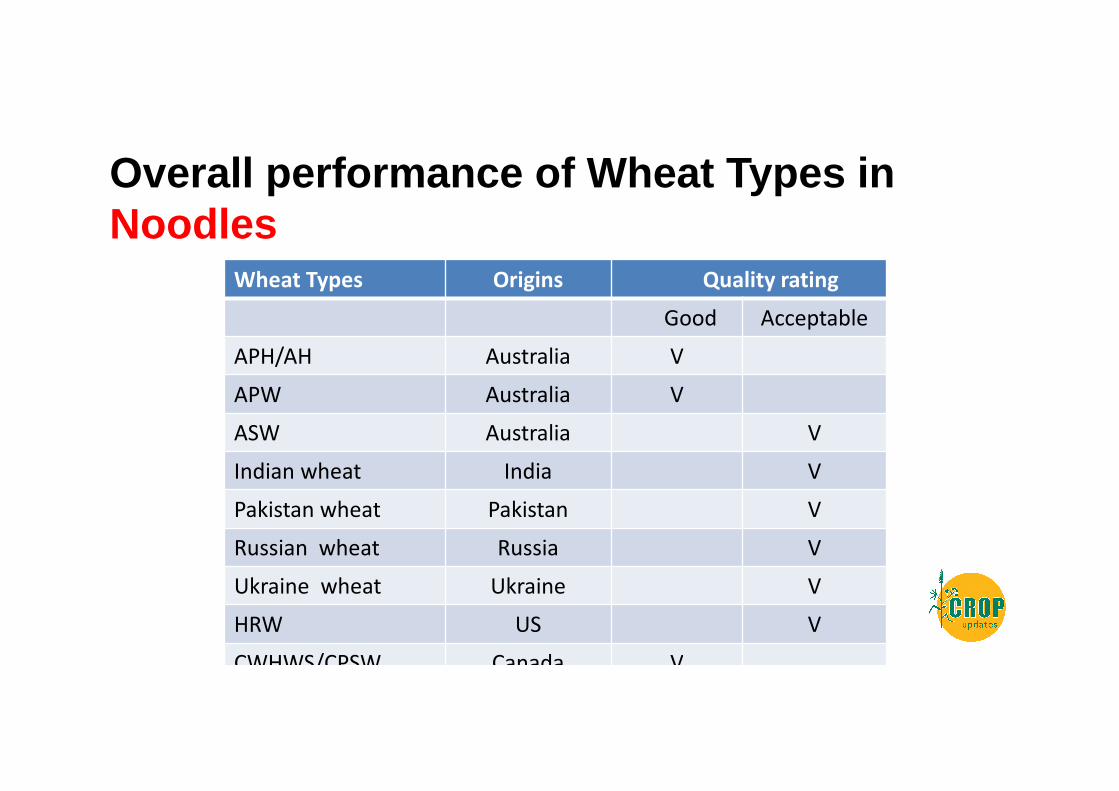
Overall performance of Wheat Types in Noodles
Wheat Types Origins Quality rating
Good Acceptable
APH/AH Australia V
APW Australia V
ASW Australia V
Indian wheat India V
Pakistan wheat Pakistan V
Russian wheat Russia V
Ukraine wheat Ukraine V
HRW US V
CWHWS/CPSW Canada V
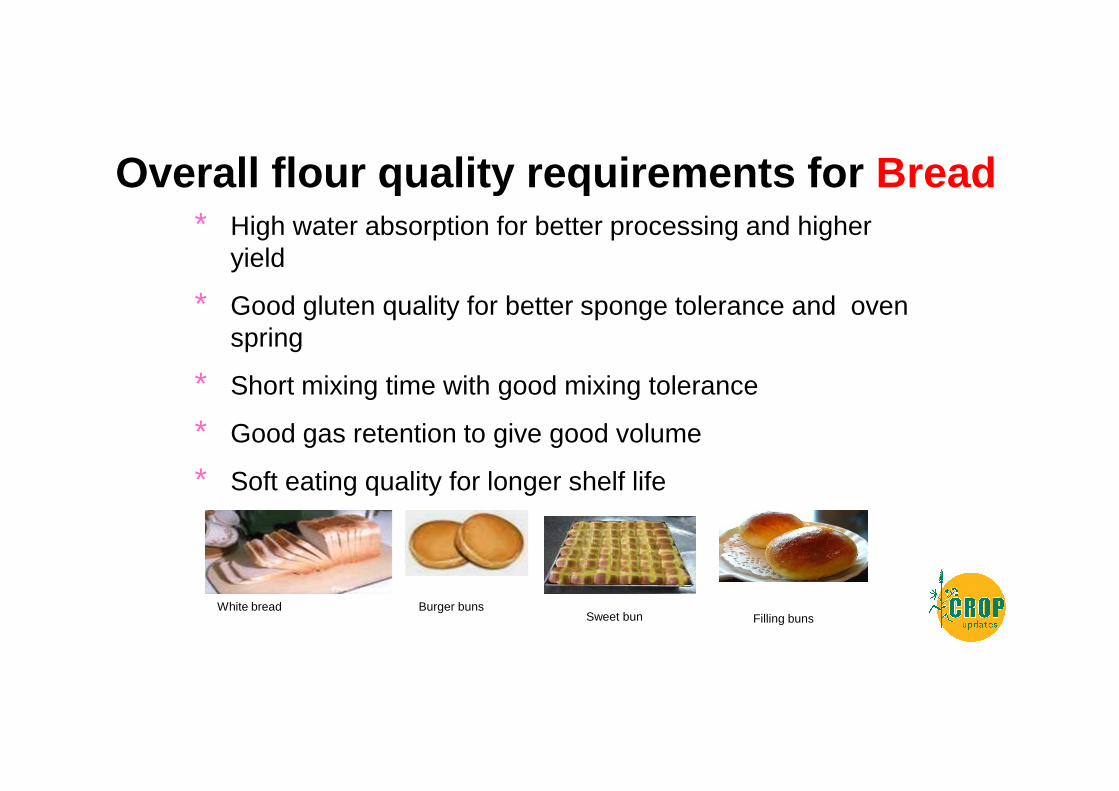
Overall flour quality requirements for Bread* High water absorption for better processing and higher
yield
* Good gluten quality for better sponge tolerance and oven spring
* Short mixing time with good mixing tolerance
* Good gas retention to give good volume
* Soft eating quality for longer shelf life
White bread Burger bunsSweet bun Filling buns
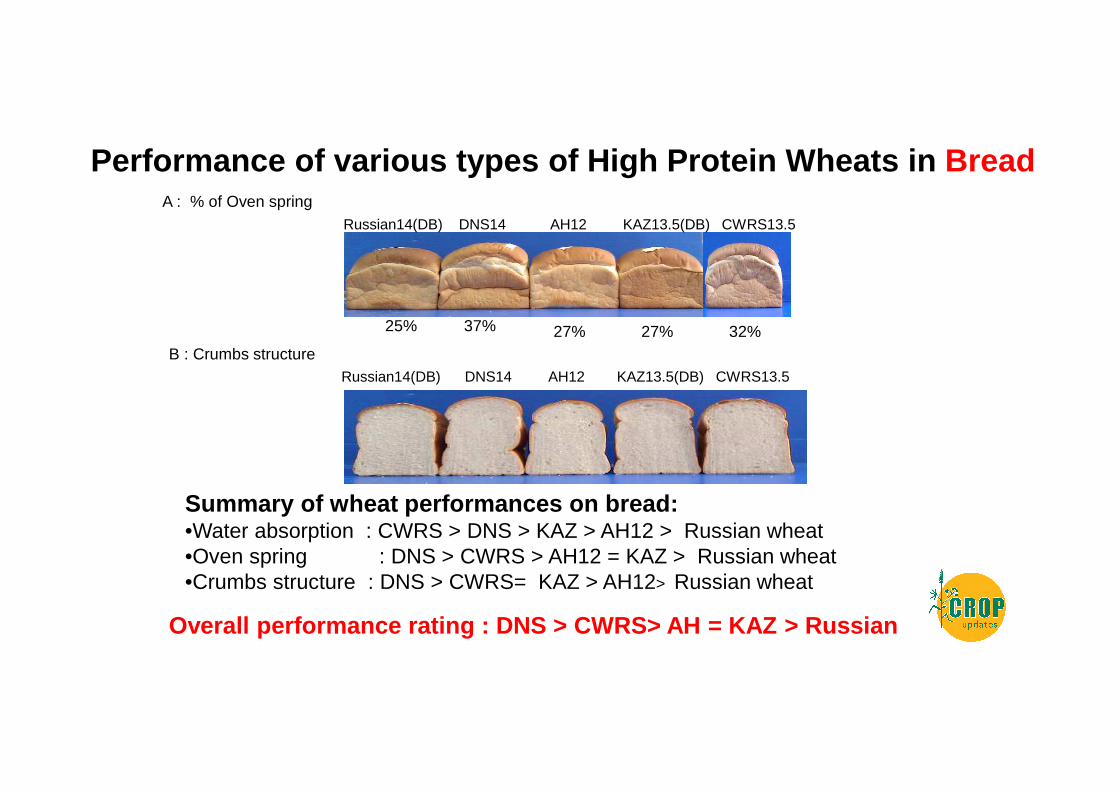
25% 37% 27% 27% 32%
Russian14(DB) DNS14 AH12 KAZ13.5(DB) CWRS13.5
Overall performance rating : DNS > CWRS> AH = KAZ > Russian
B : Crumbs structure
A : % of Oven spring
Summary of wheat performances on bread:•Water absorption : CWRS > DNS > KAZ > AH12 > Russian wheat•Oven spring : DNS > CWRS > AH12 = KAZ > Russian wheat•Crumbs structure : DNS > CWRS= KAZ > AH12> Russian wheat
Russian14(DB) DNS14 AH12 KAZ13.5(DB) CWRS13.5
Performance of various types of High Protein Wheats in Bread
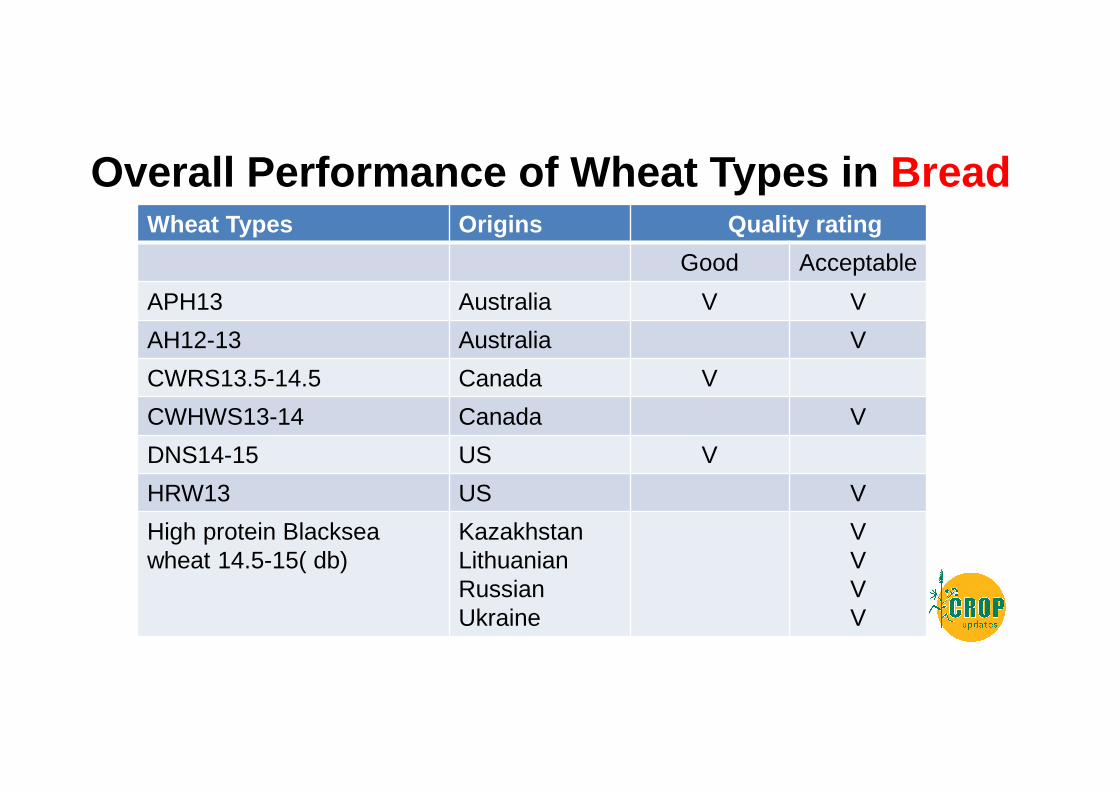
Overall Performance of Wheat Types in BreadWheat Types Origins Quality rating
Good Acceptable
APH13 Australia V V
AH12-13 Australia V
CWRS13.5-14.5 Canada V
CWHWS13-14 Canada V
DNS14-15 US V
HRW13 US V
High protein Blacksea wheat 14.5-15( db)
KazakhstanLithuanianRussianUkraine
VVVV
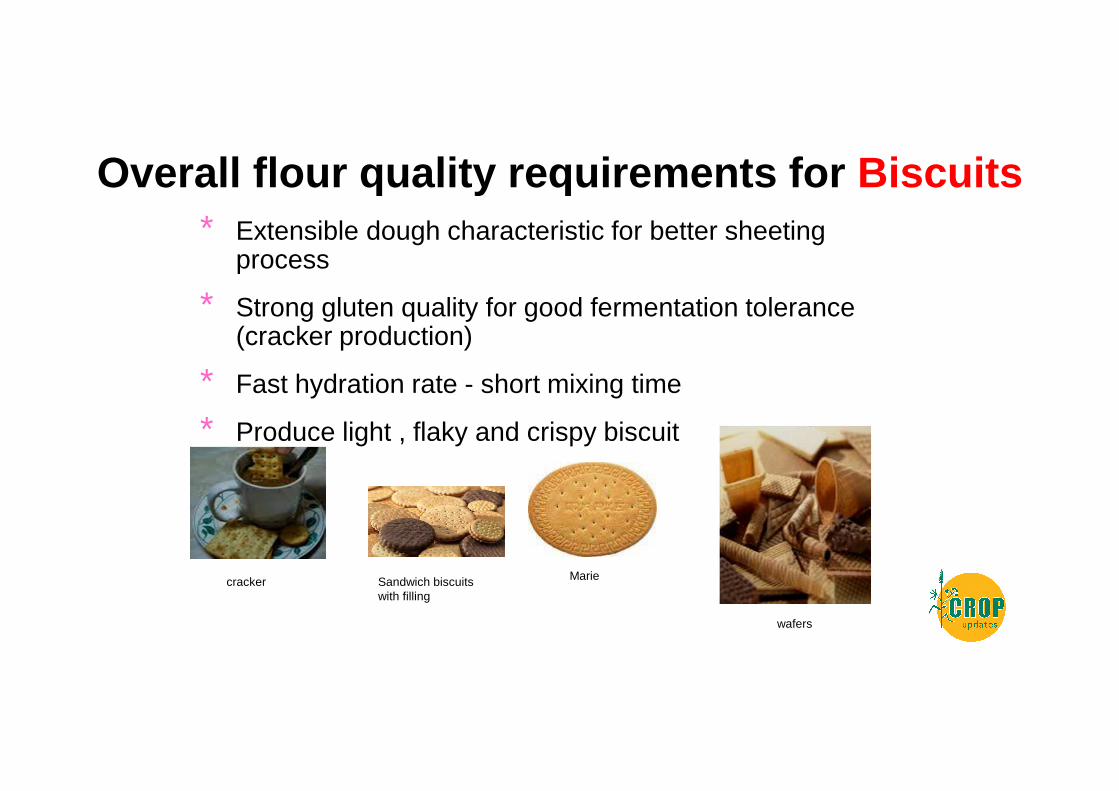
Overall flour quality requirements for Biscuits* Extensible dough characteristic for better sheeting
process
* Strong gluten quality for good fermentation tolerance (cracker production)
* Fast hydration rate - short mixing time
* Produce light , flaky and crispy biscuit
cracker Sandwich biscuits with filling
Marie
wafers
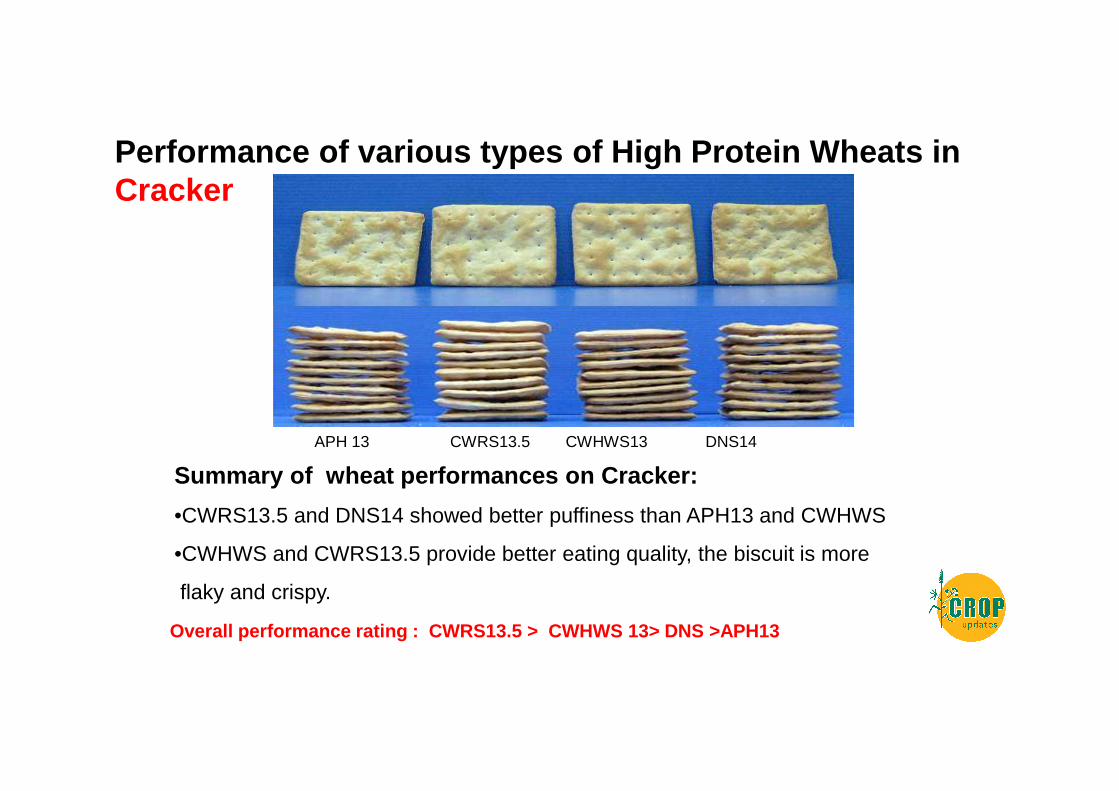
APH 13 CWRS13.5 CWHWS13 DNS14
Summary of wheat performances on Cracker:
•CWRS13.5 and DNS14 showed better puffiness than APH13 and CWHWS
•CWHWS and CWRS13.5 provide better eating quality, the biscuit is more
flaky and crispy.
Overall performance rating : CWRS13.5 > CWHWS 13> DNS >APH13
Performance of various types of High Protein Wheats in Cracker
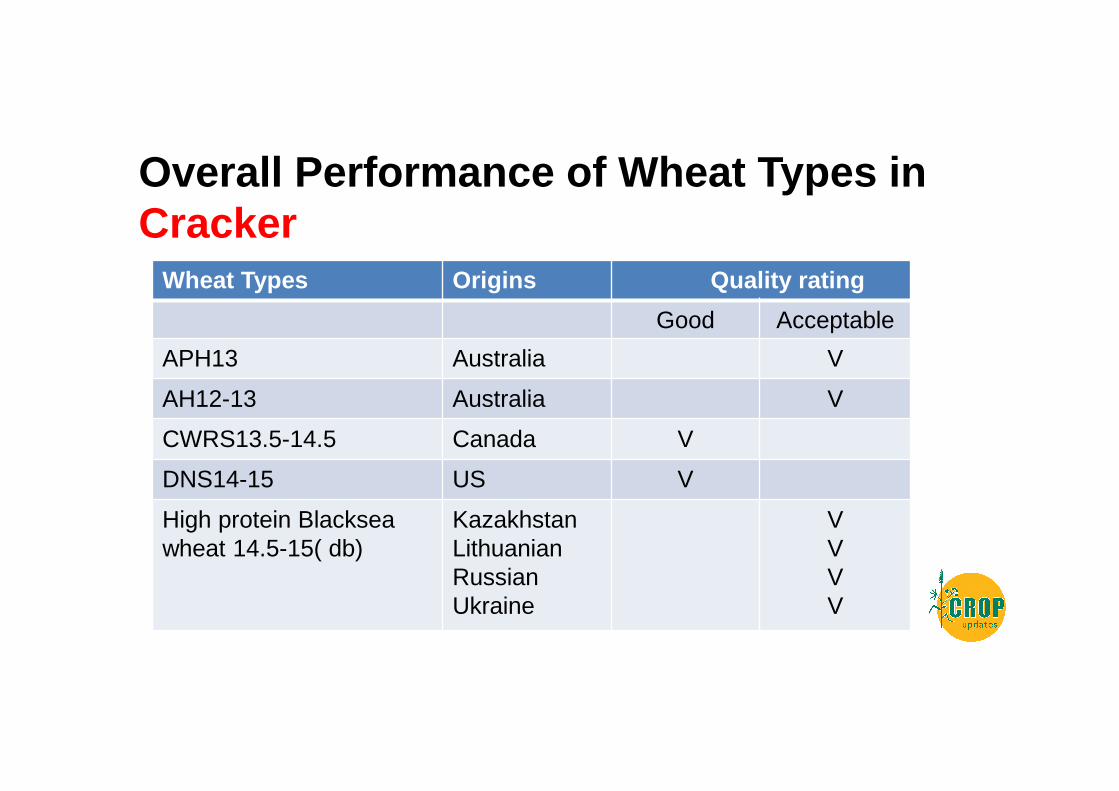
Overall Performance of Wheat Types in Cracker
Wheat Types Origins Quality rating
Good Acceptable
APH13 Australia V
AH12-13 Australia V
CWRS13.5-14.5 Canada V
DNS14-15 US V
High protein Blacksea wheat 14.5-15( db)
KazakhstanLithuanianRussianUkraine
VVVV
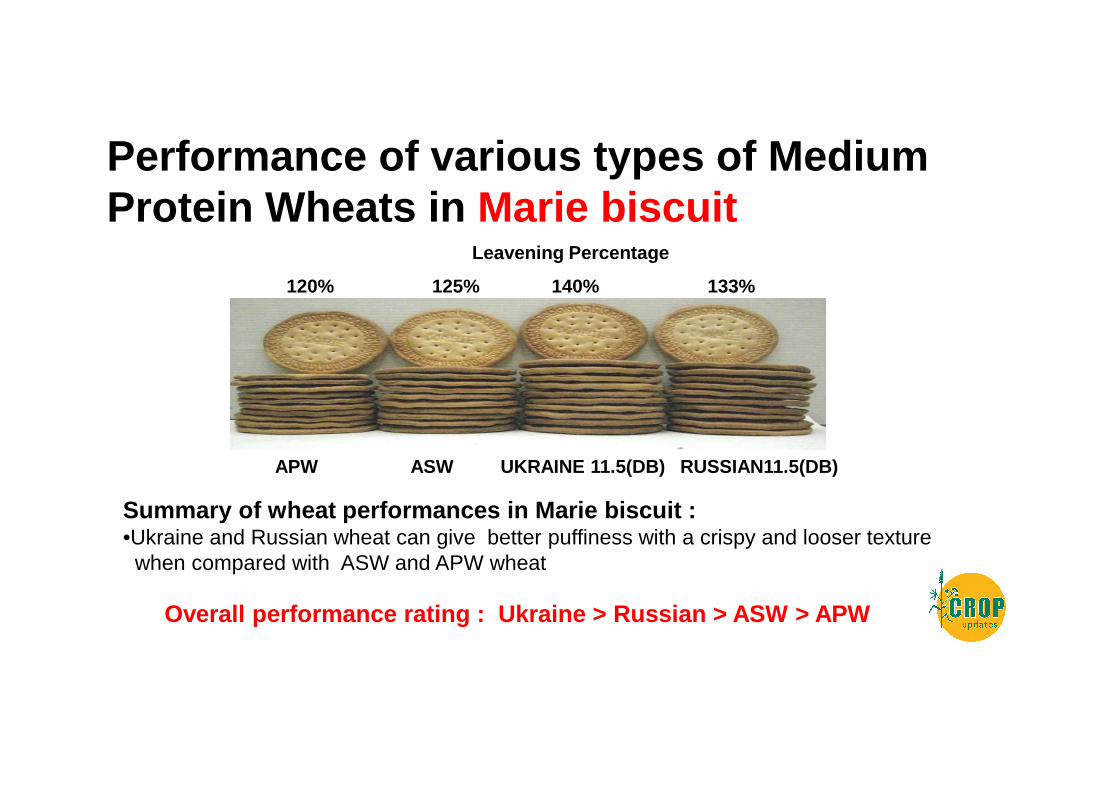
APW ASW UKRAINE 11.5(DB) RUSSIAN11.5(DB)
Leavening Percentage
120% 125% 140% 133%
Overall performance rating : Ukraine > Russian > A SW > APW
Performance of various types of Medium Protein Wheats in Marie biscuit
Summary of wheat performances in Marie biscuit :•Ukraine and Russian wheat can give better puffiness with a crispy and looser texture
when compared with ASW and APW wheat
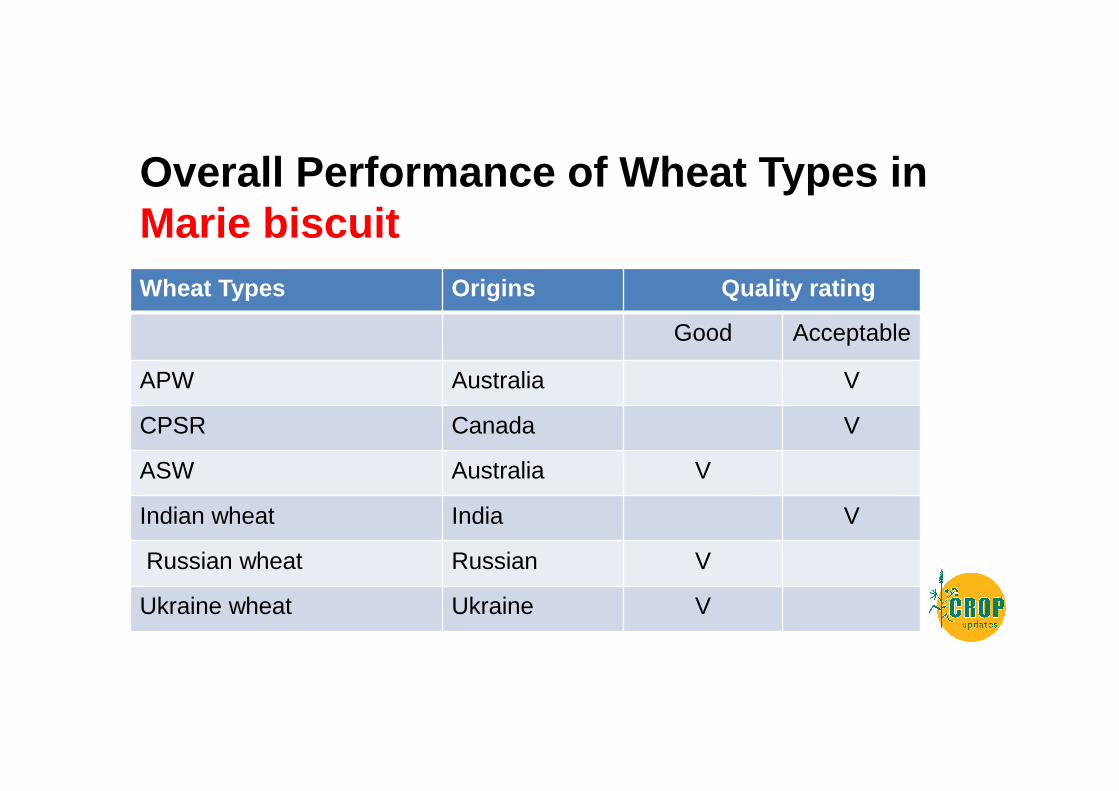
Overall Performance of Wheat Types in Marie biscuitWheat Types Origins Quality rating
Good Acceptable
APW Australia V
CPSR Canada V
ASW Australia V
Indian wheat India V
Russian wheat Russian V
Ukraine wheat Ukraine V
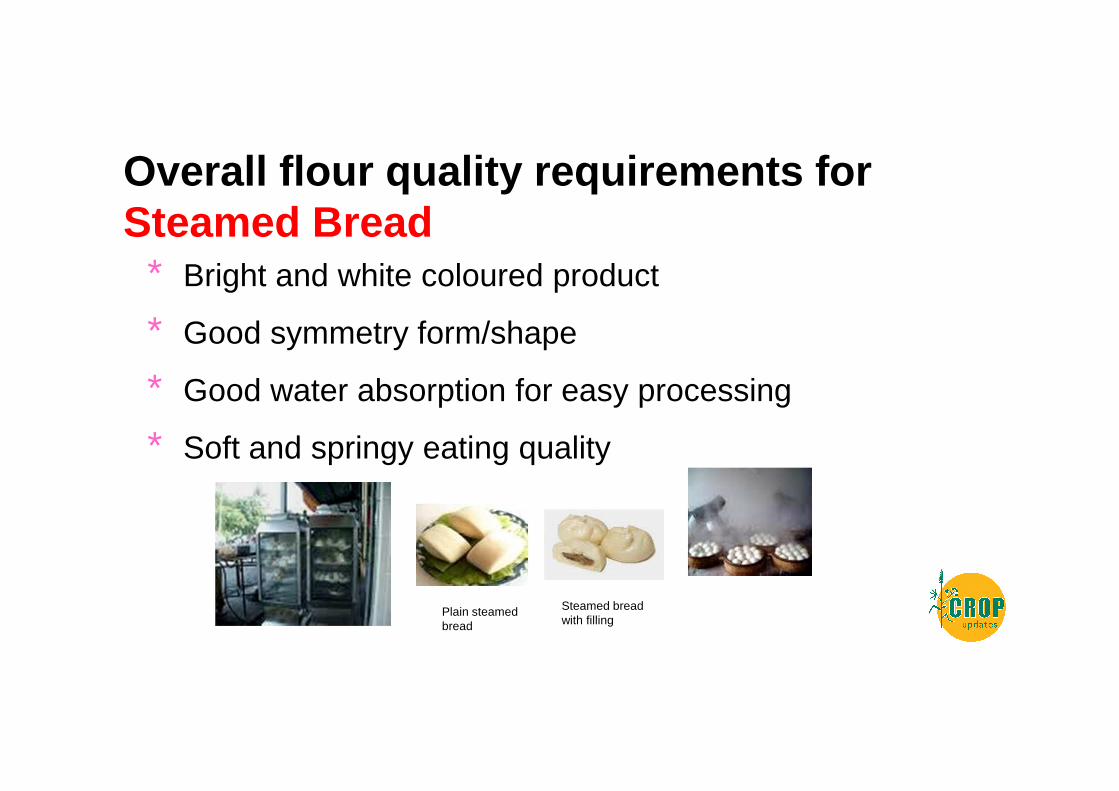
Overall flour quality requirements for Steamed Bread
* Bright and white coloured product
* Good symmetry form/shape
* Good water absorption for easy processing
* Soft and springy eating quality
Plain steamed bread
Steamed bread with filling
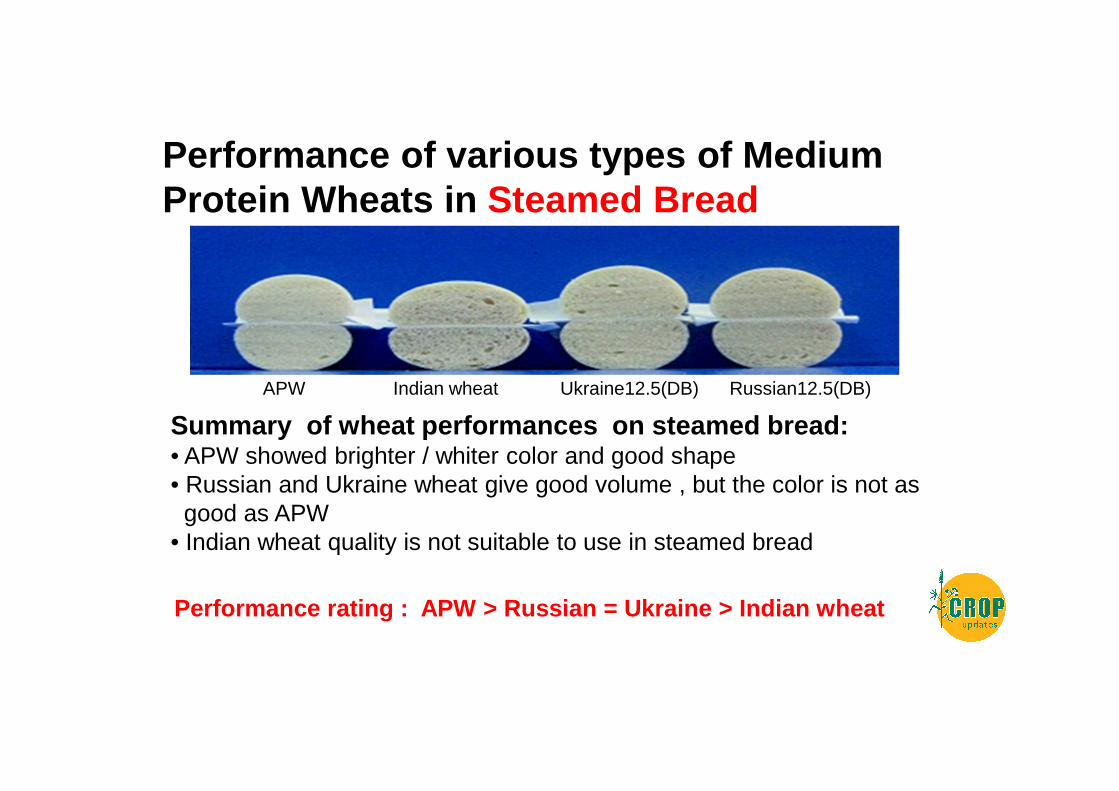
APW Indian wheat Ukraine12.5(DB) Russian12.5(DB)
Summary of wheat performances on steamed bread:• APW showed brighter / whiter color and good shape • Russian and Ukraine wheat give good volume , but the color is not as good as APW
• Indian wheat quality is not suitable to use in steamed bread
Performance rating : APW > Russian = Ukraine > Ind ian wheat
Performance of various types of Medium Protein Wheats in Steamed Bread
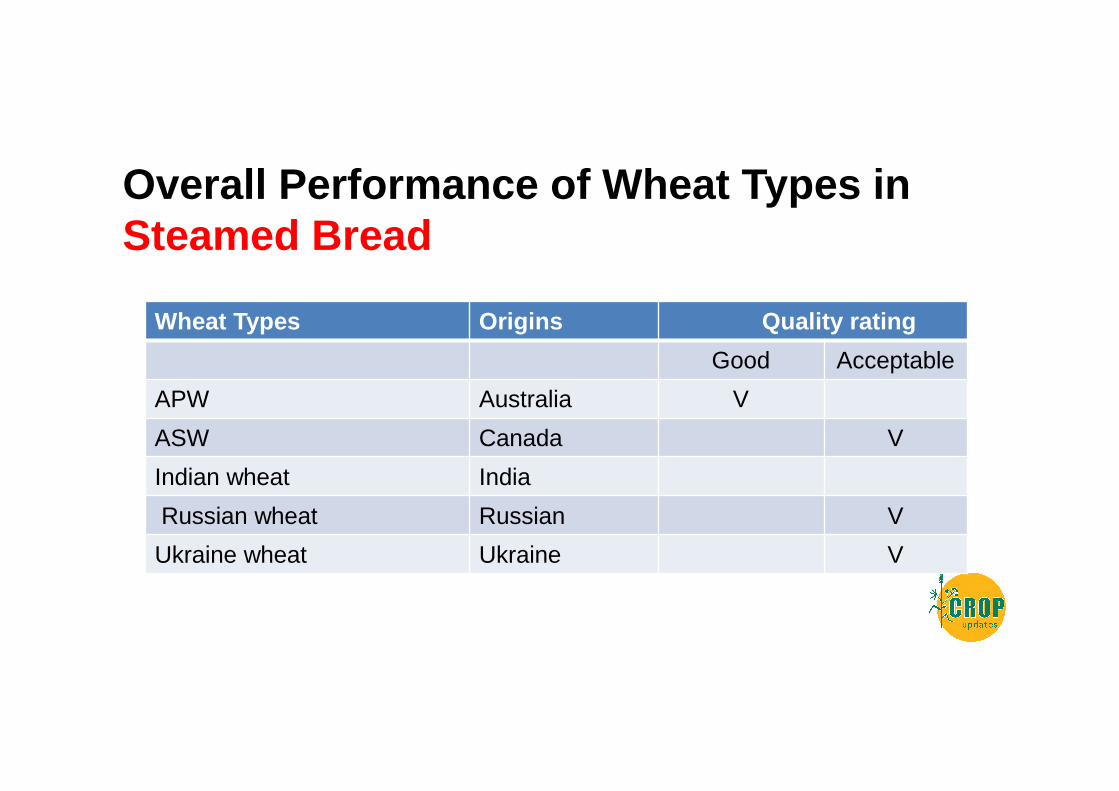
Overall Performance of Wheat Types in Steamed Bread
Wheat Types Origins Quality rating
Good Acceptable
APW Australia V
ASW Canada V
Indian wheat India
Russian wheat Russian V
Ukraine wheat Ukraine V
New Prime Hard varieties (EGA Kidman & Gascoigne) developed for Sponge and
Dough bread making VS DNS 14 and CWRS13.5
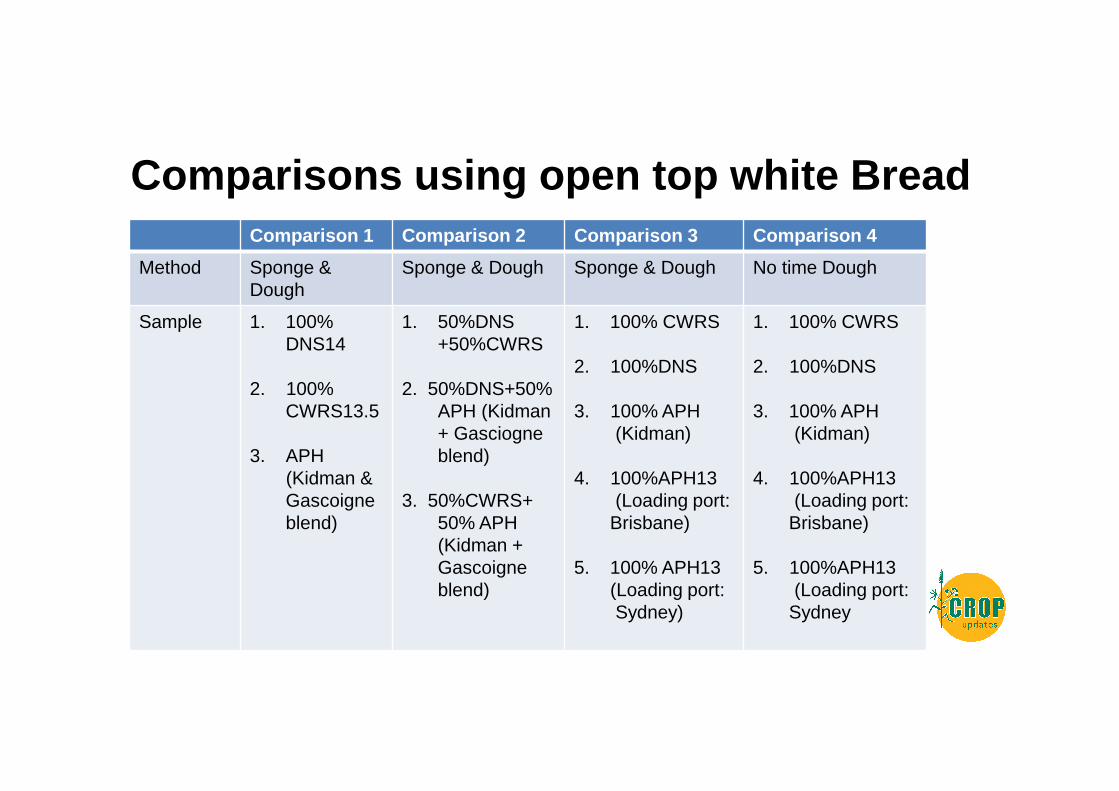
Comparisons using open top white Bread Comparison 1 Comparison 2 Comparison 3 Comparison 4
Method Sponge & Dough
Sponge & Dough Sponge & Dough No time Dough
Sample 1. 100% DNS14
2. 100% CWRS13.5
3. APH (Kidman & Gascoigne blend)
1. 50%DNS +50%CWRS
2. 50%DNS+50% APH (Kidman + Gasciogne blend)
3. 50%CWRS+ 50% APH (Kidman + Gascoigne blend)
1. 100% CWRS
2. 100%DNS
3. 100% APH(Kidman)
4. 100%APH13(Loading port:
Brisbane)
5. 100% APH13(Loading port:Sydney)
1. 100% CWRS
2. 100%DNS
3. 100% APH(Kidman)
4. 100%APH13(Loading port:
Brisbane)
5. 100%APH13(Loading port:
Sydney
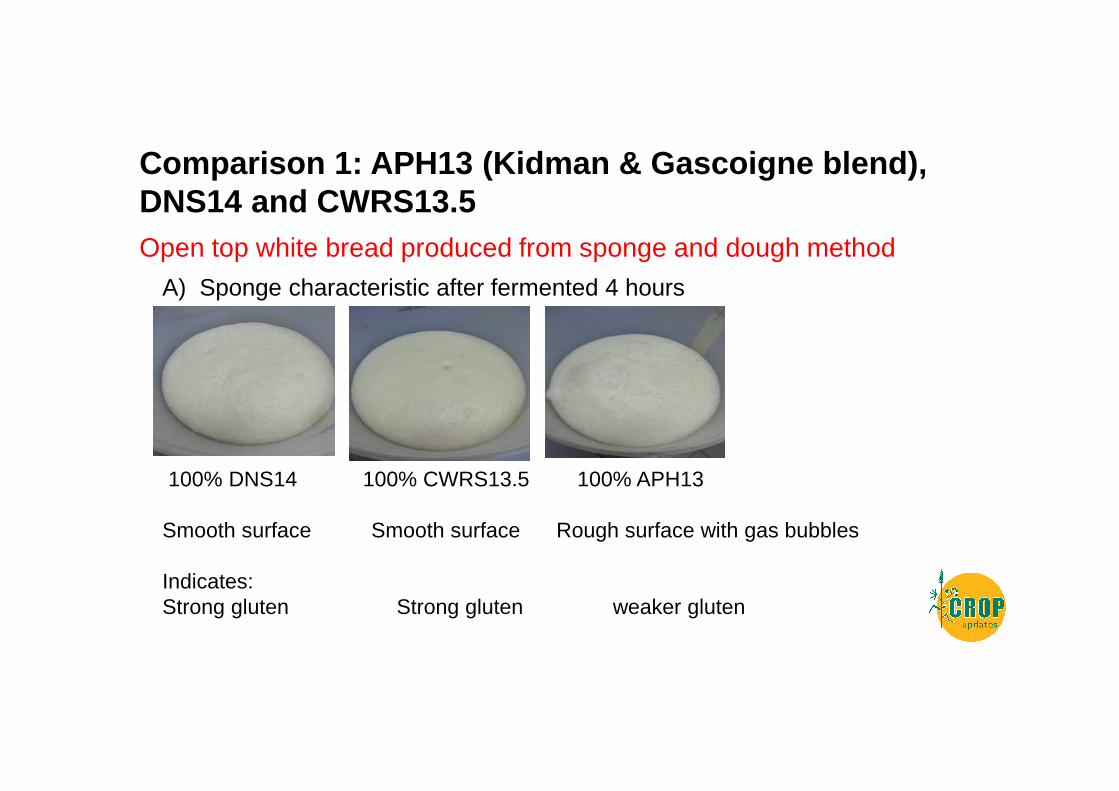
Comparison 1: APH13 (Kidman & Gascoigne blend), DNS14 and CWRS13.5 Open top white bread produced from sponge and dough method
A) Sponge characteristic after fermented 4 hours
100% DNS14 100% CWRS13.5 100% APH13
Smooth surface Smooth surface Rough surface with gas bubbles
Indicates: Strong gluten Strong gluten weaker gluten
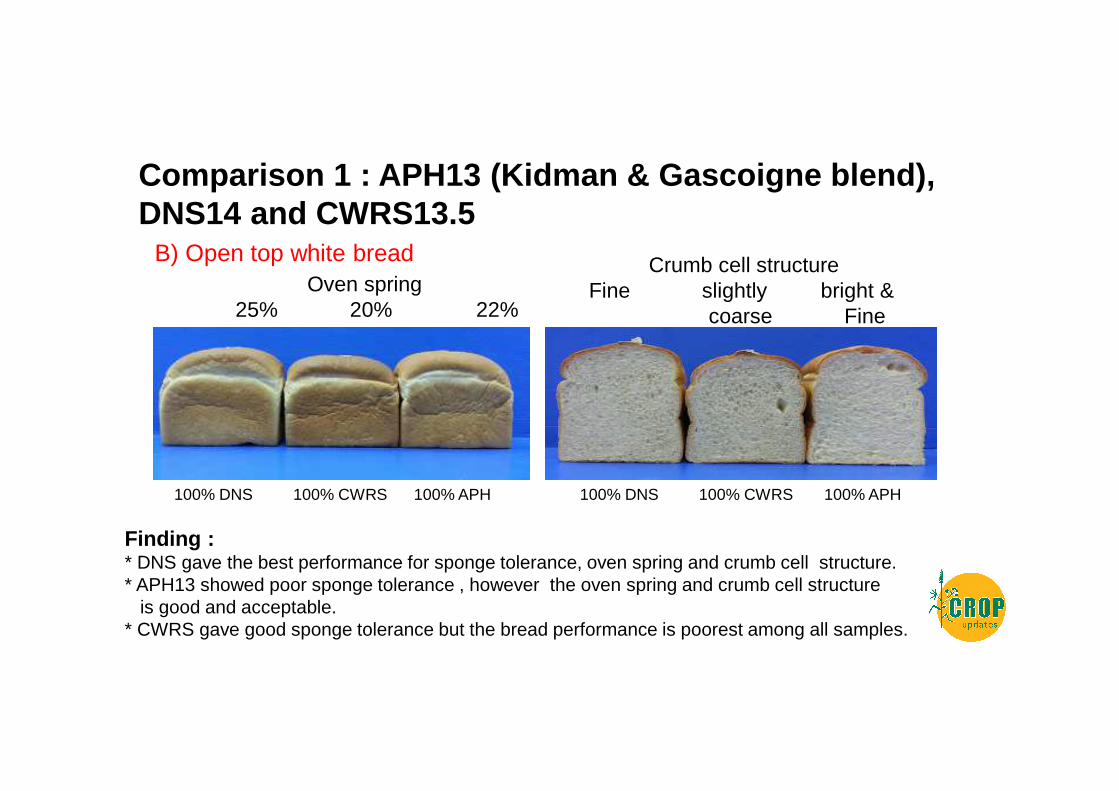
Comparison 1 : APH13 (Kidman & Gascoigne blend), DNS14 and CWRS13.5
B) Open top white breadOven spring
25% 20% 22%
Crumb cell structureFine slightly bright &
coarse Fine
100% DNS 100% CWRS 100% APH 100% DNS 100% CWRS 100% APH
Finding : * DNS gave the best performance for sponge tolerance, oven spring and crumb cell structure. * APH13 showed poor sponge tolerance , however the oven spring and crumb cell structure
is good and acceptable.* CWRS gave good sponge tolerance but the bread performance is poorest among all samples.
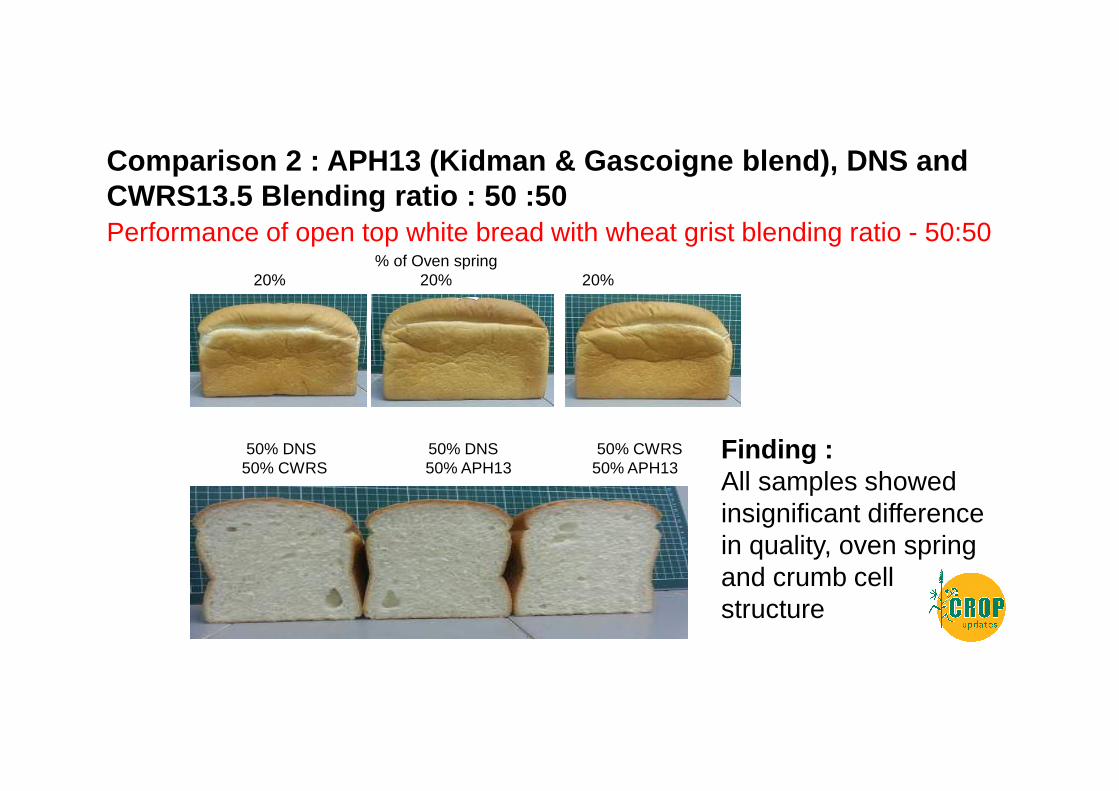
Comparison 2 : APH13 (Kidman & Gascoigne blend), DN S and CWRS13.5 Blending ratio : 50 :50
% of Oven spring20% 20% 20%
50% DNS 50% DNS 50% CWRS50% CWRS 50% APH13 50% APH13
Performance of open top white bread with wheat grist blending ratio - 50:50
Finding :All samples showed insignificant difference in quality, oven spring and crumb cell structure
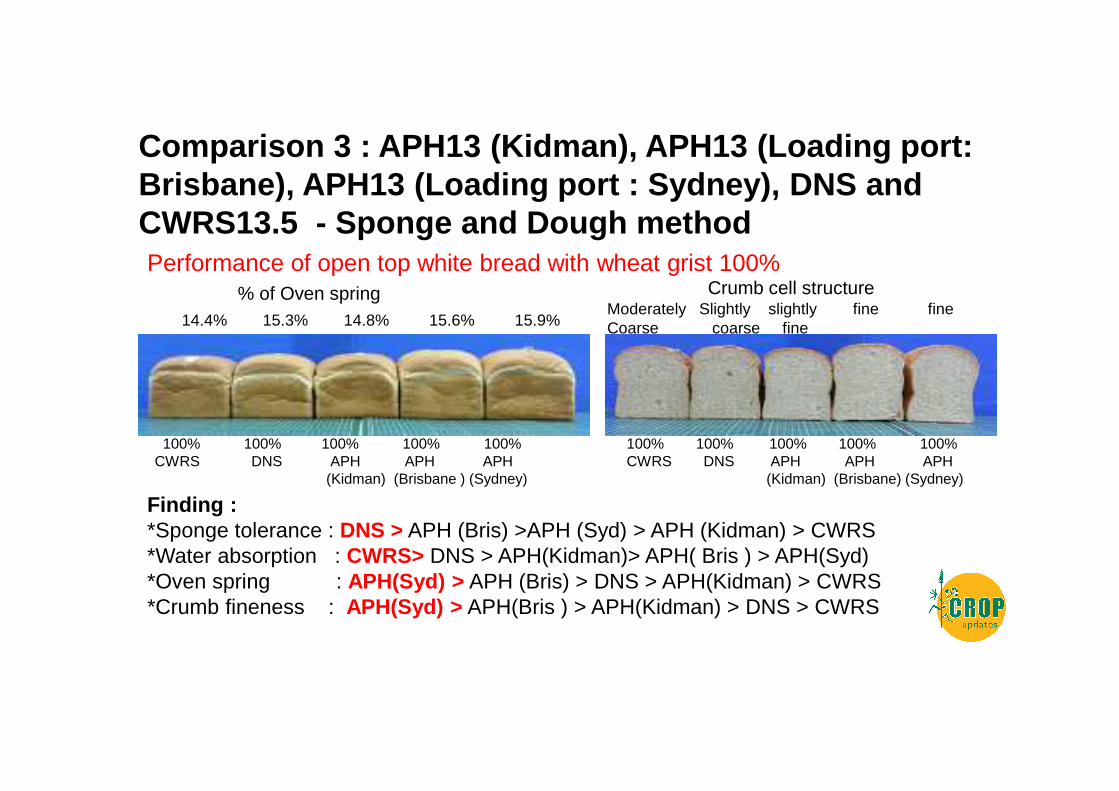
Comparison 3 : APH13 (Kidman), APH13 (Loading port: Brisbane), APH13 (Loading port : Sydney), DNS and CWRS13.5 - Sponge and Dough methodPerformance of open top white bread with wheat grist 100%
% of Oven spring Crumb cell structure
14.4% 15.3% 14.8% 15.6% 15.9%Moderately Slightly slightly fine fineCoarse coarse fine
100% 100% 100% 100% 100%CWRS DNS APH APH APH
(Kidman) (Brisbane ) (Sydney)
100% 100% 100% 100% 100%CWRS DNS APH APH APH
(Kidman) (Brisbane) (Sydney)
Finding :*Sponge tolerance : DNS > APH (Bris) >APH (Syd) > APH (Kidman) > CWRS*Water absorption : CWRS> DNS > APH(Kidman)> APH( Bris ) > APH(Syd)*Oven spring : APH(Syd) > APH (Bris) > DNS > APH(Kidman) > CWRS*Crumb fineness : APH(Syd) > APH(Bris ) > APH(Kidman) > DNS > CWRS
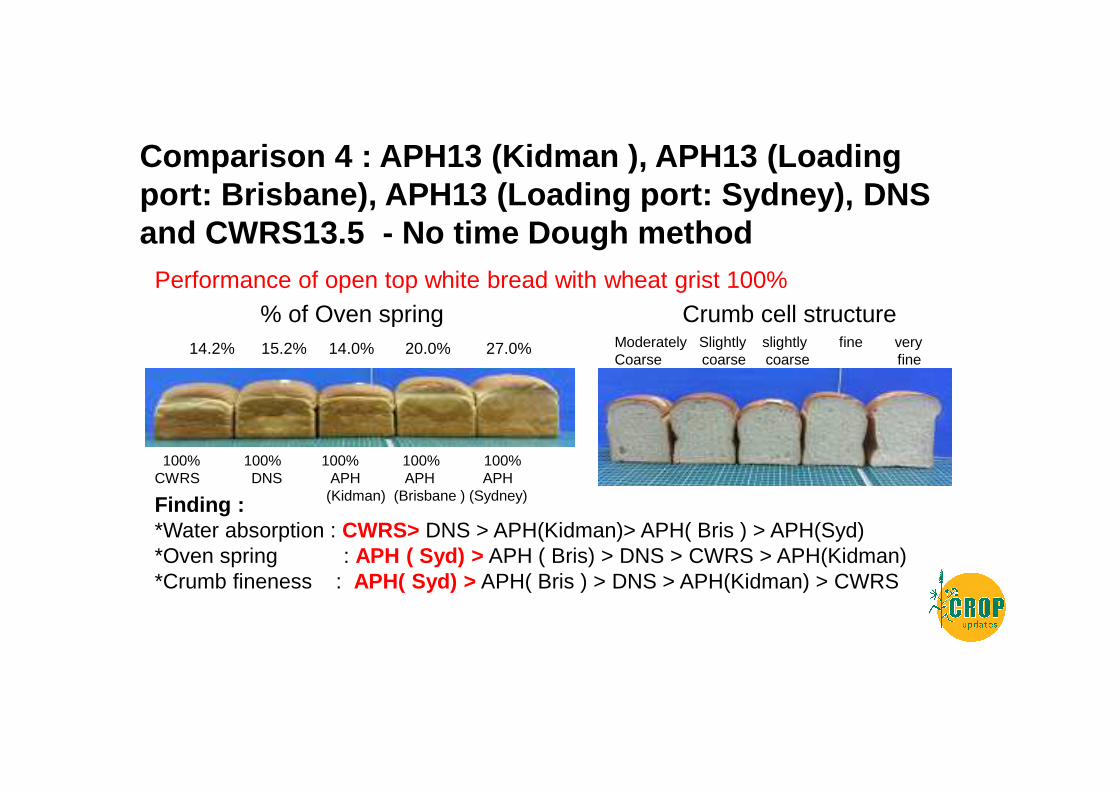
Comparison 4 : APH13 (Kidman ), APH13 (Loading port: Brisbane), APH13 (Loading port: Sydney), DNS and CWRS13.5 - No time Dough method
Performance of open top white bread with wheat grist 100% % of Oven spring Crumb cell structure
14.2% 15.2% 14.0% 20.0% 27.0% Moderately Slightly slightly fine very Coarse coarse coarse fine
Finding :*Water absorption : CWRS> DNS > APH(Kidman)> APH( Bris ) > APH(Syd)*Oven spring : APH ( Syd) > APH ( Bris) > DNS > CWRS > APH(Kidman)*Crumb fineness : APH( Syd) > APH( Bris ) > DNS > APH(Kidman) > CWRS
100% 100% 100% 100% 100%CWRS DNS APH APH APH
(Kidman) (Brisbane ) (Sydney)
Findings:• DNS gave the best water absorption and sponge
tolerance. • APH loaded from Sydney and Brisbane have
similar oven spring to DNS and are better than CWRS and APH (Kidman)
• All APH gave a brighter and finer crumb structure than CWRS and DNS
Summary
• Australian wheat performs well in noodles and biscuits when compared to Canadian/US wheat and wheats from other origins
• However, the new Canadian Hard White Wheat (CWHWS) also performed well in noodle and biscuit products and can be competitive against medium and high protein Australian Wheat
Summary• Canadian and US spring wheat perform better than
Australian APH and AH wheat in bread products due to the predominance of the sponge and dough method in the region.
• The new varieties APH Kidman and Gascoigne develop for sponge and dough bread making shows positive performance when compared to CWRS and DNS. However the water absorption and sponge tolerance need improvement.
Summary
• US wheat is perceived as inconsistent in quality but traditionally is used in Philippines and in Thailand it is mainly use in aquaculture
• Since deregulation we have encountered quality problems and inconsistency when buying Australian wheat in containers.
Summary
• Medium/lower protein Black sea wheat can partially replace ASW/APW in biscuits, noodles and steam bread products
• Higher protein Black sea wheat can partially replace APH/AH and even North American spring wheat in bread
• Indian and Pakistan wheat can partially replace APW/ASW and is available at competitive prices but their quality is not preferred
• However Asian buyers still pay a premium for APW/ASW, the question is how much and for how long?
Recommendations to improve Australian Wheat Competitiveness
• Consolidated annual crop quality reports and make it available to all buyers of Australian wheat.
• Introduce a centralized export quality inspection system like the FGIS and Canadian Grain Commission especially for containerised shipments.
• Make available a technical support center for customers and for growers to research into varieties suitable for customer’s requirements.
Recommendations to improve Australian Wheat Competitiveness
• Improve inland logistic to reduce logistic cost of moving wheat into export facilities
• Improve port logistics especially at WA to increase export capacity
Potential Use of Australian Soybeans in Asian food
products
Soy Foods situation in SE Asia• SE Asia accounts for 25% of the worlds’ soy food
consumption
• Annually 3.5 million tons of food soybeans is used to produce tempe, Tofu, soy milk etc.
• The main soybean suppliers are Canada and USA
• Our evaluation shows that certain varieties of Australian soybeans can perform well in soy milk and tofu
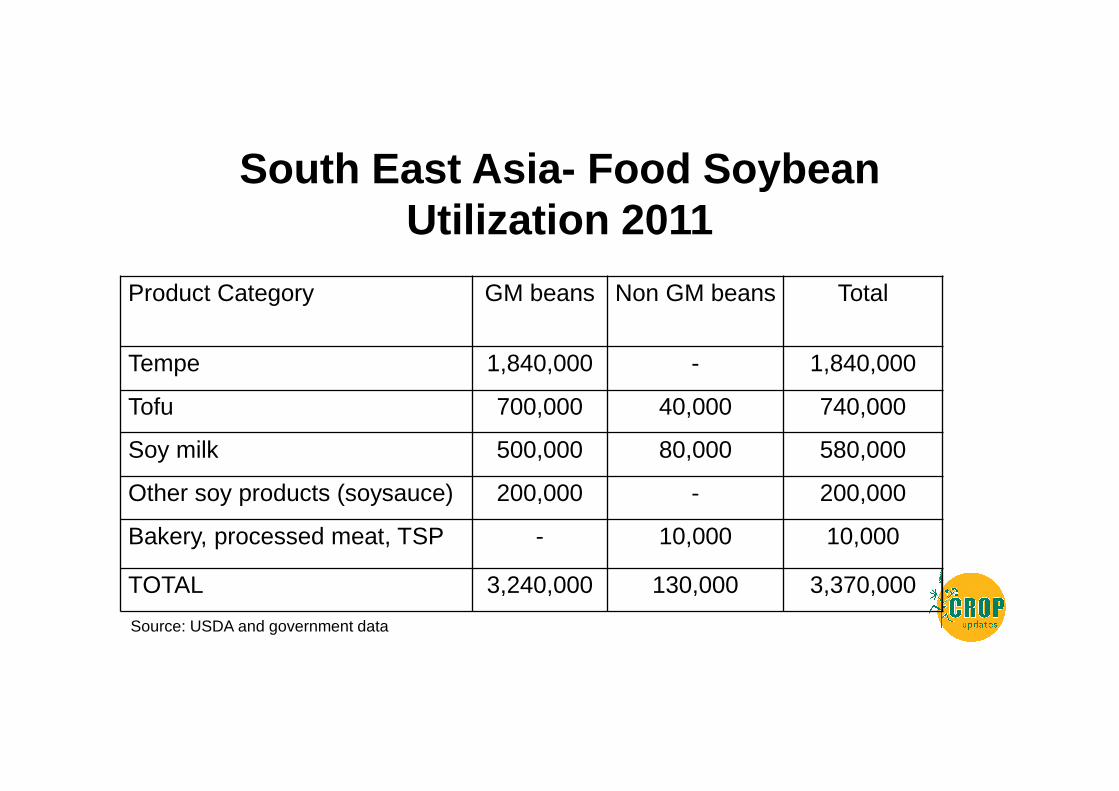
South East Asia - Food Soybean Utilization 2011
Product Category GM beans Non GM beans Total
Tempe 1,840,000 - 1,840,000
Tofu 700,000 40,000 740,000
Soy milk 500,000 80,000 580,000
Other soy products (soysauce) 200,000 - 200,000
Bakery, processed meat, TSP - 10,000 10,000
TOTAL 3,240,000 130,000 3,370,000
Source: USDA and government data
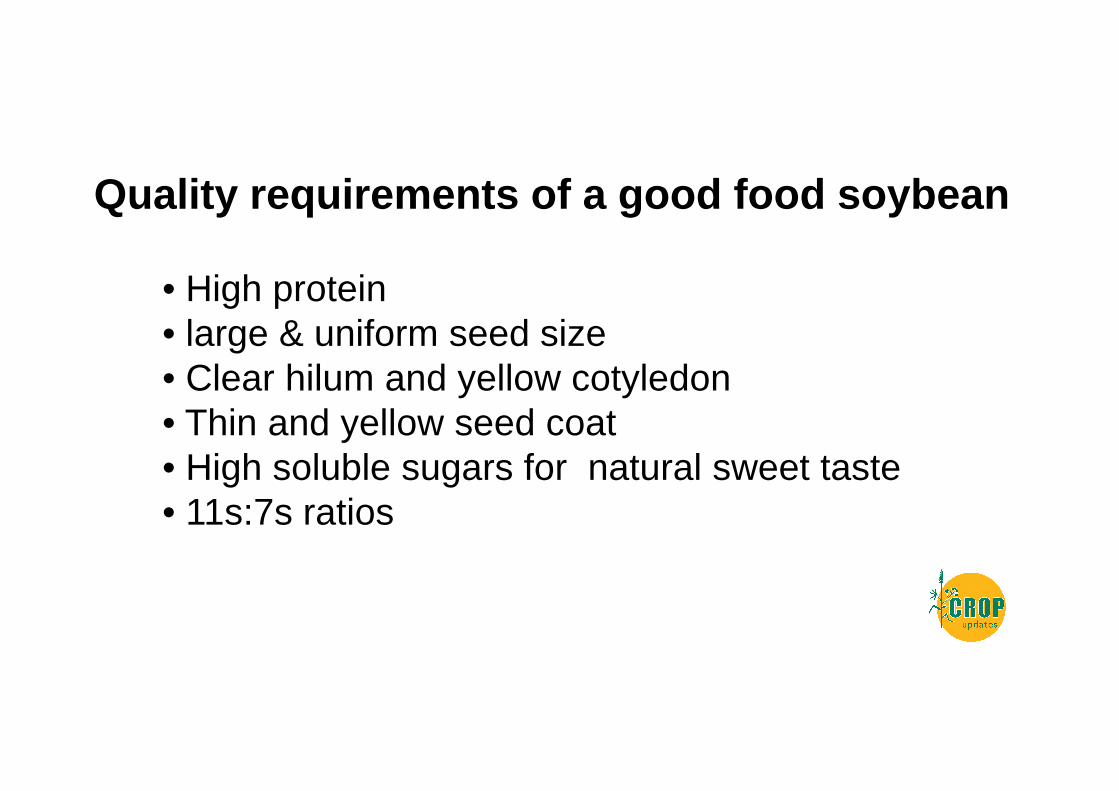
Quality requirements of a good food soybean
• High protein• large & uniform seed size• Clear hilum and yellow cotyledon• Thin and yellow seed coat• High soluble sugars for natural sweet taste• 11s:7s ratios
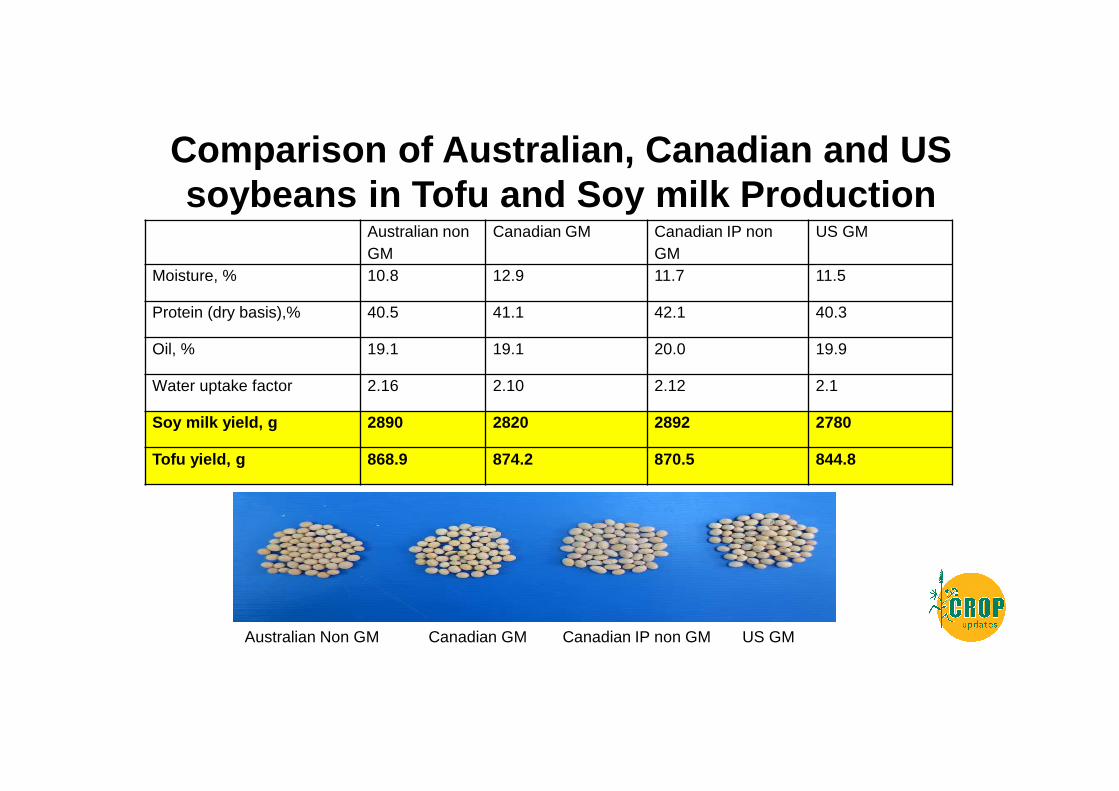
Comparison of Australian, Canadian and US soybeans in Tofu and Soy milk Production
Australian non GM
Canadian GM Canadian IP non GM
US GM
Moisture, % 10.8 12.9 11.7 11.5
Protein (dry basis),% 40.5 41.1 42.1 40.3
Oil, % 19.1 19.1 20.0 19.9
Water uptake factor 2.16 2.10 2.12 2.1
Soy milk yield, g 2890 2820 2892 2780
Tofu yield, g 868.9 874.2 870.5 844.8
Australian Non GM Canadian GM Canadian IP non GM US GM
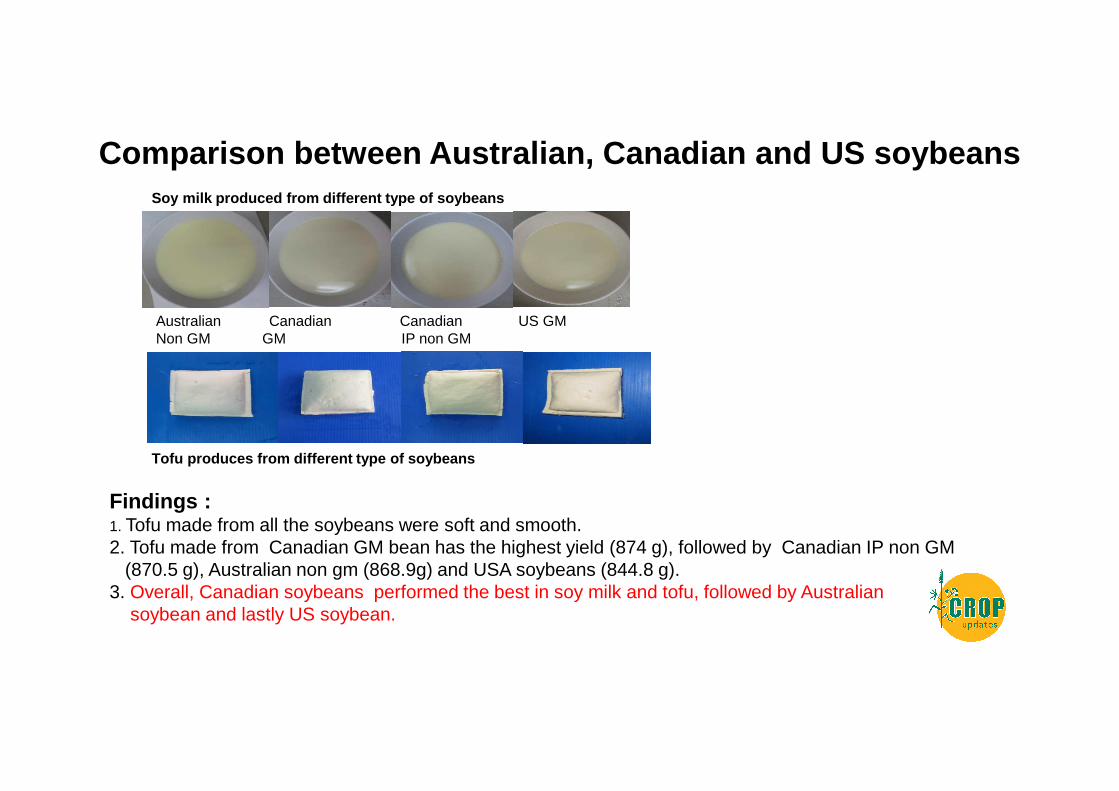
Comparison between Australian, Canadian and US soyb eansSoy milk produced from different type of soybeans
Tofu produces from different type of soybeans
Australian Canadian Canadian US GMNon GM GM IP non GM
Findings :1. Tofu made from all the soybeans were soft and smooth.2. Tofu made from Canadian GM bean has the highest yield (874 g), followed by Canadian IP non GM
(870.5 g), Australian non gm (868.9g) and USA soybeans (844.8 g).3. Overall, Canadian soybeans performed the best in soy milk and tofu, followed by Australian
soybean and lastly US soybean.

Potential for Australian canola inSE Asia
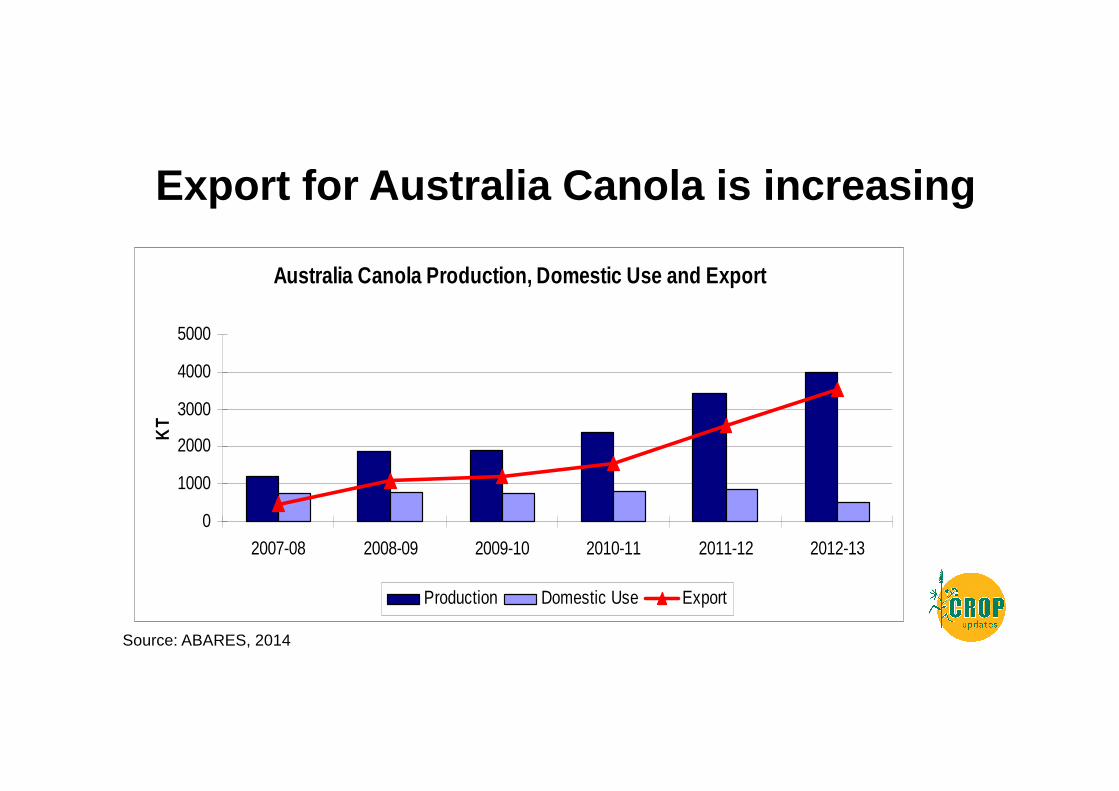
Export for Australia Canola is increasing
Australia Canola Production, Domestic Use and Expor t
0
1000
2000
3000
4000
5000
2007-08 2008-09 2009-10 2010-11 2011-12 2012-13
KT
Production Domestic Use Export
Source: ABARES, 2014
Canola meal vs Soybean meal
• Lower metabolisable energy• About 10% lower digestible amino acids • Partly due to more extreme processing conditions • Higher fiber content as commercial dehulling not
successful unlike soybean meal.• Higher methionine but lower lysine content• Limitations on use in poultry feeds due to higher fiber
and sometimes high glucosinolates content.
Better processing of canola meal can result in better broiler growth
performances
Location: Bangkok Animal Research CenterDate: 2nd Oct- 5th Nov, 2013
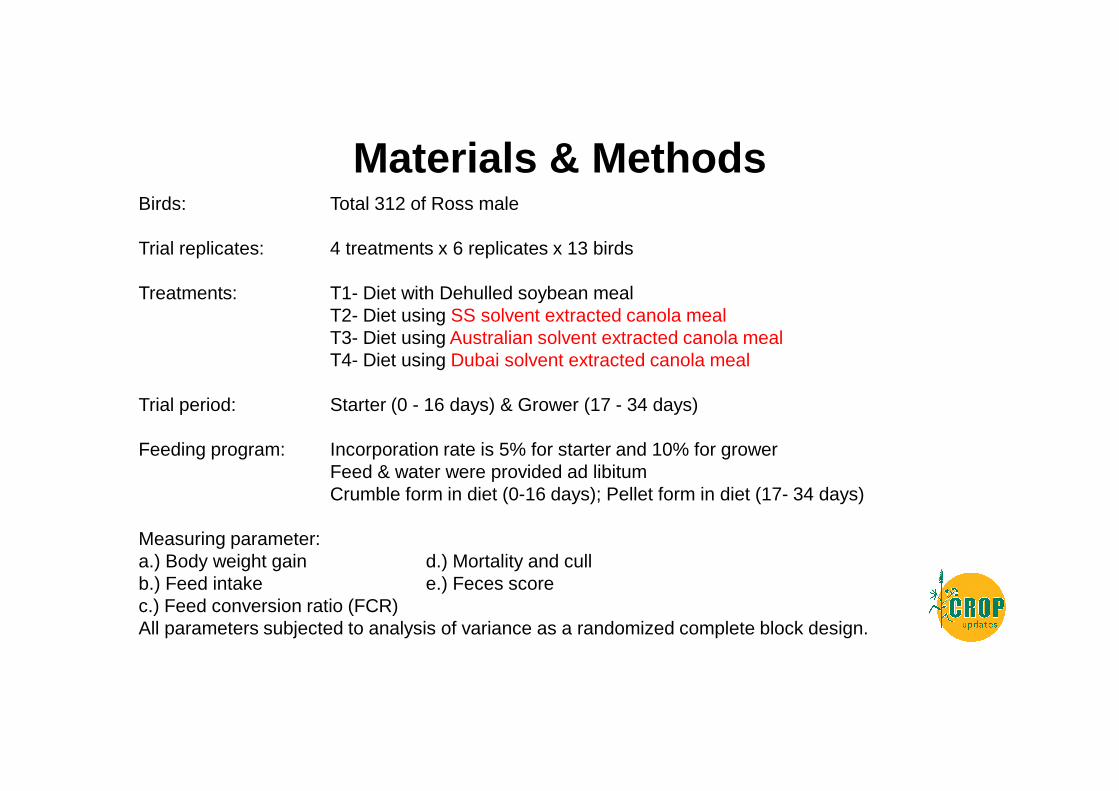
Birds: Total 312 of Ross male
Trial replicates: 4 treatments x 6 replicates x 13 birds
Treatments: T1- Diet with Dehulled soybean meal T2- Diet using SS solvent extracted canola mealT3- Diet using Australian solvent extracted canola mealT4- Diet using Dubai solvent extracted canola meal
Trial period: Starter (0 - 16 days) & Grower (17 - 34 days)
Feeding program: Incorporation rate is 5% for starter and 10% for growerFeed & water were provided ad libitumCrumble form in diet (0-16 days); Pellet form in diet (17- 34 days)
Measuring parameter:a.) Body weight gain d.) Mortality and cullb.) Feed intake e.) Feces scorec.) Feed conversion ratio (FCR)All parameters subjected to analysis of variance as a randomized complete block design.
Materials & Methods
aabb
2000
2100
2200
2300
2400
2500
2600
2700
Ross Std Control SS Aust Dubai
Bo
dy W
eig
ht
Ga
in (
g)
1.250
1.300
1.350
1.400
1.450
1.500
1.550
1.600
FC
R (
un
corr
ect
ed
fo
r m
ort
ali
ty a
nd
cu
lls)
BGW FCR
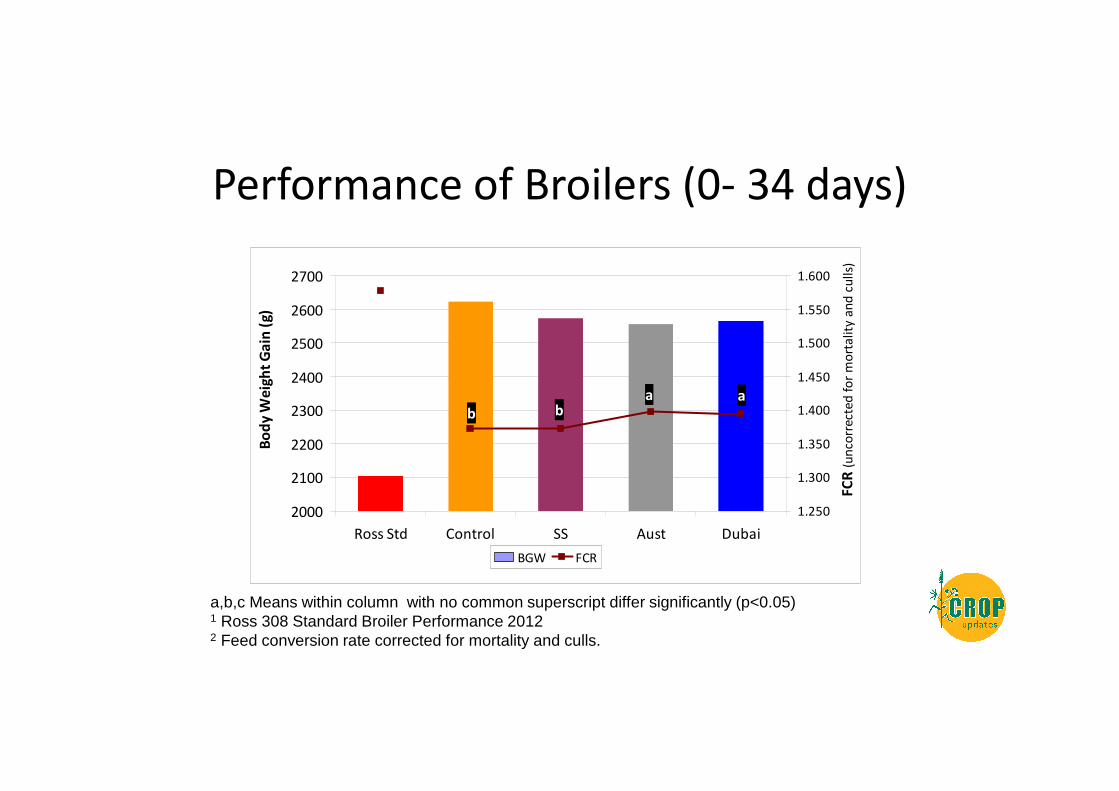
Performance of Broilers (0- 34 days)
a,b,c Means within column with no common superscript differ significantly (p<0.05)1 Ross 308 Standard Broiler Performance 20122 Feed conversion rate corrected for mortality and culls.
Findings
• Soon Soon canola meal performed the best among the canola meal diets and its performance is similar to the soybean meal control diet
• Therefore with proper processing the nutrient availability of canola meal can be improved
• Longer term, a commercial dehulling process for canola meal must be developed if poultry feeding is the main objective

Opportunities For The Use Of Lupins In Asian
Foods And Animal Feeds
Total Asian Imports and Consumption of Soybeans and Soybean meal for 2007
Soybean import: 45 Million tonsSoybean production: 25 Million tonsTotal Soybean usage: 70 Million tons
Net Soybean Meal import: 9.6 Million tons
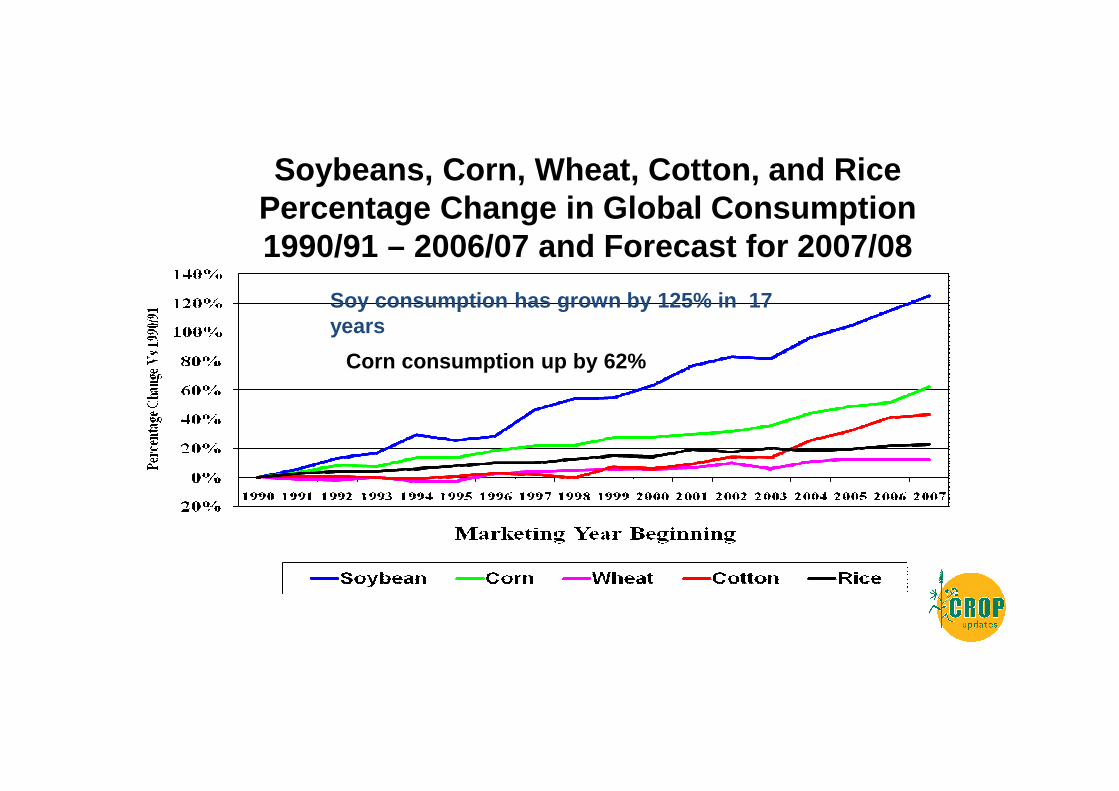
Soybeans, Corn, Wheat, Cotton, and RicePercentage Change in Global Consumption 1990/91 – 2006/07 and Forecast for 2007/08
Soy consumption has grown by 125% in 17 years
Corn consumption up by 62%
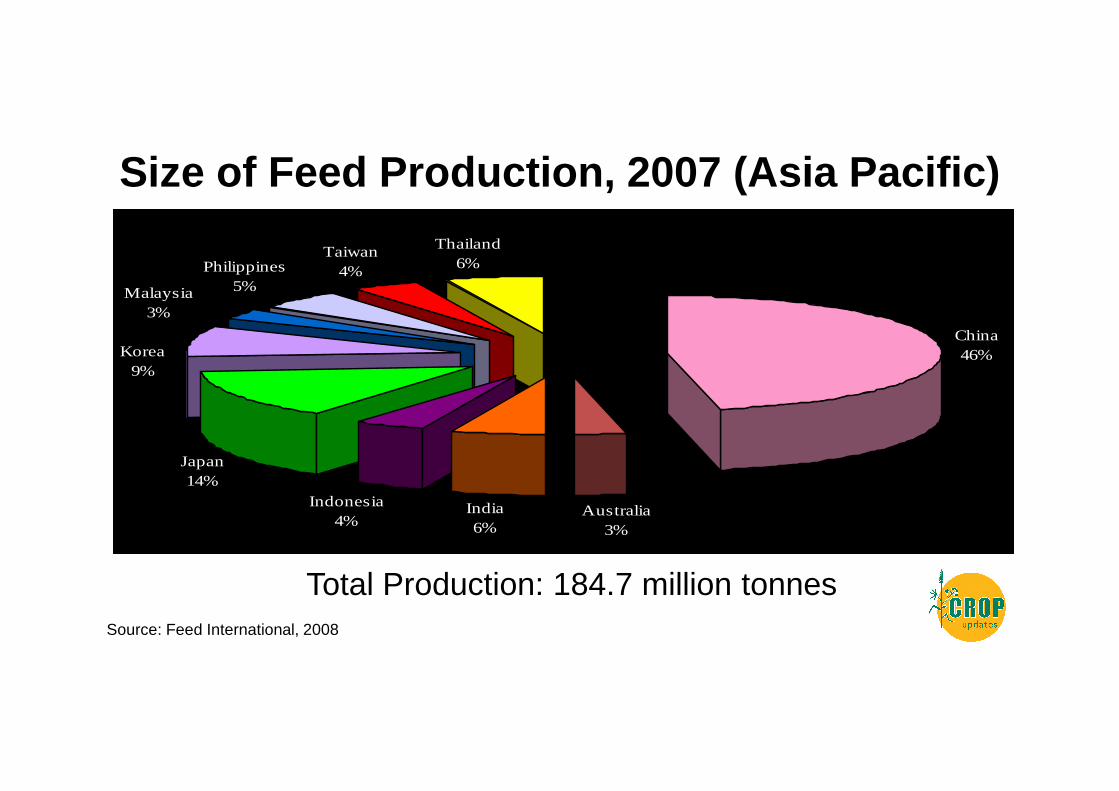
China 46%
Australia3%
India6%
Indonesia4%
Japan14%
Philippines5%
Taiwan4%
Thailand6%
Malaysia3%
Korea9%
Size of Feed Production, 2007 (Asia Pacific)
Total Production: 184.7 million tonnesSource: Feed International, 2008
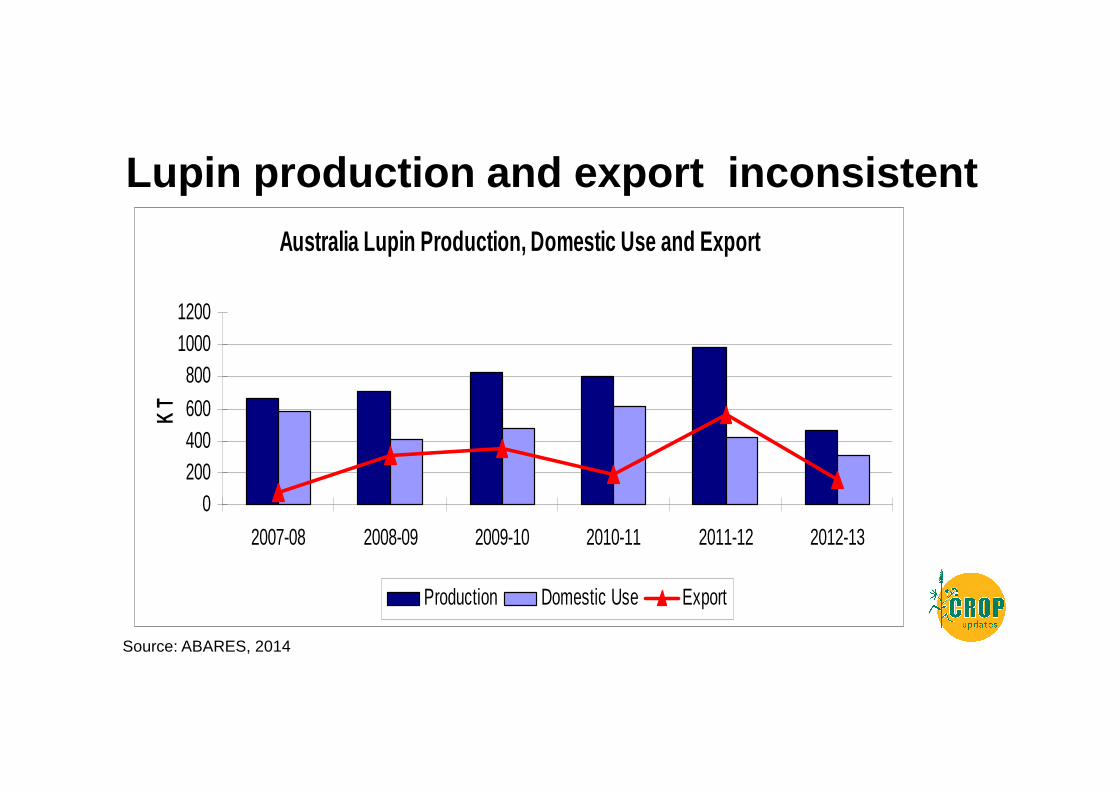
Lupin production and export inconsistent
Australia Lupin Production, Domestic Use and Export
0200400600
80010001200
2007-08 2008-09 2009-10 2010-11 2011-12 2012-13
KT
Production Domestic Use Export
Source: ABARES, 2014
Potential Use of Lupin In Asian Foods
WHO Global NCD Action Plan 2013-2020 – An Overview
The WHO Global NCD Action Plan 2013-2020 provides a road map and a menu of policy options for Member States, WHO, international partners and private sector entities which, when implemented collectively, attain 9 voluntary global targets, including that of a 25% relative reduction in premature mortality from cardiovascular diseases, cancer, diabetes or chronic respiratory diseases by 2025
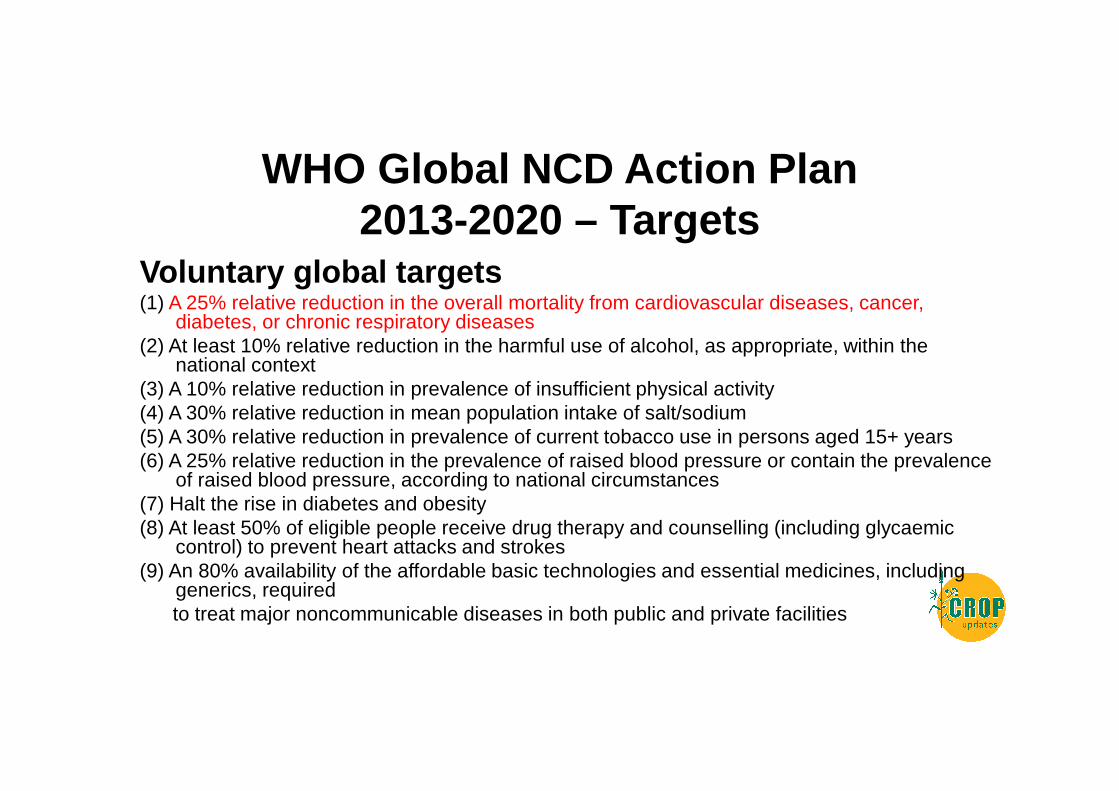
WHO Global NCD Action Plan 2013-2020 – Targets
Voluntary global targets(1) A 25% relative reduction in the overall mortality from cardiovascular diseases, cancer,
diabetes, or chronic respiratory diseases (2) At least 10% relative reduction in the harmful use of alcohol, as appropriate, within the
national context (3) A 10% relative reduction in prevalence of insufficient physical activity (4) A 30% relative reduction in mean population intake of salt/sodium (5) A 30% relative reduction in prevalence of current tobacco use in persons aged 15+ years (6) A 25% relative reduction in the prevalence of raised blood pressure or contain the prevalence
of raised blood pressure, according to national circumstances (7) Halt the rise in diabetes and obesity (8) At least 50% of eligible people receive drug therapy and counselling (including glycaemic
control) to prevent heart attacks and strokes (9) An 80% availability of the affordable basic technologies and essential medicines, including
generics, required to treat major noncommunicable diseases in both public and private facilities
Health benefits of lupin demonstrated in clinical trials
• Lupin flour incorporated into white bread significantly reduced the level of blood glucose. ( Hall R.S. et al. 2005)
• Lupin-enriched bread increases satiety and reduces energy intake. This may have important implications for weight management. (Lee et al., 2006)
• Lupin fibre acts as a soluble fibre and drops the total cholesterol without affecting the HDL cholesterol.
• The lupin-enriched diet lowered total blood cholesterol by 4.5 % and the LDL cholesterol by 5.4%. ( Hall R. S. et al., 2005)
• Lupin foods can improve bowel health because it reduces transit time , lower the colon pH ( anti cancer ) and act as a “pre-biotic“ to improve bowel functions . ( Johnson S.K. et al., 2006)
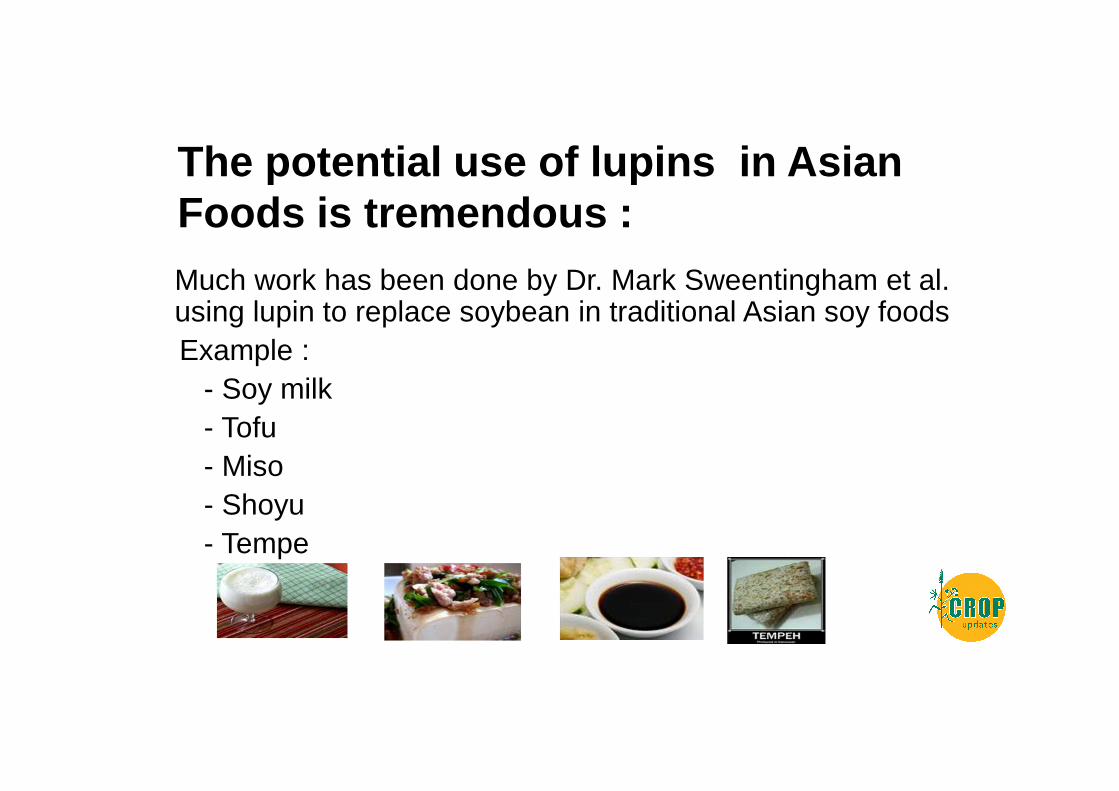
The potential use of lupins in Asian Foods is tremendous :Much work has been done by Dr. Mark Sweentingham et al. using lupin to replace soybean in traditional Asian soy foodsExample :
- Soy milk- Tofu- Miso- Shoyu- Tempe
Soon Soon Group has undertaken research using lupin flour and fibre in Asian Food Products
• Instant Noodles• Cracker• Bread• Sausages
Use of Lupin flour and fibre in instant noodles
• Lupin Flour was used at 6.8% and lupin fibre was used at 1.7% of the total formulation
• The noodles were evaluated for appearance, eating quality, oil and protein content as compared with control
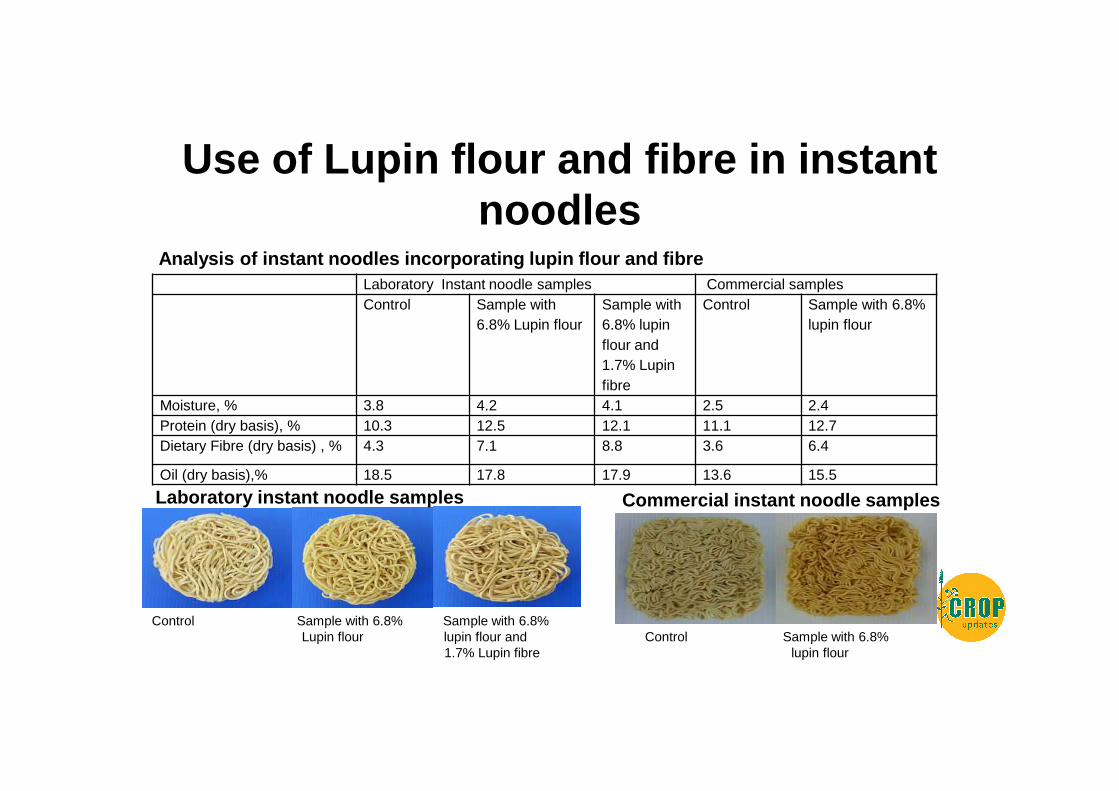
Use of Lupin flour and fibre in instant noodles
Analysis of instant noodles incorporating lupin flo ur and fibreLaboratory Instant noodle samples Commercial samplesControl Sample with
6.8% Lupin flour Sample with 6.8% lupin flour and 1.7% Lupin fibre
Control Sample with 6.8% lupin flour
Moisture, % 3.8 4.2 4.1 2.5 2.4Protein (dry basis), % 10.3 12.5 12.1 11.1 12.7Dietary Fibre (dry basis) , % 4.3 7.1 8.8 3.6 6.4
Oil (dry basis),% 18.5 17.8 17.9 13.6 15.5
Laboratory instant noodle samples Commercial instant noodle samples
Control Sample with 6.8% Sample with 6.8%Lupin flour lupin flour and
1.7% Lupin fibreControl Sample with 6.8%
lupin flour
Use of Lupin flour and fibre in instant noodles
Findings:
• Increase dietary fibre by 65-105%
•Increase protein level by 14 – 21%
•Noodle appearance more yellow than control
•Better soaking tolerance and eating quality
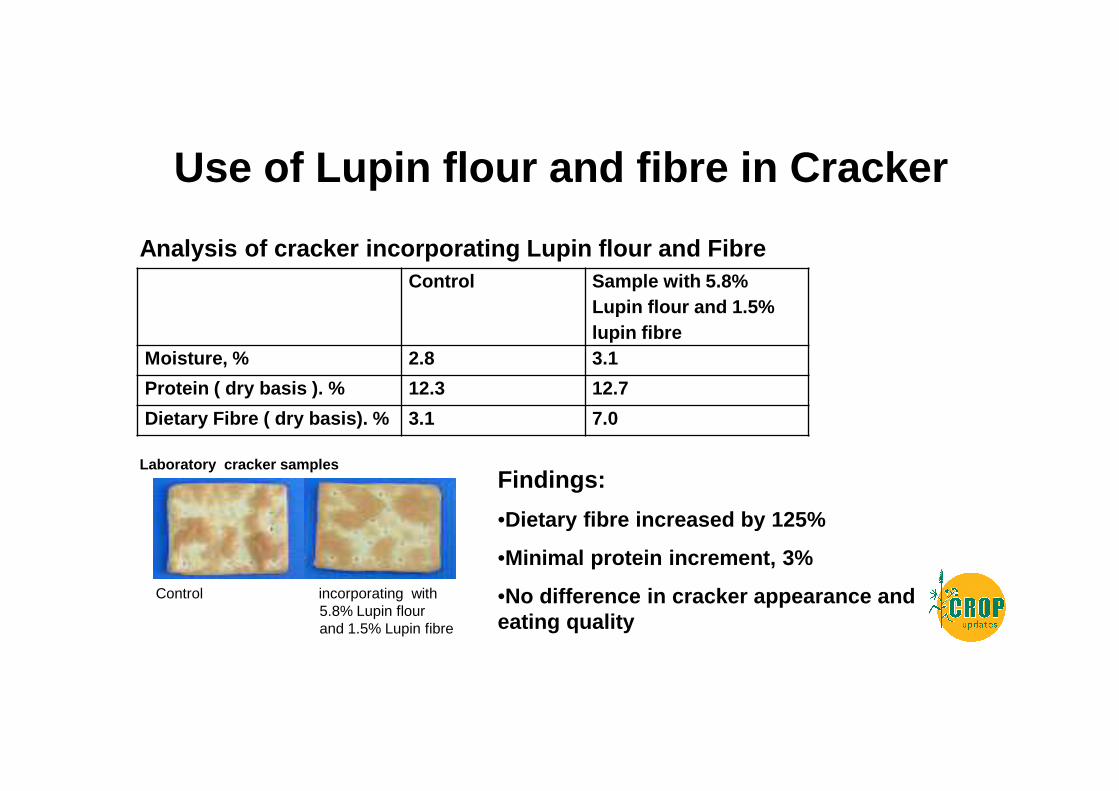
Use of Lupin flour and fibre in Cracker
Analysis of cracker incorporating Lupin flour and FibreControl Sample with 5.8%
Lupin flour and 1.5% lupin fibre
Moisture, % 2.8 3.1
Protein ( dry basis ). % 12.3 12.7
Dietary Fibre ( dry basis). % 3.1 7.0
Laboratory cracker samples
Control incorporating with 5.8% Lupin flourand 1.5% Lupin fibre
Findings:
•Dietary fibre increased by 125%
•Minimal protein increment, 3%
•No difference in cracker appearance and eating quality
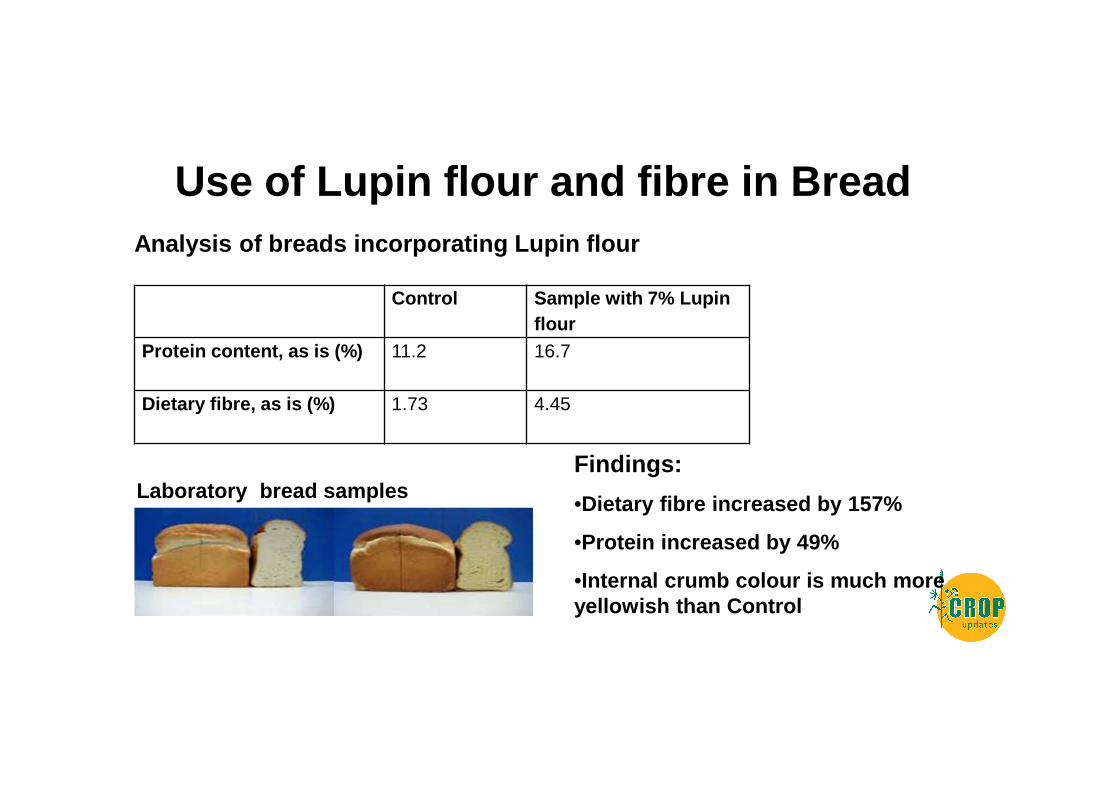
Use of Lupin flour and fibre in BreadAnalysis of breads incorporating Lupin flour
Control Sample with 7% Lupin flour
Protein content, as is (%) 11.2 16.7
Dietary fibre, as is (%) 1.73 4.45
Laboratory bread samples Findings:
•Dietary fibre increased by 157%
•Protein increased by 49%
•Internal crumb colour is much more yellowish than Control
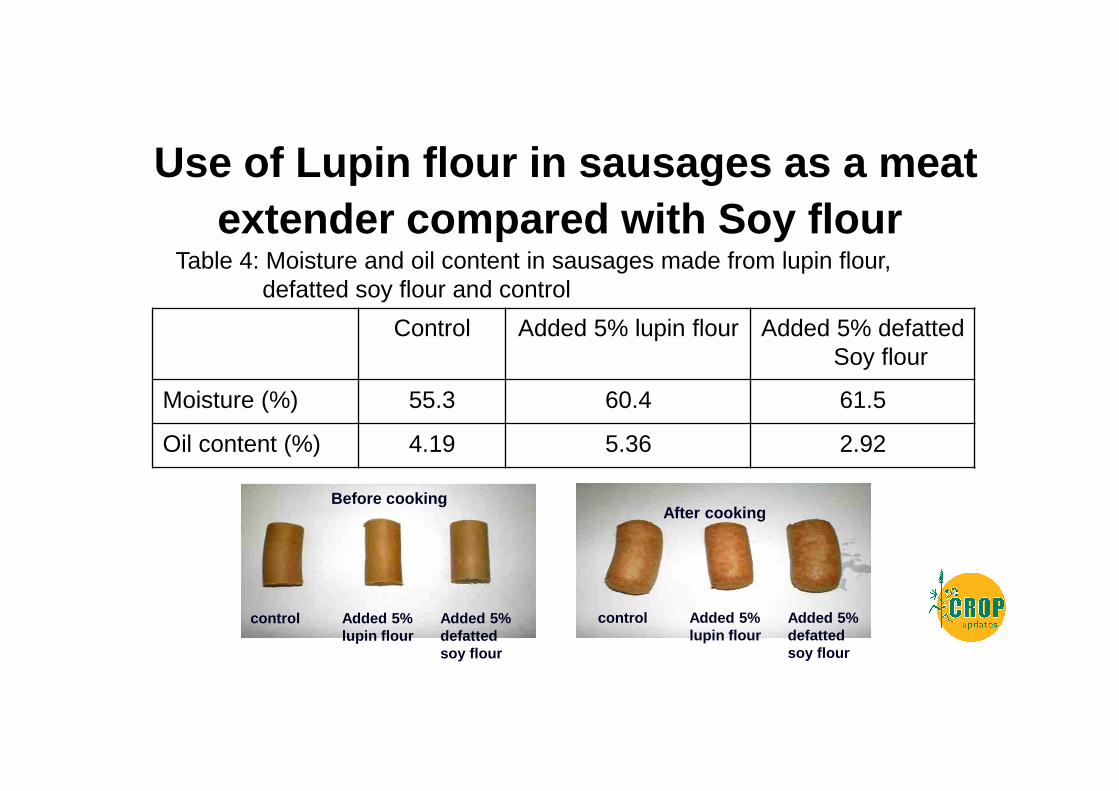
Use of Lupin flour in sausages as a meat extender compared with Soy flour
Table 4: Moisture and oil content in sausages made from lupin flour, defatted soy flour and control
Control Added 5% lupin flour Added 5% defatted Soy flour
Moisture (%) 55.3 60.4 61.5
Oil content (%) 4.19 5.36 2.92
control Added 5% lupin flour
Added 5% defatted soy flour
control Added 5% lupin flour
Added 5% defatted soy flour
Before cookingAfter cooking
Use of Lupin flour in sausages as a meat extender
Findings: • Significantly higher moisture content after cooking
compared with control • Indistinguishable in taste from Control and the
sausage using soy flour• No shrinkage was observed after cooking• Darker sausage colour
The Use of Lupins in Animal Feedings
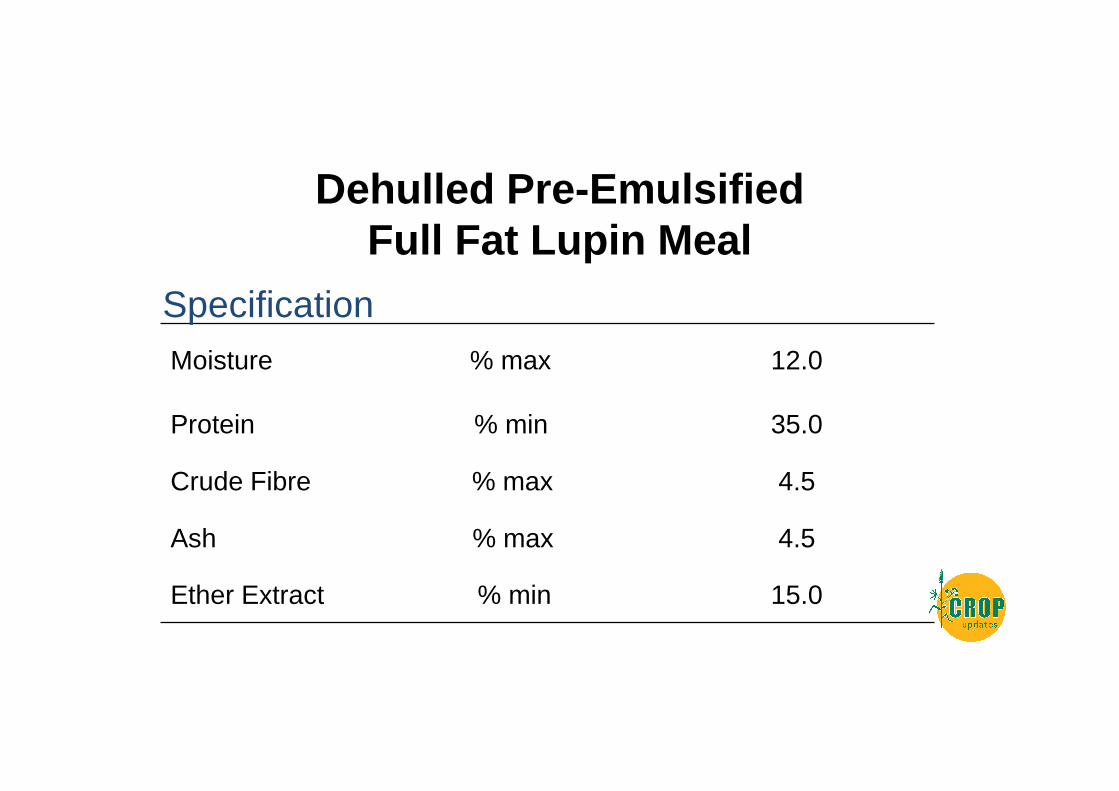
Dehulled Pre -Emulsified Full Fat Lupin Meal
Moisture % max 12.0
Protein % min 35.0
Crude Fibre % max 4.5
Ash % max 4.5
Ether Extract % min 15.0
Specification
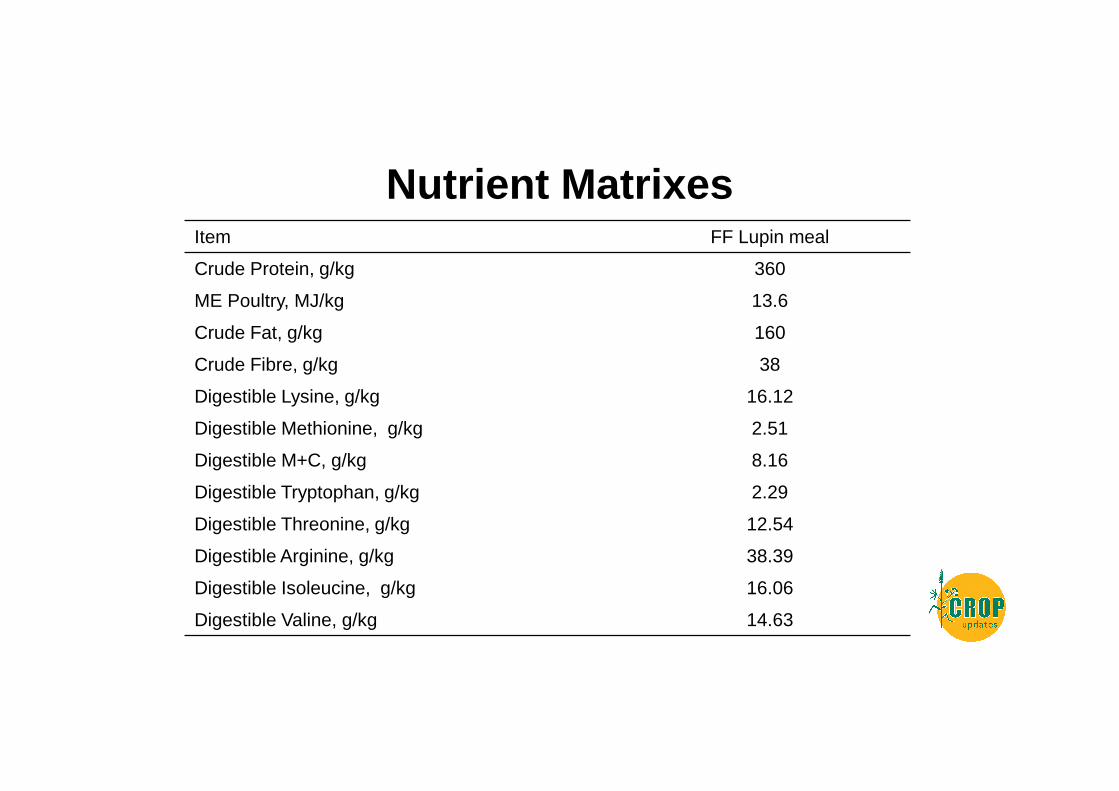
Nutrient MatrixesItem FF Lupin meal
Crude Protein, g/kg 360
ME Poultry, MJ/kg 13.6
Crude Fat, g/kg 160
Crude Fibre, g/kg 38
Digestible Lysine, g/kg 16.12
Digestible Methionine, g/kg 2.51
Digestible M+C, g/kg 8.16
Digestible Tryptophan, g/kg 2.29
Digestible Threonine, g/kg 12.54
Digestible Arginine, g/kg 38.39
Digestible Isoleucine, g/kg 16.06
Digestible Valine, g/kg 14.63

Broiler Feeding Trial
Conducted at BARC24th January – 9th February 2012
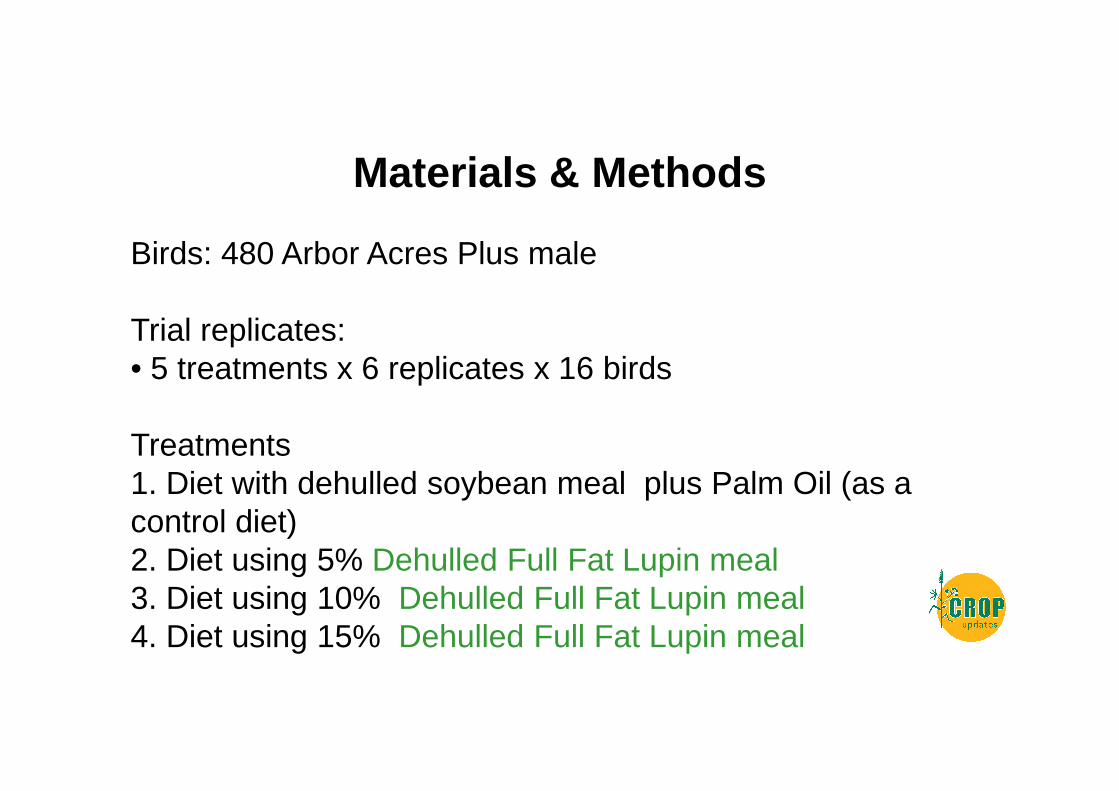
Materials & Methods
Birds: 480 Arbor Acres Plus male
Trial replicates:• 5 treatments x 6 replicates x 16 birds
Treatments1. Diet with dehulled soybean meal plus Palm Oil (as a control diet)2. Diet using 5% Dehulled Full Fat Lupin meal3. Diet using 10% Dehulled Full Fat Lupin meal4. Diet using 15% Dehulled Full Fat Lupin meal
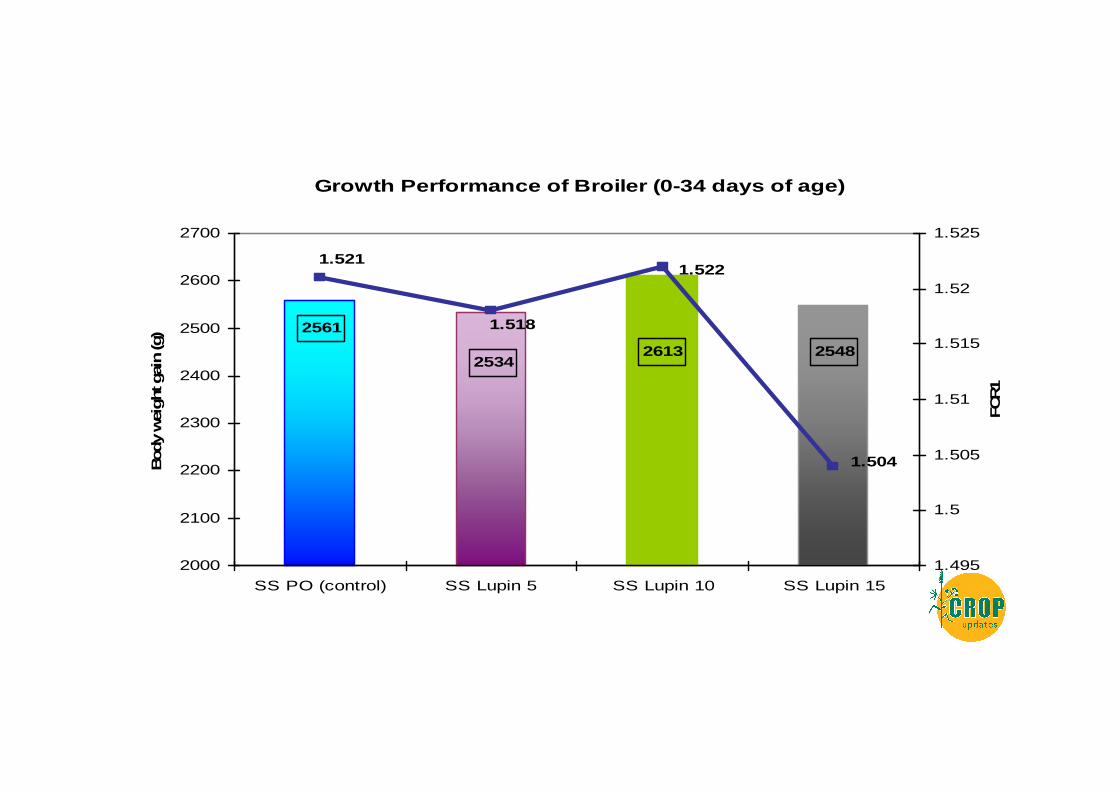
Growth Performance of Broiler (0-34 days of age)
25482534
2561
2613
1.504
1.522
1.518
1.521
2000
2100
2200
2300
2400
2500
2600
2700
SS PO (control) SS Lupin 5 SS Lupin 10 SS Lupin 15
Bod
y wei
ght g
ain
(g)
1.495
1.5
1.505
1.51
1.515
1.52
1.525
FCR1
Findings• No significant difference shown in final body weight, body weight gain
and FCR among all the diets.
• Numerically, the birds fed 10% full fat lupin meal has the highest body weight gain (2613 g) while those fed 5% full fat lupin meal has lowest body weight gain (2534 g).
• Full fat lupin meal usage did not have negative effect on feed intake.
• All treatments showed good livability (≥ 95%) and normal feces score.
• Overall, the use of full fat lupin meal at up to 15% in broiler diets did not have and adverse effect on growth performance.
Pig Feeding Trial conducted by Soon Soon replacing 75% of
the soybean meal with a sweet lupin meal specially processed
to maximize nutrient availability
Method and MaterialPigs : • 60 cross bred starter pigs
(Landrace x Large White x Duroc) No of treatment : • 2 treatments with 30 starters in each group No of replicate :• 10 replicates per treatments• 3 starters per pen; total of 20 pens were usedDuration of trial :• 56 days (8 weeks)
Trial conducted at University of Agriculture Malaysia
Measuring Parameters
� Average Daily Gain (ADG)
� Average Daily Feed Intake (ADF)
� Feed Conversion Ratio (FCR)
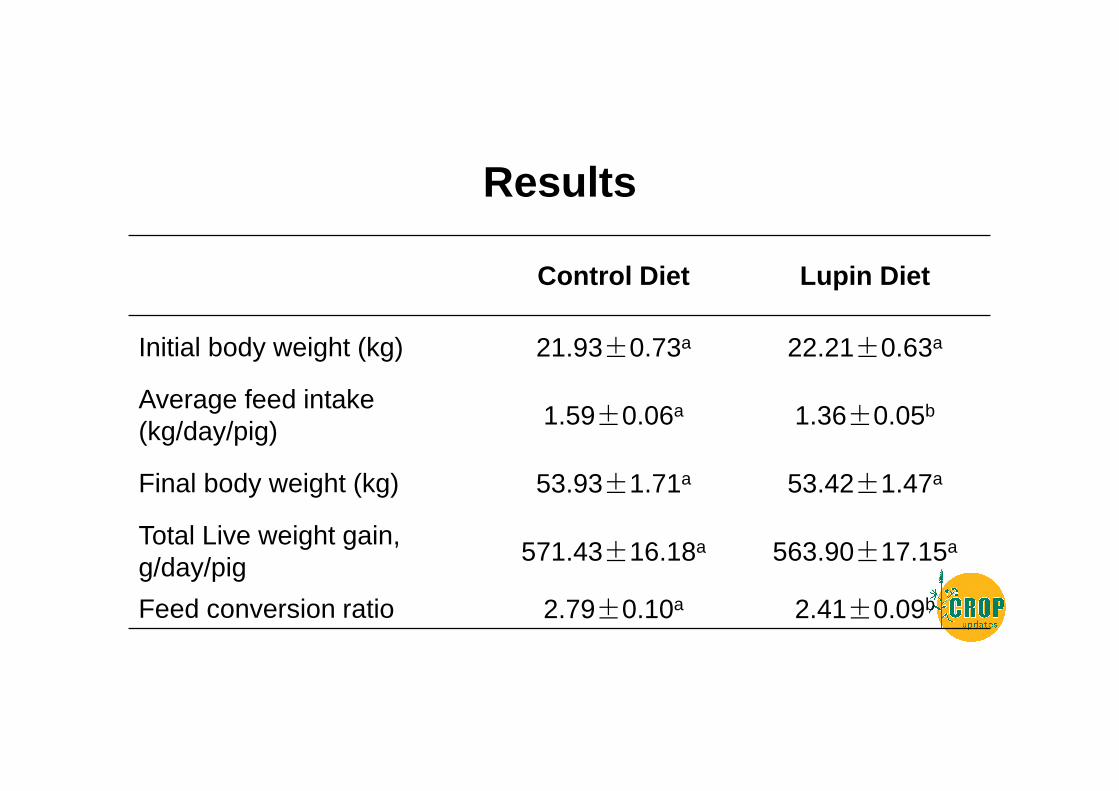
Results
Control Diet Lupin Diet
Initial body weight (kg) 21.93±0.73a 22.21±0.63a
Average feed intake (kg/day/pig)
1.59±0.06a 1.36±0.05b
Final body weight (kg) 53.93±1.71a 53.42±1.47a
Total Live weight gain, g/day/pig
571.43±16.18a 563.90±17.15a
Feed conversion ratio 2.79±0.10a 2.41±0.09b
Findings
• Initial body weight, total live weight gain and final body weight were not statistically significant (P>0.05).
• Feed intake and feed conversion ratio for the pigs offered the lupin diet was significantly lower (P<0.05) by 13.6%
Issues with the use of Lupins in Asian Food and Feed
• Supply has not been consistent• Although much research has been done with Lupins
replacing soybeans in tofu and soymilk ,but in reality Asian consumers cannot accept the difference in taste.
• Lupins may have to create its own niche instead of just replacing soybeans in Asian Soy foods.
• No health claims are allowed for Lupins at the moment• The potential use of Lupins in Asian aquaculture, poultry
and swine feeding is tremendous. • For effective use in aquaculture, poultry and swine
Lupins should be dehulled
A New Opportunity for Lupins
• Most of the soybeans grown in USA, Brazil and Argentine are genetically modified (GMO)
• Most of the consumers are resistant to GMO foods
• Lupins are non GMO, it can be a cost effective non GMO replacer for soybeans
Take home messages
• Australian wheat is more competitive in SE Asia post deregulation, and containerised shipments have increased
• Quality of Australian wheat in containerised shipments has deteriorated post deregulation
• Black Sea wheat can be competitive in quality and their prices can discount Australian wheat by up to USD50/mt at certain times of the season
• Australian canola has the potential to satisfy the increasing demand for canola oil and meal in SE Asia but it has to compete with Black Sea Canola at certain times of the year
Take home messages
• Certain varieties of Australian soybeans can perform well in soy milk and tofu when compared with Canadian and US Soy beans
• With the WHO’s current programme of reducing non Communicable diseases (NCDs) by 25% by 2025, lupins have a potential to be incorporated into Asian food products
• Dehulled lupin meal can replace soybean meal in aquaculture poultry and swine feeding

Questions?Dr. Soon-Bin Neoh
Soon Soon Group of Companies2448, Lorong Perusahaan 2,
Prai Industrial Estate13600 Prai ,Penang, Malaysia
Email :[email protected]