Embed Size (px)
Citation preview

Imperial College London
100 years of living science
100
The compositional simulation and seismic monitoring of CO2 EOR and sequestration in new gas condensate reservoir
Chengwu Yuan, Long JinThe University of Texas at Austin
Imperial College London
100 years of living science
100
Second Nature Poster
Dec. 03, 2008
Nat
ure
Pre
cedi
ngs
: doi
:10.
1038
/npr
e.20
08.2
661.
1 : P
oste
d 15
Dec
200
8

Imperial College London
100 years of living science
100Imperial College London
100 years of living science
100
OUTLINE
Background and Motivation
Method
Reservoir model
Simulation results
Conclusion
Nat
ure
Pre
cedi
ngs
: doi
:10.
1038
/npr
e.20
08.2
661.
1 : P
oste
d 15
Dec
200
8

Imperial College London
100 years of living science
100Imperial College London
100 years of living science
100
Background and Motivation
(1) CO2 can be stored in coal, in aquifer and in mature oil reservoir. We will try it in new reservoir taking advantage its flooding capability to speed up recovery.
(2) In gas condensate formation, when the reservoir pressure around production wells drops below the dew point pressure, liquid hydrocarbon phase called condensate is formed and decrease gas productivity significantly. CO2 injection will keep pressure level higher to delay or relieve this problem.
(3) Can seismic signal catch the front when the density contrast is not so big in gas condensate wells than in aquifer ?
Nat
ure
Pre
cedi
ngs
: doi
:10.
1038
/npr
e.20
08.2
661.
1 : P
oste
d 15
Dec
200
8

Imperial College London
100 years of living science
100Imperial College London
100 years of living science
100
(1) Reservoir simulation: Model the CO2 EOR and sequestration by the compositional simulation using CMG/GEM. PVTSIM is used for fluid characterization with Peng-Roberson Equation of State. Geochemical effect would be neglected in short term EOR process.
(2) Rock physics conversion
Gassmann equation (Gassmann, 1951; Mavko, 1998) is used to convert reservoir properties to seismic properties. Fluid properties are computed using the empirical formula (Batzle and Wang 1992; Vargaftik, 1975).
(3) Seismic modeling. Poststack seismic data using the simple convolution model now. In future, we would extend to pre-stack seismic modeling using finite difference.
Method
Nat
ure
Pre
cedi
ngs
: doi
:10.
1038
/npr
e.20
08.2
661.
1 : P
oste
d 15
Dec
200
8

Imperial College London
100 years of living science
100Imperial College London
100 years of living science
100
Flow chart
Formation properties Fluid properties Relative permeability
Reservoir simulation
Phase density Phase composition Pressure
Rock physics conversion
Seismic modeling
Vp Vs Vp
Seismic Data
Attribute analysis
Nat
ure
Pre
cedi
ngs
: doi
:10.
1038
/npr
e.20
08.2
661.
1 : P
oste
d 15
Dec
200
8

Imperial College London
100 years of living science
100Imperial College London
100 years of living science
100
Reservoir model
One quarter of the 5-spot well pattern.
50*50 cells.
Homogenous and isotropic
The permeability is 20md
Porosity is 0.14.
The producor at bottom left corner, BHP =800 psi. The injector at top right corner, BHP= 6000psi.
injector
producer
Nat
ure
Pre
cedi
ngs
: doi
:10.
1038
/npr
e.20
08.2
661.
1 : P
oste
d 15
Dec
200
8

Imperial College London
100 years of living science
100Imperial College London
100 years of living science
100
Reservoir model
9 components fluid model
Component
Mole %
MW
Tc (R)
Pc (Psia)
Accentric factor
N2 0.76 28.014 227.16 492.32 0.040
Co2 1.54 44.01 547.56 1069.87 0.225
C1 81.7 16.04 343.08 667.2 0.008
C2-C3 9.68 34.15 593.25 673.58 0.118
C4-C6 2.90 67.62 819.95 499.15 0.231
C7+_1 1.7 111.64 1017.23 374.47 0.395
C7+_2 1.12 175.76 1191.30 278.61 0.594
C7+_3 0.6 305.44 1472.60 215.23 0.910
Table 1 Characterized fluid properties using PVTSIM with PREOSNat
ure
Pre
cedi
ngs
: doi
:10.
1038
/npr
e.20
08.2
661.
1 : P
oste
d 15
Dec
200
8
Imperial College London
100 years of living science
100Imperial College London
100 years of living science
100
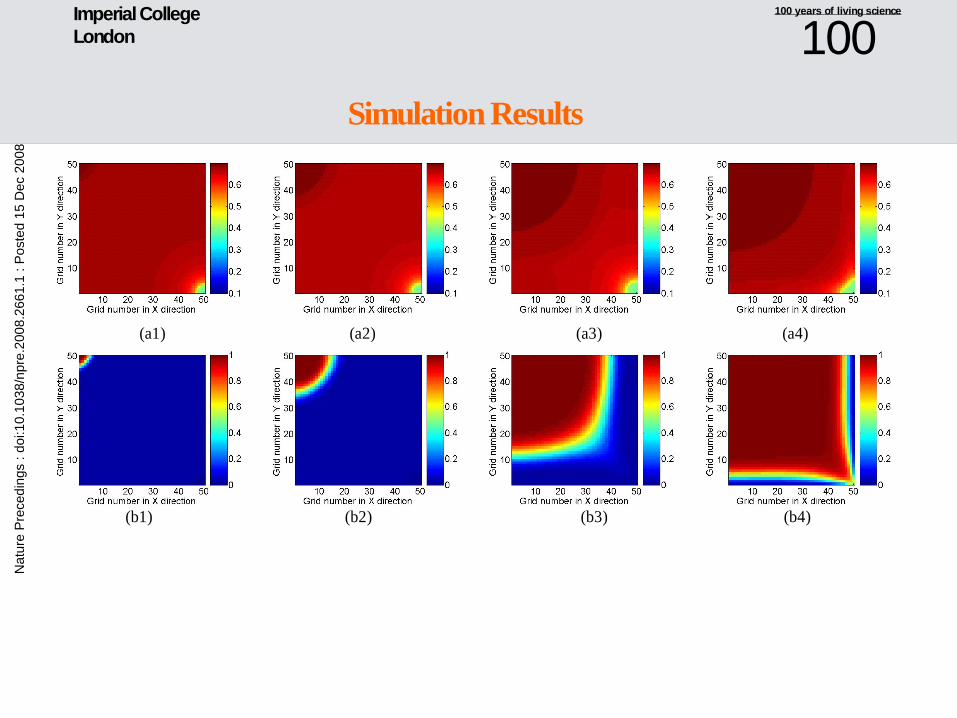
Simulation Results
(a1) (a2) (a3) (a4)
(b1) (b2) (b3) (b4)
Nat
ure
Pre
cedi
ngs
: doi
:10.
1038
/npr
e.20
08.2
661.
1 : P
oste
d 15
Dec
200
8

Imperial College London
100 years of living science
100
(a1) (a2) (a3) (a4)
(b1) (b2) (b3) (b4)
Simulation Results
Figure 1. Simulation and rock-physics conversion results for 4 production steps. (a1-a4) gas saturation; (b1-b4)CO2 composition
Nat
ure
Pre
cedi
ngs
: doi
:10.
1038
/npr
e.20
08.2
661.
1 : P
oste
d 15
Dec
200
8

Imperial College London
100 years of living science
100
(c1) (c2) (c3) (c4)
(d1) (d2) (d3) (d4)
Simulation Results
Figure 1. Simulation and rock-physics conversion results for 4 production steps. (c1-c4)gas density; (d1-d4) P-wave velocity
Nat
ure
Pre
cedi
ngs
: doi
:10.
1038
/npr
e.20
08.2
661.
1 : P
oste
d 15
Dec
200
8

Imperial College London
100 years of living science
100
(e1) (e2) (e3) (e4)
(f1) (f2) (f3) (f4)
Figure 1. Simulation and rock-physics conversion results for 4 production steps. (e1-e4) S-wave velocity; (f1-f4) density.
Simulation Results
Nat
ure
Pre
cedi
ngs
: doi
:10.
1038
/npr
e.20
08.2
661.
1 : P
oste
d 15
Dec
200
8

Imperial College London
100 years of living science
100
(a1) (a2) (a3) (a4)
(b1) (b2) (b3) (b4)
Figure 2. Seismic modeling results. (a1-a4) amplitude slice of poststack seismic data; (b1-b4) amplitude slice of poststack seismic data with 10% random .
Simulation Results
Nat
ure
Pre
cedi
ngs
: doi
:10.
1038
/npr
e.20
08.2
661.
1 : P
oste
d 15
Dec
200
8

Imperial College London
100 years of living science
100Imperial College London
100 years of living science
100
Comparison between Fig.1 and Fig.2 shows that seismic signal with adequate precision could monitor both the CO2 injection front and the condensate blocking area.
Nat
ure
Pre
cedi
ngs
: doi
:10.
1038
/npr
e.20
08.2
661.
1 : P
oste
d 15
Dec
200
8

Imperial College London
100 years of living science
100
0.001
0.01
0.1
1
0 50 100 150 200Time,days
Mo
le F
ract
ion
in G
as P
has
e
C1 C2-C3C4-C6 C7-C11C12-C17 C18-C80CO2 N2
Figure 3. Mole fraction in produced gas phase (SC)
Simulation Results
Nat
ure
Pre
cedi
ngs
: doi
:10.
1038
/npr
e.20
08.2
661.
1 : P
oste
d 15
Dec
200
8

Imperial College London
100 years of living science
100
0.0001
0.001
0.01
0.1
1
0 50 100 150 200Time,days
Mole
Fra
ctio
n in
Oil
Phase
C1 C2-C3C4-C6 C7-C11C12-C17 C18-C80CO2 N2
Figure 4. Mole fraction in produced oil phase (SC)
Simulation Results
Nat
ure
Pre
cedi
ngs
: doi
:10.
1038
/npr
e.20
08.2
661.
1 : P
oste
d 15
Dec
200
8

Imperial College London
100 years of living science
100Imperial College London
100 years of living science
100
Figure 3 and Figure 4 shows CO2 mole fraction in produced gas and oil phase. CO2 breaks through in about 40 days.
Figure 5 shows cumulative gas and oil production by CO2 EOR and by natural depletion. When CO2 breaks through, difference in the cumulative gas is not big. But the cumulative oil production increased significantly, because CO2 injected keeps the formation pressure higher than that in natural depletion. More heavy components are flooded out, which otherwise would drop out as condensate in formation. This is verified in Figure 4, where C18-C20 parallels the CO2 in mole fraction in produced gas.
Nat
ure
Pre
cedi
ngs
: doi
:10.
1038
/npr
e.20
08.2
661.
1 : P
oste
d 15
Dec
200
8

Imperial College London
100 years of living science
100
0
2000
4000
6000
8000
10000
0 50 100 150 200Time, days
Cu
mu
lati
ve o
il,s
tb
01002003004005006007008009001000
Cu
mu
lati
ve g
as, m
mscfNatural depletion: oil
CO2 EOR: oilNatural depletion: gasCO2 EOR: gas
Figure 5. Cumulative production, CO2 EOR vs natural depletion
Simulation Results
Nat
ure
Pre
cedi
ngs
: doi
:10.
1038
/npr
e.20
08.2
661.
1 : P
oste
d 15
Dec
200
8

Imperial College London
100 years of living science
100Imperial College London
100 years of living science
100
Figure 6 shows cumulative CO2 injected and produced and gas production rate.
After CO2 breakthrough, the gas rate does not vary much. And the cumulative CO2 injected tend to parallel to the cumulative produced. That means the CO2 is almost cycling in the two wells. The early CO2 injection serves as EOR and storage. It would be better than injection starts after formation is depleted where CO2 EOR capacity has been seriously compromised and wasted.
Nat
ure
Pre
cedi
ngs
: doi
:10.
1038
/npr
e.20
08.2
661.
1 : P
oste
d 15
Dec
200
8

Imperial College London
100 years of living science
100
0.E+00
2.E+08
4.E+08
6.E+08
8.E+08
1.E+09
0 50 100 150 200Time,days
Cu
mu
lati
ve C
O2,
gm
ol
0.0
0.5
1.0
1.5
2.0
2.5
3.0
3.5
Gas
rat
e, m
msc
f/d
ay
Cumulative CO2 injectedCumulative CO2 injectedGas rate (SC)
Figure 6. Cumulative CO2 injected and produced.
Simulation Results
Nat
ure
Pre
cedi
ngs
: doi
:10.
1038
/npr
e.20
08.2
661.
1 : P
oste
d 15
Dec
200
8

Imperial College London
100 years of living science
100
The combined CO2 EOR and sequestration at the very beginning has advantage over natural depletion and storage after natural depletion. It will speed up the recovery process while simultaneously store CO2.
Seismic survey with adequate precision can monitor the condensate zone and CO2 front in gas condensate formation.
Conclusion
Nat
ure
Pre
cedi
ngs
: doi
:10.
1038
/npr
e.20
08.2
661.
1 : P
oste
d 15
Dec
200
8