Embed Size (px)
Citation preview

The Concentration and Effect of Training and Education on Weekly Wages and Job Satisfaction Using Florida’s (2002) Occupational Classes
Statistics Canada Socioeconomic Conference 2011 Longitudinal Survey of New Immigrants to Canada (LSIC)
Co-Authors:
Vasiliki (Vass) Bednar, [email protected]
Adrienne Davidson, [email protected]
Brittany Stief, [email protected]
p.416.673.8580 f.416.673.8599
School of Public Policy & Governance University of Toronto 14 Queen’s Park Cresent WestToronto, ON M5S 3K9
Supervised by Prof. Oleyna Falenchuk Ontario Institute for Studies in Education (OISE), University of Toronto
With contributions from: Karen King (Martin Prosperity Institute), Byron Lee (University of Toronto Research Data Centre), Shabnam Mohsenzadeh (Institute for Competitiveness & Prosperity), and Jacqueline Whyte-Appleby (Martin Prosperity Institute)
April 2011

iMartin Prosperity Institute | www.martinprosperity.org
The Concentration and Effect of Job Training and Effects on Weekly Wages and Job Satisfaction Using Florida’s (2002) Occupational Classes. By V. Bednar, A. Davidson, and B. Stief
AbstractVasiliki (Vass) Bednar, [email protected] Davidson, [email protected] Stief, [email protected]
p.416.673.8580 f.416.673.8599
School of Public Policy & Governance University of Toronto
The concentration of training and education on weekly wages and job satisfaction using Florida’s (2002) occupational classes
There is a recent and growing literature in labour economics that discusses trends in the labour force in terms of three major occupational groupings: the Creative Class, Service Class, and Working Class. To date, this body of literature has largely ignored the implications of the training and/or receipt of education for new immigrants for their labour market success and potential mobility both within and between classes. This study uses the Longitudinal Study of Immigrants to Canada (LSIC) to describe basic trends in new immigrant integration into the Canadian labour force, as segregated by these major occupational groupings. The study employs longitudinal modeling to estimate the effects of training (in the form of education, job or language training) on two metrics of job success: mean weekly wages and self-reported job satisfaction. The results indicate that the greatest returns to wages occur as a result of the uptake of education, across all classes. However, education is taken up the least out of the three forms of training. Findings also indicate that training and education have a negative impact on job satisfaction, suggesting that intra- and inter-class mobility may not be experi-enced to the degree desired upon receiving Canadian-based training.
L’effet de l’entrainement et de l’éducation sur la salaire hebdomadaire et la satisfaction d’œuvre reporté de soi a travers les classes travaillistes de Florida (2002)
Il y a une littérature active de l’économie travailliste adressant l’évolution de la force travailliste en traine de trois groups principale: la classe Créatif, la classe de Services et la classe Travailleur. A date, cette littérature n’a pas poursuit les implications de l’entrainement ni/ou l’éducation de l’immigrant pour le succès dans la marche libre ni pour la mobilité entre ou a travers les classes. Cette étude utilise le document classique Longitudinal Study of Immigrants to Canada (LSIC) pour décrire des tendances d’intégration de l’immigrant nouvel dans la marche d’oeuvres Canadien, a travers ces trois groups principales. On emploi la technique longitudinal pour estimer les effets de l’entrainement (éducation générale ou l’entrainement de l’oeuvre ou de langes) sur deux mesures du succès travaillante – le salaire moyenne hebdomadaire et la satisfaction d’oeuvre reporté de soi. Les résultats dénotes que les plus grande rendements du salaire deviens de l’éducation, pour tous les trois groupes. Mais, l’éducation générale est prise la moindre de ces trois options. Trouvailles indique que l’entrainement et de l’éducation ont un impacte négatif sur la satisfaction d’oeuvre, suggérant que la mobilité la satisfac-tion d’oeuvre entre et a travers des classes travailliste n’est pas obtenu quelque désires d’après de entrainements Canadien.
iiMartin Prosperity Institute | www.martinprosperity.org
The Concentration and Effect of Job Training and Effects on Weekly Wages and Job Satisfaction Using Florida’s (2002) Occupational Classes. By V. Bednar, A. Davidson, and B. Stief
Table of ContentsAbstract i
Contents ii
Background 1 Research question ..................................................................................................1 Major occupational groupings ...............................................................................2
Methodolgy 3 Data preparation .....................................................................................................4 Measures .................................................................................................................4 Analytical design .....................................................................................................6
Results and Discussion 7 Descriptive statistics ..............................................................................................7
Modeling Results 12 Square root of weekly wage model ..................................................................... 12 Job satisfaction model ......................................................................................... 14
General Trends and Conclusion 16 Shortcomings and further analysis .....................................................................16 Policy implications ................................................................................................ 17 Scaleability ............................................................................................................ 18
Works Consulted 19
List of Appendices 22 Appendix A ............................................................................................................22 Appendix B ............................................................................................................24 Appendix C ............................................................................................................26 Appendix D ............................................................................................................27

1Martin Prosperity Institute | www.martinprosperity.org
The Concentration and Effect of Job Training and Effects on Weekly Wages and Job Satisfaction Using Florida’s (2002) Occupational Classes. By V. Bednar, A. Davidson, and B. Stief
BackgroundThe Longitudinal Survey of Immigrants to Canada (LSIC) was designed to study how new immigrants adjust to living in Canada over time. The national immigration system plays a central role in meeting the nation’s human resource requirements, and this survey is central to understanding barriers and enablers of immigrant success.
Canada’s reliance on immigration for labour force growth has increased sharply since the 1980s, and in the coming decades it is expected to account for all of the country’s net labour force growth (Gaskell 2007). Despite this, as a recent Toronto Star article (January 29, 2010) suggested, “few [immigrants] believe they can meet their career goals in Canada.” The article further reported that only 30% of immi-grants feel that their jobs are commensurate with their career goals in Canada, and their experience and/or education prior to immigrating. In response to this dissatisfaction, there have been many compelling proposals for the strategic reform of Canada’s federal immigration system (Alboim 2009, Drummond 2009). However, appropriate reform is dependent on a deep appreciation of the composi-tion and challenges of the labour force for new immigrants.
While it is generally understood that immigrants are not reaching their full potential in the Canadian labour market, it is often difficult to conceptualize where the gaps exist. In order to facilitate change, policy makers must ask such relevant questions as: in what labour classes are new immigrants entering the Canadian labour force? To what extent are foreign credentials being recognized? Is there a certain type or class of work that recognizes these more than others?
Recognizing that there are important long-term economic, labour market, and intergenerational equity implications associated with increasing the number of immigrants to Canada, this paper capitalizes on the popularization of the work of labour economist Richard Florida, which has dominated discourse around the knowledge economy and ‘Creative Class workers’ in urban regions around the world since 2002 (The Rise of the Creative Class, and The Flight of the Creative Class). The occupational groupings pioneered by Dr. Florida are a constructive mechanism with which to reframe recent immigrants and their participation in the Canadian labour force. This study reorganizes the LSIC respondents into these occupational groupings, allowing us to explore the demographic characteristics of each occupational grouping. It also reveals where training is concentrated, and enables us to measure both where and what type of training is most effective. These groupings have been widely studied in the past ten years, but never in the context of immigration.
Research questionThe research undertaken in this study considers whether there is evidence
2Martin Prosperity Institute | www.martinprosperity.org
The Concentration and Effect of Job Training and Effects on Weekly Wages and Job Satisfaction Using Florida’s (2002) Occupational Classes. By V. Bednar, A. Davidson, and B. Stief
that workers within various sectors of the labour force – specifically, the three main occupational groupings established and popularized by Florida’s typology (2002): the Creative Class, Service Class, and Working Class — engage in training programs within their first four years of employment in Canada. In addition to exploring which sectors tend to employ recent immigrants, the study also explores the extent to which worker training programs affect socioeconomic status over time. With these motivations in mind, this study aims to satisfy three related research questions:
1. Are training opportunities (and uptake) equally distributed across the three classes of the labour force?
2. Is there evidence that socioeconomic status – as indicated by median weekly wages and self-reported job satisfaction – improves for those who have received training? Here, we want to measure the effect of training (independent variables) on labour market success (dependent variable).
3. Where are any wage gains concentrated in terms of employment sector?
Full participation in the labour market is a central aspect of integration for new immigrants, and appropriately targeted training opportunities could help to pro-mote fuller participation. As such, this research aims to inform policy choices that directly influence training opportunities in the workforce for new immigrants.
Major occupational groupingsThe following section will further describe each of the occupational groupings into which the survey sample is categorized.1
Creative ClassCreativity-oriented occupations are high-autonomy jobs where workers are paid to think (e.g. artists, doctors, senior managers, and architects). Persons involved in creative class work add economic value through the generation of new ideas and forms. The class is generally defined by two broad characteristics. The first is that employees have specialized competencies, and they are expected to formulate new solutions and ideas, or solve complex problems. The second is that they enjoy high levels of workplace autonomy, such that Creative Class workers have the ability to translate ideas or knowledge into actions without impediment or the supervision of others.
Service ClassThe service class is comprised of routine-oriented service occupations in the service sector (e.g. food service workers, janitors, groundskeepers, secretaries, and clerks) where workers enjoy lower levels of autonomy than in the Creative Class. The services that are provided are nondurable and available for direct consumption. Service workers are also those in business services, including
1 Note that Appendix A describes their categorization in greater detail.

3Martin Prosperity Institute | www.martinprosperity.org
The Concentration and Effect of Job Training and Effects on Weekly Wages and Job Satisfaction Using Florida’s (2002) Occupational Classes. By V. Bednar, A. Davidson, and B. Stief
accountants and cashiers. Despite the obvious range in prestige, a defining characteristic of service class work is routinization. Service class work is domi-nated by forms of standardization and control which prevent the expression of individual creativity.
Working ClassThe working class is comprised of occupations that depend on routine-oriented physical skills and repetitive tasks (e.g. construction trades, mechanics, trade operator, and assembly line workers). Typically, members of the Working Class are wage earners who produce material commodities and who engage in physi-cal labour. Most generally, Working Class jobs are comprised of manufacturing and physical labour occupations that require little in the way of formal education. Their importance (prominence) in the economy has been in decline recently, but these jobs are still a popular form of employment for less-educated workers.
Florida’s fourth occupational class — Fishing, Farming, and Forestry — was left out of our analysis for several reasons: the sample group is significantly smaller; work is often seasonal which may skew income estimates; and work often requires a very unique skill set, so the effects of job training programs could bias the rest of our study.
HypothesisWe anticipate that the uptake of Canadian education-related training will be concentrated in the Service and Working Classes and that this training will be positively correlated to job satisfaction and wages.
MethodolgyDataWe use all three waves of data from the LSIC. Approximately 20,300 new immi-grants to Canada were interviewed at three points in time: at six months (2000), 2 years (2002) and 4 years after arrival in Canada (2004). Throughout this study, we look at immigrants who report employment in at least one wave, in one of the three classes of interest. We allow for the variability in employment status, as it makes allowances for unemployment due to new educational opportunities, and job shifting. We moreover do not consider Fishing, Farming and Forestry work, due to the low proportion of immigrants employed in this occupational class (Table 1: 2.02%), and its seasonal nature. This class is not featured in our analy-sis due to low n-values that could not be disclosed, in addition to the reasons noted above.

4Martin Prosperity Institute | www.martinprosperity.org
The Concentration and Effect of Job Training and Effects on Weekly Wages and Job Satisfaction Using Florida’s (2002) Occupational Classes. By V. Bednar, A. Davidson, and B. Stief
Data preparationIn order to build a model to understand the impact of job training and educa-tion on job success, relevant survey questions were isolated, including those that focused specifically on both metrics of job success (including weekly wage, job duties, and job satisfaction) and educational attainment (measuring uptake of language training, job training, or further education since arriving in Canada). Other relevant survey data included demographic variables including age, gender, ethnicity, prior education and work experience, and language proficiency.
The most significant modification made to the existing data was with respect to the classification of occupations, occupational training, desired occupation, and jobs held before immigration. The LSIC features job categorization by both Occupational Major Groups and Occupational Unit Groups (through the Standard Occupational Classification System – SOC 1991), and by Industry Unit Groups and Industry Sectors (as set by the North American Industry Classification Sys-tem — NAICS 1997). For the occupational recoding done in this study, the SOC Occupational Major Groups were chosen for the transition, as the job classifica-tions were the most specific, and were most closely matched to the classifications delineated in Florida’s Occupational Groups. The occupations and occupational training of all participants were recoded into a 1-3 scale according to their classifi-cation within the Creative Class (1), the Service Class (2), or the Working Class (3). Appendix A discloses how the Occupational Major Groupings used in the LSIC survey were translated (recoded) into each of the occupational classes.
Following the recoding of variables,2 basic visualization of the data was under-taken to look for any major outliers. The only outliers that were subject to deletion were those deemed to not make sense in the context of the question. Such outliers were identified in respect of weekly wage, and hours per week of work, and were summarily removed from the data set (i.e. set to “.”). Outliers were determined by standardizing the wage variable by creating a Z score. Any individuals who reported wages that fell outside the -3/+3 Z-score range were excluded from the analysis, resulting in approximately 200 individuals being excluded from the analysis (dropping the sample size from 10,950 to 10,733). The weekly wage distribution was further normalized for analysis through a square root function.
Measures
Dependent variablesThe analysis considered two metrics of labour force integration and job success: any measured deviation in weekly wage, and potential gains in job satisfaction.
2 The data process included reshaping the dataset long-form format. Fishing, Farming and Forestry was removed from later analysis due to small sample size, and in some instances, the Working Class was also omitted from descriptive analysis for the same reason. Answers denoting: Not Applicable, Don’t Know, Valid Skip, Refused, or Not Stated were replaced with “.” to indicate missing information.

5Martin Prosperity Institute | www.martinprosperity.org
The Concentration and Effect of Job Training and Effects on Weekly Wages and Job Satisfaction Using Florida’s (2002) Occupational Classes. By V. Bednar, A. Davidson, and B. Stief
Previous interest in the variable of “job duty change” was discounted due to low numbers reporting change, and the underlying possibility that not all change is positive (i.e. removal of duties), which would not be reflected in the data.
i. Weekly wage acts as a strong metric of job success, as it may be an indication of promotion, greater job duties at work, and improved status in the workplace (including through an increase in number of hours worked per week). There are inherent problems with using weekly wage as a dependent variable, as this measurement does not follow a normal distribution, and is generally positively skewed. To normalize the weekly wage data in this dataset, the weekly wage was subjected to a square-root function.
ii. Job Satisfaction is a weaker metric of success than median weekly wage, but it is useful because it speaks to perceived workplace success as experienced by the survey respondents. Originally a four-part categor-ical variable, this measure was recoded to be a dummy variable denoting “satisfaction” versus “dissatisfaction” with current employment.
Independent variables
i. Training and Education is seen to be a potentially important factor of immigrant success in Canada, and is elucidated in the LSIC survey through inquiry into three kinds of training: language training, job training, and involvement in further educational programs in Canada. These categories were maintained in the data management. It should be noted that the Language Training variable combines two categories (French language training and English language training) into one coded dummy variable. The assumption herein is that immigrants are receiving training in the official language of greatest relevance to the local labour market economy.
ii. Prior Education refers to the highest level of achieved education inside or outside of Canada. A multi- category variable, this confounding factor was recoded into a three-level categorical dummy variable. Immigrants who reported never completing high school, completing high school, or attending (but not completing) either university, CEGEP, college or an apprenticeship, were grouped into a reference category of “High School or Lower.” Those who reported having completed a college, university or apprenticeship program were grouped into a Postsecondary category, while those who had completed a postgraduate or professional degree were categorized in Postgraduate category. Prior education is believed to be strongly linked to job success in Canada, and speaks to levels of human capital among the immigrant population.
iii. Language Proficiency reflects the ability at which a new immigrant speaks one of the official languages. It is important to note that this variable is only considered for immigrants for whom English/French

6Martin Prosperity Institute | www.martinprosperity.org
The Concentration and Effect of Job Training and Effects on Weekly Wages and Job Satisfaction Using Florida’s (2002) Occupational Classes. By V. Bednar, A. Davidson, and B. Stief
is not their mother tongue, and for whom English/French is not the primary language spoken in the home. Thus, only those immigrants who report English/French as a secondary language are captured in the Language Proficiency data.3
iv. Time is a key variable in understanding the effects of training on job success. It is utilized in all interaction terms, to understand the effect of education/training on rates of change, per one year. This is an important change to note, as in the raw data, time was coded by Wave (1, 2, 3) but not by time period, and thus required modification. The time variable was modified to a variable of 0 1.5, 3.5 to reflect the time passed during the interview processes. This time variable means that: Time 0 represents six months in Canada, Time 1.5 represents two years in Canada, and finally Time 3.5 represents four years in Canada. While it would similarly be possible to code the time to be 0.5, 2, 4, this causes some issues in estimating the intercept.
Control variablesAnalyses were adjusted to consider age (in 10 year cohorts), gender, prior educa-tion level, language proficiency, and visible minority status. Further analyses considered interaction terms with gender over time and with training, however most results were insignificant and they generally were either very small effects and not directly related to the research question. After exploring these more detailed models, we decided to remove the gender interaction terms in favor of a simpler model that is more representative of what we are interested in looking at.
Analytical designEducation and training opportunities affect Creative, Service, and Working Occu-pational Classes with varying magnitudes. In order to determine what these effects are, the analytical stage separated each occupational group in the modeling. Prior to running the models, the data was investigated to see whether there was signifi-cant movement between each of the classes (i.e. from Service to Creative), as this might be a move enabled by training. Upon visualizing the data, it was seen that this movement between classes remains very low, with less than 5% movement into or out of any one group (data not shown), and thus this was not considered further. This suggests a relatively static nature of immigrant employment in Canada, but is also deserving of further research. In order to simplify the modeling of education on job success, the impact of training was only considered within classes.
Analyses were completed using both an xtmixed regression and an xtlogit regression, for square-root weekly wage and job satisfaction variables, respectively. The normal distribution of weekly wages (after normalization)
3 The categorical (1-5) data was re-coded into a three-categorical variable: 0 represents poor language skills (reported 1 or 5), 1 represents moderate language skills (a reported 2) and 2 represents good language skills (a reported 3 or 4).

7Martin Prosperity Institute | www.martinprosperity.org
The Concentration and Effect of Job Training and Effects on Weekly Wages and Job Satisfaction Using Florida’s (2002) Occupational Classes. By V. Bednar, A. Davidson, and B. Stief
is maintained over each of the job classes, and thus does not complicate the analysis. In isolating the effects within each job category, it is difficult to draw comparative conclusions between groups. Future study may compare such relationships.
Regression analysis was also completed for a normalized hourly wage variable however the results are not articulated within this paper. It was decided that the normalized weekly wage variable acted as a better metric of labour force integration, as it was indicative of other integration characteristics including hours worked per week.
Results and DiscussionDescriptive statistics
Composition of occupational groupsThe composition of occupational groups is the natural starting point for the descriptive statistics of this study. In understanding the employment charac-teristics of Canada’s immigrant population, it is important to know: 1) which job class immigrants were employed in prior to arriving in Canada; 2); what job class they are employed in when in Canada; and finally 3) what job class they desire to be in when in Canada. This information speaks to a number of issues regarding not only educational credential recognition, but also the recognition of prior work experience. It also allows us to consider other possible barriers to employment such as language proficiency, the role of training, and labour market access. Within the sample population, 56% of respondents were male, and 44% female. Further description of sex by job class can be seen below in Table 1.
TABLE 1 Sex by job classification immigrant labour force (%)
Sex Creative Service Working Total
Immigrant Labour Force (LSIC Survey 2000–2004)
Female 40.80 52.54 29.89 44.26
Male 59.15 47.46 70.11 55.74
Canadian Labour Force (2006 Census)
Female 48.68 62.68 14.47 47.39
Male 51.32 35.99 85.53 52.61
As seen above, there are gender divisions between job classes. Of new immigrants to Canada employed in the Creative and Working Classes, there are a greater proportion of men (~60% and ~70% respectively). The proportion of immigrant
8Martin Prosperity Institute | www.martinprosperity.org
The Concentration and Effect of Job Training and Effects on Weekly Wages and Job Satisfaction Using Florida’s (2002) Occupational Classes. By V. Bednar, A. Davidson, and B. Stief
men and women employed in the Canadian labour force do not differ substantially from the greater Canadian population. However, there are interesting differences within occupational classes. Notably, there are a greater proportion of male immi-grants employed in the Service Class, and a higher proportion of women immi-grants in the Working Class.
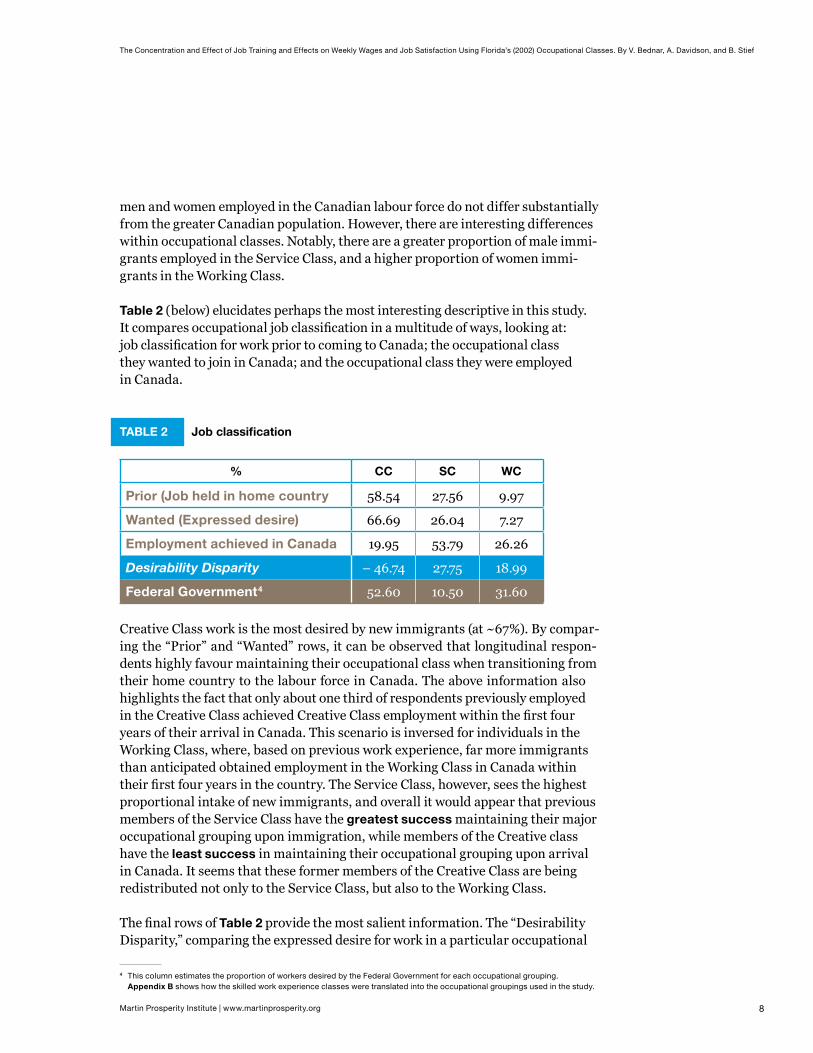
Table 2 (below) elucidates perhaps the most interesting descriptive in this study. It compares occupational job classification in a multitude of ways, looking at: job classification for work prior to coming to Canada; the occupational class they wanted to join in Canada; and the occupational class they were employed in Canada.
TABLE 2 Job classification
% CC SC WC
Prior (Job held in home country 58.54 27.56 9.97
Wanted (Expressed desire) 66.69 26.04 7.27
Employment achieved in Canada 19.95 53.79 26.26
Desirability Disparity – 46.74 27.75 18.99
Federal Government4 52.60 10.50 31.60
Creative Class work is the most desired by new immigrants (at ~67%). By compar-ing the “Prior” and “Wanted” rows, it can be observed that longitudinal respon-dents highly favour maintaining their occupational class when transitioning from their home country to the labour force in Canada. The above information also highlights the fact that only about one third of respondents previously employed in the Creative Class achieved Creative Class employment within the first four years of their arrival in Canada. This scenario is inversed for individuals in the Working Class, where, based on previous work experience, far more immigrants than anticipated obtained employment in the Working Class in Canada within their first four years in the country. The Service Class, however, sees the highest proportional intake of new immigrants, and overall it would appear that previous members of the Service Class have the greatest success maintaining their major occupational grouping upon immigration, while members of the Creative class have the least success in maintaining their occupational grouping upon arrival in Canada. It seems that these former members of the Creative Class are being redistributed not only to the Service Class, but also to the Working Class.
The final rows of Table 2 provide the most salient information. The “Desirability Disparity,” comparing the expressed desire for work in a particular occupational
4 This column estimates the proportion of workers desired by the Federal Government for each occupational grouping. Appendix B shows how the skilled work experience classes were translated into the occupational groupings used in the study.

9Martin Prosperity Institute | www.martinprosperity.org
The Concentration and Effect of Job Training and Effects on Weekly Wages and Job Satisfaction Using Florida’s (2002) Occupational Classes. By V. Bednar, A. Davidson, and B. Stief
group against “Employment Achieved in Canada.” The results show that almost half of those employed immigrants who have been surveyed do not achieve the type of work they desire, and also that there is a surplus of service employers, where an additional 28 per cent of employed new immigrants surveyed attain employment in the service sector than expressed a preference for doing so. Finally, an additional 19 per cent of respondents become employed in the working class than their initially stated preference. Finally, the “Federal Government” row shows the distribution of occupational categories that immigrants to Canada are selected for under the Canada Skilled Worker category. While this study does not consider only those immigrants who arrive in Canada under the Skilled Worker Category, it nonetheless showcases an interesting trend. The occupational cat-egories in need of skilled individuals noted by the Federal Government are the Creative Class (52.6%) and the Working Class (31.6%), however, the majority of new immigrants to Canada finding employment in the Service Class.
Table 3 shows educational background for new immigrants in each of the occupa-tional classes. Just under 60% of Creative Class workers have University or College credentials, while about half of Service Class (51.1%) and Working Class (46.3%) workers have a University or College education. This apparent mismatch could suggests that there is over-qualification in these two classes, which could be a result of more formerly Creative Class workers assuming a Service/Working Class occupation upon arrival in Canada.
TABLE 3 Education and job experience
% CC SC WC
Survey Proportion 19.95 53.79 26.20
Has post-secondary education (University/College) 58.68 51.13 46.34
Job experience accepted by employer 86.57 51.42 36.03
The decision to engage in a form of job training may be motivated by an employer not recognizing a foreign credential. The LSIC survey questioned whether job expe-rience outside of Canada was reported as being accepted by Canadian employers. For the sake of simplicity, Table 3 considers whether job experience was accepted or not accepted, as there were various other responses to choose from. We then organized any trends in terms of occupational class. Of those employed within the Creative Class, approximately 87% of respondents reported that their job experi-ence was accepted. However, it is important to note that this is 86% of the ~20% of new immigrants employed in the Creative Class. Overall, acceptance of prior job experience by employers is only 54% across all employment categories.

10Martin Prosperity Institute | www.martinprosperity.org
The Concentration and Effect of Job Training and Effects on Weekly Wages and Job Satisfaction Using Florida’s (2002) Occupational Classes. By V. Bednar, A. Davidson, and B. Stief
Training
TABLE 4A Training type by occupational class
% CC SC WC Total
Received job training 5.97 29.22 16.21 51.40
Received education 4.09 7.41 2.84 14.35
Received language training 7.08 22.59 4.57 24.25
When immigrants are employed in Canada, they often capitalize on job training opportunities for career advancement and to gain Canadian creden-tialing. Table 4A shows three different forms of training: job training, education training, and language training (either French or English). We find that Service Class workers employed in Canada access the highest proportion of training opportunities, and that the second-highest concentration of training appears to be in the Working Class. The Creative Class has the lowest proportional uptake of training, which is not surprising given the proportion of respondents who noted that previous work experience (and likely at least some of their educational attain-ment) was accepted within the Canadian labour force. Job training was the most popular form of training, with just over half of all workers across the occupational groupings accessing it. Language training was utilized by 24.25% of respondents, while 14.35% of respondents received education training.
TABLE 4B Training by occupational class and wave
Training Type CC SC WC Total
Job training
Wave 1 17.57 51.81 27.06 96.44%
Wave 2 0.61 0.88 0.50 1.99%
Wave 3 0.62 0.64 0.31 1.57%
Education
Wave 1 16.44 45.42 26.41 88.27%
Wave 2 1.25 4.17 0.82 6.24%
Wave 3 1.12 3.73 0.63 5.48%
Language training
Wave 1 18.13 44.39 21.93 84.45%
Wave 2 1.47 7.57 3.78 12.82%
Wave 3 0.34 1.84 0.54 2.72%

11Martin Prosperity Institute | www.martinprosperity.org
The Concentration and Effect of Job Training and Effects on Weekly Wages and Job Satisfaction Using Florida’s (2002) Occupational Classes. By V. Bednar, A. Davidson, and B. Stief
The biggest insight from the above table is that the majority of training (on behalf of all occupational classes) is taken up in Wave 1. This finding is important – not only for the purposes of the study but also as a “take away.” Because most educa-tion/training occurs early on, it also allows us to reliably use our model to look at the effect of training on wages and job satisfaction over time. Furthermore, it sug-gests that training is available and accessible fairly quickly. Our descriptives show that Service Class workers utilize the majority of training, and we hypothesize that this could be motivated by the potential to transition (back) to the Creative Class.
WagesOur sample was limited from the original survey to ~10,000 employed respon-dents, and that sub-set is the working sample for wage information. When we examined weekly wage, there were ~200 cases of extreme outliers. That number is plausible, and they were removed from the wage variable dataset and excluded from income analysis. Once normalized, the highest weekly wage we are capturing is around $1,500/week. The remaining cases positively skew our sample, which is not appropriate for the purpose of our analysis. Further, logically, we are not interested in the effects of training on wages for individuals who report wages significantly higher than the Canadian national average. Weekly wage also becomes problematic in considering inflationary pressures on wages over time, thus, in order to mitigate these effects, time is included in all interaction terms during the modeling stage.5
Below, Table 5 shows the mean weekly wages and hourly wages by occupational grouping. It can be observed that Creative Class workers average the highest wages, while Service Class employees sit at the low end of the wage scale.
TABLE 5 Mean weekly and hourly wages by occupational class
CC SC WC
Mean weekly wage ($) 638.31 289.75 398.43
Mean hourly wage ($) 17.61 9.53 10.04
Job Satisfaction
TABLE 6 Reported job satisfaction (proportion) by occupational class
Job Satisfaction CC SC WC Total
Yes 89.78 81.86 75.33 81.89
No 10.25 18.13 24.66 18.11
5 Wages were not chained to inflation in the regression analysis.

12Martin Prosperity Institute | www.martinprosperity.org
The Concentration and Effect of Job Training and Effects on Weekly Wages and Job Satisfaction Using Florida’s (2002) Occupational Classes. By V. Bednar, A. Davidson, and B. Stief
Both the Creative and Service classes report high levels of job satisfaction. We will comment further on these results pending the analysis of the modeling.
Modeling ResultsSquare root of weekly wage modelAs described in the methodology section, the first model we created explored the effects of various independent variables such as gender, minority status, education, training and language proficiency on wages, across occupational groupings. The results are shown in Table 7, and support much of what was found in our data exploration stage.6
It is clear that the starting wages for males are consistently higher than the starting wages for females (with a difference of approximately $177 per week higher in the Creative Class, $84 higher in the Working Class, and $56 more in the Service Class), and that a higher level of achieved education will consistently result in a higher starting wage. Being a member of a visible minority has a negative impact on starting wages, most significantly in the Creative and Working classes. In the Creative Class, being a minority decreases starting income on aver-age by $68 per week, and the Working Class sees it drop approximately by $55. In the Service Class, incomes drop by about $27 per week for visible minorities.
The most substantial impact of prior education can be found for those working in the Creative Class. As the number of degrees achieved (as a metric of education outside of Canada) increases, an individual’s starting wages by a factor of (on average) $75 per week in increased income, yet the completion of professional credentials is not statistically significant. For the Working Class, the impact of professional credentials was again insignificant, but the achievement of degrees did impact starting wages, by an increase of approximately $15 per degree. Only in the Service Class were both degree count and professional credit count significant, increasing starting wages by $24 and $20 per week, respectively. While the lack of impact of professional degrees on wages in the Creative Class is surprising, it potentially points to a disconnect in the recognition of foreign-trained profession-als by the Canadian labour market. It is apparent that the emphasis on various forms of education differs depending on the type of work being performed, but that regardless of the interesting result for professional credits, it appears that education is most highly valued in Creative Class work in terms of producing labour market returns.
6 Note that the coefficients cannot be interpreted directly as they have been transformed by a square-root function — the analysis will include absolute values calculated from the coefficients noted in Table 8.

13Martin Prosperity Institute | www.martinprosperity.org
The Concentration and Effect of Job Training and Effects on Weekly Wages and Job Satisfaction Using Florida’s (2002) Occupational Classes. By V. Bednar, A. Davidson, and B. Stief
There are also some interesting trends with respect to those individuals who are deciding to take up training (either in the form of education, job training, or lan-guage training). Not unsurprisingly, immigrants who seek and take up a form of training have lower starting wages than those who do not seek training. For lan-guage training, the negative effect on starting wages can be observed throughout all three classes: on average $84 lower weekly wage in the Creative Class, $62 lower in the Service Class and $20 lower in the Working Class. For those who decide to take up education within Canada, there are again significant impacts across all three classes: on average $169, $87 and $92 lower for Creative Class, Service Class and Working Class, respectively. Interestingly, the impact of job training is only observed within the Service Class, where starting weekly wages are ~$27 lower per week for those who attend this form of training. This may be due to the nature of Service work in comparison to Creative and Working class employment, but given the heterogeneity of labour within each class, it would be difficult to specify the cause.
In general, uptake of education in Canada has the greatest impact on wages over time, across all three classes. It significantly impacts the rate of change of income (seen below). As most of this education is taken up within the first wave of the study, the impact on income is indicative of the positive returns to Canadian education within the Canadian labour market. It is interesting to note that job training has no significant impact on the rate of change of income, and that language training only significantly impacts the incomes of immigrants employed in the Service Class. This may not be surprising, however, given the need for commu-nication that is often associated with Service Class work. Language training (and subsequently proficiency) would impact job effectiveness and likelihood of job acceleration.
TABLE 7 Estimated effects of various forms of training on the Square Root of Weekly Wage over time and across job class (XT Mixed)7
SQRT Wage Creative Class Service Class Working Class
Effects B SE B SE B SE
InTERCEPTED EFFECTS
Male 3.599*** 0.406 1.696*** 0.182 2.157*** 0.213
Minority –1.542*** 0.418 –0.897*** 0.214 –1.544*** 0.261
Age 0.020 0.221 0.145 0.090 0.055 0.090
Professional Credentials Count –0.313 0.399 0.649*** 0.174 0.045 0.192
Degree Count 1.590*** 0.460 0.750*** 0.198 0.412* 0.227
7 For visualization of this data, see Appendix C.

14Martin Prosperity Institute | www.martinprosperity.org
The Concentration and Effect of Job Training and Effects on Weekly Wages and Job Satisfaction Using Florida’s (2002) Occupational Classes. By V. Bednar, A. Davidson, and B. Stief
SQRT Wage Creative Class Service Class Working Class
Language Training –1.934*** 0.428 –2.092*** 0.237 –0.529** 0.229
Job Training –0.352 0.619 -0.874** 0.438 0.177 0.510
Education as Training –4.081*** 0.616 –3.073*** 0.317 –2.668*** 0.474
Language Proficiency –0.582** 0.245 –0.436*** 0.125 –0.129 0.114
Time (Wave) 0.500*** 0.161 0.153* 0.091 0.392*** 0.076
_cons 22.782 1.165 15.761 0.502 18.618 0.548
SLOPE EFFECTS
Language Training ∙ Time 0.237 0.205 0.289** 0.116 0.072 0.116
Job Training ∙ Time –0.184 0.190 0.240 0.170 0.251 0.181
Education as Training ∙ Time 0.308* 0.178 0.282** 0.110 0.465*** 0.179
Language Proficiency ∙ Time 0.141 0.090 0.109** 0.053 0.088* 0.050
Age = 10 year groupings* Significant at the 90% level
** Significant at the 95% level*** Significant at the 99% level
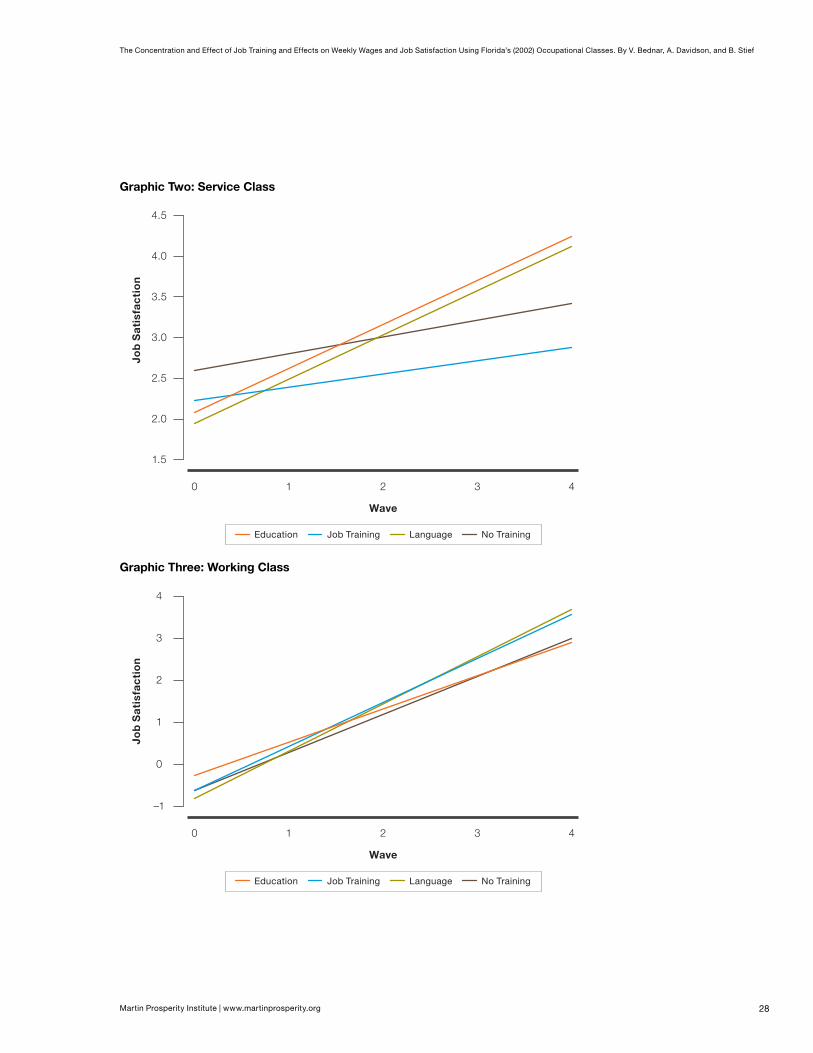
Job satisfaction modelThe second model focused on the self-reported job satisfaction of longitudinal respondents based on many of the same independent variables as in the previous model, with the addition of square root of weekly wage. The results are shown in Table 8, and provide an interesting look at the experience of new immigrants to Canada and the factors that affect this subjective — but important — measure of job success.
Workers in all three occupational groups appear to report greater job satisfaction as their wages increase – for a one-unit increase in the square root of weekly wage, the probability of reporting “satisfied” or “very satisfied” increases by 12.6% in the Creative Class, 8% in the Working Class, and 12.8% in the Service Class. The positive effect of wages, however, is not maintained over time, as a decreasing correlation is noted for both the Working and the Creative Classes (it is not significant in the Service Class).
Unsurprisingly, the results also show that for immigrants with higher educa-tion attainment — noted by number of degrees attained — there is a significantly decreased probability of reporting job satisfaction if their work is in the service class or the working class. With an increase of one in the number of degrees attained, the probability of reporting job satisfaction decreases by ~47% and by ~36% in the Service Class and the Working Class, respectively. It would appear that high levels of educational attainment are traditionally most valued in Creative Class work, as noted by high levels of job satisfaction reported in this group.

15Martin Prosperity Institute | www.martinprosperity.org
The Concentration and Effect of Job Training and Effects on Weekly Wages and Job Satisfaction Using Florida’s (2002) Occupational Classes. By V. Bednar, A. Davidson, and B. Stief
The effects of training over time have the most interesting interaction with job satisfaction levels. With the exception of one language training interaction, the effect of training uptake is negative on job satisfaction (see below). This is an interesting result, as it may suggest that while training (education/language/job) does not result in the kind of job acceleration or labour force mobility that results in higher levels of job satisfaction.
TABLE 8 Estimated effects of various forms of training on job satisfaction over time and across job class (XT Logit)8
SQRT Wage Creative Class Service Class Working Class
Effects B SE B SE B SE
InTERCEPTED EFFECTS
Sqrt Wage 0.126*** 0.025 0.080*** 0.017 0.128*** 0.025
Male 0.130 0.232 –0.532*** 0.130 0.037 0.147
Minority –0.453* 0.250 –0.373** 0.156 –0.187 0.178
Age 0.076 0.154 –0.173*** 0.065 –0.101 0.064
Professional Credentials Count –0.227 0.216 –0.150 0.119 –0.280** 0.128
Degree Count –0.098 0.247 –0.470*** 0.136 –0.359** 0.151
Language Training 0.605 0.410 –0.139 0.194 –0.564*** 0.193
Job Training –0.970** 0.464 0.145 0.338 –0.372 0.387
Education as Training 0.899* 0.528 0.516* 0.286 –0.379 0.430
Time (Wave) 1.019*** 0.329 0.543*** 0.166 0.791*** 0.247
SLOPE EFFECTS
Language Training ∙ Time –0.505* 0.238 0.001 0.123 0.340** 0.141
Job Training ∙ Time 0.282 0.239 –0.380** 0.168 0.259 0.224
Education as Training ∙ Time –0.385** 0.219 –0.338*** 0.126 0.118 0.206
Sqrt Wage ∙ Time –0.035*** 0.012 –0.008 0.009 –0.029** 0.012
* Significant at the 90% level** Significant at the 95% level
*** Significant at the 99% level
8 For visualization of this data, see Appendix D.

16Martin Prosperity Institute | www.martinprosperity.org
The Concentration and Effect of Job Training and Effects on Weekly Wages and Job Satisfaction Using Florida’s (2002) Occupational Classes. By V. Bednar, A. Davidson, and B. Stief
General Trends and ConclusionThis study initially concludes that training opportunities are not equally dist-ributed across the three occupational classes of the labour force. As described in Table 5A, the Service Class accesses the highest proportion of training oppor-tunities, the Working Class has the second-highest concentration of training, while the Creative Class is third. In addition to these trends, our analysis finds that job training is the most utilized form of training, while language training is moderately accessed and education training is the least common form of training.
Across all labour classes, employed immigrants who seek out any one of the forms of training have lower starting wages than those who do not. The impact of train-ing over time varies between training type and occupational class. The impact of language training over time is only significant in the Service Class. Job training, which has the greatest uptake at over 50%, has no appreciable effects on wages, while Education (returning to college, apprenticeship or university programs) sees the greatest returns and significant rates of change for wages in all classes. However, only 14% of employed immigrants reported receiving educational train-ing during the survey period. Given the low percentage uptake of education, but its significant returns to wage growth, it can be inferred that the accessibility and quality of these education-related training opportunities to new immigrants is a vital policy concern in the maintenance of a vibrant, multi-cultural, and produc-tive Canadian labour market.
While engagement with training appears to decrease job satisfaction, this may be due to a number of factors such as dissatisfaction with the results of receiving training. Immigrants who receive training in hope of greater labour market achievements may be dissatisfied if/when labour market mobility or job acceleration is not realized even after the attainment of Canadian educa-tion. Moreover, reported levels of job satisfaction begin at a high level (75–90% reported satisfaction by occupational class) and there is minimal opportunity to improve on this. Other factors may impact this interaction. Said training could be mandatory in nature, and workers may be resentful or neutral towards such training. In addition, minority status and language proficiency may continue to disadvantage new immigrants to Canada in the labour force despite educational or training achievements, impacting job satisfaction and labour mobility.
Shortcomings and further analysisOne shortcoming of this study is that we chose not to delve into inter-occupational class mobility. For instance, we do not analyze the proportion of workers previously employed in the Creative Class in their home country who assume employment in either the Service or Working Classes upon arrival (though we do highlight a

17Martin Prosperity Institute | www.martinprosperity.org
The Concentration and Effect of Job Training and Effects on Weekly Wages and Job Satisfaction Using Florida’s (2002) Occupational Classes. By V. Bednar, A. Davidson, and B. Stief
discrepancy between prior job class and job class in Canada in Table 2). Capturing inter-class mobility would allow us to comment on where Creative Class workers are misallocated in the labour force upon immigration.
A second limitation is that only those who were employed in at least one of the three Waves were considered. This excludes longitudinal respondents who were unemployed across all three waves, regardless of whether they access training. For this reason, we cannot account for the impact of training on those individuals, despite the possibility that they face some of the greatest barriers to employment and may actively seek out training and/or education to leverage their skills within the Canadian job market.
Thirdly, training is loosely defined within the LSIC. This prevents us from properly understanding the form, quality and duration of training opportunities; for instance, whether job training is employer-mandated and thus represents a baseline requirement of employment rather than the development of a specific skill that could increase job function and employee status within a firm.
Policy implicationsThis study addresses economic integration and wellbeing of new immigrants to Canada across unique occupational groupings. Though not directly related to the initial research questions, our results show that a considerable wage differ-ential exists between male and female workers across all occupational groupings and that members of a visible minority group consistently have lower wages and reported job satisfaction than their non-minority peers. While our analysis is unable to offer reasons why this differential exists, the substantive nature of this differential warrants further research and deserves the attention of policy makers.
In order to remain economically competitive within an efficient labour market, Canadian policy makers should also be looking more to the effects of training on the socioeconomic status and job satisfaction of new immigrants. Our analysis has already emphasized that the skilled worker targets set by the Federal Govern-ment (Appendix B) are not being well satisfied by newcomers to the labour force (Table 2). This is problematic in and of itself for the nation’s long-term competi-tiveness. This mismatch is likely to be exacerbated in the absence of the LSIC in the future (as the Federal government has discontinued the survey).
Training opportunities are critical in addressing any disparities in skills so as to integrate the human capital of new immigrants into the economy. As such, it is imperative to appreciate what forms of training are the most effective for dif-ferent occupational groupings in order to target and implement effective training strategies. For example, while Job Training is the most accessible of the three types of training, it elicits no benefits in terms of job satisfaction or wage effects. Conversely, the uptake of educational opportunities within Canada sees positive returns to income, yet this type is the least utilized. This may be due to a number

18Martin Prosperity Institute | www.martinprosperity.org
The Concentration and Effect of Job Training and Effects on Weekly Wages and Job Satisfaction Using Florida’s (2002) Occupational Classes. By V. Bednar, A. Davidson, and B. Stief
of factors including the opportunity cost to returning to school. This relationship, however, also points to a valuing of Canadian experience and education over other international experience and education despite the fact that a large proportion of these immigrants gain entrance into Canada based on these metrics. Policies to promote a more flexible and responsive labour market to these indicators should be explored.
ScaleabilityThe composition of employed new immigrants to Canada captured in the LSIC is comparable to the broader Canadian labour force. In the province of Ontario, the labour force (as of 2006) expressed the following distribution: Ontario (pro-vincially) - 45.9% Service Class, 22.1% Working Class, 30.3 Creative Class, 1.7% FFF and in Canada (nationally) - 45.5% Service Class, 28.4% Creative Class, 21.6% Working Class, and 2.9% in FFF (Martin Prosperity Institute, 2010). Thus the composition of these occupational groups in Canada is representative of the Canadian labour force (not an anomaly). This fact suggests that our immi-gration system is “losing” human capital through these occupational mismatches and that we are compromising economic competitiveness in the process.

19Martin Prosperity Institute | www.martinprosperity.org
The Concentration and Effect of Job Training and Effects on Weekly Wages and Job Satisfaction Using Florida’s (2002) Occupational Classes. By V. Bednar, A. Davidson, and B. Stief
Works ConsultedAbadie, Alberto, and et.al. 2001. Implementing matching estimators for average
treatment effects in STATA. The Stata Journal 1, (1): 1-18.
Adra, Hicham. 2009. We’re working to integrate skilled immigrants. The Ottawa Citizen 2009.
Alboim, Naomi. 2009. Adjusting the balance: Fixing Canada’s economic immigration policies Toronto, Ontario: The Maytree Foundation.
Anonymous. 2009. Labour mobility across Canada and across the Atlantic CIC News, April 2009, 2009.
Ashenfelter, Orley. 1978. Estimating the effect of training programs on earnings. The Review of Economics and Statistics 60, (1): 47-57.
Ashenfelter, Orley, and David Card. 1985. Using the longitudinal structure of earnings to estimate the effect of training programs. The Review of Economics and Statistics 67, (4): 648-60.
Brennan, Richard. 2010. Ottawa shortchanging immigration programs: Province The Toronto Star, April 7, 2010, 2010.
———. 2010. Ottawa shortchanging immigration programs: Province The Toronto Star, April 7, 2010, 2010.
Drummond, Don. 2010. Improving Canada’s productivity.
———. 2007. An alternative policy script to boost Canadian productivity growth In A Canadian priorities agenda: Policy choices to improve economic and social well being. eds. Jeremy Leonard, Christopher Ragan and France St-Hilaire, 389-396. Montreal, Quebec: The Institute for Research on Public Policy.
Florida, Richard. 2006. The flight of the creative class. United States of America: Basic Books.
———. 2002. The rise of the creative class: And how it’s transforming work, lei-sure, and everyday life. United States of America: Basic Books.
Gaskell, Jane. 2007. Education and human capital: Reconciling policy imperatives and policy design In A Canadian priorities agenda: Policy choices to improve economic and social well being. eds. Jeremy Leonard, Christopher Ragan and France St-Hilaire, 67-76. Montreal, Quebec: The Institute for Research on Public Policy.

20Martin Prosperity Institute | www.martinprosperity.org
The Concentration and Effect of Job Training and Effects on Weekly Wages and Job Satisfaction Using Florida’s (2002) Occupational Classes. By V. Bednar, A. Davidson, and B. Stief
Gelinas, Ben. 2009. Canada benefits from foreign-trained workers National Post, December 7, 2009, 2009.
Grady, Patrick. 2009. The impact of immigration on Canada’s labour market Toronto, Ontario: The Fraser Institute.
Hart, Michael. 2007. Canadian engagement in the global economy In A Canadian priorities agenda: Policy choices to improve economic and social well being. eds. Jeremy Leonard, Christopher Ragan and France St-Hilaire, 405. Montreal, Quebec: The Institute for Research on Public Policy.
Hu, Wei-Yin. 2000. Immigrant earnings assimilation: Estimates from longitudinal data. The American Economic Review 90, (2): 368-72.
Industry Canada. 2005. Aging population and immigration in Canada; economic, labour market and regional implications. Ottawa, ON: Government of Canada.
Keung, Nicholas. 2010. Help immigrants update skills, province told The Toronto Star, March 31, 2010, 2010.
———. 2010. Job dreams dashed for skilled immigrants; study shows few believe they can meet their career goals in Canada. The Toronto Star, January 29, 2010, 2010.
Klie, Shannon. 2009. Immigration system not meeting labour market needs. Canadian Human Rights Reporter 22, (21).
Kukushkin, Vadim. 2009. Immigrant-friendly communities: Making immigra-tion work for employers and other stakeholders. Canada: The Conference Board of Canada.
Kunz, Jean Lock, and Stuart Sykes. 2007. From mosaic to harmony: Multicul-tural Canada in the 21st century Ottawa, Ontario: Government of Canada Policy Research Initiative.
LaLonde, Robert. 1986. Evaluating the econometric evaluations of training programs with experimental data. The American Economic Review 76, (4): 604-20.
LaLonde, Robert, and Robert Topel. 1991. Immigrants in the American labour market: Quality, assimilation, and distributional effects. The American Economic Review: 297-302.

21Martin Prosperity Institute | www.martinprosperity.org
The Concentration and Effect of Job Training and Effects on Weekly Wages and Job Satisfaction Using Florida’s (2002) Occupational Classes. By V. Bednar, A. Davidson, and B. Stief
Reguly, Eric. 2010. The fear and farce of climate-change science. Globe & Mail, Sunday, February 7, 2010, 2010.
Sharpe, Andrew. 2007. Three policies to increase productivity growth in Canada. In A Canadian priorities agenda: Policy choices to improve economic and social well being. eds. Jeremy Leonard, Christopher Ragan and France St-Hilaire, 353-388. Montreal, Quebec: The Institute for Research on Public Policy.
Statistics Canada. 2007. Canadian social trends: Immigrants’ perspectives on their first four years.
———. 2003. LSIC: A regional perspective of the labour market experiences.
22Martin Prosperity Institute | www.martinprosperity.org
The Concentration and Effect of Job Training and Effects on Weekly Wages and Job Satisfaction Using Florida’s (2002) Occupational Classes. By V. Bednar, A. Davidson, and B. Stief
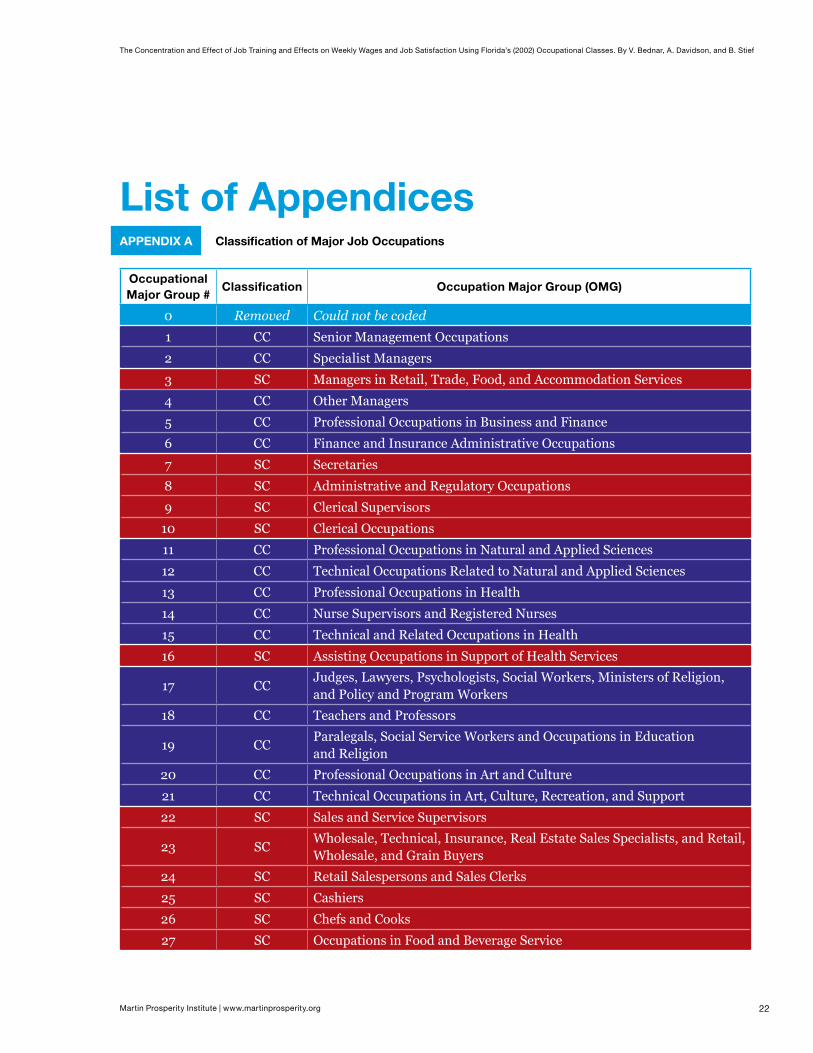
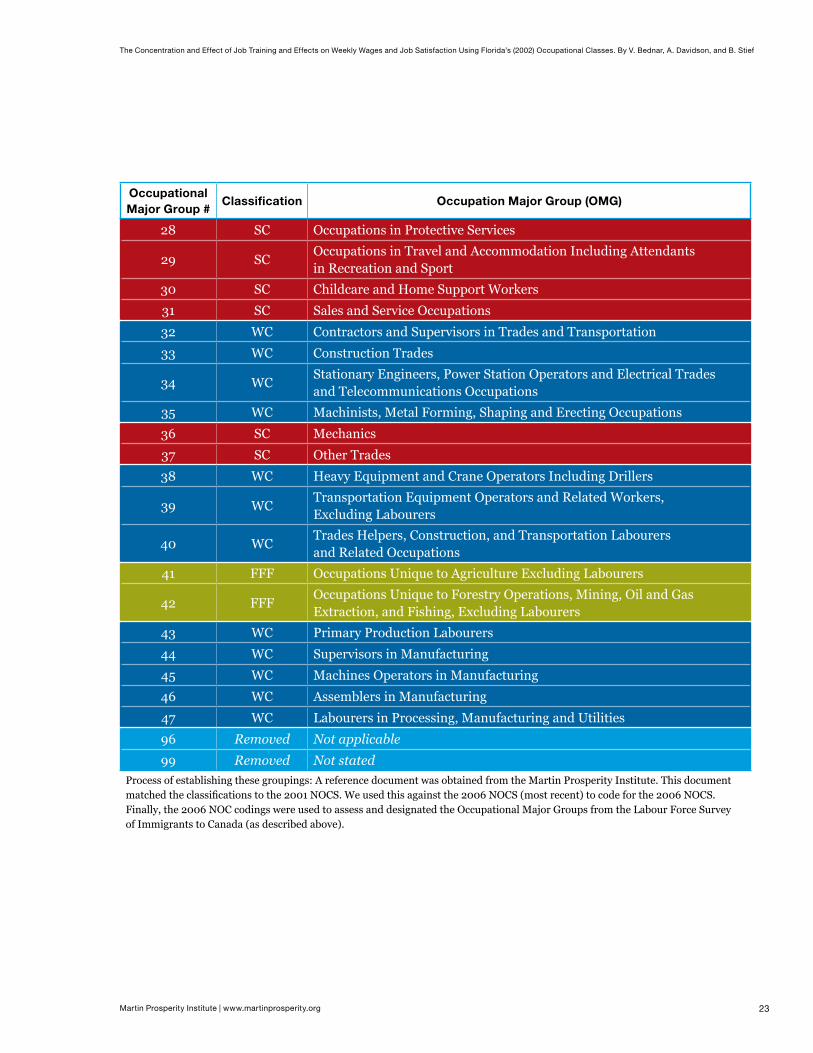
List of AppendicesAPPEnDIX A Classification of Major Job Occupations
Occupational Major Group #
Classification Occupation Major Group (OMG)
0 Removed Could not be coded
1 CC Senior Management Occupations
2 CC Specialist Managers
3 SC Managers in Retail, Trade, Food, and Accommodation Services
4 CC Other Managers
5 CC Professional Occupations in Business and Finance
6 CC Finance and Insurance Administrative Occupations
7 SC Secretaries
8 SC Administrative and Regulatory Occupations
9 SC Clerical Supervisors
10 SC Clerical Occupations
11 CC Professional Occupations in Natural and Applied Sciences
12 CC Technical Occupations Related to Natural and Applied Sciences
13 CC Professional Occupations in Health
14 CC Nurse Supervisors and Registered Nurses
15 CC Technical and Related Occupations in Health
16 SC Assisting Occupations in Support of Health Services
17 CCJudges, Lawyers, Psychologists, Social Workers, Ministers of Religion, and Policy and Program Workers
18 CC Teachers and Professors
19 CCParalegals, Social Service Workers and Occupations in Education and Religion
20 CC Professional Occupations in Art and Culture
21 CC Technical Occupations in Art, Culture, Recreation, and Support
22 SC Sales and Service Supervisors
23 SCWholesale, Technical, Insurance, Real Estate Sales Specialists, and Retail, Wholesale, and Grain Buyers
24 SC Retail Salespersons and Sales Clerks
25 SC Cashiers
26 SC Chefs and Cooks
27 SC Occupations in Food and Beverage Service
23Martin Prosperity Institute | www.martinprosperity.org
The Concentration and Effect of Job Training and Effects on Weekly Wages and Job Satisfaction Using Florida’s (2002) Occupational Classes. By V. Bednar, A. Davidson, and B. Stief
Occupational Major Group #
Classification Occupation Major Group (OMG)
28 SC Occupations in Protective Services
29 SCOccupations in Travel and Accommodation Including Attendants in Recreation and Sport
30 SC Childcare and Home Support Workers
31 SC Sales and Service Occupations
32 WC Contractors and Supervisors in Trades and Transportation
33 WC Construction Trades
34 WCStationary Engineers, Power Station Operators and Electrical Trades and Telecommunications Occupations
35 WC Machinists, Metal Forming, Shaping and Erecting Occupations
36 SC Mechanics
37 SC Other Trades
38 WC Heavy Equipment and Crane Operators Including Drillers
39 WCTransportation Equipment Operators and Related Workers, Excluding Labourers
40 WCTrades Helpers, Construction, and Transportation Labourers and Related Occupations
41 FFF Occupations Unique to Agriculture Excluding Labourers
42 FFFOccupations Unique to Forestry Operations, Mining, Oil and Gas Extraction, and Fishing, Excluding Labourers
43 WC Primary Production Labourers
44 WC Supervisors in Manufacturing
45 WC Machines Operators in Manufacturing
46 WC Assemblers in Manufacturing
47 WC Labourers in Processing, Manufacturing and Utilities
96 Removed Not applicable
99 Removed Not statedProcess of establishing these groupings: A reference document was obtained from the Martin Prosperity Institute. This document matched the classifications to the 2001 NOCS. We used this against the 2006 NOCS (most recent) to code for the 2006 NOCS. Finally, the 2006 NOC codings were used to assess and designated the Occupational Major Groups from the Labour Force Survey of Immigrants to Canada (as described above).

24Martin Prosperity Institute | www.martinprosperity.org
The Concentration and Effect of Job Training and Effects on Weekly Wages and Job Satisfaction Using Florida’s (2002) Occupational Classes. By V. Bednar, A. Davidson, and B. Stief
APPEnDIX B Skilled work experience categories (designated by the federal government) (*38) *Referenced using the previously classified NOCS coding
nOC CategoryClass
classification
0111 Financial Managers CC
0213 Computer and Information Systems Managers CC
0311 Managers in Health Care CC
0631 Restaurant and Food Service Managers SC
0632 Accommodation and Service Managers SC
0711 Construction Managers CC
1111 Financial Auditors and Accountants CC
2113 Geologists, Geochemists and Geophysicists CC
2143 Mining Engineers CC
2144 Geological Engineers CC
2145 Petroleum Engineers CC
3111 Specialist Physicians CC
3112 General Practitioners and Family Physicians CC
3141 Audiologists and Speech Language Pathologists CC
3142 Physiotherapists CC
3143 Occupational Therapists CC
3151 Head Nurses and Supervisors CC
3152 Registered Nurses CC
3215 Medical Radiation Technologists CC
3233 Licensed Practical Nurses CC
4121 University Professors CC
4131 College and Other Vocational Instructors CC
6241 Chefs SC
6242 Cooks SC
7213 Contractors and Supervisors, Pipefitting Trades WC
7215 Contractors and Supervisors, Carpentry Trades WC
7217 Contractors and Supervisors, Heavy Construction Equipment Crews WC
7241 Electricians (Except Industrial and Power System) WC
7242 Industrial Electricians WC
7251 Plumbers WC
7252 Steamfitters, Pipefitters and Sprinkler System Installers WC
7265 Welders and Related Machine Operators WC

25Martin Prosperity Institute | www.martinprosperity.org
The Concentration and Effect of Job Training and Effects on Weekly Wages and Job Satisfaction Using Florida’s (2002) Occupational Classes. By V. Bednar, A. Davidson, and B. Stief
nOC CategoryClass
classification
7312 Heavy-Duty Equipment Managers WC
7371 Crane Operators WC
7372 Drillers and Blasters – Surface Mining, Quarrying, and Construction WC
8221 Supervisors, Mining and Quarrying FFF
8222 Supervisors, Oil and Gas Drilling Service FFF
9212 Supervisors, Petroleum, Gas and Chemical Processing and Utilities WCThe Federal Government’s Immigration website states that, “in order for your application to be eligible for processing, you must…be a skilled worker who has had at least one year of experience* in one or more of the following occupations within the last ten years: *Experience is defined as a continuous full-time equivalent part time paid work experience.”
a. Creative Class: 20/38 = 52.6% b. Service Class: 4/38 = 10.5%c. Working Class: 12/38 = 31.6%d. Fishing, Farming, and Forestry: 2/38 = 5.3%

26Martin Prosperity Institute | www.martinprosperity.org
The Concentration and Effect of Job Training and Effects on Weekly Wages and Job Satisfaction Using Florida’s (2002) Occupational Classes. By V. Bednar, A. Davidson, and B. Stief
SQ
R W
eek
ly W
ag
e
18
20
22
24
26
Wave
0 1 2 3 4
No TrainingEducation LanguageJob Training
APPEnDIX C Model One — XT mixed square-root weekly wage results by occupational grouping
Graph One: Creative Class
Graph Two: Service Class
SQ
R W
eek
ly W
ag
e
13
12
14
15
16
17
Wave
0 1 2 3 4
No TrainingEducation LanguageJob Training

27Martin Prosperity Institute | www.martinprosperity.org
The Concentration and Effect of Job Training and Effects on Weekly Wages and Job Satisfaction Using Florida’s (2002) Occupational Classes. By V. Bednar, A. Davidson, and B. Stief
14
SQ
R W
eek
ly W
ag
e
16
18
20
22
Wave
0 1 2 3 4
No TrainingEducation LanguageJob Training
Graphic Three: Working Class
APPEnDIX D Model Two — XT logit job satisfaction results by occupational grouping
Graph One: Creative Class
–1
Job
Sa
tisf
acti
on
0
1
2
3
4
Wave
0 1 2 3 4
No TrainingEducation LanguageJob Training
28Martin Prosperity Institute | www.martinprosperity.org
The Concentration and Effect of Job Training and Effects on Weekly Wages and Job Satisfaction Using Florida’s (2002) Occupational Classes. By V. Bednar, A. Davidson, and B. Stief
1.5
2.0
2.5
3.0
3.5
4.0
4.5
Job
Sa
tisf
acti
on
Wave
0 1 2 3 4
No TrainingEducation LanguageJob Training
Graphic Two: Service Class
–1
0
1
2
3
4
Job
Sa
tisf
acti
on
Wave
0 1 2 3 4
No TrainingEducation LanguageJob Training
Graphic Three: Working Class