Embed Size (px)
Citation preview
THE CONCORD COALITION www.concordcoalition.org
The Federal Budget Now and In the Futurepresented by
Joshua Gordon, Policy Director
$0
$500
$1,000
$1,500
$2,000
$2,500
$3,000
$3,500
$4,000
$771
$952$440
$291$629
$216 $584
223
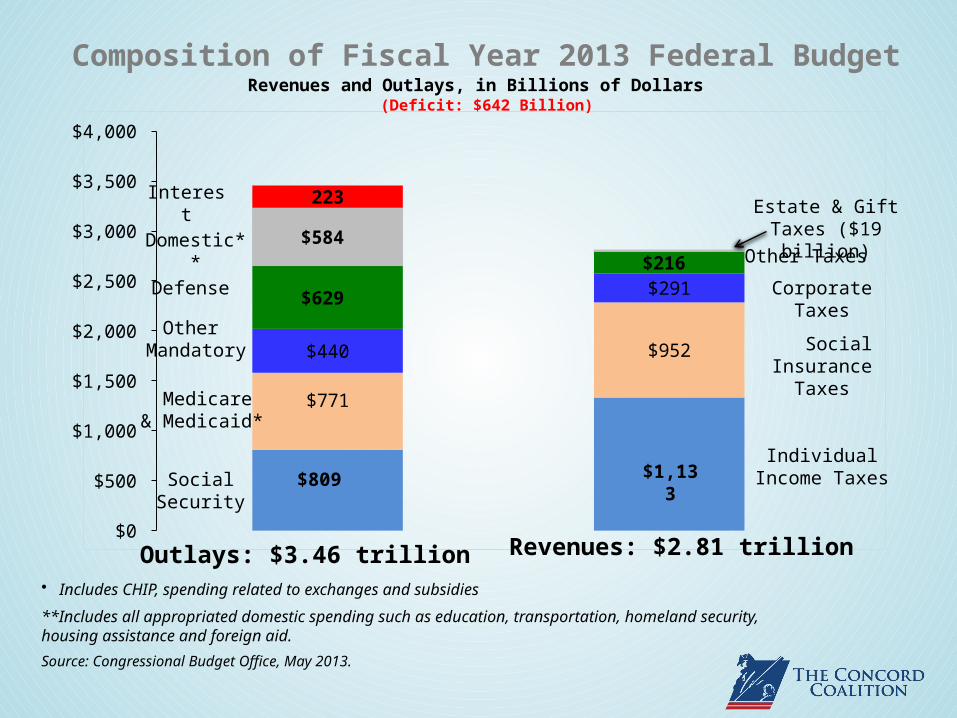
Composition of Fiscal Year 2013 Federal BudgetRevenues and Outlays, in Billions of Dollars
(Deficit: $642 Billion)
• Includes CHIP, spending related to exchanges and subsidies
**Includes all appropriated domestic spending such as education, transportation, homeland security, housing assistance and foreign aid.
Source: Congressional Budget Office, May 2013.
Outlays: $3.46 trillion Revenues: $2.81 trillion
Interest
Domestic**
SocialSecurity
Medicare & Medicaid*
Other Mandatory
Defense
Estate & Gift Taxes ($19 billion)
IndividualIncome Taxes
Social InsuranceTaxes
Corporate Taxes
Other Taxes
$809 $1,133
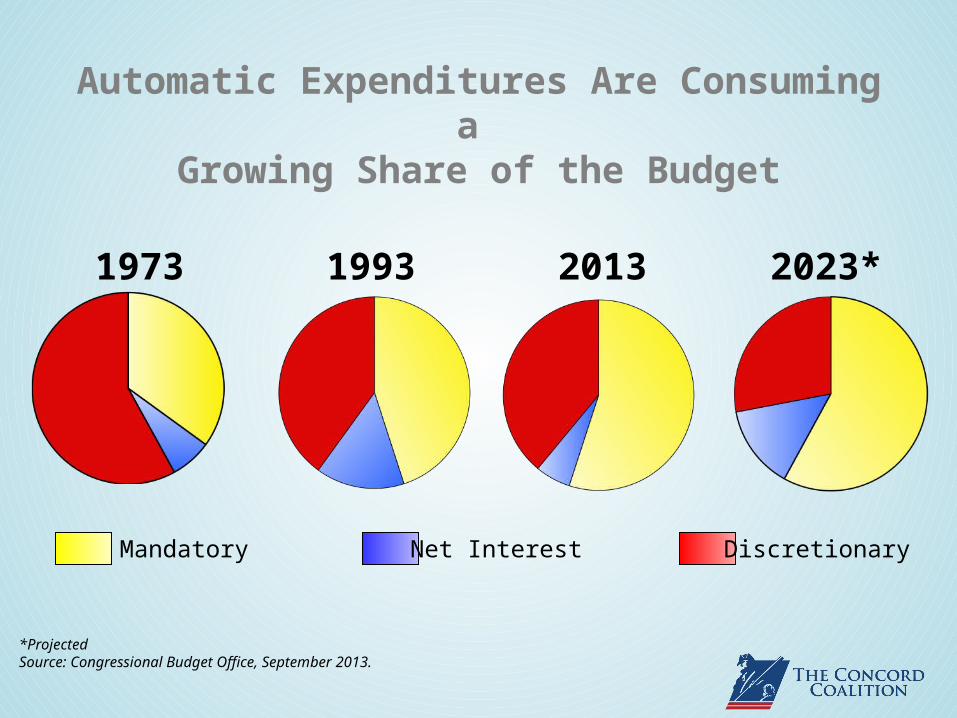
53%
40%
7%
38%
14%
49% 35%
14%
59%
Mandatory DiscretionaryNet Interest
*ProjectedSource: Congressional Budget Office, September 2013.
Automatic Expenditures Are Consuming a Growing Share of the Budget
1973 1993 2013
24%62%
6%
2023*
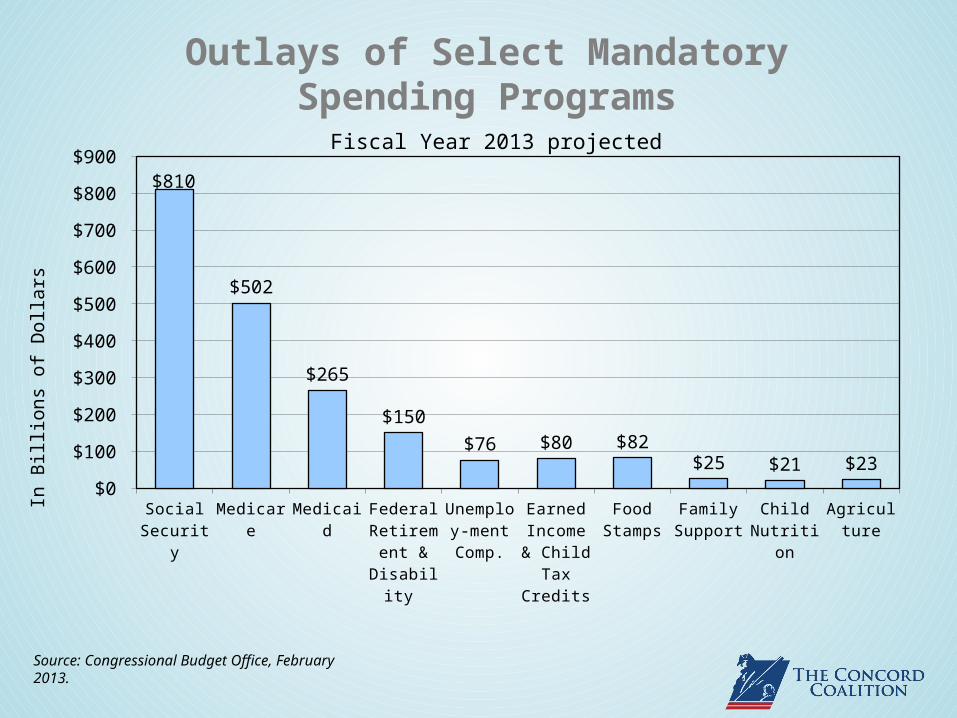
Outlays of Select Mandatory Spending Programs Fiscal Year 2013 projected
Social Security
Medicare Medicaid Federal Re-tirement & Disability
Unemploy-ment
Comp.
Earned Income & Child Tax Credits
Food Stamps
Family Support
Child Nutri-tion
Agriculture$0
$100
$200
$300
$400
$500
$600
$700
$800
$900
$810
$502
$265
$150
$76 $80 $82$25 $21 $23
In B
illio
ns o
f Dol
lars
Source: Congressional Budget Office, February 2013.
19651967
19691971
19731975
19771979
19811983
19851987
19891991
19931995
19971999
20012003
20052007
20092011
20132015
20172019
20212023
0
1
2
3
4
5
6
7
8
9
10
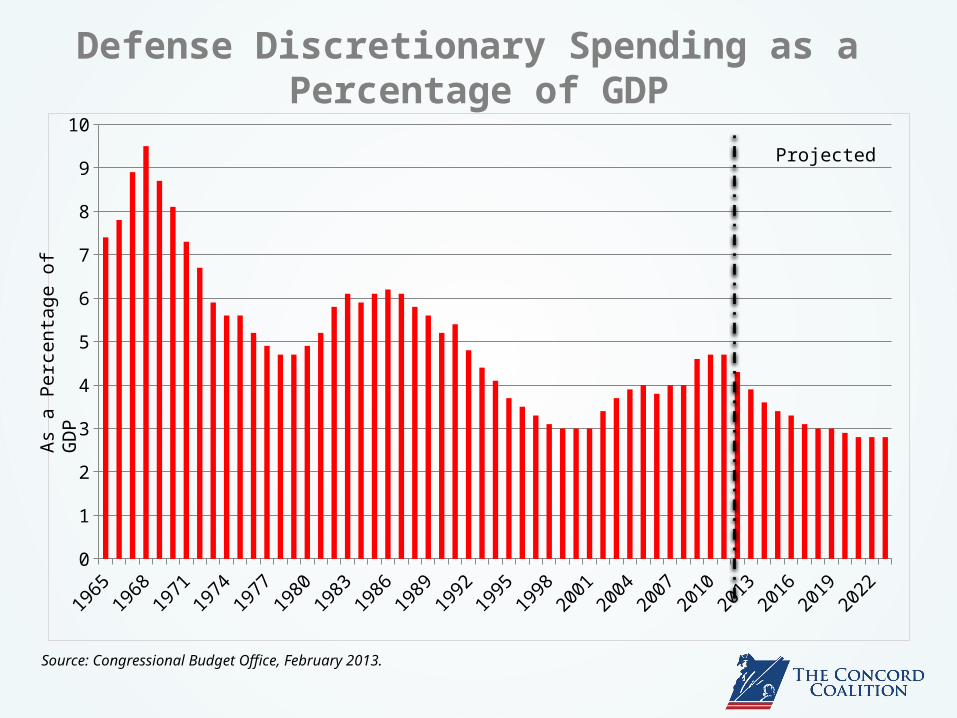
Defense Discretionary Spending as a Percentage of GDP
Source: Congressional Budget Office, February 2013.
As a
Per
cent
age
of G
DP
Projected
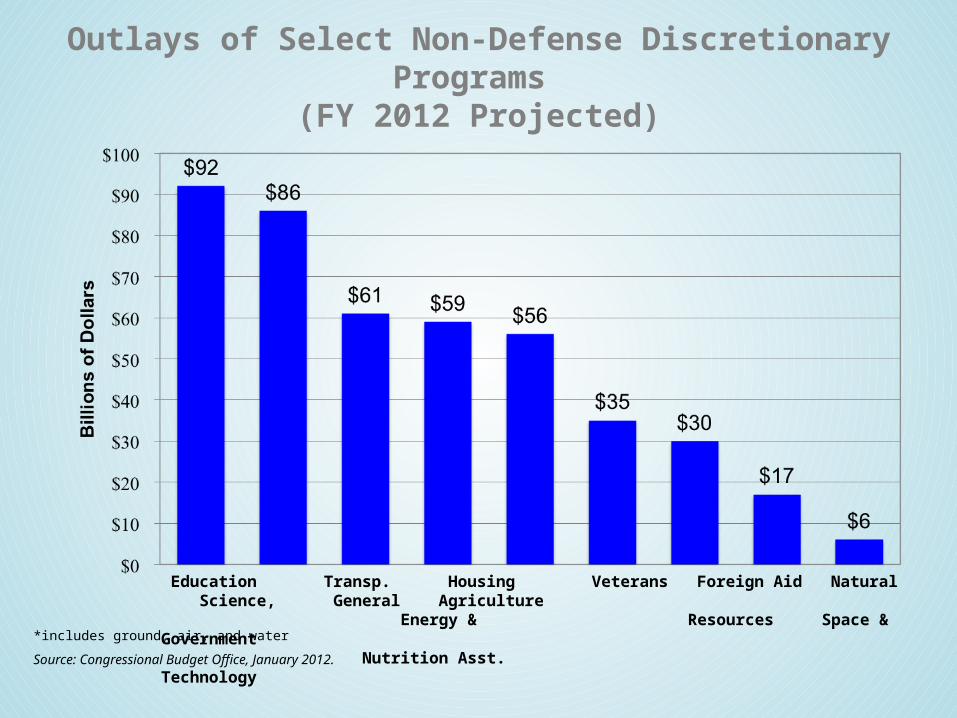
Outlays of Select Non-Defense Discretionary Programs (FY 2012 Projected)
Source: Congressional Budget Office, January 2012.
*includes ground, air, and water
Education Transp. Housing Veterans Foreign Aid Natural Science, General Agriculture Energy & Resources Space & Government Nutrition Asst. Technology
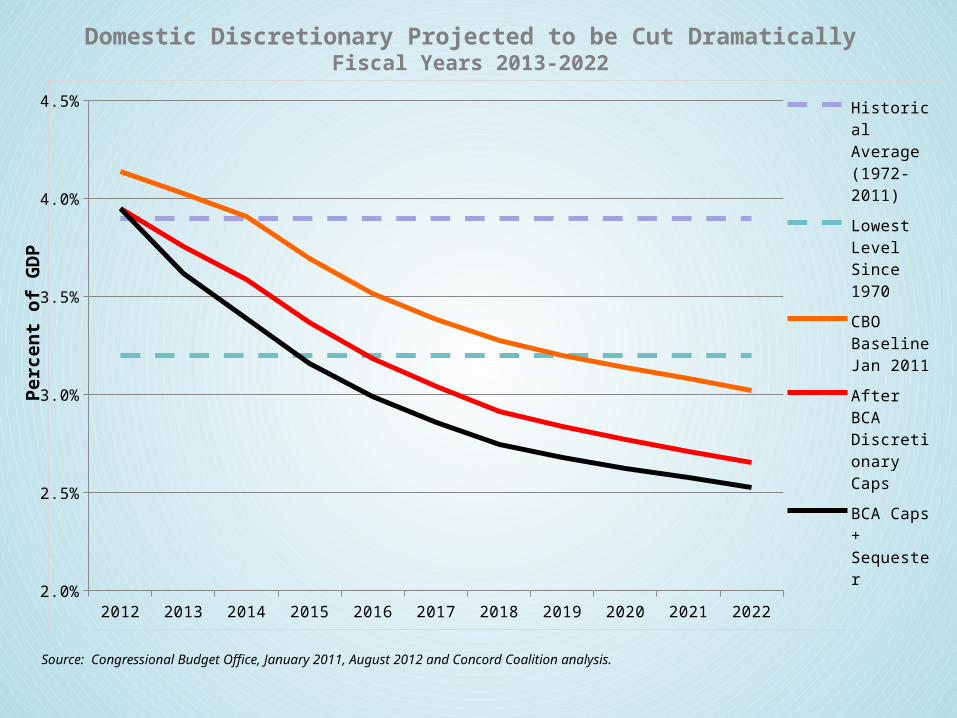
2012 2013 2014 2015 2016 2017 2018 2019 2020 2021 20222.0%
2.5%
3.0%
3.5%
4.0%
4.5%
Historical Average (1972-2011)
Lowest Level Since 1970
CBO Base-line Jan 2011
After BCA Discre-tionary Caps
BCA Caps + Sequester
Domestic Discretionary Projected to be Cut DramaticallyFiscal Years 2013-2022
Source: Congressional Budget Office, January 2011, August 2012 and Concord Coalition analysis.
Per
cen
t of
GD
P
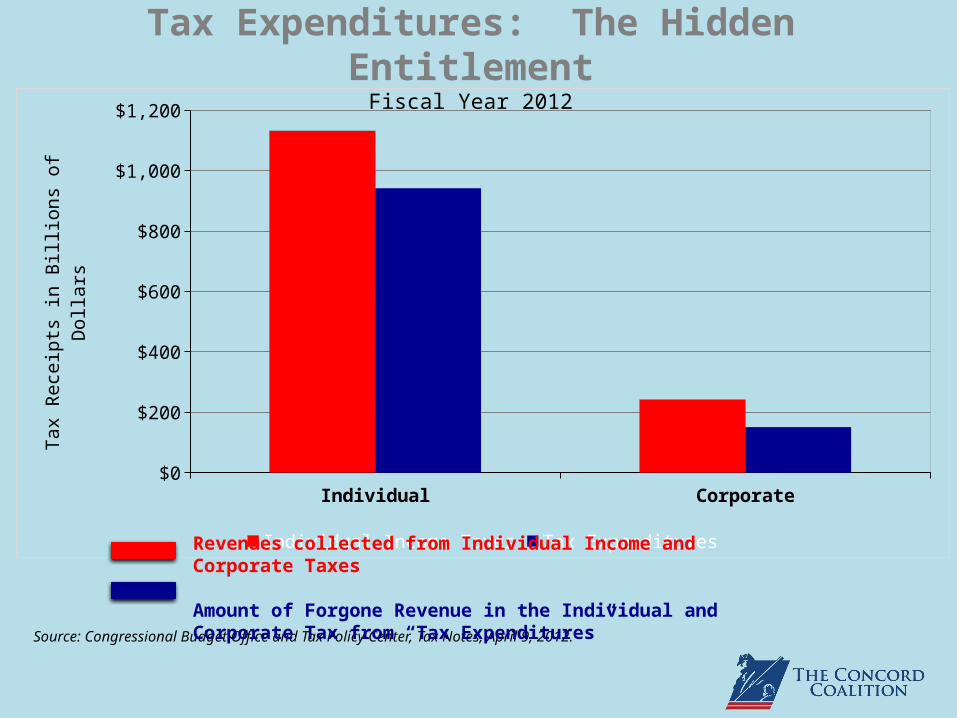
Tax Expenditures: The Hidden EntitlementFiscal Year 2012
Source: Congressional Budget Office and Tax Policy Center, Tax Notes, April 9, 2012.
Individual Corporate$0
$200
$400
$600
$800
$1,000
$1,200
Individual Income Taxes Tax Expenditures
Tax
Rece
ipts
in B
illio
ns o
f Dol
lars
Revenues collected from Individual Income and Corporate Taxes
Amount of Forgone Revenue in the Individual and Corporate Tax from “Tax Expenditures”
Excl
usio
n of
Em
ploy
er P
rovi
ded
H...
Redu
ced
Rate
s on
Cap
Gai
ns &
Di..
.
Excl
usio
n of
Defi
ned
Bene
fit &
Con
...
Hom
e M
ortg
age
Inte
rest
Ded
uctio
n
Earn
ed In
com
e Ta
x Cr
edit
Child
Cre
dit
Stat
e &
Loc
al T
ax D
educ
tions
Excl
usio
n of
Cap
ital G
ains
at D
eath
Char
itabl
e Co
ntri
butio
ns D
educ
tion
$0
$100
$200
$300
$400
$500
$600
$700
$800
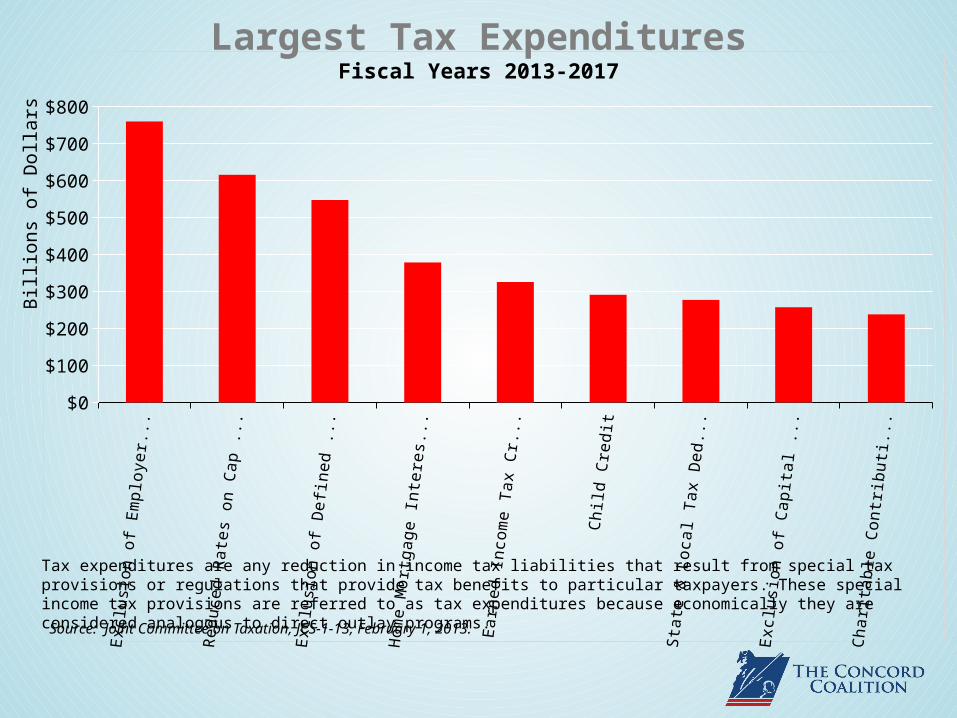
Largest Tax ExpendituresFiscal Years 2013-2017
Source: Joint Committee on Taxation, JCS-1-13, February 1, 2013.
Tax expenditures are any reduction in income tax liabilities that result from special tax provisions or regulations that provide tax benefits to particular taxpayers. These special income tax provisions are referred to as tax expenditures because economically they are considered analogous to direct outlay programs.
Billi
ons
of D
olla
rs
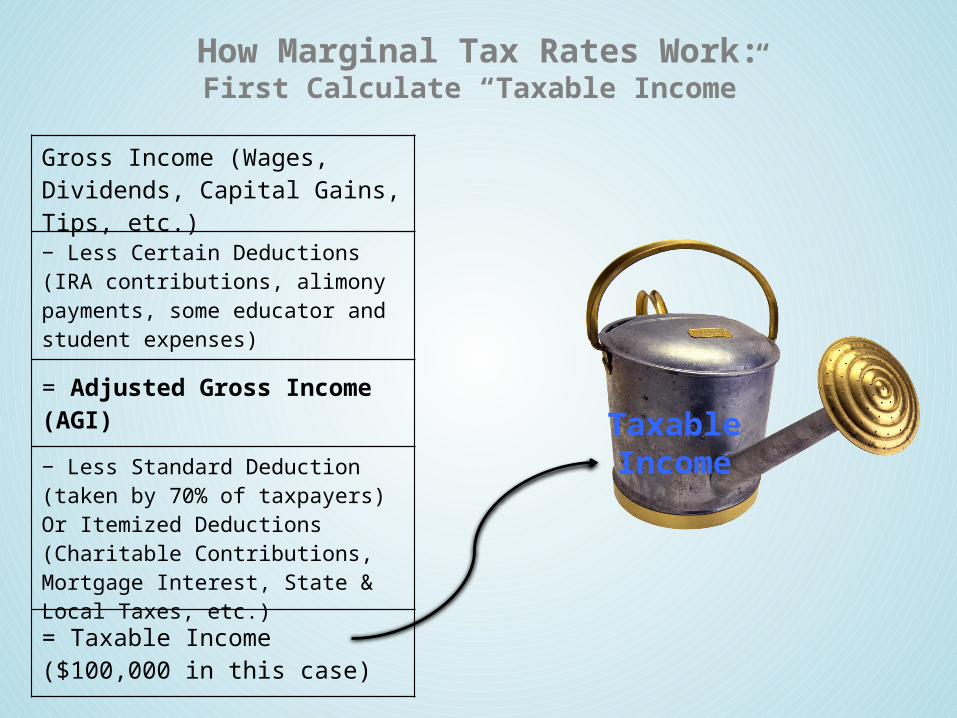
How Marginal Tax Rates Work:First Calculate “Taxable Income”
TaxableIncome
Gross Income (Wages, Dividends, Capital Gains, Tips, etc.)
− Less Certain Deductions (IRA contributions, alimony payments, some educator and student expenses)
= Adjusted Gross Income (AGI)
− Less Standard Deduction (taken by 70% of taxpayers) Or Itemized Deductions (Charitable Contributions, Mortgage Interest, State & Local Taxes, etc.)
= Taxable Income ($100,000 in this case)
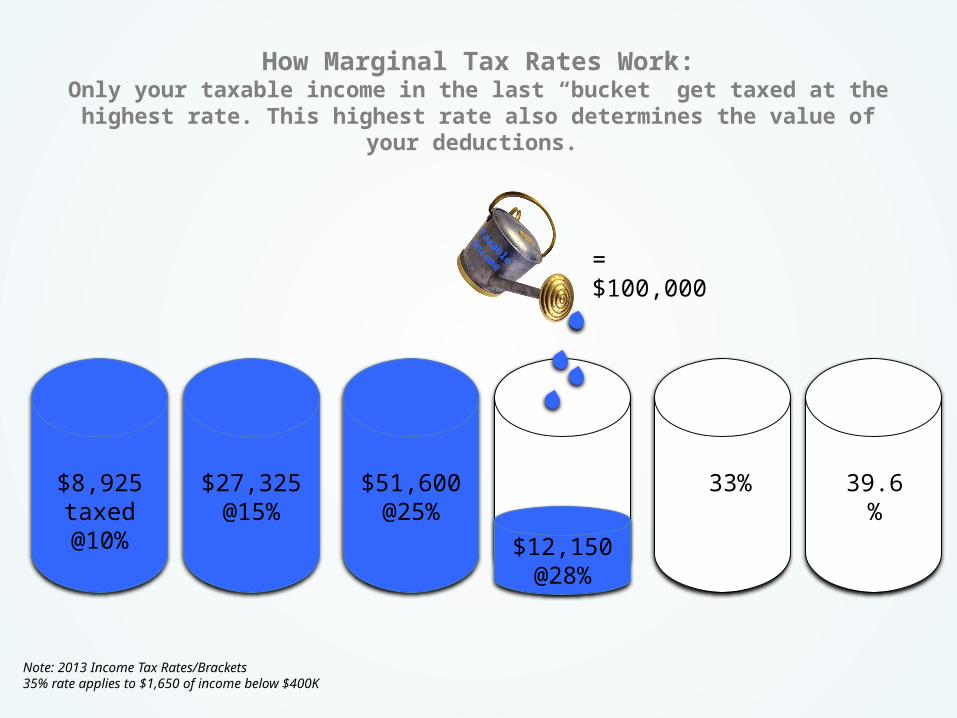
How Marginal Tax Rates Work:Only your taxable income in the last “bucket” get taxed at the highest rate. This highest rate also determines the value of your deductions.
$51,600 @25%
$12,150 @28%
Taxable
Income = $100,000
$8,925 taxed @10%
15%
33% 39.6%$27,325 @15%
Note: 2013 Income Tax Rates/Brackets35% rate applies to $1,650 of income below $400K
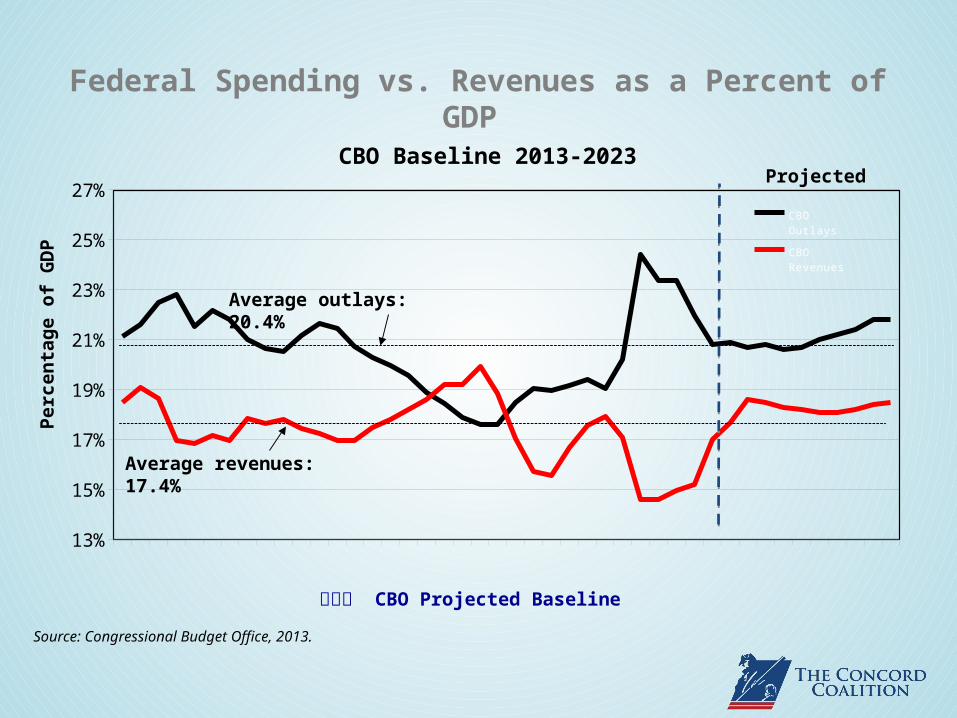
CBO Projected Baseline
13%
15%
17%
19%
21%
23%
25%
27%
CBO Outlays
CBO Revenues
Federal Spending vs. Revenues as a Percent of GDP CBO Baseline 2013-2023
Source: Congressional Budget Office, 2013.
Perc
enta
ge o
f GD
P
Projected
Average outlays: 20.4%
Average revenues: 17.4%
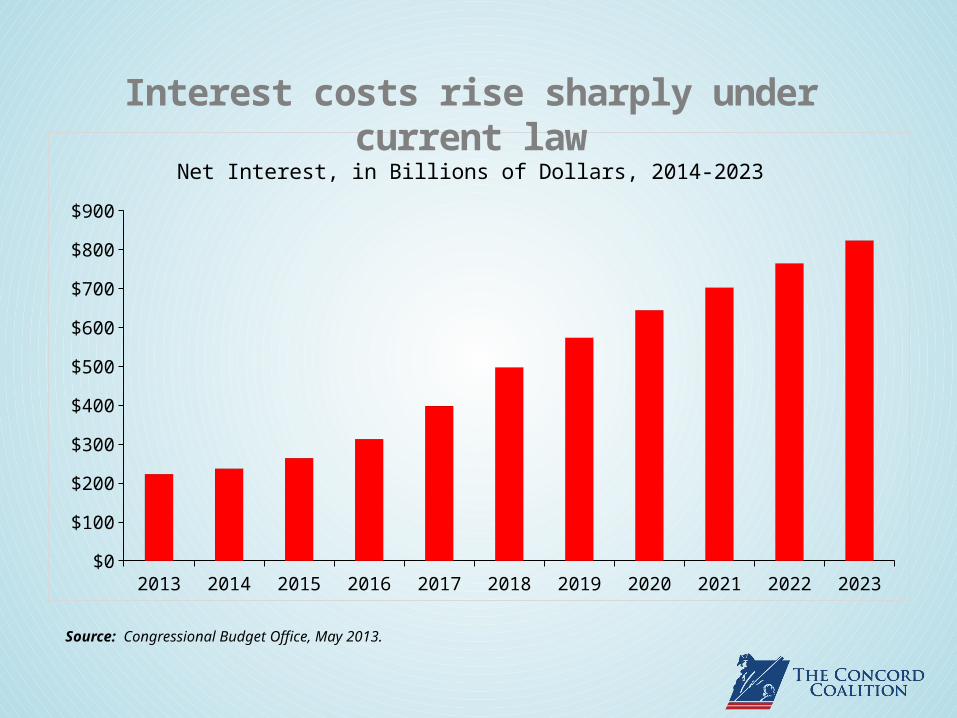
Source: Congressional Budget Office, May 2013.
2013 2014 2015 2016 2017 2018 2019 2020 2021 2022 2023$0
$100
$200
$300
$400
$500
$600
$700
$800
$900
Interest costs rise sharply under current lawNet Interest, in Billions of Dollars, 2014-2023
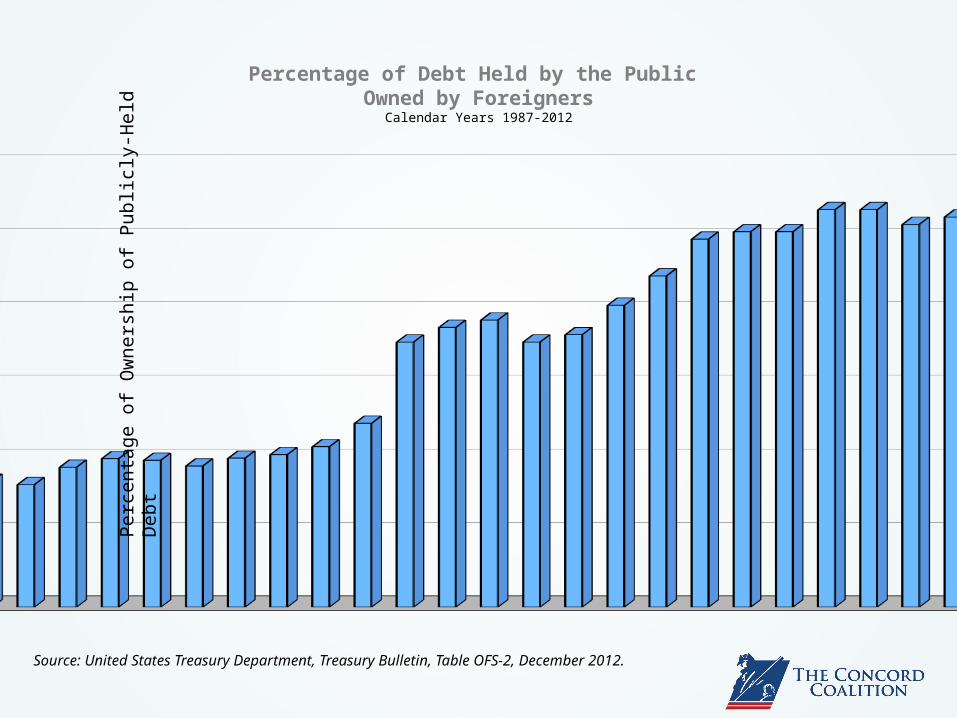
Percentage of Debt Held by the Public Owned by Foreigners
Calendar Years 1987-2012
Source: United States Treasury Department, Treasury Bulletin, Table OFS-2, December 2012.
0%
10%
20%
30%
40%
50%
60%
Perc
enta
ge o
f Ow
ners
hip
of P
ublic
ly-H
eld
Deb
t
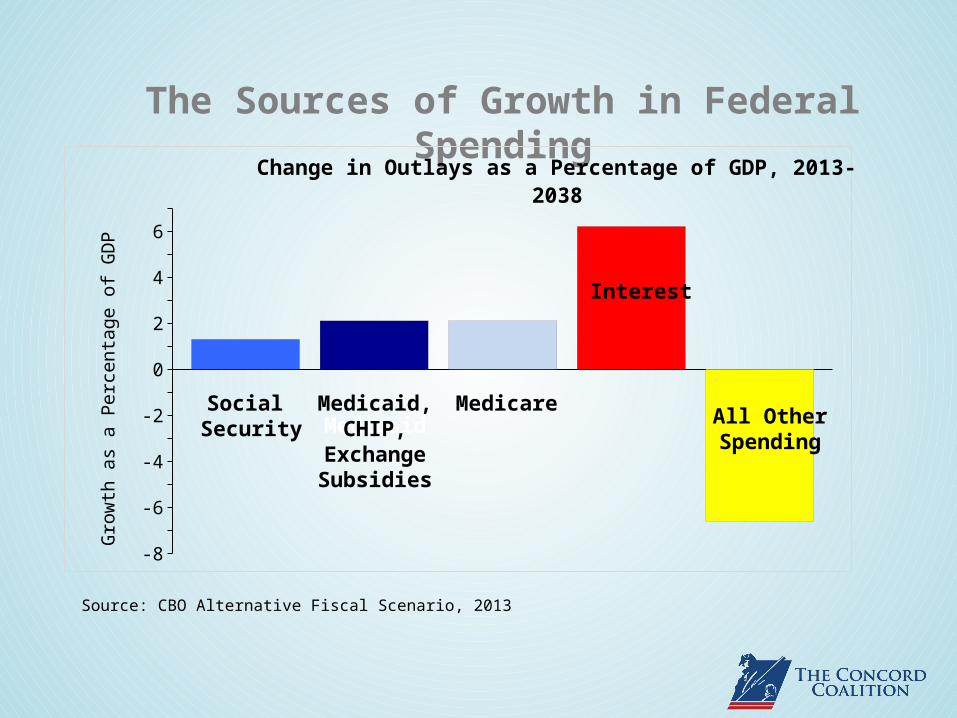
The Sources of Growth in Federal Spending
-8-7-6-5-4-3-2-101234567
Change in Outlays as a Percentage of GDP, 2013-2038
Gro
wth
as a
Per
cent
age
of G
DP
Source: CBO Alternative Fiscal Scenario, 2013
MedicareMedicaid
Social Security All Other
Spending
Interest
Medicaid, CHIP,
Exchange Subsidies
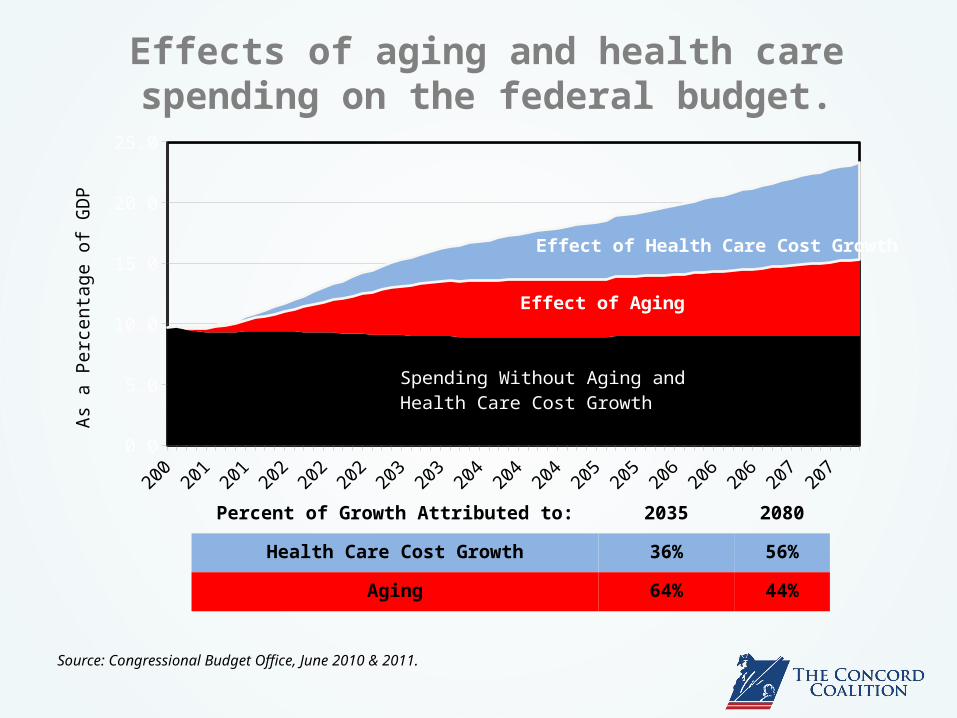
Effects of aging and health care spending on the federal budget.
Source: Congressional Budget Office, June 2010 & 2011.
0.0
5.0
10.0
15.0
20.0
25.0
As a
Per
cent
age
of G
DP
Effect of Aging
Effect of Health Care Cost Growth
Spending Without Aging and Health Care Cost Growth
Percent of Growth Attributed to: 2035 2080
Health Care Cost Growth 36% 56%
Aging 64% 44%
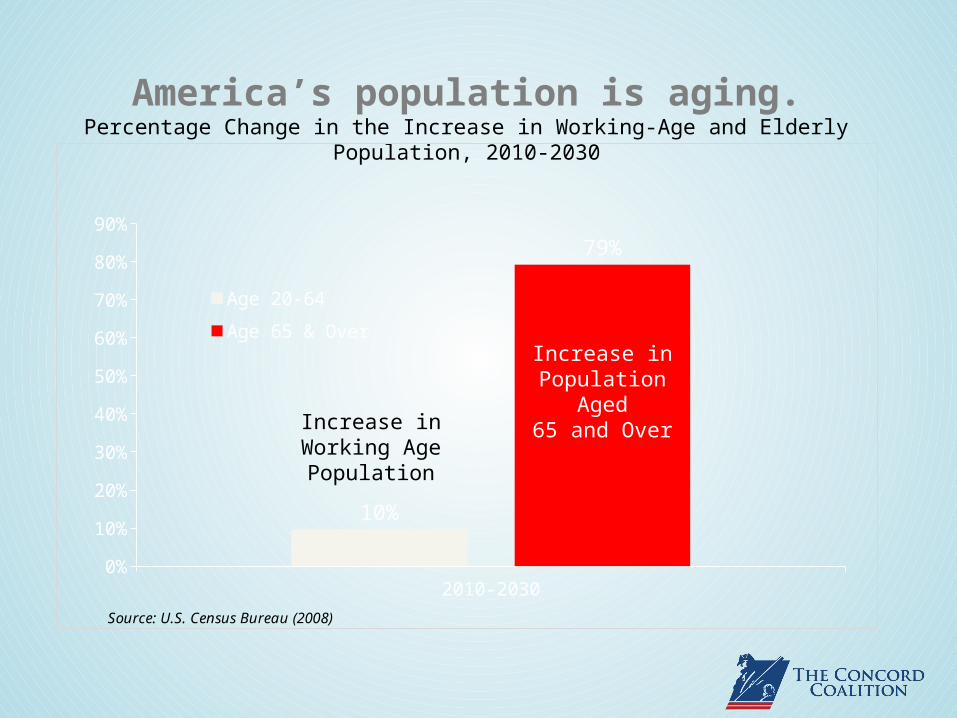
America’s population is aging.Percentage Change in the Increase in Working-Age and Elderly Population, 2010-2030
2010-20300%
10%
20%
30%
40%
50%
60%
70%
80%
90%
10%
79%
Age 20-64
Age 65 & Over
Source: U.S. Census Bureau (2008)
Increase inWorking AgePopulation
Increase inPopulation Aged
65 and Over
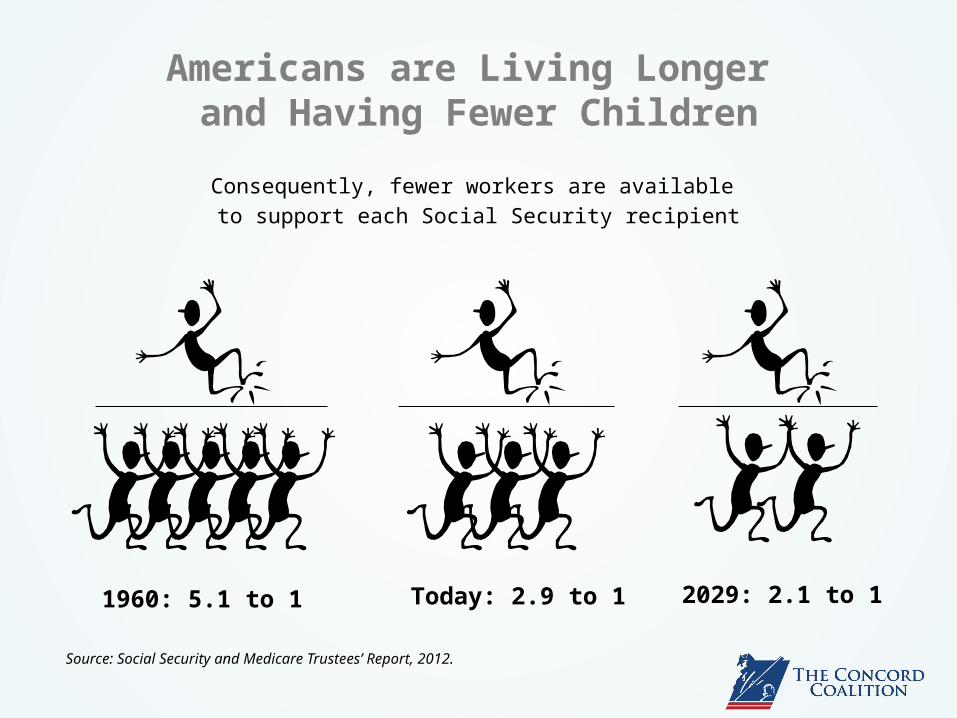
Americans are Living Longer and Having Fewer Children
Consequently, fewer workers are available to support each Social Security recipient
1960: 5.1 to 1 Today: 2.9 to 1 2029: 2.1 to 1
Source: Social Security and Medicare Trustees’ Report, 2012.
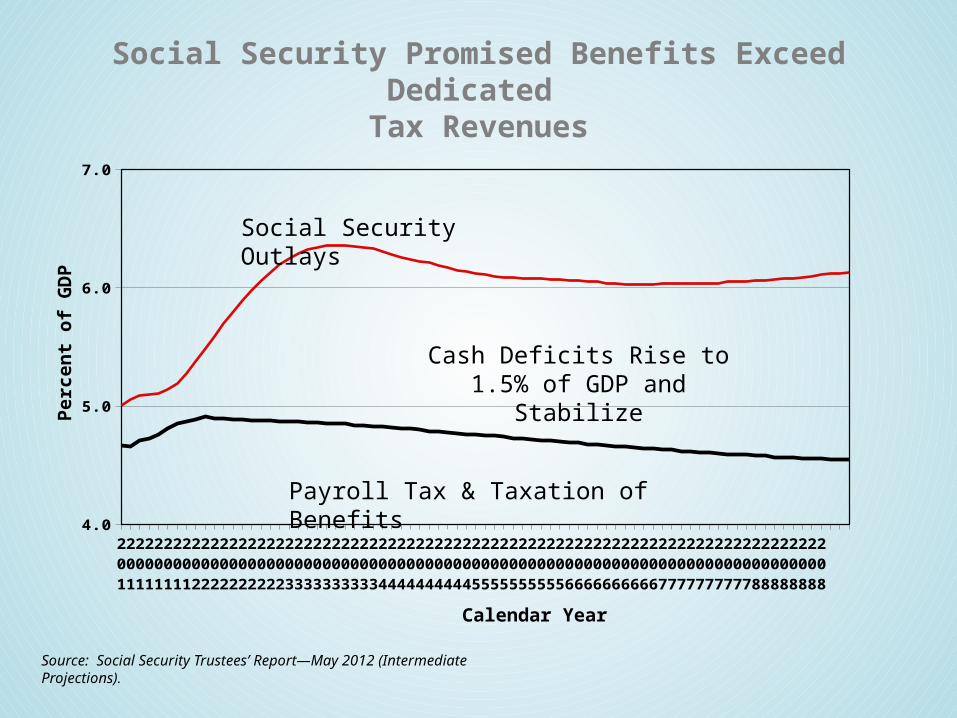
Social Security Promised Benefits Exceed Dedicated Tax Revenues
2012
2013
2014
2015
2016
2017
2018
2019
2020
2021
2022
2023
2024
2025
2026
2027
2028
2029
2030
2031
2032
2033
2034
2035
2036
2037
2038
2039
2040
2041
2042
2043
2044
2045
2046
2047
2048
2049
2050
2051
2052
2053
2054
2055
2056
2057
2058
2059
2060
2061
2062
2063
2064
2065
2066
2067
2068
2069
2070
2071
2072
2073
2074
2075
2076
2077
2078
2079
2080
2081
2082
2083
2084
2085
2086
2087
4.0
5.0
6.0
7.0
Source: Social Security Trustees’ Report—May 2012 (Intermediate Projections).
Social Security Outlays
Payroll Tax & Taxation of Benefits
Perc
ent o
f GD
P
Calendar Year
Cash Deficits Rise to 1.5% of GDP and Stabilize
2011 2020 2030 2040 2050 2060 2070 20800
2
4
6
8
10
12
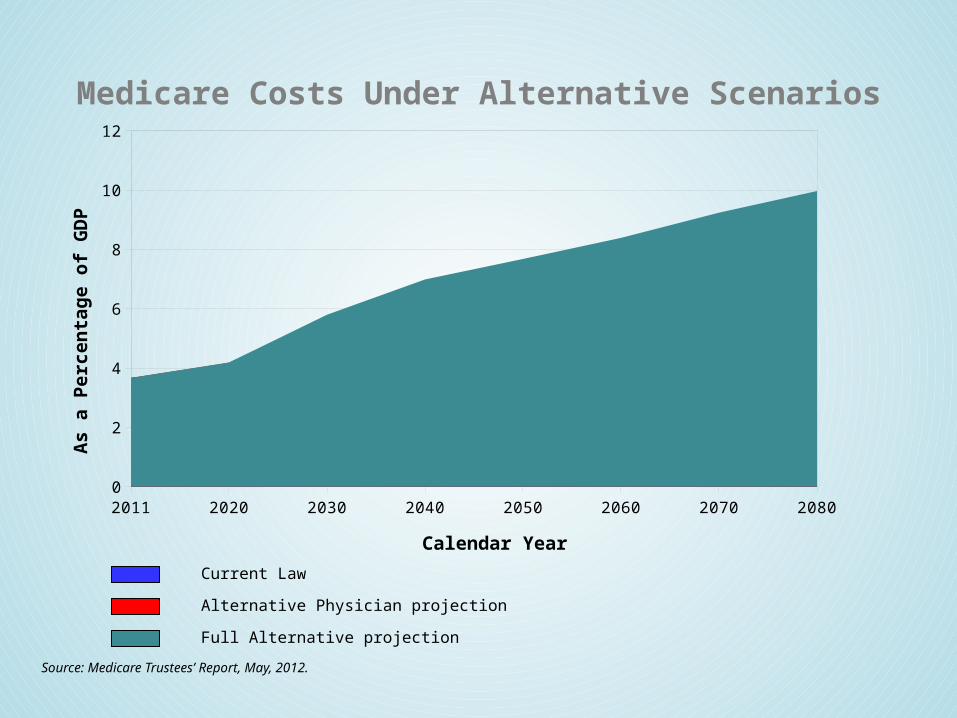
Medicare Costs Under Alternative Scenarios
Calendar Year
As
a P
erce
nta
ge o
f G
DP
Current Law
Alternative Physician projection
Source: Medicare Trustees’ Report, May, 2012.
Full Alternative projection
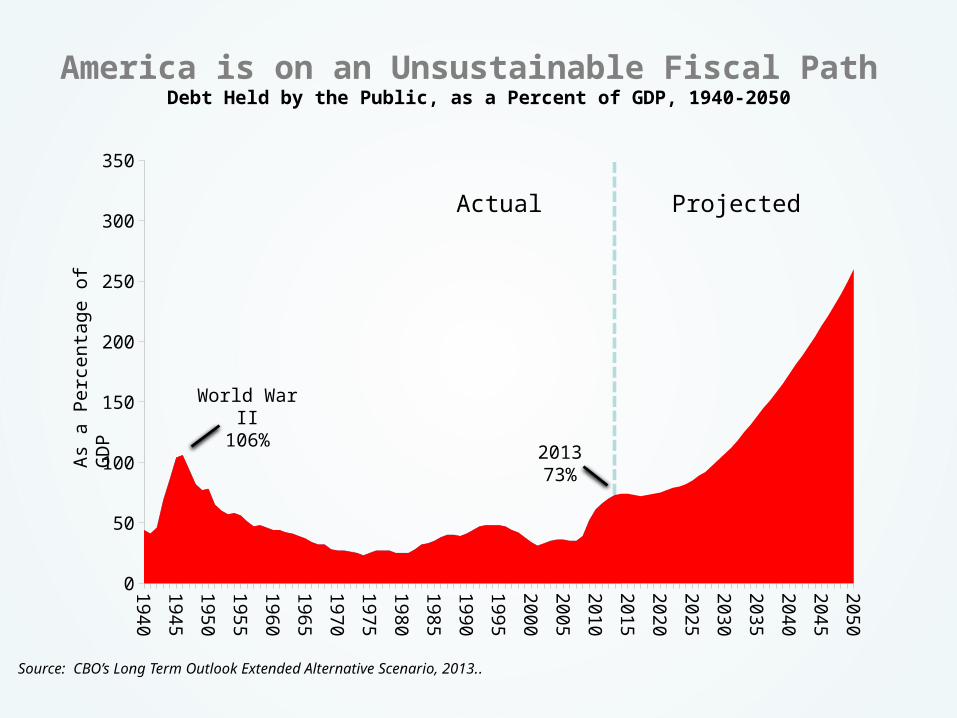
America is on an Unsustainable Fiscal Path Debt Held by the Public, as a Percent of GDP, 1940-2050
Source: CBO’s Long Term Outlook Extended Alternative Scenario, 2013..
As a
Per
cent
age
of G
DP
1940194319461949195219551958196119641967197019731976197919821985198819911994199720002003200620092012201520182021202420272030203320362039204220452048
0
50
100
150
200
250
300
350
Actual Projected
World War II106%
201373%
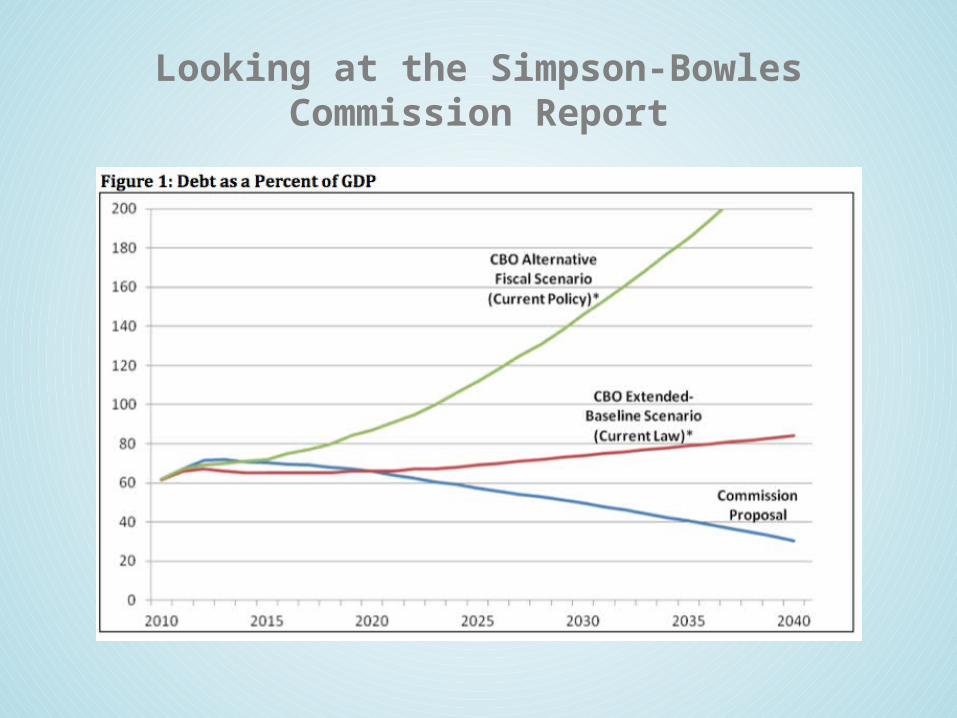
Looking at the Simpson-Bowles Commission Report