Embed Size (px)
Citation preview
The Conference Board of CanadaThe Conference Board of Canada
Performance and Potential The Changing Face of Leadership
Charles A. BarrettVice-President, The Conference Board of Canada
September 18, 2001

The Conference Board of CanadaThe Conference Board of Canada
The Conference Board of Canada

The Conference Board of CanadaThe Conference Board of Canada
5th Report

The Conference Board of CanadaThe Conference Board of Canada
ECONOMICSOCIALEconomic
& Social Systemsfit together
The Conference Board Believes That….
. . . our social and economic systems are synergistic

The Conference Board of CanadaThe Conference Board of Canada
The Conference Board Said That . . .
“By any measure of socio-economic prosperity—economic wealth, material possessions, natural
resources, health, education, or strong standing in the global marketplace—Canadians are among the richest,
most comfortable people in the world.”
Performance & Potential 1996

The Conference Board of CanadaThe Conference Board of Canada
The Conference Board Also Believes That
We can not sustain what we now have unless we change, and that actions by leaders can
affect our prospects—“this privileged position is not guaranteed”
Performance & Potential 1996

The Conference Board of CanadaThe Conference Board of Canada
A Society’s Goal:A High andSustainable
Quality of Life
Health & society
EnvironmentEducation
Innovation
EconomyLabour markets
these are the fundamental underpinnings

The Conference Board of CanadaThe Conference Board of Canada
Benchmarking Shows Us the “Possible”
Six of the Best

The Conference Board of CanadaThe Conference Board of Canada
• some where we do very well, some poor so we can learn from others
• this is not just for countries; it applies equally to organizations
Benchmarking Indicators Shows Us What is Possible

The Conference Board of CanadaThe Conference Board of Canada
Performance & Potential 2000The Top 40 Record
On the Top 40 indicators compared to 6 of the best, we are a . . .
Top performer on 10Average performer on 14
Poor performer on 16

The Conference Board of CanadaThe Conference Board of Canada
Canada’s Performance—The Top 40 Record
Socio-Econ. No. of Current The Overall TopCategories Ind’trs Performance Performer
Source: The Conference Board of Canada
Economy 6 Average U.S.
Labour Markets 4 Top Norway
Innovation 6 Poor Sweden
Environment 4 Poor Sweden
Education/skills 8 Average U.S.
Health/society 12 Average Japan

The Conference Board of CanadaThe Conference Board of Canada
Canada—The Top 40 Record by Category
Socio-Economic Top Average PoorCategories Performer Performer Performer
Source: The Conference Board of Canada
Economic 2 1 3Labour 2 2 0Innovation 1 0 5Environment 0 2 2Education/skills 3 1 4Health/society 2 8 2
Total Indicators 10 14 16

The Conference Board of CanadaThe Conference Board of Canada
How is Canada Doing?
Sample benchmark indicators of labour, education/skills and
innovation

The Conference Board of CanadaThe Conference Board of Canada
0123456789
Canada U.S. Germany Japan Australia Sweden Norway
Standardized Unemployment Rate, 2000Q1
(per cent of labour force)
Source: OECD Internet release.

The Conference Board of CanadaThe Conference Board of Canada
0
10
20
30
40
50
60
Canada U.S. Germany Japan Australia Sweden Norway(1997)
Per Cent of the Population Attaining Post-Secondary Education, 1998
Source: Education at a Glance: OECD Indicators, 2000.
The Conference Board of CanadaThe Conference Board of Canada
0
1
2
3
4
5
6
Canada U.S. Germany Australia Sweden Norway(1997)
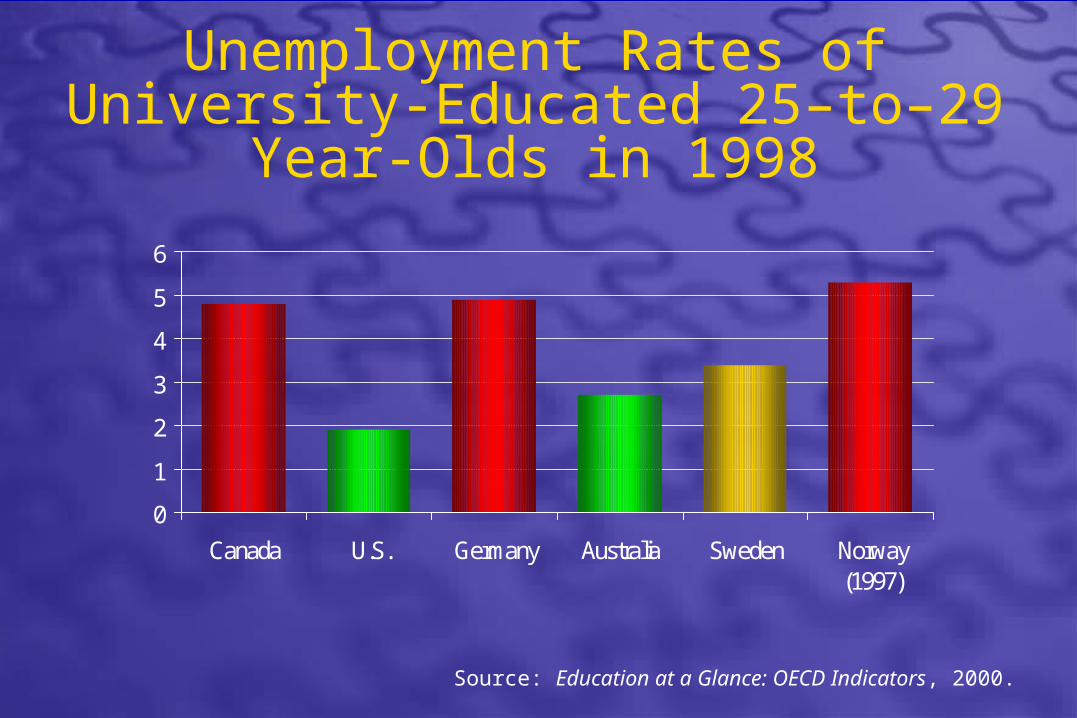
Unemployment Rates of University-Educated 25–to–29 Year-Olds in 1998
Source: Education at a Glance: OECD Indicators, 2000.

The Conference Board of CanadaThe Conference Board of Canada
0
1
2
3
4
5
Canada(1998)
U.S. (1998)
Germany(1998)
Japan(1997)
Australia(1996)
Sweden(1997)
Norway(1997)
Total Expenditures on R&Das a Percentage of GDP
Source: OECD, Main Science and Technology Indicators.
The Conference Board of CanadaThe Conference Board of Canada
0
2
4
6
8
10
Canada(1995)
U.S. (1993)
Germany(1997)
Japan(1997)
Australia(1996)
Sweden(1997)
Norway(1997)
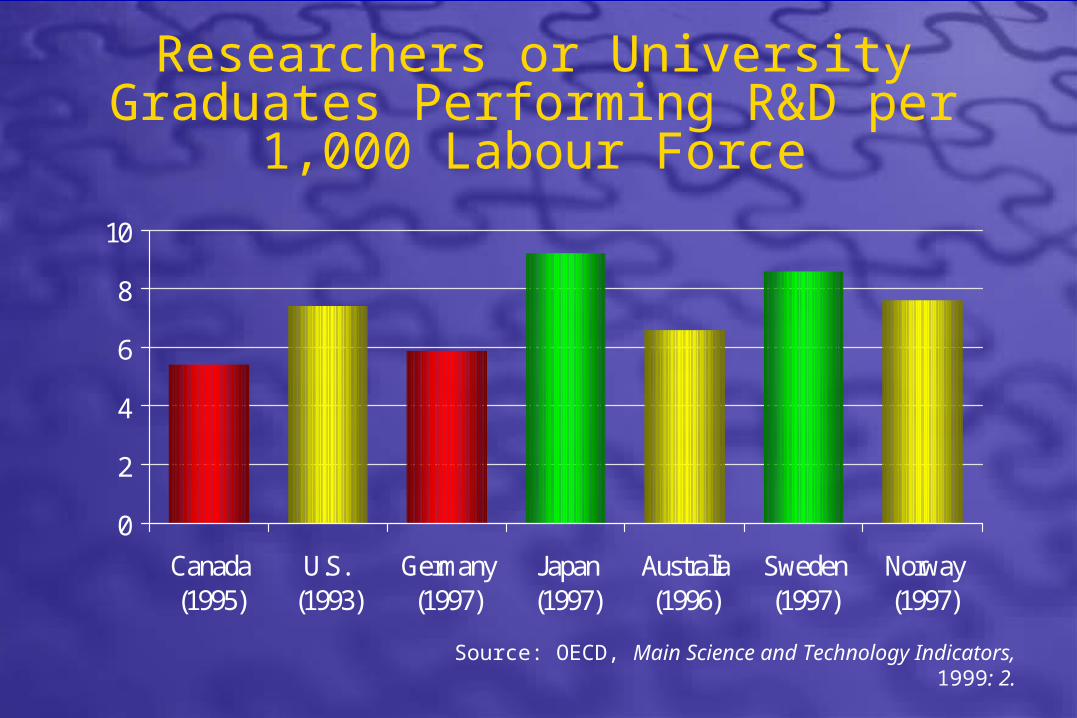
Researchers or University Graduates Performing R&D per 1,000 Labour Force
Source: OECD, Main Science and Technology Indicators, 1999: 2.

The Conference Board of CanadaThe Conference Board of Canada
Boosting Your Performance & Potential is About Leadership
Leaders can choose to make a positive difference in whether organizations prosper
—they carry much of the burden.

The Conference Board of CanadaThe Conference Board of Canada
FIVE Areas for
Improvement
Calling Leaders to Action

The Conference Board of CanadaThe Conference Board of Canada
Education and developing a learning culture must be a higher priority
1
Calling Leaders to Action

The Conference Board of CanadaThe Conference Board of Canada
CTA 1—Building Learning Culture Firms must boost spending on training Ensure every youth graduates from H.S. Raise math and science skills All schools must have access to the Net Improve apprenticeship programs Enhance business to work partnerships

The Conference Board of CanadaThe Conference Board of Canada
Focus attention on Canada’s foreign investment performance
2
Calling Leaders to Action

The Conference Board of CanadaThe Conference Board of Canada
Be more innovative3
Calling Leaders to Action

The Conference Board of CanadaThe Conference Board of Canada
CTA 3—Boosting Innovation
Tax policy must reward innovation Firms must boost R&D spending Companies must better assess competition Better processes needed to assess projects Education must boost innovation skills

The Conference Board of CanadaThe Conference Board of Canada
Social policy must be sustainable4
Calling Leaders to Action

The Conference Board of CanadaThe Conference Board of Canada
Serious public debate about sustainability of the health care system
5
Calling Leaders to Action

The Conference Board of CanadaThe Conference Board of Canada
Canada’s weakest driver . . .
The need to boost our innovation capacity is challenging old ways. Organizations must be able to get additional economic value
from knowledge if they are to prosper.

The Conference Board of CanadaThe Conference Board of Canada
Innovation is about . . .
. . . more than R&D, computers and AMTs. It’s also about leadership, management,
incentives and a will to change.

The Conference Board of CanadaThe Conference Board of Canada
Innovation is About Building a Learning Organization by
promoting idea generation supporting the “idea to market” process having values around innovation & people building skills & flexibility among workers organizing work as the work demands

The Conference Board of CanadaThe Conference Board of Canada
Key findings from CBoC Research Strong innovators perform better Most large Canadian firms innovate to some
extent But only 2/3 innovate in all three areas
(products, processes, organization) 10-12% of revenue from new products Not good enough

The Conference Board of CanadaThe Conference Board of Canada
0.0
0.2
0.4
0.6
0.8
1.0
1.2
Canada--Quebec**
Italy** Canada--Ontario**
Korea** U.S.--California
Australia France Japan** Mexico UnitedKingdom
Sweden Germany
Price of $1 of R&D for Small Companies*
Source: Jacek Warda, Rating R&D Tax Incentives, (Ottawa: CBoC, 1999).
* “After-tax cost” is the net cost of spending $1 more on R&D-related activities.The lower thevalue of after-tax cost, the better is the ranking of the jurisdiction in the provision of R&D benefits.
** These jurisdictions have special R&D tax treatment for small companies.

The Conference Board of CanadaThe Conference Board of Canada
0.00.51.01.52.02.53.03.54.04.5
Strong innovators
Weak innovators
Strong Innovators OutperformWeak Innovators
Source: The Conference Board of Canada.
Profitability
Canadian market share
Global market share
Employment
Sales

The Conference Board of CanadaThe Conference Board of Canada
0
20
40
60
80
100
Strong innovators
Weak innovators
Strong Innovators Use More Tools for Idea Generation
Source: The Conference Board of Canada.
Use of competitor info
Business environment scanning
Idea generation
Use of customer info
R&D

The Conference Board of CanadaThe Conference Board of Canada
0
20
40
60
80
100
Strong innovators
Weak innovators
Strong Innovators Use More Tools for Building Innovation Capacity
Source: The Conference Board of Canada.
Partnerships & alliances
Organization & structure
Recruitment & assignment
T&D
Adoption of outside tech

The Conference Board of CanadaThe Conference Board of Canada
0
20
40
60
80
100
Strong innovators
Weak innovators
Strong innovators Have Stronger Project Management and Decision-making Capabilities
Source: The Conference Board of Canada.
Delegation of decision making
Use of market analysis information
Project selection & evaluation tools
Cost-benefit analysis
Involvement of all depts. From the beginning

The Conference Board of CanadaThe Conference Board of Canada
0
20
40
60
80
100
Strong innovators
Weak innovators
Strong Innovators Are Better at Creating an Environment that Supports Innovation
Source: The Conference Board of Canada.
Vision development
Change promoting
Innovation
Idea friendliness
Rewards & promo policies

The Conference Board of CanadaThe Conference Board of Canada
Canada Compared to 9 Others
Rank 1981 Rank 1997
R&D intensity 7 9 Industry-funded R&D 8 8 Government outlays for R&D 6 10 Researchers in R&D 6 8 National patent applications 6 8 External patent applications 8 8 Tech’gy bal’nc of payments 6 4

The Conference Board of CanadaThe Conference Board of Canada
Performance & Potential 1998
Building a learning culture is necessary to ensure that people can change fast enough. Acquiring the wrong skills, dropping out or having poor literacy skills will serve no one
well in the 21st century.

The Conference Board of CanadaThe Conference Board of Canada Sources: The Conference Board of Canada; Statistics Canada.
Total Public Spending on Education per Student aged 5—24 (real 1992 $)
The Conference Board of CanadaThe Conference Board of Canada
0
5
10
15
20
25
Canada Nfld. PEI NS NB Que Ont Man Sas Alt BC
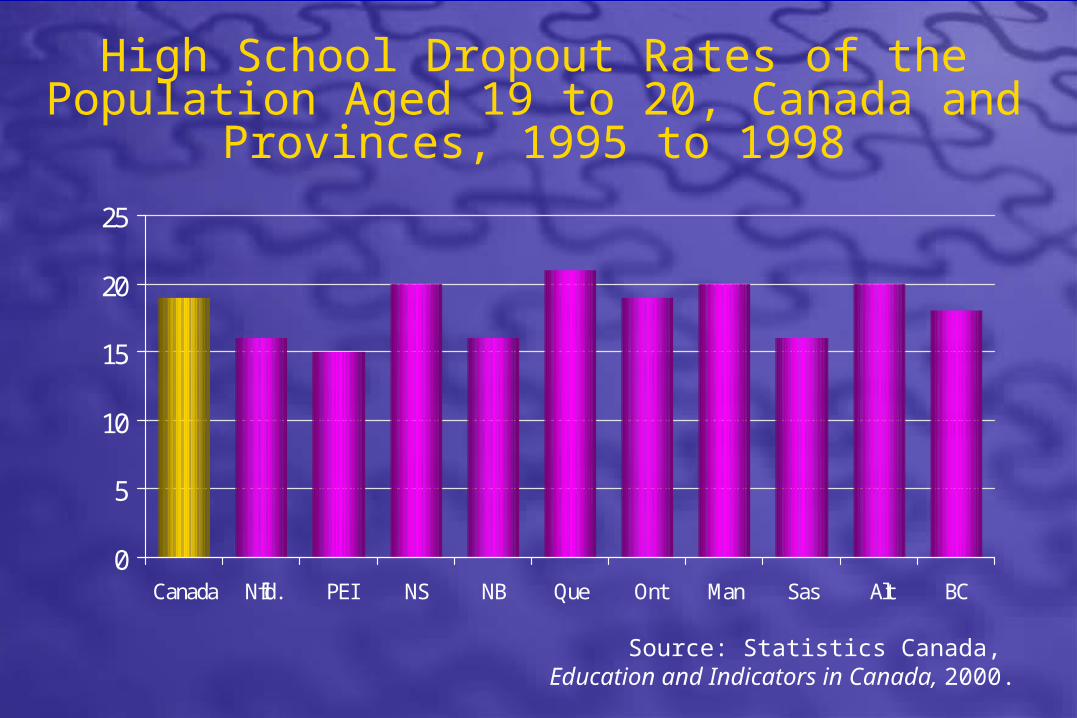
High School Dropout Rates of the Population Aged 19 to 20, Canada and Provinces, 1995 to 1998
Source: Statistics Canada, Education and Indicators in Canada, 2000.

The Conference Board of CanadaThe Conference Board of Canada
Document Literacy Skills(per cent by Literacy Level 1 to 5)
Sources: The Conference Board of Canada; International Adult Literacy Survey
0
1020
3040
50
6070
80
Poor Average Good
Overall Economy Manufacturing
Level 1,2
Level 3
Level 4, 5
The Conference Board of CanadaThe Conference Board of Canada
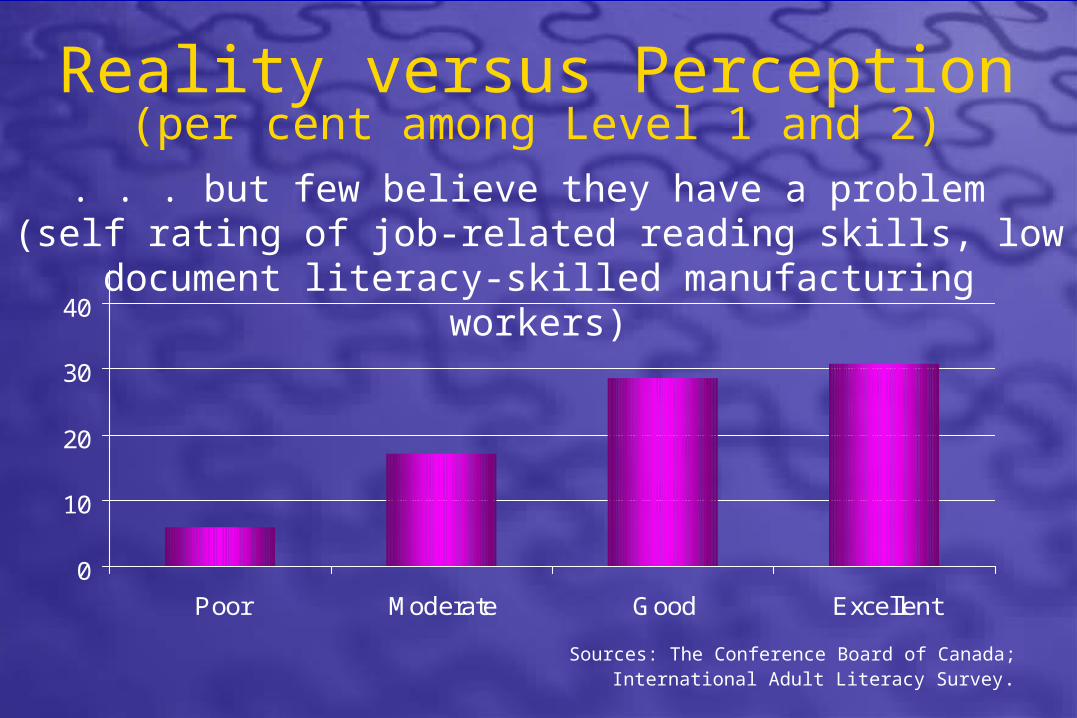
Reality versus Perception(per cent among Level 1 and 2)
Sources: The Conference Board of Canada; International Adult Literacy Survey.
. . . but few believe they have a problem (self rating of job-related reading skills, low document literacy-
skilled manufacturing workers)
0
10
20
30
40
Poor Moderate Good Excellent

The Conference Board of CanadaThe Conference Board of Canada
Reality versus Perception(per cent of Level 1 and 2)
Sources: The Conference Board of Canada; International Adult Literacy Survey
0
10
20
30
40
50
60
Greatly limiting Somewhat limiting Not at all limiting
. . . and even fewer believe that it matters(perceived impact of reading skills on job opportunities of poor
document literacy-skilled workers)

The Conference Board of CanadaThe Conference Board of Canada
Trying to Get and Keep Top Talent
Most companies do not even know what talents their staff actually have . . . and the
staff don’t know either.

The Conference Board of CanadaThe Conference Board of Canada Source: The World Competitiveness Yearbook, 1998.
0
1
2
3
4
5
6
7
8
Japan Germany Sweden Norway Australia U.S. Canada
Companies Invest Sufficiently inIn-Company Training (1 = Do Not; 10 = Do)
The Conference Board of CanadaThe Conference Board of Canada
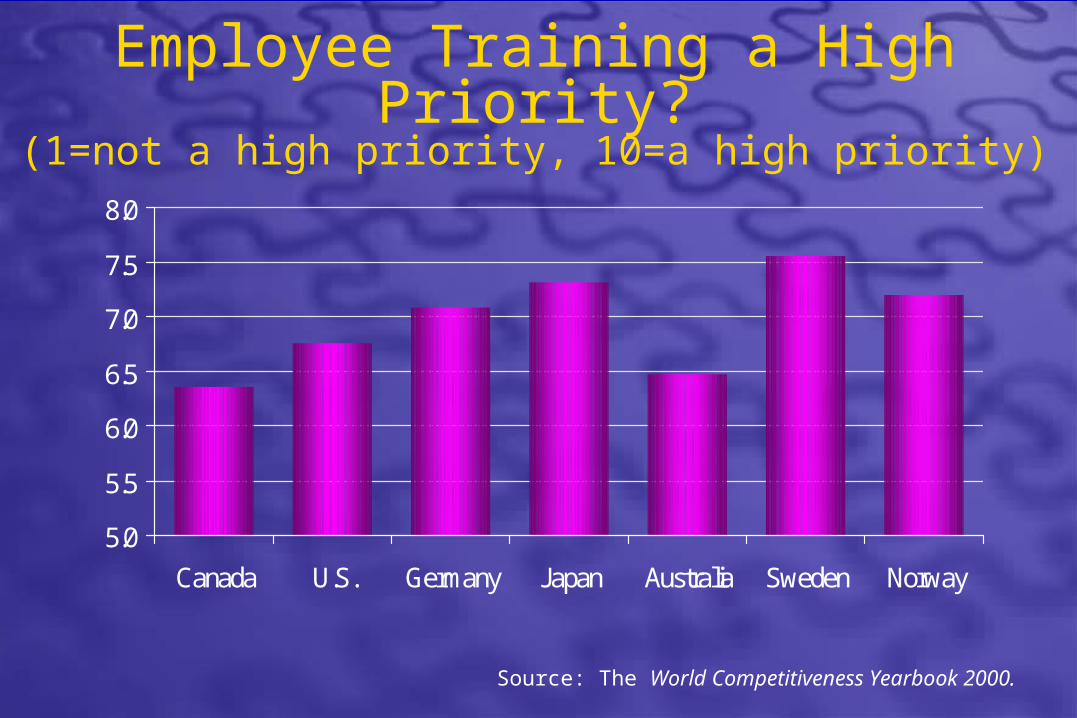
5.0
5.5
6.0
6.5
7.0
7.5
8.0
Canada U.S. Germany Japan Australia Sweden Norway
Employee Training a High Priority?(1=not a high priority, 10=a high priority)
Source: The World Competitiveness Yearbook 2000.

The Conference Board of CanadaThe Conference Board of Canada
Raising the Bar
Educational Requirements for Employment Have Changed

The Conference Board of CanadaThe Conference Board of Canada
Employment by Level of Education(Thousands of persons)
Sources: Statistics Canada.
0
1,000
2,000
3,000
4,000
5,000
No highschool
diploma
High schooldiploma
Some post-secondary
Post-secondarycertificate
Universitydegree
1990 1999
The Conference Board of CanadaThe Conference Board of Canada
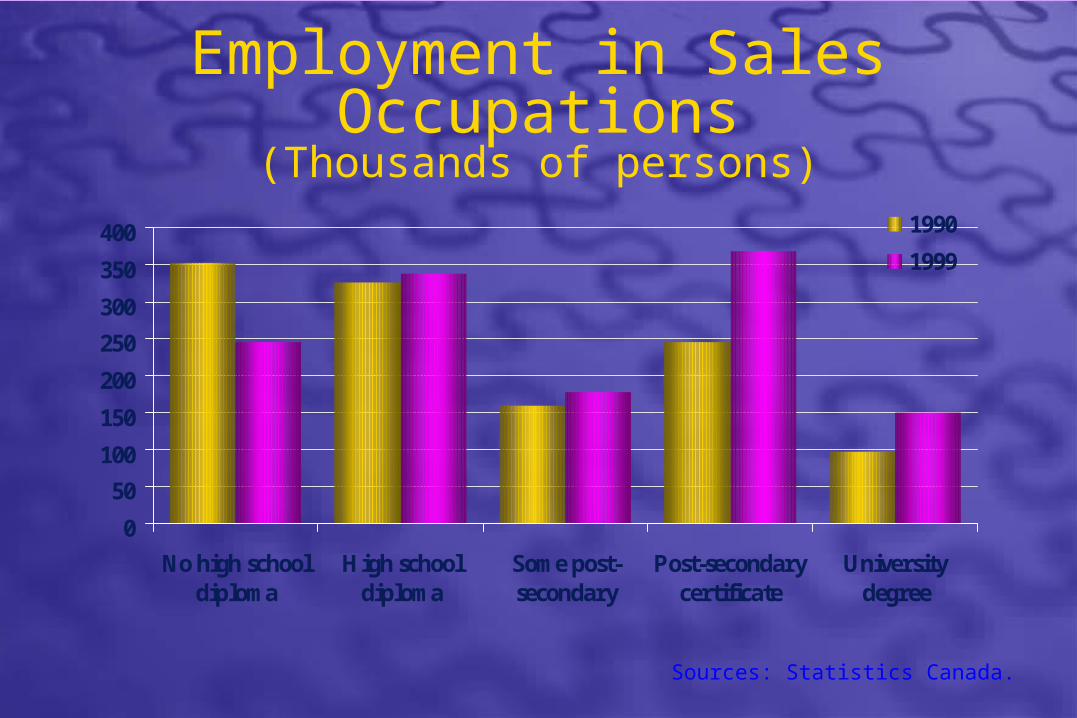
Employment in Sales Occupations(Thousands of persons)
Sources: Statistics Canada.
0
50
100
150
200
250
300
350
400
No high schooldiploma
High schooldiploma
Some post-secondary
Post-secondarycertificate
Universitydegree
1990
1999

The Conference Board of CanadaThe Conference Board of Canada
Employment in Clerical Occupations(Thousands of persons)
Sources: Statistics Canada.
0
100
200
300
400
500
No high schooldiploma
High schooldiploma
Some post-secondary
Post-secondarycertificate
1990 1999

The Conference Board of CanadaThe Conference Board of Canada
Employment of Motor Vehicleand Transit Drivers
(Thousands of persons)
Sources: Statistics Canada.
0
50
100
150
200
No high schooldiploma
High school diploma Post-secondarycertificate
1990 1999

The Conference Board of CanadaThe Conference Board of Canada
Wanted: Skilled Workers
The Upcoming Skills Shortage
The Conference Board of CanadaThe Conference Board of Canada
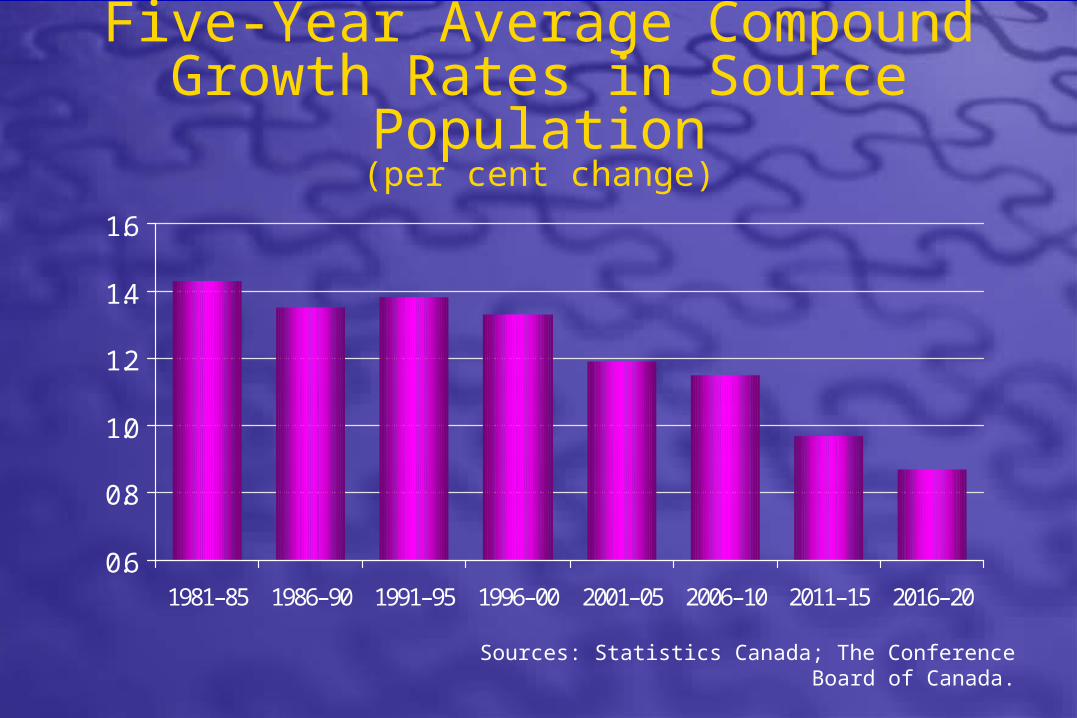
0.6
0.8
1.0
1.2
1.4
1.6
1981–85 1986–90 1991–95 1996–00 2001–05 2006–10 2011–15 2016–20
Five-Year Average CompoundGrowth Rates in Source Population
(per cent change)
Sources: Statistics Canada; The Conference Board of Canada.

The Conference Board of CanadaThe Conference Board of Canada
11
12
13
14
15
16
17
18
1999 2002 2005 2008 2011 2014 2017 2020
Proportion of Population Aged 65+ (per cent)
Sources: Statistics Canada; The Conference Board of Canada.

The Conference Board of CanadaThe Conference Board of Canada
62
63
64
65
66
67
68
1989 1992 1995 1998 2001 2004 2007 2010 2013 2016 2019
Overall Labour Force Participation Rate (per cent)
Sources: Statistics Canada; The Conference Board of Canada.

The Conference Board of CanadaThe Conference Board of Canada
0.00.20.40.60.81.01.21.41.61.82.0
1981–85 1986–90 1991–95 1996–00 2001–05 2006–10 2011–15 2016–20
Five-Year Average Compound Growth Rates in Labour Force
(per cent change)
Sources: Statistics Canada; The Conference Board of Canada.

The Conference Board of CanadaThe Conference Board of Canada
Statistically Significant Predictorsof Recruitment Success
1. Augmenting student programs
2. Providing a learning environment (increased T&D expenditures)
3. Using anticipatory hiring practices
4. Seeking recruits from outside Canada
5. Involving employees in therecruitment process
The Conference Board of CanadaThe Conference Board of Canada
Report Card on Leadership
From Leadership for Tomorrow:Playing Catch-up with Change

The Conference Board of CanadaThe Conference Board of Canada
Report on Leadership, 2001 Comparison of 1999 and 2001 Results
Change… 1999 2001 %
Rate of change in businessenvironment is increasing…
90.2 87.1 -3.1
Change is highly unpredictable 57.2 59.3 2.1Excellent capacity and potential ofleaders to implement major change
5.4 2.2 -3.2
% of respondents who ranked themselves as highly effective or strong (depending on scale)

The Conference Board of CanadaThe Conference Board of Canada
Report on Leadership, 2001 Comparison of 1999 and 2001 Results
Leadership… 1999 2001 %
Highly effective at building leadershipcapability
21.4 26.1 4.7
Strong leadership culture 32.1 36.2 4.1Highly effective leadership 27.2 29.0 1.8Highly effective processes, systems,and practices for anticipating andresponding to change
27.3 34.3 7.0
% of respondents who ranked themselves as highly effective or strong (depending on scale)
The Conference Board of CanadaThe Conference Board of Canada
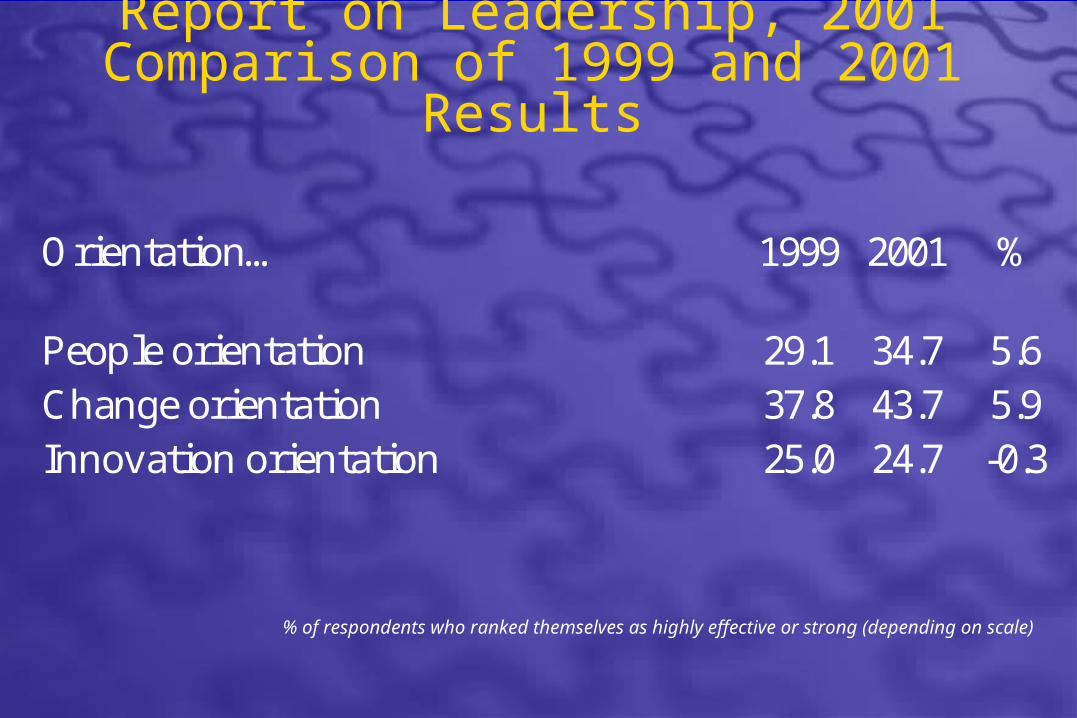
Report on Leadership, 2001Comparison of 1999 and 2001 Results
Orientation… 1999 2001 %
People orientation 29.1 34.7 5.6Change orientation 37.8 43.7 5.9Innovation orientation 25.0 24.7 -0.3
% of respondents who ranked themselves as highly effective or strong (depending on scale)

The Conference Board of CanadaThe Conference Board of Canada
The Conference Board of CanadaInformation for Sound Decisions Since 1954
The Conference Board of CanadaInformation for Sound Decisions Since 1954