Embed Size (px)
Citation preview

THE CONNECTICUT ECONOMIC DIGEST 1December 2017
DECEMBER 2017
Economic Indicators on the Overall Economy ......................... 5 Individual Data Items ......................... 6-8Comparative Regional Data .............. 9Economic Indicator Trends ........ 10-11Help Wanted OnLine ........................ 15Business and Employment ChangesAnnounced in the News Media ...... 19Labor Market Areas: Nonfarm Employment .................... 12-17 Sea. Adj. Nonfarm Employment ..........14 Labor Force ............................................ 18 Hours and Earnings .............................. 19Cities and Towns: Labor Force ..................................... 20-21 Housing Permits .................................... 22Technical Notes ............................... 23At a Glance ....................................... 24
Life in the Slow Lane?.... 1-5
IN THIS ISSUE...
In October...Nonfarm Employment Connecticut..................... 1,680,600 Change over month ............ -0.39% Change over year ................ +0.1%
United States .............. 147,010,000 Change over month ........... +0.18% Change over year ................. +1.4%
Unemployment Rate Connecticut............................. 4.5% United States .......................... 4.1%
Consumer Price Index United States ...................... 246.663 Change over year .................. +2.0%
T
Life in the Slow Lane?
ECONOMIC DIGESTTHE CONNECTICUT
Vol.22 No.12 A joint publication of the Connecticut Department of Labor & the Connecticut Department of Economic and Community Development
By Patrick Flaherty, Assistant Director of Office of Research, DOL
he Connecticut State DataCenter at the University of
Connecticut recently releasedpopulation projections forConnecticut and its townsthrough 2040. The projectionssuggest a slowing of populationgrowth but do not show anexodus of young people fromConnecticut. Declines in theyounger population groups aredriven by a low birth rate whilemigration out of state isconcentrated in older agegroups. Nevertheless, thenumber of senior citizens willincrease while the school-agedpopulation will decline. Growthwill be uneven across cities andtowns with some (particularlythe largest cities) gainingsignificant population while
others decline. Some of thesmallest towns are projected toreverse part of the strong growththey have experienced in recentdecades.
Statewide
Overview Connecticut’s populationincreased by over 255,000 from1970 to 1990 and added anadditional 300,000 from 1990 to2015, a 9.3% increase (Chart 1).Population growth is projected togrow just 1.7% in the 25 yearsfrom 2015 to 2040, less than 20%of the growth rate of the previous25 years. Focusing on the mostrecent 15 year period andcomparing it to the next shows asimilar pattern. Population grew
3,000
3,100
3,200
3,300
3,400
3,500
3,600
3,700
Th
ousands
1970 1980 1990 2000 2010 2020 2030 2040
History
Projection
Total
Chart 1: Connecticut Population
THE CONNECTICUT ECONOMIC DIGEST2 December 2017
ConnecticutDepartment of Labor
Connecticut Departmentof Economic andCommunity Development
THE CONNECTICUT
The Connecticut Economic Digest ispublished monthly by the ConnecticutDepartment of Labor, Office of Research, andthe Connecticut Department of Economic andCommunity Development. Its purpose is toregularly provide users with a comprehensivesource for the most current, up-to-date dataavailable on the workforce and economy of thestate, within perspectives of the region andnation.
The annual subscription is $50. Sendsubscription requests to: The ConnecticutEconomic Digest, Connecticut Department ofLabor, Office of Research, 200 Folly BrookBoulevard, Wethersfield, CT 06109-1114.Make checks payable to the ConnecticutDepartment of Labor. Back issues are $4 percopy. The Digest can be accessed free ofcharge from the DOL Web site. Articles fromThe Connecticut Economic Digest may bereprinted if the source is credited. Please sendcopies of the reprinted material to the ManagingEditor. The views expressed by the authors aretheirs alone and may not reflect those of theDOL or DECD.
Managing Editor: Jungmin Charles Joo
Associate Editor: Erin C. Wilkins
We would like to acknowledge the contributionsof many DOL Research and DECD staff andRob Damroth to the publication of the Digest.
Catherine Smith, CommissionerTim Sullivan, Deputy CommissionerBart Kollen, Deputy Commissioner
450 Columbus BoulevardSuite 5Hartford, CT 06103Phone: (860) 500-2300Fax: (860) 500-2440E-Mail: [email protected]: http://www.decd.org
Scott D. Jackson, CommissionerKurt Westby, Deputy Commissioner
Andrew Condon, Ph.D., DirectorOffice of Research200 Folly Brook BoulevardWethersfield, CT 06109-1114Phone: (860) 263-6275Fax: (860) 263-6263E-Mail: [email protected]: http://www.ctdol.state.ct.us/lmi
ECONOMIC DIGEST5.5% from 2000 to 2015 but isprojected to grow just 1.1% from2015 to 2030. While theseprojections are not predictions ofwhat will happen (unforeseenevents such as changes in theeconomy could affect theseprojections), they are carefullycalculated projections based onfertility rates, survival rates,domestic migration, internationalmigration, and college migration.
Age profile The age profile ofConnecticut’s population willchange during the projectionsperiod. As shown in Chart 2,compared to 2015, in 2040Connecticut is projected to havemore children under age 10,people aged 25 to 44, and age 70and over. On the other hand,there will be fewer aged 10 to 24and 45 to 69.
Focus on 2015-2030 While the longer-term trendsare of interest, many planninghorizons are of shorter duration.2
The rest of this article willcompare the 15 years from 2000to 2015 with the projections for2015 to 2030. The agedistribution of the populationchanged from 2000 to 2015 asthe largest cohort aged into its50s and beyond. There will bemore changes by 2030 (Chart 3)as the number of school andcollege-aged (age 5 to 24) isexpected to decline and thenumber of those mid-twenties tomid-forties is projected toincrease as the millennialgeneration ages. The number ofpeople in the mid-forties throughlate-fifties will decline as the lastof the baby-boomers moves pastage 60. Chart 4 compares the 2015and projected 2030 populationsbut also includes an “Aged 2015”population – that is, arepresentation of what the 2030population would look like ifeveryone in Connecticut in 2015
were still here in 2030 and noone died or moved in or out.Compared to the “Aged 2015”population, the 2030 projectedpopulation shows more peoplefrom age 40 to 54, but fewerpeople aged 55 and above.While some of this is due tonatural decrease (death) themajority of the decline is due tomigration to other states. Forexample, in 2015 the largestfive-year age cohort were thoseaged 50 to 54. By 2030 thereare projected to be more than90,000 fewer people aged 65 to69 than there were people aged50 to 54 in 2015. Three-quarters of this decline is due todomestic net migration (peopleleaving Connecticut for otherstates).
Cities and Towns
Overview In addition to statewideprojections, the ConnecticutState Data Center providespopulation projections by age forevery town in Connecticut.From 1970 to 2000,Connecticut’s largest cities lostpopulation. Hartford had thelargest decline (down 36,439),but Bridgeport (down 17,013),New Haven (down 14,081) andNew Britain (down 11,903) alllost significant population. Onthe other hand, Danbury andsuburban towns such as NewMilford, Glastonbury, Shelton,and Southbury all gained morethan 10,000 residents each withother suburban towns such asCheshire, Guilford, Farmington,South Windsor and Southingtonnot far behind. Since 2000some of this trend has reversed.From 2000 to 2015, New Havengained the most population ofany city or town in Connecticut(+8,245) followed by Danbury,Stamford, Norwich, andBridgeport (+6,313). Hartfordgained more than 3,000residents and New Britain more

THE CONNECTICUT ECONOMIC DIGEST 3December 2017
than 2,000. Towns that lost themost population from 2000 to2015 were Branford, Enfield andGreenwich. When consideringthe towns that are projected tolose population, the Connecticut
State Data Center (CSDC)emphasizes that the projectionsare for resident population. Asnoted on the CSDC website,"Resident population is definedas those persons who usually
reside within a town in the stateof Connecticut (where they liveand sleep majority of the time).Individuals who reside in anotherstate but either own property orwork remotely in a town withinthe state of Connecticut are notincluded in these populationprojections." Looking ahead through 2030,towns expected to gain the mostpopulation are New Haven, WestHaven, Manchester, Bridgeport,Norwich, and Danbury.Greenwich, Westport, Monroe,New Fairfield and Wilton will havethe largest losses. The fivelargest cities in 1970 -- Hartford,Bridgeport, New Haven, Stamfordand Waterbury -- had 60,000fewer residents by 2000, but theyhave been increasing since andare projected to top their 1970population by 2030. On theother hand, the 10 smallesttowns in 1970 gained nearly 60%
20002015
2030
-50
0
50
100
150
200
250
300
Th
ou
san
ds
0 to
4
5 to
9
10 to
14
15 to
19
20 to
24
25 to
29
30 to
34
35 to
39
40 to
44
45 to
49
50 to
54
55 to
59
60 to
64
65 to
69
70 to
74
75 to
79
80 to
84
85 a
nd O
ver
Change 2015 to 2030
By Age Group
Chart 3: Connecticut Population
190
200
210
220
230
2000 2015 2030
Under Age 5
200
210
220
230
240
2000 2015 2030
Age 5 to 9
190
200
210
220
230
240
2000 2015 2030
Age 10 to 14
210
220
230
240
250
260
2000 2015 2030
Age 15 to 19
180
200
220
240
260
2000 2015 2030
Age 20 to 24
200
220
240
260
280
2000 2015 2030
Age 25 to 29
200
220
240
260
280
300
2000 2015 2030
Age 30 to 34
200
220
240
260
280
300
2000 2015 2030
Age 35 to 39
220
240
260
280
300
2000 2015 2030
Age 40 to 44
200
220
240
260
280
300
2000 2015 2030
Age 45 to 49
150
200
250
300
2000 2015 2030
Age 50 to 54
150
200
250
2000 2015 2030
Age 55 to 59
140
160
180
200
220
240
2000 2015 2030
Age 60 to 64
120
140
160
180
200
2000 2015 2030
Age 65 to 69
110
120
130
140
150
2000 2015 2030
Age 70 to 74
90
100
110
120
130
2000 2015 2030
Age 75 to 79
50
60
70
80
90
100
2000 2015 2030
Age 80 to 84
50
60
70
80
90
100
2000 2015 2030
Age 85 and Over
Through 2040 (Thousands)
Chart 2: Population by Age Group

THE CONNECTICUT ECONOMIC DIGEST4 December 2017
by 2015 but are projected todecline through 2040.
School-Aged population Connecticut’s population aged5 to 19 fell by just over 1,000from 2000 to 2015 and isprojected to decline nearly 40,000by 2030. However, some townswill see an expanding school-agedpopulation with three towns(Manchester, Stamford, and West
2030
2015 Aged 15 yrs
2015
-50
0
50
100
150
200
250
300
Th
ousa
nds
0 to
4
5 to
9
10 to
14
15 to
19
20 to
24
25 to
29
30 to
34
35 to
39
40 to
44
45 to
49
50 to
54
55 to
59
60 to
64
65 to
69
70 to
74
75 to
79
80 to
84
85 a
nd O
ver
2030 - 2015 Aged by 15 Years
By Age Group
Chart 4: Connecticut Population
-3,000 -2,000 -1,000 0 1,000 2,000 3,000
RidgefieldWestportNewtown
DarienFairfield
GlastonburyWilton
TrumbullMonroe
MadisonNew Canaan
CheshireNew Milford
TollandGreenwich
New FairfieldSouthington
GuilfordSimsbury
SheltonMilford
HamdenEast Hartford
MiddletownNorwichDanbury
WindhamNew BritainNew Haven
West HavenStamford
Manchester
For this chart "School-Aged" is population aged 5 to 19
Towns with Increase or Decline 1,000 or More
Chart 5: School-Aged Gains or Losses 2015 - 2030
Haven) increasing by more than2,000 school-aged childreneach.3 While the upper end ofthe 5 to 19 age group mayinclude those no longer inschool, for towns losing school-aged population the largestdeclines are all in the age 10 to14 cohort. Similarly, for townsgaining school-aged population,the largest increases are in theage 10 to 14 group. As noted,
these are population projections,not projections of schoolenrollment. Nevertheless, theseprojections suggest there will betowns with significant increasesin school-aged population evenas the statewide number ofpeople of school-age will bedeclining.
Senior population Connecticut is projected tosee an increase of more than84,000 in the population aged 70and over from 2015 to 2030.Nearly every town will see apopulation increase for this agegroup. For example, as shown inChart 6, Oxford, Newtown,Wallingford, and Southington areprojected to see the largestincreases in the population aged70 and above. The enormousincrease in Oxford is a goodillustration of the differencebetween a projection and aforecast and shows thelimitations of the projections.Oxford has seen a significantnumber of seniors moving intotown over recent decades. Themodels used to create theprojections assume this trend willcontinue. A forecast (which triedto predict exactly how manyseniors would be living in Oxfordin 2030) would need to considerother factors such as theavailability of housing for seniorsand not just past trends.Nevertheless, the projections area useful indication of wherethings are headed, even thoughother factors - from economicevents to policy changes - willaffect the course of populationgrowth in Connecticut.
Implications
As the millennial generationages into its 40s, Connecticutmay have an opportunity toattract even more of this largegeneration than the projectionssuggest. The projections mayalso understate the aging of the

THE CONNECTICUT ECONOMIC DIGEST 5December 2017
GENERAL ECONOMIC INDICATORS
Sources: *Dr. Steven P. Lanza, University of Connecticut **Farmington Bank ***Federal Reserve Bank of Philadelphia
General Drift Indicators are composite measures of the four-quarter change in three coincident (Connecticut Manufacturing Production Index, nonfarm employment, andreal personal income) and three leading (housing permits, manufacturing average weekly hours, and initial unemployment claims) economic variables, and are indexed so1996 = 100.
The Farmington Bank Business Barometer is a measure of overall economic growth in the state of Connecticut that is derived from non-manufacturing employment,real disposable personal income, and manufacturing production.
The Philadelphia Fed’s Coincident Index summarizes current economic condition by using four coincident variables: nonfarm payroll employment, average hoursworked in manufacturing, the unemployment rate, and wage and salary disbursements deflated by the consumer price index (U.S. city average).
2Q 2Q CHANGE 1Q(Seasonally adjusted) 2017 2016 NO. % 2017General Drift Indicator (1996=100)* Leading 116.7 118.2 -1.5 -1.3 118.4 Coincident 117.1 117.3 -0.2 -0.2 116.8Farmington Bank Business Barometer (1992=100)** 136.1 135.5 0.6 0.4 135.2
Philadelphia Fed's Coincident Index (July 1992=100)*** Oct Oct Sep(Seasonally adjusted) 2017 2016 2017 Connecticut 183.37 179.74 3.6 2.0 182.70 United States 183.53 178.60 4.9 2.8 183.01
0 250 500 750 1,000 1,250 1,500 1,750 2,000 2,250 2,500
CheshireNaugatuck
West HavenTorrington
HartfordWindsorHamden
GrotonBranford
MiddletownDanbury
BristolShelton
ColchesterSouth Windsor
BridgeportNew Haven
East HamptonNew MilfordFarmington
MeridenBerlin
WatertownGuilford
EllingtonRocky Hill
ManchesterSouthbury
NorwichEast Lyme
MilfordSouthingtonWallingford
NewtownOxford
Towns with Increase of 800 or More from 2015 to 2030
Chart 6: Population Gains Age 70 and Above
population – the 85+ age group isthe most difficult to project andthe groups just under that maynot leave Connecticut at the pacesuggested by the projections. Onthe other hand, the declines inthe school-aged population havealready begun and are likely tocontinue even as some towns andschool districts are facing aninflux of new students.
______________________1 Details about the projectionsincluding on-line data visualizationsare available at http://ctsdc.uconn.edu/. Questions aboutthe methodology for producing theprojections should be directed to theConnecticut State Data Centerthrough the above-referenced website.
2 For example, the Department ofLabor's long term industry and
occupational projections look out 10years.
3 The Connecticut State Data Centerwebsite says that projections are NOTintended for use when consideringindividual school enrollment or schooldistrict enrollment planning as theseprojections do not include schoolenrollment nor include data on schoolchoice or other dynamics related toschool enrollment.
THE CONNECTICUT ECONOMIC DIGEST6 December 2017
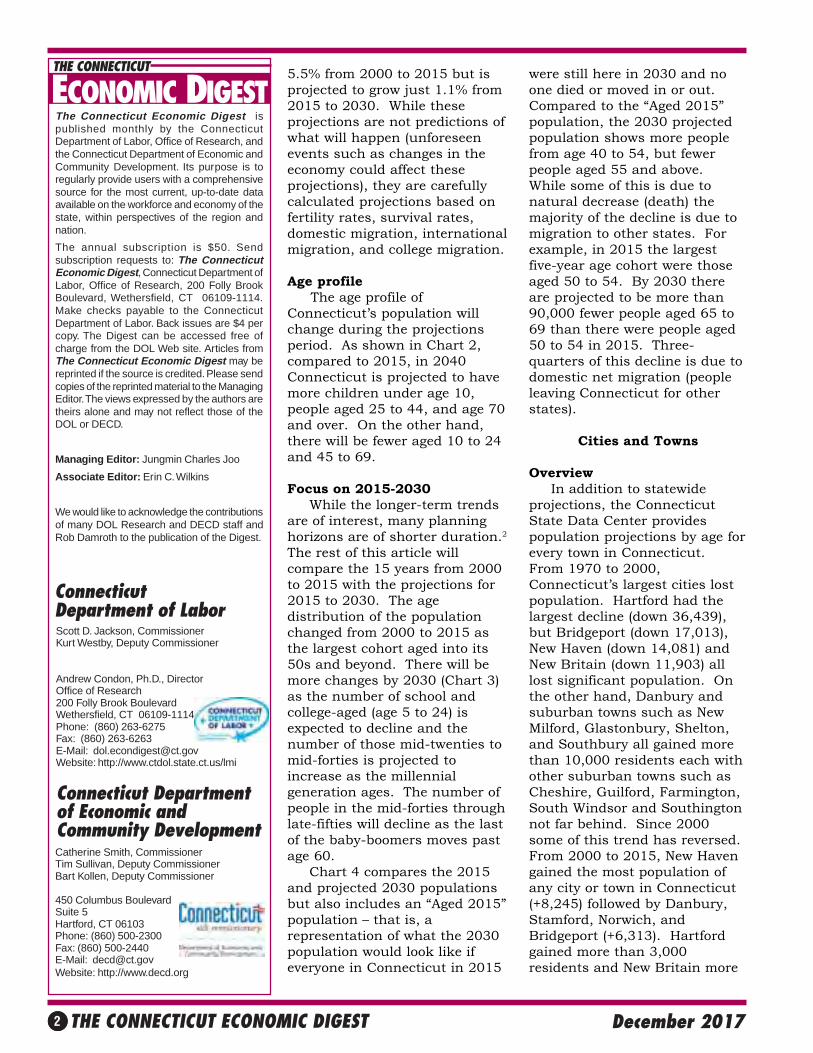
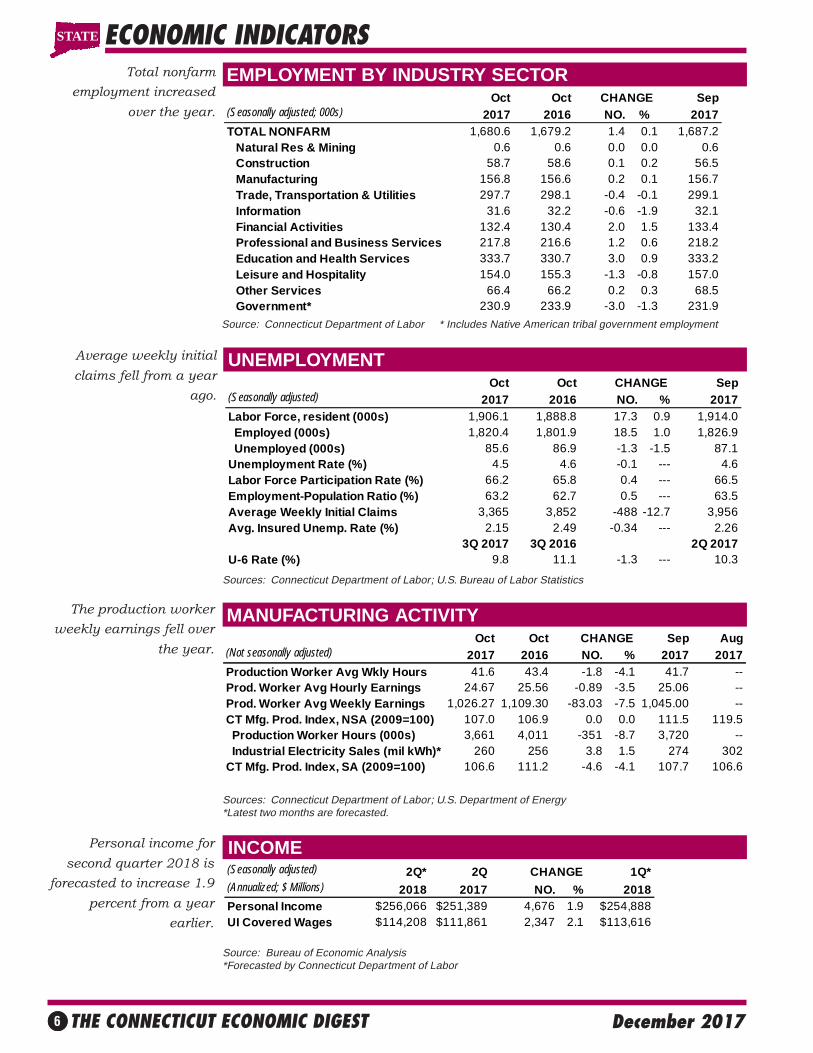
EMPLOYMENT BY INDUSTRY SECTOR
INCOME
Average weekly initial
claims fell from a year
ago.
UNEMPLOYMENT
The production worker
weekly earnings fell over
the year.
MANUFACTURING ACTIVITY
ECONOMIC INDICATORSTotal nonfarm
employment increased
over the year.
Personal income for
second quarter 2018 is
forecasted to increase 1.9
percent from a year
earlier.
Source: Connecticut Department of Labor * Includes Native American tribal government employment
Sources: Connecticut Department of Labor; U.S. Bureau of Labor Statistics
Sources: Connecticut Department of Labor; U.S. Department of Energy*Latest two months are forecasted.
Source: Bureau of Economic Analysis*Forecasted by Connecticut Department of Labor
(Seasonally adjusted) 2Q* 2Q CHANGE 1Q*(Annualized; $ Millions) 2018 2017 NO. % 2018Personal Income $256,066 $251,389 4,676 1.9 $254,888UI Covered Wages $114,208 $111,861 2,347 2.1 $113,616
Oct Oct CHANGE Sep(Seasonally adjusted; 000s) 2017 2016 NO. % 2017TOTAL NONFARM 1,680.6 1,679.2 1.4 0.1 1,687.2 Natural Res & Mining 0.6 0.6 0.0 0.0 0.6 Construction 58.7 58.6 0.1 0.2 56.5 Manufacturing 156.8 156.6 0.2 0.1 156.7 Trade, Transportation & Utilities 297.7 298.1 -0.4 -0.1 299.1 Information 31.6 32.2 -0.6 -1.9 32.1 Financial Activities 132.4 130.4 2.0 1.5 133.4 Professional and Business Services 217.8 216.6 1.2 0.6 218.2 Education and Health Services 333.7 330.7 3.0 0.9 333.2 Leisure and Hospitality 154.0 155.3 -1.3 -0.8 157.0 Other Services 66.4 66.2 0.2 0.3 68.5 Government* 230.9 233.9 -3.0 -1.3 231.9
STATE
Oct Oct CHANGE Sep Aug(Not seasonally adjusted) 2017 2016 NO. % 2017 2017Production Worker Avg Wkly Hours 41.6 43.4 -1.8 -4.1 41.7 --Prod. Worker Avg Hourly Earnings 24.67 25.56 -0.89 -3.5 25.06 --Prod. Worker Avg Weekly Earnings 1,026.27 1,109.30 -83.03 -7.5 1,045.00 --CT Mfg. Prod. Index, NSA (2009=100) 107.0 106.9 0.0 0.0 111.5 119.5 Production Worker Hours (000s) 3,661 4,011 -351 -8.7 3,720 -- Industrial Electricity Sales (mil kWh)* 260 256 3.8 1.5 274 302CT Mfg. Prod. Index, SA (2009=100) 106.6 111.2 -4.6 -4.1 107.7 106.6
Oct Oct CHANGE Sep(Seasonally adjusted) 2017 2016 NO. % 2017Labor Force, resident (000s) 1,906.1 1,888.8 17.3 0.9 1,914.0 Employed (000s) 1,820.4 1,801.9 18.5 1.0 1,826.9 Unemployed (000s) 85.6 86.9 -1.3 -1.5 87.1Unemployment Rate (%) 4.5 4.6 -0.1 --- 4.6Labor Force Participation Rate (%) 66.2 65.8 0.4 --- 66.5Employment-Population Ratio (%) 63.2 62.7 0.5 --- 63.5Average Weekly Initial Claims 3,365 3,852 -488 -12.7 3,956Avg. Insured Unemp. Rate (%) 2.15 2.49 -0.34 --- 2.26
3Q 2017 3Q 2016 2Q 2017U-6 Rate (%) 9.8 11.1 -1.3 --- 10.3
THE CONNECTICUT ECONOMIC DIGEST 7December 2017
TOURISM AND TRAVEL
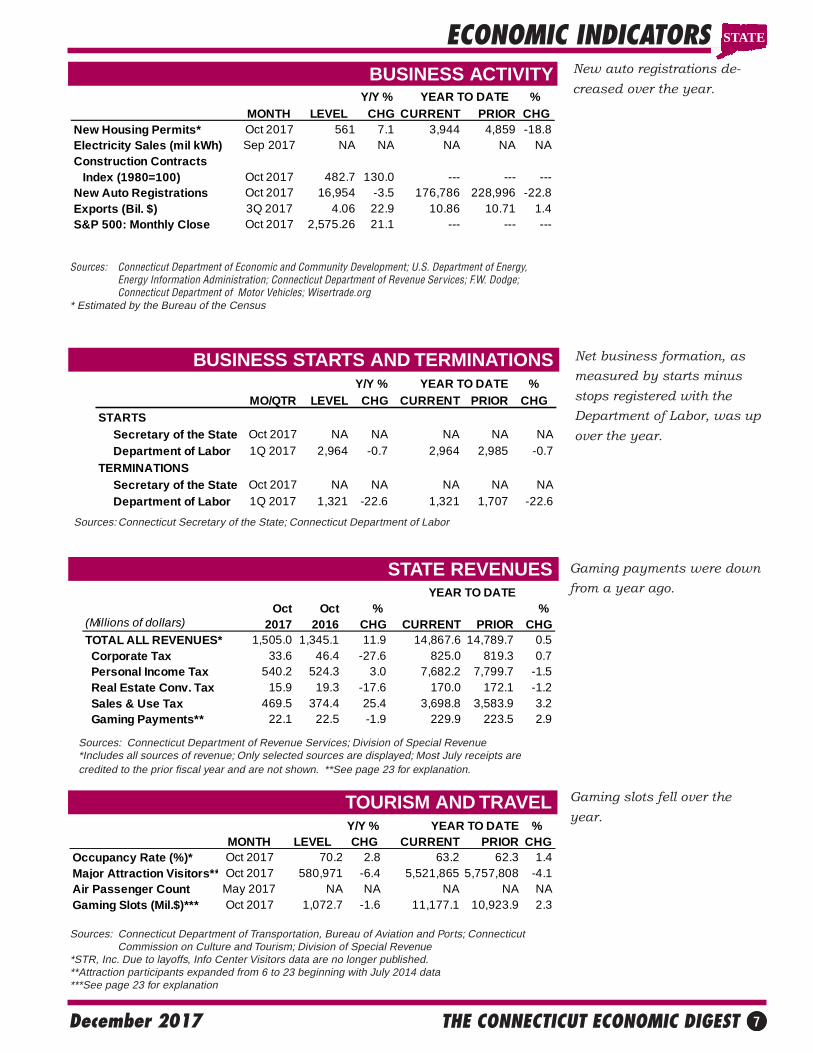
ECONOMIC INDICATORSBUSINESS ACTIVITY New auto registrations de-
creased over the year.
Gaming slots fell over the
year.
BUSINESS STARTS AND TERMINATIONS Net business formation, as
measured by starts minus
stops registered with the
Department of Labor, was up
over the year.
STATE REVENUES
Sources: Connecticut Department of Economic and Community Development; U.S. Department of Energy,Energy Information Administration; Connecticut Department of Revenue Services; F.W. Dodge;Connecticut Department of Motor Vehicles; Wisertrade.org
* Estimated by the Bureau of the Census
Sources: Connecticut Secretary of the State; Connecticut Department of Labor
Oct Oct % % (Millions of dollars) 2017 2016 CHG CURRENT PRIOR CHGTOTAL ALL REVENUES* 1,505.0 1,345.1 11.9 14,867.6 14,789.7 0.5 Corporate Tax 33.6 46.4 -27.6 825.0 819.3 0.7 Personal Income Tax 540.2 524.3 3.0 7,682.2 7,799.7 -1.5 Real Estate Conv. Tax 15.9 19.3 -17.6 170.0 172.1 -1.2 Sales & Use Tax 469.5 374.4 25.4 3,698.8 3,583.9 3.2 Gaming Payments** 22.1 22.5 -1.9 229.9 223.5 2.9
YEAR TO DATE
Sources: Connecticut Department of Revenue Services; Division of Special Revenue*Includes all sources of revenue; Only selected sources are displayed; Most July receipts arecredited to the prior fiscal year and are not shown. **See page 23 for explanation.
Sources: Connecticut Department of Transportation, Bureau of Aviation and Ports; ConnecticutCommission on Culture and Tourism; Division of Special Revenue
*STR, Inc. Due to layoffs, Info Center Visitors data are no longer published.**Attraction participants expanded from 6 to 23 beginning with July 2014 data***See page 23 for explanation
Y/Y % YEAR TO DATE % MONTH LEVEL CHG CURRENT PRIOR CHG
Occupancy Rate (%)* Oct 2017 70.2 2.8 63.2 62.3 1.4Major Attraction Visitors** Oct 2017 580,971 -6.4 5,521,865 5,757,808 -4.1Air Passenger Count May 2017 NA NA NA NA NAGaming Slots (Mil.$)*** Oct 2017 1,072.7 -1.6 11,177.1 10,923.9 2.3
Y/Y % %MO/QTR LEVEL CHG CURRENT PRIOR CHG
STARTS Secretary of the State Oct 2017 NA NA NA NA NA Department of Labor 1Q 2017 2,964 -0.7 2,964 2,985 -0.7
TERMINATIONS Secretary of the State Oct 2017 NA NA NA NA NA Department of Labor 1Q 2017 1,321 -22.6 1,321 1,707 -22.6
YEAR TO DATE
STATE
Gaming payments were down
from a year ago.
Y/Y % YEAR TO DATE % MONTH LEVEL CHG CURRENT PRIOR CHG
New Housing Permits* Oct 2017 561 7.1 3,944 4,859 -18.8Electricity Sales (mil kWh) Sep 2017 NA NA NA NA NAConstruction Contracts Index (1980=100) Oct 2017 482.7 130.0 --- --- ---New Auto Registrations Oct 2017 16,954 -3.5 176,786 228,996 -22.8Exports (Bil. $) 3Q 2017 4.06 22.9 10.86 10.71 1.4S&P 500: Monthly Close Oct 2017 2,575.26 21.1 --- --- ---

THE CONNECTICUT ECONOMIC DIGEST8 December 2017
CONSUMER NEWS
EMPLOYMENT COST INDEXCompensation cost for the
nation rose 2.5 percent
over the year.
Conventional mortgage
rate rose to 3.90 percent
over the month.
INTEREST RATES
ECONOMIC INDICATORS
U.S. inflation rate
was up by 2.0 percent
over the year.
Source: U.S. Department of Labor, Bureau of Labor Statistics
Sources: U.S. Department of Labor, Bureau of Labor Statistics; The Conference Board*Change over prior monthly or quarterly period**The Boston CPI can be used as a proxy for New England and is measured every other month.
Sources: Federal Reserve; Federal Home Loan Mortgage Corp.
Oct Sep Oct(Percent) 2017 2017 2016Prime 4.25 4.25 3.50
Federal Funds 1.15 1.15 0.40
3 Month Treasury Bill 1.09 1.05 0.33
6 Month Treasury Bill 1.25 1.17 0.48
1 Year Treasury Note 1.40 1.28 0.66
3 Year Treasury Note 1.68 1.51 0.99
5 Year Treasury Note 1.98 1.80 1.27
7 Year Treasury Note 2.20 2.03 1.5610 Year Treasury Note 2.36 2.20 1.76
20 Year Treasury Note 2.65 2.53 2.17
Conventional Mortgage 3.90 3.81 3.47
Seasonally Adjusted Not Seasonally AdjustedPrivate Industry Workers Sep Jun 3-Mo Sep Sep 12-Mo(Dec. 2005 = 100) 2017 2017 % Chg 2017 2016 % ChgUNITED STATES TOTAL 130.0 129.0 0.8 130.0 126.8 2.5
Wages and Salaries 129.9 129.0 0.7 130.0 126.7 2.6
Benefit Costs 130.0 129.1 0.7 130.0 127.0 2.4
NORTHEAST TOTAL --- --- --- 131.8 128.2 2.8 Wages and Salaries --- --- --- 131.5 127.7 3.0
STATE
(Not seasonally adjusted) MO/QTR LEVEL Y/Y P/P*CONSUMER PRICES CPI-U (1982-84=100)
U.S. City Average Oct 2017 246.663 2.0 -0.1 Purchasing Power of $ (1982-84=$1.00) Oct 2017 0.405 -2.0 0.1
Northeast Region Oct 2017 260.580 1.5 -0.1
NY-Northern NJ-Long Island Oct 2017 269.575 1.8 -0.2
Boston-Brockton-Nashua** Sep 2017 269.757 2.7 1.2 CPI-W (1982-84=100)
U.S. City Average Oct 2017 240.573 2.1 -0.2
% CHANGE

THE CONNECTICUT ECONOMIC DIGEST 9December 2017
UNEMPLOYMENT RATES
LABOR FORCE
NONFARM EMPLOYMENT
Seven states showed a
decrease in its
unemployment rate over
the year.
All nine states in the
region gained jobs over
the year.
Seven states posted
increases in the labor
force from last year.
COMPARATIVE REGIONAL DATA
Source: U.S. Department of Labor, Bureau of Labor Statistics
Source: U.S. Department of Labor, Bureau of Labor Statistics
Source: U.S. Department of Labor, Bureau of Labor Statistics
Oct Oct CHANGE Sep(Seasonally adjusted; 000s) 2017 2016 NO. % 2017Connecticut 1,680.6 1,679.2 1.4 0.1 1,687.2Maine 621.2 616.0 5.2 0.8 621.4Massachusetts 3,643.5 3,574.5 69.0 1.9 3,638.7New Hampshire 680.6 674.3 6.3 0.9 678.1New Jersey 4,125.7 4,095.7 30.0 0.7 4,124.0New York 9,523.4 9,420.8 102.6 1.1 9,538.0Pennsylvania 5,973.8 5,908.0 65.8 1.1 5,978.1Rhode Island 495.8 491.2 4.6 0.9 496.0Vermont 317.1 313.9 3.2 1.0 317.6United States 147,010.0 145,006.0 2,004.0 1.4 146,749.0
Oct Oct CHANGE Sep(Seasonally adjusted) 2017 2016 NO. % 2017Connecticut 1,906,087 1,888,778 17,309 0.9 1,913,982
Maine 704,153 695,060 9,093 1.3 705,266
Massachusetts 3,656,098 3,585,359 70,739 2.0 3,669,467
New Hampshire 747,906 750,989 -3,083 -0.4 750,028
New Jersey 4,520,764 4,511,792 8,972 0.2 4,524,302
New York 9,712,825 9,530,003 182,822 1.9 9,693,682
Pennsylvania 6,399,091 6,455,269 -56,178 -0.9 6,414,524
Rhode Island 554,495 551,668 2,827 0.5 555,203
Vermont 345,212 345,202 10 0.0 344,734
United States 160,381,000 159,643,000 738,000 0.5 161,146,000
Oct Oct Sep(Seasonally adjusted) 2017 2016 CHANGE 2017Connecticut 4.5 4.6 -0.1 4.6Maine 3.5 3.9 -0.4 3.7Massachusetts 3.7 3.2 0.5 3.9New Hampshire 2.7 2.8 -0.1 2.7New Jersey 4.9 4.8 0.1 4.7New York 4.8 4.9 -0.1 4.9Pennsylvania 4.7 5.5 -0.8 4.8Rhode Island 4.2 5.1 -0.9 4.2Vermont 2.9 3.2 -0.3 2.9United States 4.1 4.8 -0.7 4.2
STATE

THE CONNECTICUT ECONOMIC DIGEST10 December 2017
ECONOMIC INDICATOR TRENDSSTATE
CONSTRUCTION EMP., SA, 000s Month 2015 2016 2017Jan 56.7 59.6 58.0
Feb 56.7 59.6 59.3
Mar 57.0 60.8 59.1
Apr 57.3 59.4 61.7
May 58.1 59.1 61.2
Jun 58.3 58.9 60.5
Jul 57.7 58.8 58.7
Aug 57.8 59.0 57.7
Sep 57.9 58.7 56.5
Oct 58.6 58.6 58.7
Nov 58.8 58.1
Dec 59.2 58.0
MANUFACTURING EMP., SA, 000s Month 2015 2016 2017Jan 156.8 156.5 156.1
Feb 156.6 156.4 155.7
Mar 156.9 156.3 156.6
Apr 157.1 156.2 156.7
May 157.2 156.1 155.8
Jun 157.4 156.1 156.6
Jul 157.1 156.5 156.4
Aug 157.2 156.8 157.0
Sep 157.1 156.4 156.7
Oct 156.7 156.6 156.8
Nov 156.7 156.0
Dec 156.5 156.2
TRADE, TRANSP., & UTILITIES EMP., SA, 000s Month 2015 2016 2017Jan 296.1 298.5 302.4
Feb 295.4 299.0 300.6Mar 295.9 299.3 299.3
Apr 296.0 298.7 296.8
May 296.9 298.4 297.8
Jun 297.9 297.3 298.2
Jul 297.1 298.5 299.9
Aug 296.9 298.7 298.0
Sep 297.3 299.3 299.1
Oct 298.3 298.1 297.7
Nov 298.9 298.5
Dec 298.7 298.1
INFORMATION EMP., SA, 000s Month 2015 2016 2017Jan 32.3 32.5 31.5
Feb 32.3 32.6 31.2
Mar 32.3 32.4 31.5
Apr 32.4 32.2 31.5
May 32.5 32.3 31.3Jun 32.5 32.4 31.9
Jul 32.4 32.3 31.8
Aug 32.5 32.7 31.8
Sep 32.5 32.2 32.1
Oct 32.6 32.2 31.6
Nov 32.6 32.1
Dec 32.5 31.9
100
120
140
160
180
200
220
03 04 05 06 07 08 09 10 11 12 13 14 15 16 17
40
45
50
55
60
65
70
75
03 04 05 06 07 08 09 10 11 12 13 14 15 16 17
20
25
30
35
40
45
03 04 05 06 07 08 09 10 11 12 13 14 15 16 17
260
270
280
290
300
310
320
03 04 05 06 07 08 09 10 11 12 13 14 15 16 17

THE CONNECTICUT ECONOMIC DIGEST 11December 2017
ECONOMIC INDICATOR TRENDS STATE
FINANCIAL ACTIVITIES EMP., SA, 000s Month 2015 2016 2017Jan 129.8 130.1 131.6
Feb 129.7 129.9 131.1
Mar 129.7 130.3 131.2
Apr 130.2 130.2 131.8
May 130.4 129.8 132.3
Jun 130.5 129.8 132.8
Jul 130.1 129.7 133.0
Aug 130.3 129.7 132.1
Sep 130.1 129.7 133.4
Oct 130.1 130.4 132.4
Nov 130.2 130.2
Dec 130.1 130.2
PROFESSIONAL & BUSINESS SERV. EMP., SA, 000s Month 2015 2016 2017Jan 218.0 218.3 217.4
Feb 218.5 218.3 218.6
Mar 218.0 218.7 218.7
Apr 217.5 217.9 215.5
May 219.0 217.7 216.8
Jun 218.9 218.2 216.3
Jul 218.4 218.5 216.4
Aug 218.3 218.6 216.5
Sep 218.1 218.9 218.2
Oct 219.0 216.6 217.8
Nov 219.2 215.8
Dec 218.7 216.4
EDUCATIONAL & HEALTH SERV. EMP., SA, 000s Month 2015 2016 2017Jan 326.6 327.3 327.9
Feb 325.8 328.3 331.8
Mar 325.4 329.4 330.8
Apr 326.3 327.6 330.2
May 326.2 327.3 333.2
Jun 327.6 328.8 333.2
Jul 326.7 330.5 333.4
Aug 326.6 329.9 333.3
Sep 325.6 330.7 333.2
Oct 327.0 330.7 333.7
Nov 327.2 331.2Dec 327.2 331.3
LEISURE AND HOSPITALITY EMP., SA, 000s Month 2015 2016 2017Jan 151.1 152.0 158.4
Feb 150.5 153.1 155.6
Mar 150.6 153.3 156.0
Apr 151.0 152.6 156.4
May 151.7 153.3 156.7
Jun 151.5 153.9 161.1
Jul 150.8 154.3 159.1Aug 150.5 154.8 158.8
Sep 150.9 154.6 157.0
Oct 152.0 155.3 154.0
Nov 151.6 155.3
Dec 151.8 155.3
110
120
130
140
150
160
170
03 04 05 06 07 08 09 10 11 12 13 14 15 16 17
170
180
190
200
210
220
230
03 04 05 06 07 08 09 10 11 12 13 14 15 16 17
220
240
260
280
300
320
340
03 04 05 06 07 08 09 10 11 12 13 14 15 16 17
120
125
130
135
140
145
150
03 04 05 06 07 08 09 10 11 12 13 14 15 16 17

THE CONNECTICUT ECONOMIC DIGEST12 December 2017
Not Seasonally Adjusted
Oct Oct CHANGE Sep2017 2016 NO. % 2017
TOTAL NONFARM EMPLOYMENT…………… 1,692,200 1,691,100 1,100 0.1 1,684,600TOTAL PRIVATE………………………………… 1,458,000 1,453,900 4,100 0.3 1,455,400 GOODS PRODUCING INDUSTRIES………… 219,000 218,800 200 0.1 216,300 CONSTRUCTION, NAT. RES. & MINING.…… 62,500 62,400 100 0.2 59,700 MANUFACTURING…………………………… 156,500 156,400 100 0.1 156,600 Durable Goods………………………………… 122,300 122,500 -200 -0.2 122,400 Fabricated Metal……………………………… 29,400 29,400 0 0.0 29,400 Machinery…………………………………… 13,100 13,400 -300 -2.2 13,200 Computer and Electronic Product………… 10,900 11,500 -600 -5.2 10,900 Transportation Equipment . . . . . . . . . . . . . . 44,000 42,100 1,900 4.5 44,100 Aerospace Product and Parts…………… 28,600 27,800 800 2.9 28,600 Non-Durable Goods………………………… 34,200 33,900 300 0.9 34,200 Chemical……………………………………… 7,200 7,300 -100 -1.4 7,200 SERVICE PROVIDING INDUSTRIES………… 1,473,200 1,472,300 900 0.1 1,468,300 TRADE, TRANSPORTATION, UTILITIES….. 299,000 299,400 -400 -0.1 296,800 Wholesale Trade……………………………… 63,900 63,300 600 0.9 63,500 Retail Trade…………………………………… 180,100 184,100 -4,000 -2.2 178,900 Motor Vehicle and Parts Dealers…………… 21,400 21,300 100 0.5 21,500 Building Material……………………………… 14,900 15,000 -100 -0.7 15,000 Food and Beverage Stores………………… 44,200 44,900 -700 -1.6 44,400 General Merchandise Stores……………… 29,300 29,000 300 1.0 28,900 Transportation, Warehousing, & Utilities…… 55,000 52,000 3,000 5.8 54,400 Utilities………………………………………… 5,300 5,400 -100 -1.9 5,400 Transportation and Warehousing………… 49,700 46,600 3,100 6.7 49,000 INFORMATION………………………………… 31,500 32,100 -600 -1.9 31,800 Telecommunications………………………… 8,300 8,800 -500 -5.7 8,300 FINANCIAL ACTIVITIES……………………… 131,900 129,900 2,000 1.5 132,300 Finance and Insurance……………………… 111,000 109,600 1,400 1.3 111,300 Credit Intermediation and Related………… 24,800 24,800 0 0.0 24,900 Financial Investments and Related………… 26,700 26,000 700 2.7 26,800 Insurance Carriers & Related Activities…… 59,500 58,800 700 1.2 59,600 Real Estate and Rental and Leasing……… 20,900 20,300 600 3.0 21,000 PROFESSIONAL & BUSINESS SERVICES 219,400 218,300 1,100 0.5 219,300 Professional, Scientific……………………… 97,700 95,900 1,800 1.9 97,500 Legal Services……………………………… 12,200 12,700 -500 -3.9 12,400 Computer Systems Design………………… 25,300 25,800 -500 -1.9 25,300 Management of Companies………………… 31,700 32,300 -600 -1.9 31,800 Administrative and Support………………… 90,000 90,100 -100 -0.1 90,000 Employment Services……………………… 28,500 28,900 -400 -1.4 28,700 EDUCATION AND HEALTH SERVICES…… 337,500 334,500 3,000 0.9 332,900 Educational Services………………………… 68,300 68,100 200 0.3 64,300 Health Care and Social Assistance………… 269,200 266,400 2,800 1.1 268,600 Hospitals……………………………………… 59,400 58,700 700 1.2 59,400 Nursing & Residential Care Facilities……… 62,700 62,200 500 0.8 62,500 Social Assistance…………………………… 56,800 57,500 -700 -1.2 56,500 LEISURE AND HOSPITALITY………………… 153,600 155,000 -1,400 -0.9 158,100 Arts, Entertainment, and Recreation………… 27,300 25,900 1,400 5.4 29,000 Accommodation and Food Services………… 126,300 129,100 -2,800 -2.2 129,100 Food Serv., Restaurants, Drinking Places… 114,400 117,300 -2,900 -2.5 117,000 OTHER SERVICES…………………………… 66,100 65,900 200 0.3 67,900 GOVERNMENT ………………………………… 234,200 237,200 -3,000 -1.3 229,200 Federal Government………………………… 17,900 17,900 0 0.0 18,000 State Government……………………………. 65,700 67,600 -1,900 -2.8 62,700 Local Government**…………………………… 150,600 151,700 -1,100 -0.7 148,500
CONNECTICUT
NONFARM EMPLOYMENT ESTIMATES
Current month’s data are preliminary. Prior months’ data have been revised. All data are benchmarked to March 2016. *Total excludes workers idled due to labor-management disputes. **Includes Indian tribal government employment
STATE

THE CONNECTICUT ECONOMIC DIGEST 13December 2017
DANBURY LMA
BRIDGEPORT -STAMFORD LMA
NONFARM EMPLOYMENT ESTIMATES
Current month’s data are preliminary. Prior months’ data have been revised. All data are benchmarked to March 2016. *Total excludes workers idled due to labor-management disputes.
LMA
Not Seasonally Adjusted
Oct Oct CHANGE Sep2017 2016 NO. % 2017
TOTAL NONFARM EMPLOYMENT…………… 412,800 409,900 2,900 0.7 413,400TOTAL PRIVATE………………………………… 368,600 365,900 2,700 0.7 369,100 GOODS PRODUCING INDUSTRIES………… 42,200 41,700 500 1.2 41,500 CONSTRUCTION, NAT. RES. & MINING.…… 13,500 12,500 1,000 8.0 12,800 MANUFACTURING…………………………… 28,700 29,200 -500 -1.7 28,700 Durable Goods………………………………… 22,300 22,900 -600 -2.6 22,400 SERVICE PROVIDING INDUSTRIES………… 370,600 368,200 2,400 0.7 371,900 TRADE, TRANSPORTATION, UTILITIES….. 69,800 71,000 -1,200 -1.7 69,200 Wholesale Trade……………………………… 13,600 13,500 100 0.7 13,500 Retail Trade…………………………………… 45,200 47,200 -2,000 -4.2 44,800 Transportation, Warehousing, & Utilities…… 11,000 10,300 700 6.8 10,900 INFORMATION………………………………… 12,500 12,600 -100 -0.8 12,600 FINANCIAL ACTIVITIES……………………… 43,500 41,100 2,400 5.8 43,400 Finance and Insurance……………………… 36,400 34,100 2,300 6.7 36,300 Credit Intermediation and Related………… 8,700 9,000 -300 -3.3 8,800 Financial Investments and Related………… 17,300 17,300 0 0.0 17,300 PROFESSIONAL & BUSINESS SERVICES 63,900 65,800 -1,900 -2.9 64,500 Professional, Scientific……………………… 30,700 29,900 800 2.7 30,500 Administrative and Support………………… 22,900 24,600 -1,700 -6.9 23,900 EDUCATION AND HEALTH SERVICES…… 75,200 72,900 2,300 3.2 74,900 Health Care and Social Assistance………… 62,600 60,600 2,000 3.3 62,900 LEISURE AND HOSPITALITY………………… 43,600 42,800 800 1.9 44,600 Accommodation and Food Services………… 33,600 32,800 800 2.4 34,300 OTHER SERVICES…………………………… 17,900 18,000 -100 -0.6 18,400 GOVERNMENT ………………………………… 44,200 44,000 200 0.5 44,300 Federal………………………………………… 2,500 2,500 0 0.0 2,500 State & Local…………………………………… 41,700 41,500 200 0.5 41,800
Not Seasonally Adjusted
Oct Oct CHANGE Sep2017 2016 NO. % 2017
TOTAL NONFARM EMPLOYMENT…………… 79,700 79,200 500 0.6 79,700TOTAL PRIVATE………………………………… 69,200 68,700 500 0.7 69,300 GOODS PRODUCING INDUSTRIES………… 12,200 12,200 0 0.0 12,300 SERVICE PROVIDING INDUSTRIES………… 67,500 67,000 500 0.7 67,400 TRADE, TRANSPORTATION, UTILITIES….. 17,100 17,400 -300 -1.7 17,100 Retail Trade…………………………………… 12,000 12,900 -900 -7.0 12,000 PROFESSIONAL & BUSINESS SERVICES 9,500 9,500 0 0.0 9,600 LEISURE AND HOSPITALITY………………… 7,400 7,400 0 0.0 7,600 GOVERNMENT ………………………………… 10,500 10,500 0 0.0 10,400 Federal………………………………………… 700 700 0 0.0 700 State & Local…………………………………… 9,800 9,800 0 0.0 9,700

THE CONNECTICUT ECONOMIC DIGEST14 December 2017
HARTFORD LMA
NONFARM EMPLOYMENT ESTIMATESLMA
SEASONALLY ADJUSTED TOTAL NONFARM EMPLOYMENT
Current month’s data are preliminary. Prior months’ data have been revised. All data are benchmarked to March 2016.*Total excludes workers idled due to labor-management disputes
** Unofficial seasonally adjusted estimates produced by the Connecticut Department of Labor
Not Seasonally Adjusted
Oct Oct CHANGE Sep2017 2016 NO. % 2017
TOTAL NONFARM EMPLOYMENT…………… 575,900 576,900 -1,000 -0.2 572,400TOTAL PRIVATE………………………………… 489,500 488,700 800 0.2 488,300 GOODS PRODUCING INDUSTRIES………… 77,000 77,200 -200 -0.3 76,200 CONSTRUCTION, NAT. RES. & MINING.…… 20,600 21,500 -900 -4.2 19,800 MANUFACTURING…………………………… 56,400 55,700 700 1.3 56,400 Durable Goods………………………………… 46,400 46,100 300 0.7 46,400 Non-Durable Goods………………………… 10,000 9,600 400 4.2 10,000 SERVICE PROVIDING INDUSTRIES………… 498,900 499,700 -800 -0.2 496,200 TRADE, TRANSPORTATION, UTILITIES….. 91,300 90,800 500 0.6 91,200 Wholesale Trade……………………………… 18,900 18,500 400 2.2 18,600 Retail Trade…………………………………… 53,800 55,200 -1,400 -2.5 54,400 Transportation, Warehousing, & Utilities…… 18,600 17,100 1,500 8.8 18,200 Transportation and Warehousing………… 17,700 16,200 1,500 9.3 17,300 INFORMATION………………………………… 11,300 11,500 -200 -1.7 11,300 FINANCIAL ACTIVITIES……………………… 56,500 57,400 -900 -1.6 56,600 Depository Credit Institutions……………… 6,100 6,100 0 0.0 6,100 Insurance Carriers & Related Activities…… 36,300 36,900 -600 -1.6 36,300 PROFESSIONAL & BUSINESS SERVICES 77,000 73,800 3,200 4.3 75,600 Professional, Scientific……………………… 35,000 33,700 1,300 3.9 34,900 Management of Companies………………… 10,300 10,500 -200 -1.9 10,300 Administrative and Support………………… 31,700 29,600 2,100 7.1 30,400 EDUCATION AND HEALTH SERVICES…… 108,400 107,900 500 0.5 107,500 Educational Services………………………… 13,000 14,300 -1,300 -9.1 12,400 Health Care and Social Assistance………… 95,400 93,600 1,800 1.9 95,100 Ambulatory Health Care…………………… 31,000 31,500 -500 -1.6 31,300 LEISURE AND HOSPITALITY………………… 45,700 47,900 -2,200 -4.6 46,800 Accommodation and Food Services………… 37,600 40,600 -3,000 -7.4 38,000 OTHER SERVICES…………………………… 22,300 22,200 100 0.5 23,100 GOVERNMENT ………………………………… 86,400 88,200 -1,800 -2.0 84,100 Federal………………………………………… 5,400 5,300 100 1.9 5,400 State & Local…………………………………… 81,000 82,900 -1,900 -2.3 78,700
Seasonally AdjustedOct Oct CHANGE Sep
Labor Market Areas 2017 2016 NO. % 2017 BRIDGEPORT-STAMFORD LMA……………… 411,800 408,800 3,000 0.7 412,500 DANBURY LMA………………………………… 79,100 78,600 500 0.6 79,900 HARTFORD LMA………………………………… 571,300 572,300 -1,000 -0.2 571,300 NEW HAVEN LMA……………………………… 284,000 281,900 2,100 0.7 286,500 NORWICH-NEW LONDON LMA……………… 129,400 129,200 200 0.2 129,400 WATERBURY LMA……………………………… 66,900 67,200 -300 -0.4 67,000 ENFIELD LMA**………………………………… 45,000 44,900 100 0.2 44,700 TORRINGTON-NORTHWEST LMA**………… 32,800 32,800 0 0.0 33,000 DANIELSON-NORTHEAST LMA**…………… 27,100 27,000 100 0.4 27,100

THE CONNECTICUT ECONOMIC DIGEST 15December 2017
NEW HAVEN LMA
NONFARM EMPLOYMENT ESTIMATES
Current month’s data are preliminary. Prior months’ data have been revised. All data are benchmarked to March 2016. *Total excludes workers idled due to labor-management disputes. **Value less than 50
LMA
HELP WANTED ONLINE
* A percent of advertised vacancies per 100 persons in labor forceSource: The Conference Board
CT online labor demandrose 700 in October 2017
The Conference Board’s HelpWanted OnLine (HWOL) datareported that there were 66,100advertisements for Connecticut-based jobs in October 2017, a1.1 percent increase over themonth but a 3.6 percent de-crease over the year. There were3.45 advertised vacancies forevery 100 persons inConnecticut’s labor force, whilenationally it was 2.83 percent.Among the New England states,Massachusetts had the highestlabor demand rate (3.68), whileMaine had the lowest rate (2.30).
The Conference Board Help Wanted OnLine® Data Series (HWOL) measures the number ofnew, first-time online jobs and jobs reposted from the previous month for over 16,000 Internet jobboards, corporate boards and smaller job sites that serve niche markets and smaller geographicareas. Background information and technical notes and discussion of revisions to the series areavailable at: www.conference-board.org/data/helpwantedonline.cfm.
Not Seasonally Adjusted
Oct Oct CHANGE Sep2017 2016 NO. % 2017
TOTAL NONFARM EMPLOYMENT…………… 286,700 284,700 2,000 0.7 286,800 TOTAL PRIVATE………………………………… 250,700 249,000 1,700 0.7 250,600 GOODS PRODUCING INDUSTRIES………… 34,200 34,600 -400 -1.2 33,900 CONSTRUCTION, NAT. RES. & MINING.…… 11,400 11,200 200 1.8 11,000 MANUFACTURING…………………………… 22,800 23,400 -600 -2.6 22,900 Durable Goods………………………………… 16,400 17,000 -600 -3.5 16,500 SERVICE PROVIDING INDUSTRIES………… 252,500 250,100 2,400 1.0 252,900 TRADE, TRANSPORTATION, UTILITIES….. 52,300 51,900 400 0.8 51,600 Wholesale Trade……………………………… 11,700 11,600 100 0.9 11,700 Retail Trade…………………………………… 30,300 30,700 -400 -1.3 29,700 Transportation, Warehousing, & Utilities…… 10,300 9,600 700 7.3 10,200 INFORMATION………………………………… 3,100 3,200 -100 -3.1 3,100 FINANCIAL ACTIVITIES……………………… 12,600 12,500 100 0.8 12,700 Finance and Insurance……………………… 8,800 8,800 0 0.0 8,800 PROFESSIONAL & BUSINESS SERVICES 30,500 30,700 -200 -0.7 31,300 Administrative and Support………………… 14,600 14,700 -100 -0.7 14,600 EDUCATION AND HEALTH SERVICES…… 82,000 81,100 900 1.1 80,300 Educational Services………………………… 32,100 31,100 1,000 3.2 30,500 Health Care and Social Assistance………… 49,900 50,000 -100 -0.2 49,800 LEISURE AND HOSPITALITY………………… 25,000 24,000 1,000 4.2 26,500 Accommodation and Food Services………… 21,100 21,000 100 0.5 22,000 OTHER SERVICES…………………………… 11,000 11,000 0 0.0 11,200 GOVERNMENT ………………………………… 36,000 35,700 300 0.8 36,200 Federal………………………………………… 5,000 4,900 100 2.0 4,900 State & Local…………………………………… 31,000 30,800 200 0.6 31,300
Oct Oct Sep(Seasonally adjusted) 2017 2016 2017CT Vacancies (000s) 66.1 68.6 65.4
Hartford Vac. (000s) 26.2 27.6 25.8
Connecticut 3.45 3.63 3.42
United States 2.83 3.14 2.78
Maine 2.30 3.62 2.32
Massachusetts 3.68 4.09 3.64
New Hampshire 3.02 3.47 2.97Rhode Island 2.52 2.85 2.50
Vermont 2.83 3.88 2.88
Labor Demand Rate *

THE CONNECTICUT ECONOMIC DIGEST16 December 2017
NORWICH-NEW LONDON-WESTERLY, CT-RI LMA
Current month’s data are preliminary. Prior months’ data have been revised. All data are benchmarked to March 2016. *Total excludes workers idled due to labor-management disputes. **Includes Indian tribal government employment.
NONFARM EMPLOYMENT ESTIMATES
WATERBURY LMA
LMA
Not Seasonally Adjusted
Oct Oct CHANGE Sep2017 2016 NO. % 2017
TOTAL NONFARM EMPLOYMENT…………… 130,000 129,800 200 0.2 129,800TOTAL PRIVATE………………………………… 99,900 98,500 1,400 1.4 99,500 GOODS PRODUCING INDUSTRIES………… 22,200 21,200 1,000 4.7 21,800 CONSTRUCTION, NAT. RES. & MINING.…… 5,000 4,600 400 8.7 4,500 MANUFACTURING…………………………… 17,200 16,600 600 3.6 17,300 Durable Goods………………………………… 14,000 13,300 700 5.3 14,000 Non-Durable Goods………………………… 3,200 3,300 -100 -3.0 3,300 SERVICE PROVIDING INDUSTRIES………… 107,800 108,600 -800 -0.7 108,000 TRADE, TRANSPORTATION, UTILITIES….. 24,100 23,200 900 3.9 23,500 Wholesale Trade……………………………… 2,600 2,600 0 0.0 2,600 Retail Trade…………………………………… 16,800 16,200 600 3.7 16,200 Transportation, Warehousing, & Utilities…… 4,700 4,400 300 6.8 4,700 INFORMATION………………………………… 1,100 1,100 0 0.0 1,100 FINANCIAL ACTIVITIES……………………… 2,800 2,800 0 0.0 2,800 PROFESSIONAL & BUSINESS SERVICES 8,900 8,900 0 0.0 8,900 EDUCATION AND HEALTH SERVICES…… 20,600 21,200 -600 -2.8 20,400 Health Care and Social Assistance………… 17,700 18,300 -600 -3.3 17,800 LEISURE AND HOSPITALITY………………… 16,600 16,500 100 0.6 17,300 Accommodation and Food Services………… 14,300 14,500 -200 -1.4 14,800 Food Serv., Restaurants, Drinking Places… 12,300 12,100 200 1.7 12,700 OTHER SERVICES…………………………… 3,600 3,600 0 0.0 3,700 GOVERNMENT ………………………………… 30,100 31,300 -1,200 -3.8 30,300 Federal………………………………………… 2,800 2,800 0 0.0 2,800 State & Local**………………………………… 27,300 28,500 -1,200 -4.2 27,500
Not Seasonally Adjusted
Oct Oct CHANGE Sep 2017 2016 NO. % 2017
TOTAL NONFARM EMPLOYMENT…………… 67,300 67,700 -400 -0.6 67,200TOTAL PRIVATE………………………………… 56,900 57,300 -400 -0.7 57,100 GOODS PRODUCING INDUSTRIES………… 10,600 10,400 200 1.9 10,500 CONSTRUCTION, NAT. RES. & MINING.…… 2,900 2,700 200 7.4 2,800 MANUFACTURING…………………………… 7,700 7,700 0 0.0 7,700 SERVICE PROVIDING INDUSTRIES………… 56,700 57,300 -600 -1.0 56,700 TRADE, TRANSPORTATION, UTILITIES….. 13,100 13,200 -100 -0.8 13,100 Wholesale Trade……………………………… 2,100 2,100 0 0.0 2,100 Retail Trade…………………………………… 9,100 9,200 -100 -1.1 9,100 Transportation, Warehousing, & Utilities…… 1,900 1,900 0 0.0 1,900 INFORMATION………………………………… 600 600 0 0.0 600 FINANCIAL ACTIVITIES……………………… 1,900 2,000 -100 -5.0 1,900 PROFESSIONAL & BUSINESS SERVICES 5,300 5,400 -100 -1.9 5,300 EDUCATION AND HEALTH SERVICES…… 17,400 17,400 0 0.0 17,300 Health Care and Social Assistance………… 16,000 15,900 100 0.6 16,000 LEISURE AND HOSPITALITY………………… 5,400 5,700 -300 -5.3 5,700 OTHER SERVICES…………………………… 2,600 2,600 0 0.0 2,700 GOVERNMENT ………………………………… 10,400 10,400 0 0.0 10,100 Federal………………………………………… 500 500 0 0.0 500 State & Local…………………………………… 9,900 9,900 0 0.0 9,600

THE CONNECTICUT ECONOMIC DIGEST 17December 2017
NONFARM EMPLOYMENT ESTIMATES
NOTE: More industry detail data is available for the State and its nine labor market areas at: http://www.ctdol.state.ct.us/lmi/202/covered.htm. The data published there differ from the data in the preced-ing tables in that they are developed from a near-universe count of Connecticut employment covered bythe unemployment insurance (UI) program, while the data here is sample-based. The data drawn fromthe UI program does not contain estimates of employment not covered by unemployment insurance, andis lagged several months behind the current employment estimates presented here.
SMALLER LMAS*
Current month’s data are preliminary. Prior months’ data have been revised. All data are benchmarked to March 2016. *Total excludes workers idled due to labor-management disputes.
SPRINGFIELD, MA-CTNECTA**
** New England City and Town Area
LMA
For further information on these nonfarm employment estimates contact Lincoln Dyer at (860) 263-6292.
Not Seasonally Adjusted
Oct Oct CHANGE Sep 2017 2016 NO. % 2017
TOTAL NONFARM EMPLOYMENT ENFIELD LMA…………………………………… 45,200 45,000 200 0.4 44,700 TORRINGTON-NORTHWEST LMA…………… 33,300 33,200 100 0.3 33,300 DANIELSON-NORTHEAST LMA……………… 27,300 27,200 100 0.4 27,200
Not Seasonally Adjusted
Oct Oct CHANGE Sep2017 2016 NO. % 2017
TOTAL NONFARM EMPLOYMENT…………… 345,400 339,200 6,200 1.8 340,800TOTAL PRIVATE………………………………… 279,100 273,500 5,600 2.0 276,900 GOODS PRODUCING INDUSTRIES………… 41,400 40,300 1,100 2.7 41,600 CONSTRUCTION, NAT. RES. & MINING.…… 12,900 11,700 1,200 10.3 13,100 MANUFACTURING…………………………… 28,500 28,600 -100 -0.3 28,500 Durable Goods………………………………… 19,500 19,500 0 0.0 19,500 Non-Durable Goods………………………… 9,000 9,100 -100 -1.1 9,000 SERVICE PROVIDING INDUSTRIES………… 304,000 298,900 5,100 1.7 299,200 TRADE, TRANSPORTATION, UTILITIES….. 62,100 59,800 2,300 3.8 61,500 Wholesale Trade……………………………… 11,600 11,400 200 1.8 11,600 Retail Trade…………………………………… 36,600 34,900 1,700 4.9 36,100 Transportation, Warehousing, & Utilities…… 13,900 13,500 400 3.0 13,800 INFORMATION………………………………… 3,400 3,400 0 0.0 3,400 FINANCIAL ACTIVITIES……………………… 16,900 16,800 100 0.6 16,900 Finance and Insurance……………………… 13,500 13,400 100 0.7 13,500 Insurance Carriers & Related Activities…… 8,900 9,000 -100 -1.1 9,000 PROFESSIONAL & BUSINESS SERVICES 28,800 27,100 1,700 6.3 28,600 EDUCATION AND HEALTH SERVICES…… 83,600 81,900 1,700 2.1 81,800 Educational Services………………………… 16,100 15,700 400 2.5 14,900 Health Care and Social Assistance………… 67,500 66,200 1,300 2.0 66,900 LEISURE AND HOSPITALITY………………… 29,600 31,400 -1,800 -5.7 29,900 OTHER SERVICES…………………………… 13,300 12,800 500 3.9 13,200 GOVERNMENT ………………………………… 66,300 65,700 600 0.9 63,900 Federal………………………………………… 5,900 6,100 -200 -3.3 5,900 State & Local…………………………………… 60,400 59,600 800 1.3 58,000
* State-designated Non-CES areas

THE CONNECTICUT ECONOMIC DIGEST18 December 2017
LABOR FORCE ESTIMATES
Current month’s data are preliminary. Prior months’ data have been revised. All data are benchmarked to March 2016.
EMPLOYMENT Oct Oct CHANGE Sep(Not seasonally adjusted) STATUS 2017 2016 NO. % 2017
CONNECTICUT Civilian Labor Force 1,899,400 1,885,700 13,700 0.7 1,896,400Employed 1,817,400 1,806,300 11,100 0.6 1,820,200
Unemployed 82,000 79,400 2,600 3.3 76,200Unemployment Rate 4.3 4.2 0.1 --- 4.0
BRIDGEPORT-STAMFORD LMA Civilian Labor Force 465,700 461,600 4,100 0.9 467,300Employed 445,600 442,300 3,300 0.7 448,700
Unemployed 20,100 19,300 800 4.1 18,700Unemployment Rate 4.3 4.2 0.1 --- 4.0
DANBURY LMA Civilian Labor Force 107,200 106,500 700 0.7 107,400Employed 103,600 102,900 700 0.7 104,000
Unemployed 3,700 3,600 100 2.8 3,500Unemployment Rate 3.4 3.4 0.0 --- 3.2
DANIELSON-NORTHEAST LMA Civilian Labor Force 43,600 43,100 500 1.2 43,200Employed 41,700 41,200 500 1.2 41,400
Unemployed 1,900 1,900 0 0.0 1,800Unemployment Rate 4.4 4.4 0.0 --- 4.1
ENFIELD LMA Civilian Labor Force 51,300 50,400 900 1.8 50,600Employed 49,200 48,200 1,000 2.1 48,600
Unemployed 2,100 2,100 0 0.0 1,900Unemployment Rate 4.1 4.2 -0.1 --- 3.8
HARTFORD LMA Civilian Labor Force 620,200 617,600 2,600 0.4 617,200Employed 593,300 591,800 1,500 0.3 592,100
Unemployed 26,900 25,800 1,100 4.3 25,100Unemployment Rate 4.3 4.2 0.1 --- 4.1
NEW HAVEN LMA Civilian Labor Force 326,600 323,300 3,300 1.0 326,600Employed 312,400 309,500 2,900 0.9 313,400
Unemployed 14,200 13,700 500 3.6 13,200Unemployment Rate 4.3 4.2 0.1 --- 4.0
NORWICH-NEW LONDON LMA Civilian Labor Force 142,400 141,700 700 0.5 142,000Employed 136,400 135,600 800 0.6 136,400
Unemployed 6,000 6,100 -100 -1.6 5,600Unemployment Rate 4.2 4.3 -0.1 --- 3.9
TORRINGTON-NORTHWEST LMA Civilian Labor Force 47,000 46,900 100 0.2 47,000Employed 45,100 45,200 -100 -0.2 45,300
Unemployed 1,900 1,800 100 5.6 1,700Unemployment Rate 4.0 3.8 0.2 --- 3.6
WATERBURY LMA Civilian Labor Force 111,100 110,500 600 0.5 110,700Employed 105,100 104,600 500 0.5 105,400
Unemployed 5,900 5,800 100 1.7 5,400Unemployment Rate 5.3 5.3 0.0 --- 4.9
UNITED STATES Civilian Labor Force 160,465,000 159,783,000 682,000 0.4 161,049,000Employed 154,223,000 152,335,000 1,888,000 1.2 154,494,000
Unemployed 6,242,000 7,447,000 -1,205,000 -16.2 6,556,000Unemployment Rate 3.9 4.7 -0.8 --- 4.1
LMA

THE CONNECTICUT ECONOMIC DIGEST 19December 2017
HOURS AND EARNINGS
Current month’s data are preliminary. Prior months’ data have been revised. All data are benchmarked to March 2016.
BUSINESS AND EMPLOYMENT CHANGES ANNOUNCED IN THE NEWS MEDIA
Pratt and Whitney dedicated its new $180 million Engineering and Technology Center in East Hartford.Roughly 1,600 engineers are being moved 200 or 300 at a time into the facility, which is designed to houseup to 1,750.
ASML announced its plans to add several hundred more employees over the next couple of years to the1,200 already working in Wilton. The company has hired 180 this year and plans to add another 200 or sonext year.
New Haven-based Clifford Beers Clinic opened its new Marne Street Clinic in Hamden.
Prime Taco opened its newest restaurant in Ridgefield.
Konica-Minolta is looking to consolidate operations and move its facility in Windsor to New Jersey. Morethan 500 jobs may be affected by the move.
Marriott plans to lay off 107 Stamford employees in December, increasing total job cuts to 330, since itacquired Starwood Hotels and Resorts Worldwide last year. The downsizing will continue into next year.
MetLife is laying off 61 workers in Bloomfield.
LMA
AVG WEEKLY EARNINGS AVG WEEKLY HOURS AVG HOURLY EARNINGSOct CHG Sep Oct CHG Sep Oct CHG Sep
(Not seasonally adjusted) 2017 2016 Y/Y 2017 2017 2016 Y/Y 2017 2017 2016 Y/Y 2017
PRODUCTION WORKERMANUFACTURING $1,026.27 $1,109.30 -$83.03 $1,045.00 41.6 43.4 -1.8 41.7 $24.67 $25.56 -$0.89 $25.06 DURABLE GOODS 1,058.80 1,149.30 -90.50 1,083.73 42.2 43.9 -1.7 42.3 25.09 26.18 -1.09 25.62 NON-DUR. GOODS 912.06 956.16 -44.11 910.40 39.5 41.5 -2.0 39.6 23.09 23.04 0.05 22.99CONSTRUCTION 1,205.60 1,154.03 51.57 1,199.17 40.0 38.7 1.3 40.2 30.14 29.82 0.32 29.83
ALL EMPLOYEESSTATEWIDETOTAL PRIVATE 1,071.68 1,058.49 13.19 1,047.80 34.0 34.2 -0.2 33.8 31.52 30.95 0.57 31.00GOODS PRODUCING 1,239.03 1,245.27 -6.24 1,235.58 39.0 40.3 -1.3 39.2 31.77 30.90 0.87 31.52 Construction 1,239.94 1,196.98 42.96 1,192.28 38.4 38.8 -0.4 38.3 32.29 30.85 1.44 31.13 Manufacturing 1,228.85 1,268.96 -40.12 1,252.51 39.5 41.2 -1.7 39.8 31.11 30.80 0.31 31.47SERVICE PROVIDING 1,041.66 1,024.78 16.88 1,016.28 33.1 33.1 0.0 32.9 31.47 30.96 0.51 30.89 Trade, Transp., Utilities 850.86 907.69 -56.83 867.24 32.6 33.2 -0.6 32.9 26.10 27.34 -1.24 26.36 Financial Activities 1,864.66 1,825.78 38.88 1,714.21 38.0 38.6 -0.6 37.0 49.07 47.30 1.77 46.33 Prof. & Business Serv. 1,279.82 1,249.92 29.90 1,267.00 35.6 35.6 0.0 35.5 35.95 35.11 0.84 35.69 Education & Health Ser. 937.90 906.50 31.40 933.40 32.6 32.1 0.5 32.5 28.77 28.24 0.53 28.72 Leisure & Hospitality 443.50 429.94 13.56 436.64 25.8 25.9 -0.1 25.7 17.19 16.60 0.59 16.99 Other Services 821.93 750.61 71.32 810.85 32.5 31.9 0.6 32.1 25.29 23.53 1.76 25.26
LABOR MARKET AREAS: TOTAL PRIVATE Bridgeport-Stamford 1,164.34 1,197.81 -33.47 1,135.93 33.7 34.4 -0.7 33.4 34.55 34.82 -0.27 34.01 Danbury 917.75 1,015.68 -97.93 934.73 33.3 34.5 -1.2 33.3 27.56 29.44 -1.88 28.07 Hartford 1,117.34 1,092.72 24.62 1,086.06 34.7 34.8 -0.1 34.5 32.20 31.40 0.80 31.48 New Haven 1,010.87 954.53 56.35 993.18 33.1 32.6 0.5 32.8 30.54 29.28 1.26 30.28 Norwich-New London 824.83 828.43 -3.59 810.57 31.7 32.5 -0.8 31.7 26.02 25.49 0.53 25.57 Waterbury 868.68 870.13 -1.45 873.76 34.2 35.4 -1.2 34.4 25.40 24.58 0.82 25.40

THE CONNECTICUT ECONOMIC DIGEST20 December 2017
LABOR FORCE ESTIMATES BY TOWN
OCTOBER 2017(By Place of Residence - Not Seasonally Adjusted)
The civilian labor force comprises all state residents age 16 years and older classified as employed or unemployed in accordance with criteria described below.Excluded are members of the military and persons in institutions (correctional and mental health, for example).
The employed are all persons who did any work as paid employees or in their own business during the survey week, or who have worked 15 hours or more asunpaid workers in an enterprise operated by a family member. Persons temporarily absent from a job because of illness, bad weather, strike or for personalreasons are also counted as employed whether they were paid by their employer or were seeking other jobs.
The unemployed are all persons who did not work, but were available for work during the survey week (except for temporary illness) and made specific efforts tofind a job in the prior four weeks. Persons waiting to be recalled to a job from which they had been laid off need not be looking for work to be classified asunemployed.
LABOR FORCE CONCEPTS
Town
All Labor Market Areas (LMAs) in Connecticut except three are federally-designated areas for developing labor statistics. For the sake of simplicity, thefederal Bridgeport-Stamford-Norwalk NECTA is referred to in Connecticut DOLpublications as the Bridgeport-Stamford LMA, and the Hartford-West Hartford-East Hartford NECTA is the Hartford LMA. The northwest part of the state isnow called Torrington-Northwest LMA. Five towns which are part of theSpringfield, MA area are published as the Enfield LMA. The towns of Eastfordand Hampton and other towns in the northeast are now called Danielson-Northeast LMA.
LMA/TOWNS LABOR FORCE EMPLOYED UNEMPLOYED % LMA/TOWNS LABOR FORCE EMPLOYED UNEMPLOYED %BRIDGEPORT-STAMFORD HARTFORD cont...
465,722 445,621 20,101 4.3 Canton 5,652 5,473 179 3.2Ansonia 9,391 8,821 570 6.1 Chaplin 1,224 1,172 52 4.2Bridgeport 70,564 66,062 4,502 6.4 Colchester 9,413 9,116 297 3.2Darien 8,635 8,317 318 3.7 Columbia 3,231 3,129 102 3.2Derby 6,894 6,510 384 5.6 Coventry 7,745 7,483 262 3.4Easton 3,883 3,746 137 3.5 Cromwell 7,966 7,669 297 3.7Fairfield 29,209 28,054 1,155 4.0 East Granby 3,068 2,972 96 3.1Greenwich 28,778 27,760 1,018 3.5 East Haddam 5,012 4,815 197 3.9Milford 30,123 28,930 1,193 4.0 East Hampton 7,647 7,389 258 3.4Monroe 10,259 9,841 418 4.1 East Hartford 27,441 25,970 1,471 5.4New Canaan 8,443 8,122 321 3.8 Ellington 9,245 8,929 316 3.4Norwalk 50,318 48,424 1,894 3.8 Farmington 14,142 13,653 489 3.5Oxford 7,190 6,949 241 3.4 Glastonbury 18,877 18,301 576 3.1Redding 4,469 4,314 155 3.5 Granby 6,709 6,516 193 2.9Ridgefield 11,890 11,475 415 3.5 Haddam 5,073 4,901 172 3.4Seymour 8,958 8,581 377 4.2 Hartford 53,568 49,376 4,192 7.8Shelton 22,173 21,246 927 4.2 Hartland 1,138 1,100 38 3.3Southbury 8,781 8,412 369 4.2 Harwinton 3,176 3,078 98 3.1Stamford 69,469 66,921 2,548 3.7 Hebron 5,522 5,349 173 3.1Stratford 27,664 26,267 1,397 5.0 Lebanon 4,048 3,892 156 3.9Trumbull 18,255 17,574 681 3.7 Manchester 33,018 31,571 1,447 4.4Weston 4,384 4,206 178 4.1 Mansfield 12,593 12,157 436 3.5Westport 12,579 12,125 454 3.6 Marlborough 3,589 3,469 120 3.3Wilton 8,560 8,258 302 3.5 Middletown 26,185 25,083 1,102 4.2Woodbridge 4,853 4,706 147 3.0 New Britain 36,658 34,460 2,198 6.0
New Hartford 3,931 3,790 141 3.6DANBURY 107,241 103,578 3,663 3.4 Newington 17,424 16,775 649 3.7Bethel 10,847 10,468 379 3.5 Plainville 10,506 10,069 437 4.2Bridgewater 854 823 31 3.6 Plymouth 6,634 6,321 313 4.7Brookfield 9,403 9,093 310 3.3 Portland 5,471 5,268 203 3.7Danbury 47,196 45,598 1,598 3.4 Rocky Hill 11,567 11,168 399 3.4New Fairfield 7,286 7,017 269 3.7 Scotland 951 914 37 3.9New Milford 15,433 14,903 530 3.4 Simsbury 13,210 12,809 401 3.0Newtown 14,316 13,835 481 3.4 Southington 24,442 23,570 872 3.6Sherman 1,906 1,841 65 3.4 South Windsor 14,101 13,616 485 3.4
Stafford 6,789 6,531 258 3.8ENFIELD 51,261 49,164 2,097 4.1 Thomaston 4,682 4,524 158 3.4East Windsor 6,716 6,425 291 4.3 Tolland 8,602 8,341 261 3.0Enfield 23,782 22,736 1,046 4.4 Union 460 445 15 3.3Somers 5,414 5,215 199 3.7 Vernon 17,081 16,383 698 4.1Suffield 7,730 7,475 255 3.3 West Hartford 34,276 33,160 1,116 3.3Windsor Locks 7,619 7,313 306 4.0 Wethersfield 14,152 13,560 592 4.2
Willington 3,639 3,523 116 3.2HARTFORD 620,219 593,300 26,919 4.3 Windham 12,379 11,746 633 5.1Andover 1,928 1,866 62 3.2 Windsor 16,674 15,906 768 4.6Ashford 2,539 2,451 88 3.5Avon 9,410 9,105 305 3.2Barkhamsted 2,322 2,233 89 3.8Berlin 11,749 11,340 409 3.5Bloomfield 11,505 10,909 596 5.2Bolton 3,169 3,069 100 3.2Bristol 33,091 31,468 1,623 4.9Burlington 5,595 5,417 178 3.2

THE CONNECTICUT ECONOMIC DIGEST 21December 2017
LABOR FORCE ESTIMATES BY TOWN
The unemployment rate represents the number unemployed as a percent of the civilian labor force.
With the exception of those persons temporarily absent from a job or waiting to be recalled to one, persons with no job and who are not actively looking for oneare counted as "not in the labor force".
Over the course of a year, the size of the labor force and the levels of employment undergo fluctuations due to such seasonal events as changes in weather,reduced or expanded production, harvests, major holidays and the opening and closing of schools. Because these seasonal events follow a regular pattern eachyear, their influence on statistical trends can be eliminated by adjusting the monthly statistics. Seasonal Adjustment makes it easier to observe cyclical and othernonseasonal developments.
(By Place of Residence - Not Seasonally Adjusted)
OCTOBER 2017
LABOR FORCE CONCEPTS (Continued)
Town
LMA/TOWNS LABOR FORCE EMPLOYED UNEMPLOYED % LMA/TOWNS LABOR FORCE EMPLOYED UNEMPLOYED %NEW HAVEN 326,595 312,423 14,172 4.3 TORRINGTON-NORTHWESTBethany 3,118 3,015 103 3.3 46,981 45,105 1,876 4.0Branford 16,132 15,517 615 3.8 Canaan 698 679 19 2.7Cheshire 15,621 15,141 480 3.1 Colebrook 811 780 31 3.8Chester 2,342 2,265 77 3.3 Cornwall 758 735 23 3.0Clinton 7,328 7,066 262 3.6 Goshen 1,645 1,602 43 2.6Deep River 2,832 2,745 87 3.1 Kent 1,526 1,468 58 3.8Durham 4,345 4,223 122 2.8 Litchfield 4,756 4,597 159 3.3East Haven 15,893 15,119 774 4.9 Morris 1,424 1,375 49 3.4Essex 3,313 3,196 117 3.5 Norfolk 897 874 23 2.6Guilford 12,864 12,493 371 2.9 North Canaan 1,663 1,617 46 2.8Hamden 35,547 34,151 1,396 3.9 Roxbury 1,320 1,282 38 2.9Killingworth 3,814 3,714 100 2.6 Salisbury 1,787 1,732 55 3.1Madison 9,084 8,793 291 3.2 Sharon 1,453 1,415 38 2.6Meriden 32,298 30,622 1,676 5.2 Torrington 19,327 18,380 947 4.9Middlefield 2,523 2,444 79 3.1 Warren 800 769 31 3.9New Haven 65,032 61,303 3,729 5.7 Washington 2,033 1,975 58 2.9North Branford 8,179 7,902 277 3.4 Winchester 6,083 5,825 258 4.2North Haven 13,401 12,920 481 3.6Old Saybrook 5,105 4,911 194 3.8 WATERBURY 111,053 105,140 5,913 5.3Orange 7,275 7,047 228 3.1 Beacon Falls 3,433 3,313 120 3.5Wallingford 26,481 25,500 981 3.7 Bethlehem 1,944 1,871 73 3.8West Haven 30,449 28,852 1,597 5.2 Middlebury 3,860 3,708 152 3.9Westbrook 3,619 3,484 135 3.7 Naugatuck 17,288 16,462 826 4.8
Prospect 5,571 5,372 199 3.6*NORWICH-NEW LONDON-WESTERLY, CT PART Waterbury 50,740 47,150 3,590 7.1
126,667 121,355 5,312 4.2 Watertown 12,943 12,501 442 3.4Bozrah 1,458 1,399 59 4.0 Wolcott 9,838 9,493 345 3.5Canterbury 2,866 2,761 105 3.7 Woodbury 5,436 5,270 166 3.1East Lyme 8,805 8,477 328 3.7Franklin 1,071 1,041 30 2.8 DANIELSON-NORTHEASTGriswold 6,378 6,066 312 4.9 43,641 41,721 1,920 4.4Groton 18,602 17,912 690 3.7 Brooklyn 4,169 3,995 174 4.2Ledyard 8,020 7,751 269 3.4 Eastford 955 922 33 3.5Lisbon 2,357 2,260 97 4.1 Hampton 1,039 989 50 4.8Lyme 1,203 1,166 37 3.1 Killingly 9,697 9,246 451 4.7Montville 9,450 9,039 411 4.3 Plainfield 8,740 8,334 406 4.6New London 12,073 11,338 735 6.1 Pomfret 2,497 2,435 62 2.5No. Stonington 2,876 2,785 91 3.2 Putnam 4,943 4,686 257 5.2Norwich 20,393 19,412 981 4.8 Sterling 2,035 1,931 104 5.1Old Lyme 3,736 3,604 132 3.5 Thompson 5,334 5,110 224 4.2Preston 2,435 2,326 109 4.5 Woodstock 4,232 4,073 159 3.8Salem 2,137 2,046 91 4.3Sprague 1,613 1,543 70 4.3Stonington 9,516 9,189 327 3.4Voluntown 1,490 1,426 64 4.3Waterford 10,188 9,814 374 3.7
Not Seasonally Adjusted:CONNECTICUT 1,899,400 1,817,400 82,000 4.3
*Connecticut portion only. For whole NECTA,including RI part, see below. UNITED STATES 160,465,000 154,223,000 6,242,000 3.9NORWICH-NEW LONDON-WESTERLY, CT-RI
142,376 136,404 5,972 4.2 Seasonally Adjusted:RI part 15,709 15,049 660 4.2 CONNECTICUT 1,906,100 1,820,400 85,600 4.5(Hopkinton and Westerly) UNITED STATES 160,381,000 153,861,000 6,520,000 4.1

THE CONNECTICUT ECONOMIC DIGEST22 December 2017
HOUSING PERMIT ACTIVITY BY TOWN
For further information on the housing permit data, contact Kolie Sun of DECD at (860) 270-8167.
Town
TOWN OCT YR TO DATE TOWN OCT YR TO DATE TOWN OCT YR TO DATE2017 2017 2016 2017 2017 2016 2017 2017 2016
Andover 0 3 2 Griswold 0 6 9 Preston 0 5 5Ansonia na na na Groton na na na Prospect 2 17 18Ashford na na na Guilford na na na Putnam na na naAvon 2 17 19 Haddam 1 9 8 Redding 0 1 3Barkhamsted na na na Hamden na na na Ridgefield 0 22 51Beacon Falls na na na Hampton na na na Rocky Hill 1 8 13Berlin 1 15 14 Hartford 1 4 4 Roxbury na na naBethany na na na Hartland 1 7 0 Salem na na naBethel 6 65 67 Harwinton na na na Salisbury na na naBethlehem na na na Hebron 3 13 8 Scotland na na na
Bloomfield 0 3 408 Kent 1 3 7 Seymour na na naBolton 0 3 3 Killingly na na na Sharon na na naBozrah na na na Killingworth 0 1 4 Shelton 6 55 41Branford 2 24 22 Lebanon 1 10 17 Sherman 0 2 2Bridgeport 7 62 73 Ledyard na na na Simsbury 3 14 249Bridgewater 0 1 0 Lisbon na na na Somers 1 11 13Bristol 2 39 33 Litchfield na na na South Windsor 6 19 111Brookfield 9 15 26 Lyme 0 4 4 Southbury na na naBrooklyn 1 14 10 Madison na na na Southington 4 59 81Burlington 0 23 16 Manchester 1 23 23 Sprague 1 1 1
Canaan na na na Mansfield 1 8 3 Stafford 0 8 83Canterbury na na na Marlborough 0 2 2 Stamford 3 138 49Canton 1 4 4 Meriden na na na Sterling na na naChaplin na na na Middlebury na na na Stonington na na naCheshire 2 17 23 Middlefield 0 6 7 Stratford 0 13 19Chester 0 1 3 Middletown 2 27 23 Suffield 1 63 27Clinton 13 44 12 Milford 16 157 145 Thomaston na na naColchester 6 31 57 Monroe 1 11 6 Thompson na na naColebrook na na na Montville na na na Tolland 4 11 7Columbia 0 3 10 Morris na na na Torrington na na na
Cornwall na na na Naugatuck na na na Trumbull 0 6 7Coventry 2 20 14 New Britain 2 13 4 Union 0 3 0Cromwell 4 11 17 New Canaan 0 18 25 Vernon 8 90 83Danbury 18 139 71 New Fairfield 1 8 11 Voluntown 0 1 4Darien 3 35 35 New Hartford na na na Wallingford 2 21 19Deep River 1 2 2 New Haven 0 22 227 Warren na na naDerby na na na New London 3 33 33 Washington na na naDurham 1 3 8 New Milford na na na Waterbury 1 32 30East Granby 1 2 3 Newington 0 13 9 Waterford na na naEast Haddam 1 9 15 Newtown 2 13 41 Watertown na na na
East Hampton 2 23 24 Norfolk na na na West Hartford 6 59 39East Hartford 0 3 1 North Branford na na na West Haven na na naEast Haven na na na North Canaan na na na Westbrook 0 17 14East Lyme 9 28 19 North Haven na na na Weston 1 8 9East Windsor 0 14 15 North Stoningto na na na Westport 7 146 62Eastford na na na Norwalk 238 426 192 Wethersfield 3 5 1Easton 1 7 6 Norwich 0 12 22 Willington 1 2 25Ellington 9 82 74 Old Lyme na na na Wilton 1 6 9Enfield 0 55 103 Old Saybrook 2 29 12 Winchester na na naEssex 0 59 28 Orange na na na Windham 0 3 2
Fairfield 36 92 242 Oxford 2 43 16 Windsor 3 10 19Farmington 0 30 38 Plainfield na na na Windsor Locks 3 179 16Franklin na na na Plainville 1 10 6 Wolcott 2 18 15Glastonbury 1 33 28 Plymouth na na na Woodbridge na na naGoshen na na na Pomfret na na na Woodbury 2 21 6Granby 1 33 27 Portland 2 6 7 Woodstock na na naGreenwich 11 123 116

THE CONNECTICUT ECONOMIC DIGEST 23December 2017
TECHNICAL NOTESBUSINESS STARTS AND TERMINATIONSRegistrations and terminations of business entities as recorded with the Secretary of the State and the ConnecticutDepartment of Labor (DOL) are an indication of new business formation and activity. DOL business starts include newemployers which have become liable for unemployment insurance taxes during the quarter, as well as new establish-ments opened by existing employers. DOL business terminations are those accounts discontinued due to inactivity (noemployees) or business closure, and accounts for individual business establishments that are closed by still activeemployers. The Secretary of the State registrations include limited liability companies, limited liability partnerships, andforeign-owned (out-of-state) and domestic-owned (in-state) corporations.
CONSUMER PRICE INDEXThe Consumer Price Index (CPI), computed and published by the U.S. Bureau of Labor Statistics, is a measure of theaverage change in prices over time in a fixed market basket of goods and services. It is based on prices of food, clothing,shelter, fuels, transportation fares, charges for doctors’ and dentists’ services, drugs and other goods and services thatpeople buy for their day-to-day living. The Northeast region is comprised of the New England states, New York, NewJersey and Pennsylvania.
EMPLOYMENT COST INDEXThe Employment Cost Index (ECI) covers both wages and salaries and employer costs for employee benefits for alloccupations and establishments in both the private nonfarm sector and state and local government. The ECI measuresemployers’ labor costs free from the influences of employment shifts among industries and occupations. The base periodfor all data is December 2005 when the ECI is 100.
GAMING DATAIndian Gaming Payments are amounts received by the State as a result of the slot compact with the two Federallyrecognized tribes in Connecticut, which calls for 25 percent of net slot receipts to be remitted to the State. IndianGaming Slots are the total net revenues from slot machines only received by the two Federally recognized Indian tribes.
HOURS AND EARNINGS ESTIMATESProduction worker earnings and hours estimates include full- and part-time employees working within manufacturingindustries. Hours worked and earnings data are computed based on payroll figures for the week including the 12th of themonth. Average hourly earnings are affected by such factors as premium pay for overtime and shift differential as well aschanges in basic hourly and incentive rates of pay. Average weekly earnings are the product of weekly hours worked andhourly earnings. These data are developed in cooperation with the U.S. Department of Labor, Bureau of Labor Statistics.
INITIAL CLAIMSAverage weekly initial claims are calculated by dividing the total number of new claims for unemployment insurancereceived in the month by the number of weeks in the month. A minor change in methodology took effect with datapublished in the March 1997 issue of the DIGEST. Data have been revised back to January 1980.
INSURED UNEMPLOYMENT RATEPrimarily a measure of unemployment insurance program activity, the insured unemployment rate is the 13-weekaverage of the number of people claiming unemployment benefits divided by the number of workers covered by theunemployment insurance system.
LABOR FORCE ESTIMATESLabor force estimates are a measure of the work status of people who live in Connecticut. Prepared under the direction ofthe U.S. Bureau of Labor Statistics, the statewide estimates are the product of a signal-plus noise model, which usesresults from the Current Population Survey (CPS), a monthly survey of Connecticut households, counts of claimants forunemployment benefits, and establishment employment estimates. The 2015 LAUS Redesign includes improved time-series models for the census divisions, states, select substate areas, and the balances of those states; an improved real-time benchmarking procedure to the national Current Population Survey (CPS) estimates; an improved smoothedseasonal adjustment procedure; and improved treatment of outliers. Non-modeled area estimation improvements in-clude: updated Dynamic Residency Ratios (DRR); more accurate estimates for all-other employment; more accurateestimation of agricultural employment; and improved estimation of non-covered agricultural unemployment. Handbookestimation is now done at the city/town level instead of at the Labor Market Area (LMA) level in Connecticut, whichbetter reflects local conditions. The Redesign also introduces estimation inputs from the American Community Survey(ACS) to replace inputs that were previously obtained from the decennial census long-form survey. Labor force data,reflecting persons employed by place of residence, are not directly comparable to the place-of-work industry employmentseries. In the labor force estimates, workers involved in labor disputes are counted as employed. The labor force data alsoincludes agricultural workers, unpaid family workers, domestics and the self-employed. Because of these conceptualdifferences, total labor force employment is almost always different from nonfarm wage and salary employment.
LABOR MARKET AREASAll Labor Market Areas (LMAs) in Connecticut except three are federally-designated areas for developing labor statistics.For the sake of simplicity, the federal Bridgeport-Stamford-Norwalk NECTA is referred to in Connecticut DOL publica-tions as the Bridgeport-Stamford LMA, and the Hartford-West Hartford-East Hartford NECTA is the Hartford LMA. Thenorthwest part of the state is now called Torrington-Northwest LMA. Five towns which are part of the Springfield, MAarea are published as the Enfield LMA. The towns of Eastford and Hampton and other towns in the northeast are nowcalled Danielson-Northeast LMA. Industry employment and labor force data estimates contained in Connecticut Depart-ment of Labor publications are prepared following the same statistical procedures developed by the U.S. Department ofLabor, Bureau of Labor Statistics, whether for federally designated or state-determined areas.
NONFARM EMPLOYMENT ESTIMATESNonfarm employment estimates are derived from a survey of businesses to measure jobs by industry. The estimatesinclude all full- and part-time wage and salary employees who worked during or received pay for the pay period whichincludes the 12th of the month. Excluded from these estimates are proprietors, self-employed workers, private householdemployees and unpaid family workers. In some cases, due to space constraints, all industry estimates are not shown.These data are developed in cooperation with the U.S. Department of Labor, Bureau of Labor Statistics.
UI COVERED WAGESUI covered wages is the total amount paid to those employees who are covered under the Connecticut’s UnemploymentInsurance (UI) law for services performed during the quarter. The fluctuations in the 1992-93 period reflect the effect ofthe changes in the tax law and the massive restructuring in the state’s economy.

ECONOMIC INDICATORS AT A GLANCE
Leading General Drift Indicator ...... -1.3Coincident General Drift Indicator . -0.2Farmington Bank Bus. Barometer +0.4Phil. Fed’s CT Coincident Index .... +2.0
Total Nonfarm Employment........... +0.1
Labor Force ..................................... +0.9Employed ......................................... +1.0Unemployed ..................................... -1.5Unemployment Rate ..................... -0.1*Labor Force Participation Rate ......... +0.4Employment-Population Ratio .......... +0.5
Average Weekly Initial Claims ...... -12.7Avg Insured Unempl. Rate ........... -0.34*U-6 Rate ......................................... -1.3*
Prod. Worker Avg Wkly Hrs, Mfg ..... -4.1PW Avg Hourly Earnings, Mfg ........ -3.5PW Avg Weekly Earnings, Mfg ....... -7.5CT Mfg. Production Index .............. +0.0 Production Worker Hours ................ -8.7 Industrial Electricity Sales .............. +1.5
Personal Income ............................ +1.9UI Covered Wages .......................... +2.1
Business Activity New Housing Permits ..................... +7.1 Electricity Sales ............................... NA Construction Contracts Index ........ +130 New Auto Registrations ................... -3.5 Exports ........................................ +22.9 S&P 500: Monthly Close .............. +21.1
Business Starts Secretary of the State ...................... NA Dept. of Labor ................................. -0.7
Business Terminations Secretary of the State ...................... NA Dept. of Labor ............................... -22.6
State Revenues ............................ +11.9 Corporate Tax ................................ -27.6 Personal Income Tax ....................... +3.0 Real Estate Conveyance Tax .......... -17.6 Sales & Use Tax ............................ +25.4 Gaming Payments ........................... -1.9
Tourism and Travel Occupancy Rate ............................ +2.8 Major Attraction Visitors................... -6.4 Air Passenger Count ........................ NA Gaming Slots .................................. -1.6
Employment Cost Index (U.S.) Total ............................................... +2.5 Wages & Salaries........................... +2.6 Benefit Costs ................................. +2.4
Consumer Prices U.S. City Average ........................... +2.0 Northeast Region ........................... +1.5 NY-NJ-Long Island ......................... +1.8 Boston-Brockton-Nashua ............... +2.7
Interest Rates Prime .......................................... +0.75* Conventional Mortgage ............... +0.43*
Mailing address:
Connecticut Economic DigestConnecticut Department of Labor
Office of Research200 Folly Brook Boulevard
Wethersfield, CT 06109-1114
THE CONNECTICUT ECONOMIC DIGEST
*Percentage point change; **Less than 0.05 percent; NA = Not Available
The Connecticut Economic Digest is available on the internet at:
http://www.ctdol.state.ct.us/lmi
December 2017
(Percent change from prior year; see pages 4-8 for reference months or quarters)
THE CONNECTICUT
A joint publication of The Connecticut Departments of Labor and Economic and Community Development
ECONOMIC DIGEST
If you wish to have your name removed from our mailing list, please
check here and return this page (or a photocopy) to the address at left.
If your address has changed, please check here, make the necessary
changes to your address label and return this page to the address at left.
If you receive more than one copy of this publication, please check
here and return this page from the duplicate copy to the address at left.
DO YOU WANT TO BE NOTIFIED BY EMAIL WHEN THEDIGEST IS PUBLISHED EACH MONTH?
Simply email to [email protected] with only the following in thebody of the message, leave subject blank:SUBSCRIBE DOL-CTEconomicDigest your_name(type in your name where it says your_name)