Embed Size (px)
Citation preview
The Connecticut Estate and Gift Tax
Prepared by
Karen Smith Conway Jonathan C. Rork Professor of Economics Professor of Economics University of New Hampshire Reed College
Presentation for Connecticut State Tax Panel October 27, 2015
Outline of Presentation
1. Background & Brief History 2. Current Situation – in CT, the region and the federal code 3. Issues to Consider & Available Evidence
a. Distributional Considerations b. Effects on Migration c. Effects on Economic Growth d. Administrative and Compliance Costs
4. Possible Options for Reform
2
1. Background & Brief History Key Features of Estate, Inheritance & Gift taxes (EIG) taxes include: • Estate taxes are levied on the estate (on the decedent) • Inheritance (or succession) taxes are levied on the beneficiary & the
rate typically differs depending on the relationship with decedent • Gift taxes imposed once an annual limit has been exceeded, as an effort
to prevent ‘deathbed’ transfers that circumvent E&I taxes • Spouses typically exempt from all three • EIG Revenues are volatile and difficult to link to policy One very large estate can have a disproportionate impact Estates can take years to settle, so tax revenues received in a given year do not
match well with the policy in place at time of death
3
1. Background & Brief History – continued
Prior to 2001 (and EGTRRA): The federal credit for state EIG taxes paid meant states could ‘pick up’ a portion of federal revenues while not adding to the tax liability of the estate • Every state took advantage of this ‘pick-up’ tax • Alabama, Arkansas, Florida, Georgia & Nevada have had only the ‘pick-up’ tax
since the 1950s • Between 1976 and 2001, 30 states eliminated their incremental EIG taxes & only
imposed the ‘pick-up’ tax • List includes neighbors MA, NY & RI as well as VT, ME. NH was phasing out by 2003 & CT
planned to in 2005 • About a dozen states with EIG taxes (and no law to phase out) remained
State EIG taxes have changed a lot over the last 40 years – which is critical to identifying a causal effect on migration and growth
4
1. Background & Brief History – continued
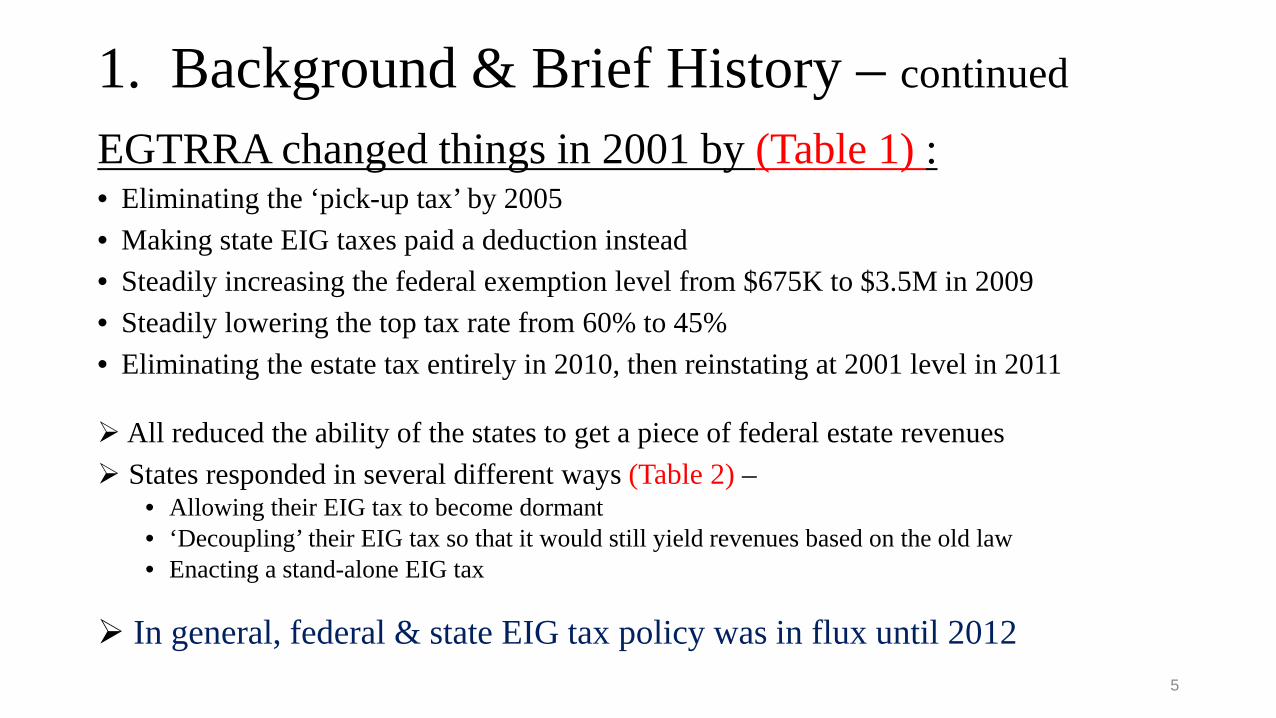
EGTRRA changed things in 2001 by (Table 1) : • Eliminating the ‘pick-up tax’ by 2005 • Making state EIG taxes paid a deduction instead • Steadily increasing the federal exemption level from $675K to $3.5M in 2009 • Steadily lowering the top tax rate from 60% to 45% • Eliminating the estate tax entirely in 2010, then reinstating at 2001 level in 2011
All reduced the ability of the states to get a piece of federal estate revenues States responded in several different ways (Table 2) –
• Allowing their EIG tax to become dormant • ‘Decoupling’ their EIG tax so that it would still yield revenues based on the old law • Enacting a stand-alone EIG tax
In general, federal & state EIG tax policy was in flux until 2012 5
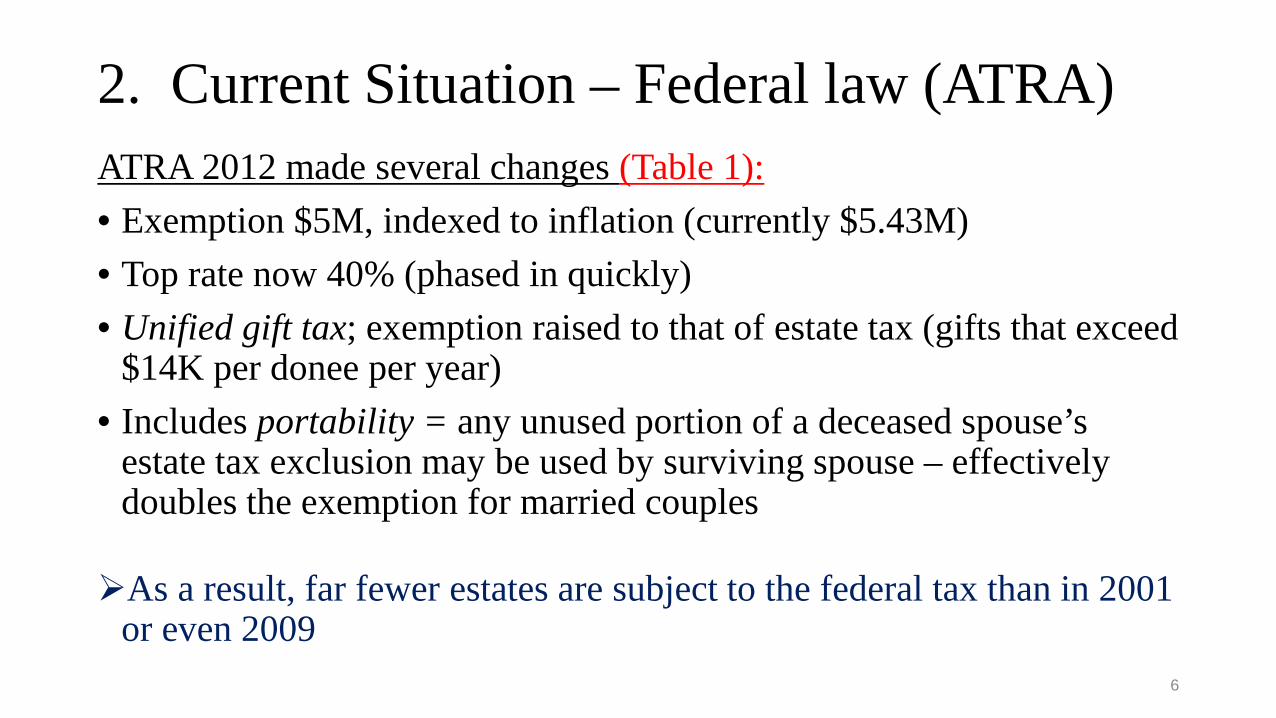
2. Current Situation – Federal law (ATRA) ATRA 2012 made several changes (Table 1): • Exemption $5M, indexed to inflation (currently $5.43M) • Top rate now 40% (phased in quickly) • Unified gift tax; exemption raised to that of estate tax (gifts that exceed
$14K per donee per year) • Includes portability = any unused portion of a deceased spouse’s
estate tax exclusion may be used by surviving spouse – effectively doubles the exemption for married couples
As a result, far fewer estates are subject to the federal tax than in 2001 or even 2009
6
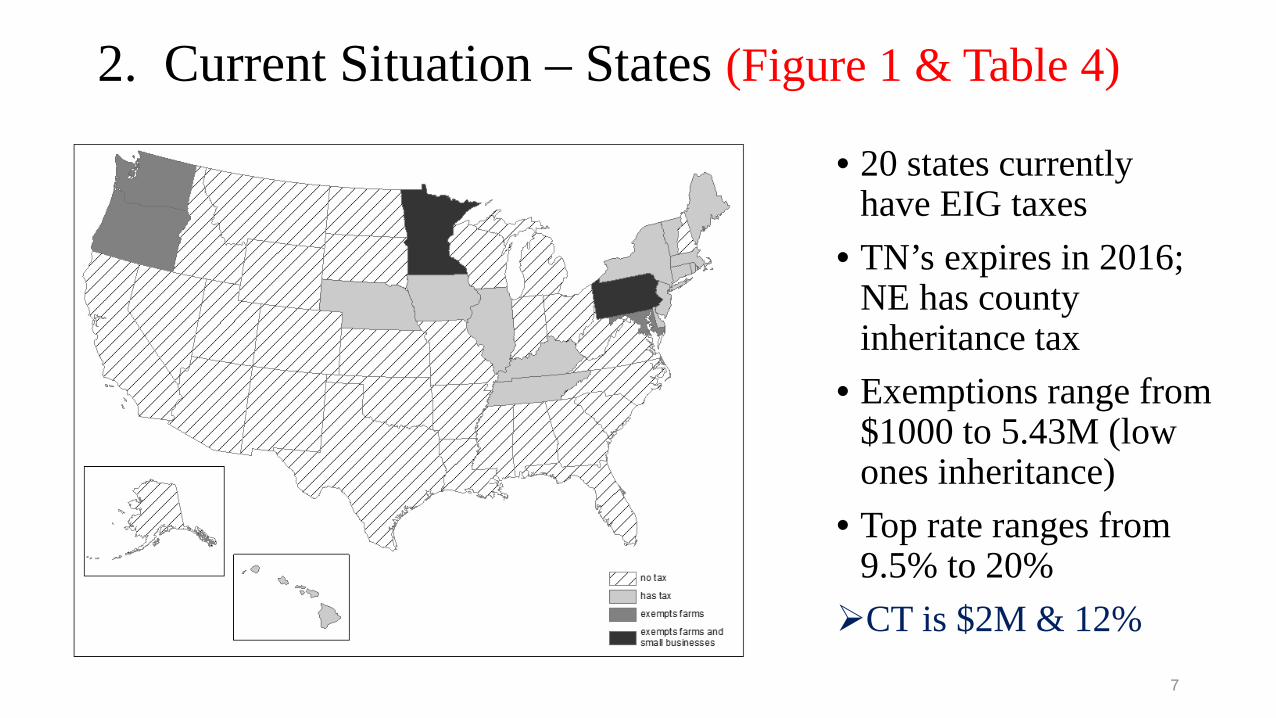
2. Current Situation – States (Figure 1 & Table 4)
• 20 states currently have EIG taxes
• TN’s expires in 2016; NE has county inheritance tax
• Exemptions range from $1000 to 5.43M (low ones inheritance)
• Top rate ranges from 9.5% to 20% CT is $2M & 12%
7
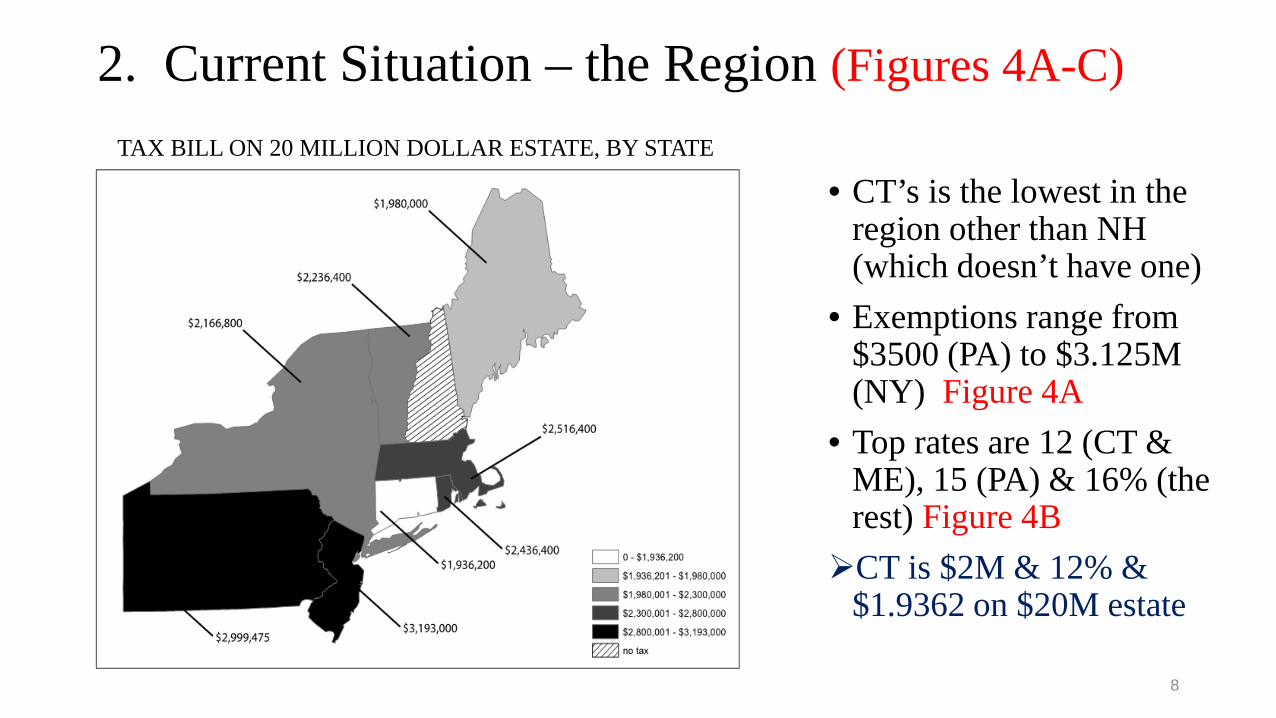
2. Current Situation – the Region (Figures 4A-C)
• CT’s is the lowest in the region other than NH (which doesn’t have one)
• Exemptions range from $3500 (PA) to $3.125M (NY) Figure 4A
• Top rates are 12 (CT & ME), 15 (PA) & 16% (the rest) Figure 4B CT is $2M & 12% &
$1.9362 on $20M estate
TAX BILL ON 20 MILLION DOLLAR ESTATE, BY STATE
8
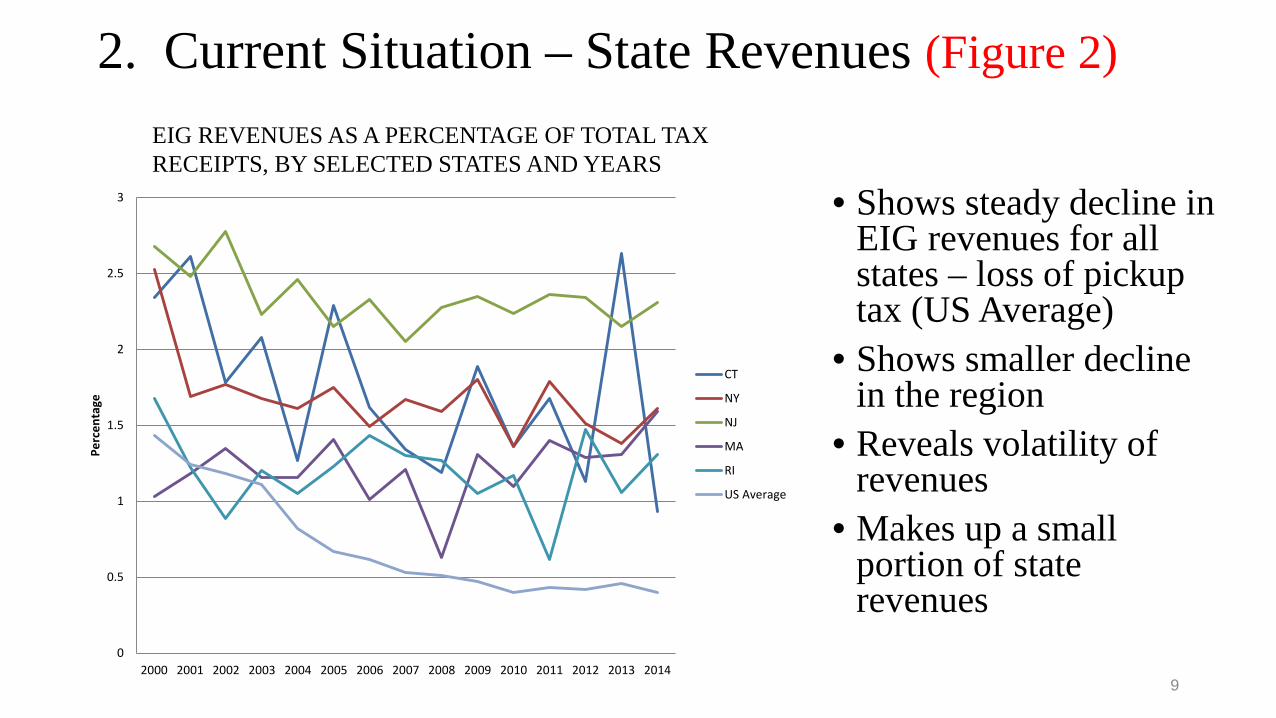
2. Current Situation – State Revenues (Figure 2)
• Shows steady decline in EIG revenues for all states – loss of pickup tax (US Average)
• Shows smaller decline in the region
• Reveals volatility of revenues
• Makes up a small portion of state revenues
0
0.5
1
1.5
2
2.5
3
2000 2001 2002 2003 2004 2005 2006 2007 2008 2009 2010 2011 2012 2013 2014
Perc
enta
ge
CT
NY
NJ
MA
RI
US Average
EIG REVENUES AS A PERCENTAGE OF TOTAL TAX RECEIPTS, BY SELECTED STATES AND YEARS
9
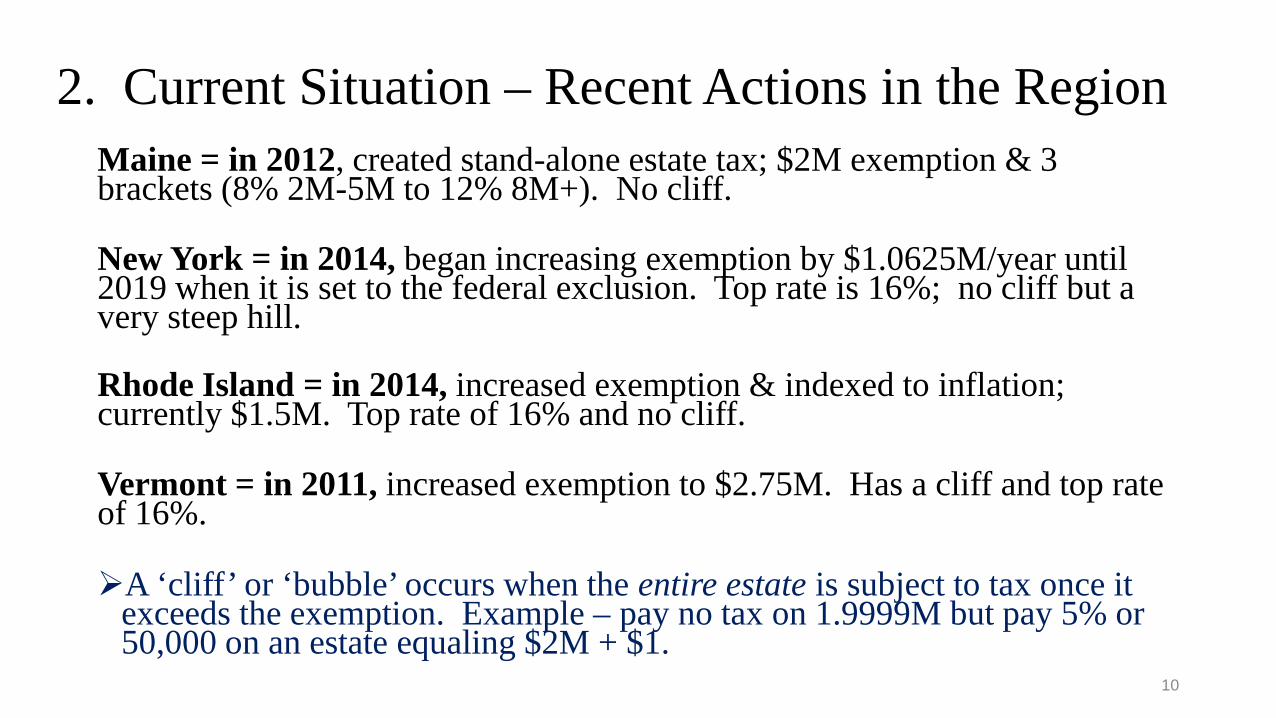
2. Current Situation – Recent Actions in the Region Maine = in 2012, created stand-alone estate tax; $2M exemption & 3 brackets (8% 2M-5M to 12% 8M+). No cliff.
New York = in 2014, began increasing exemption by $1.0625M/year until 2019 when it is set to the federal exclusion. Top rate is 16%; no cliff but a very steep hill.
Rhode Island = in 2014, increased exemption & indexed to inflation; currently $1.5M. Top rate of 16% and no cliff.
Vermont = in 2011, increased exemption to $2.75M. Has a cliff and top rate of 16%.
A ‘cliff’ or ‘bubble’ occurs when the entire estate is subject to tax once it exceeds the exemption. Example – pay no tax on 1.9999M but pay 5% or 50,000 on an estate equaling $2M + $1.
10
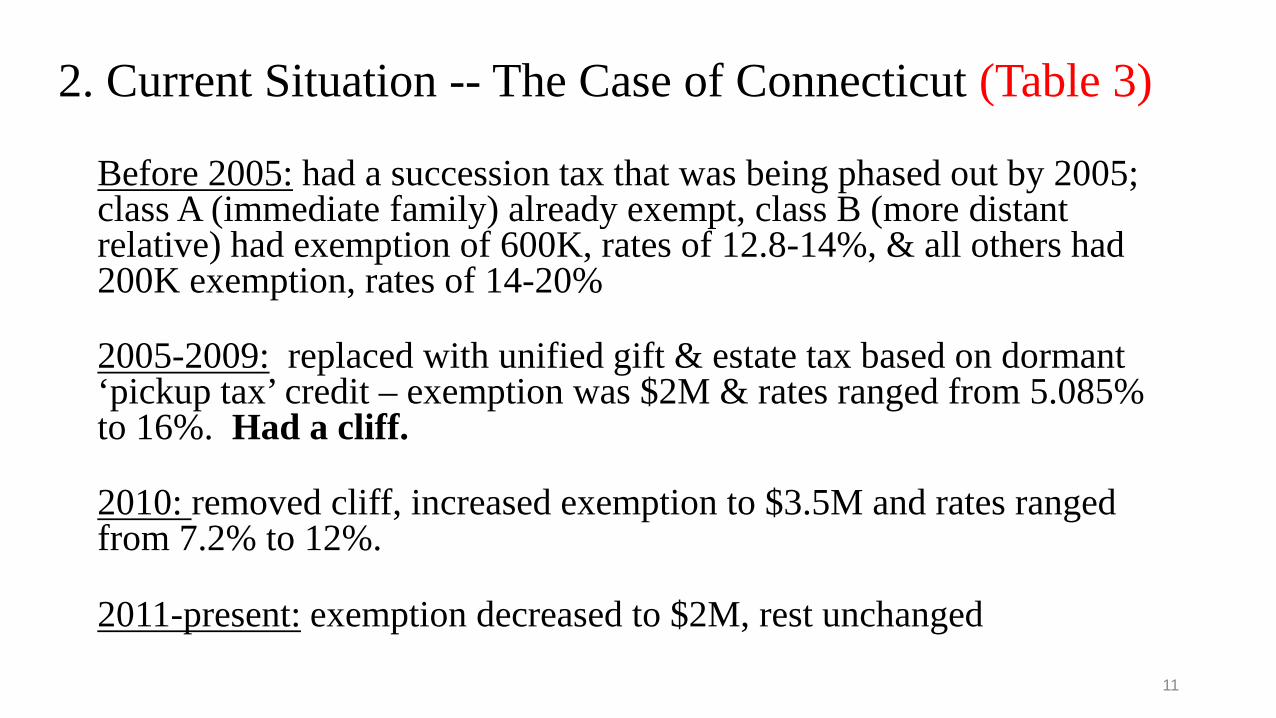
2. Current Situation -- The Case of Connecticut (Table 3)
Before 2005: had a succession tax that was being phased out by 2005; class A (immediate family) already exempt, class B (more distant relative) had exemption of 600K, rates of 12.8-14%, & all others had 200K exemption, rates of 14-20%
2005-2009: replaced with unified gift & estate tax based on dormant ‘pickup tax’ credit – exemption was $2M & rates ranged from 5.085% to 16%. Had a cliff.
2010: removed cliff, increased exemption to $3.5M and rates ranged from 7.2% to 12%.
2011-present: exemption decreased to $2M, rest unchanged
11
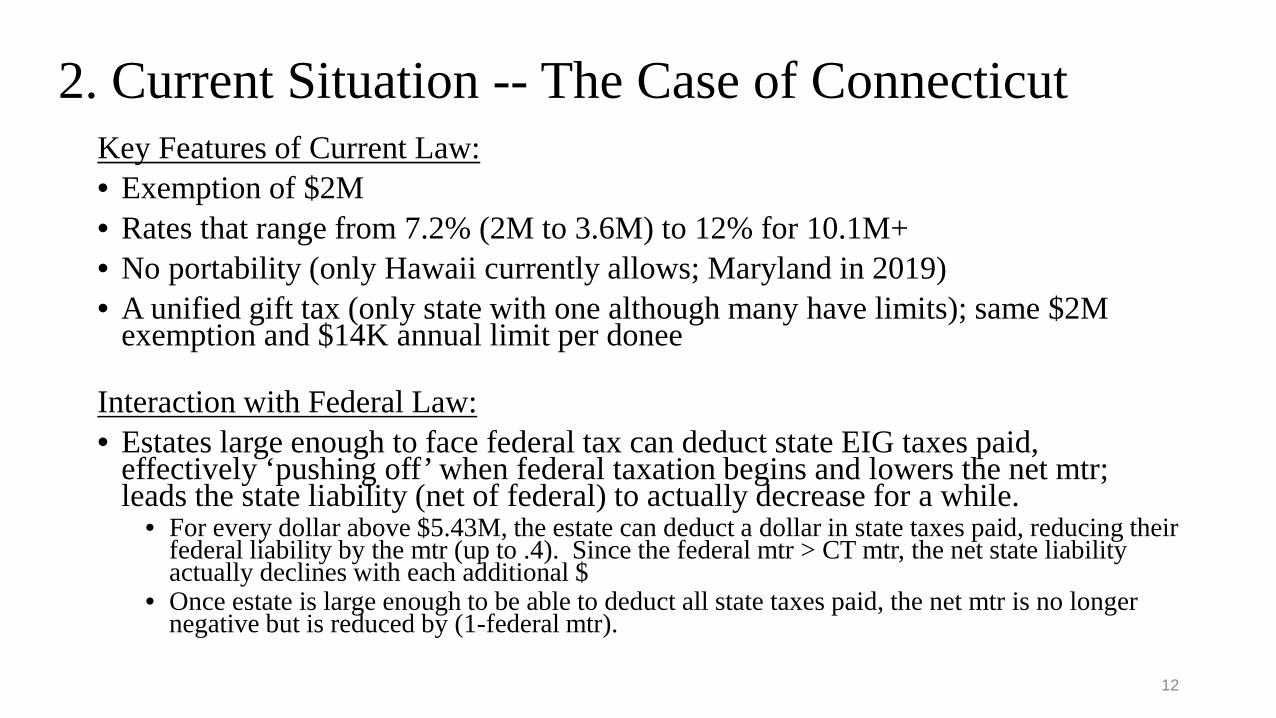
2. Current Situation -- The Case of Connecticut Key Features of Current Law: • Exemption of $2M • Rates that range from 7.2% (2M to 3.6M) to 12% for 10.1M+ • No portability (only Hawaii currently allows; Maryland in 2019) • A unified gift tax (only state with one although many have limits); same $2M
exemption and $14K annual limit per donee
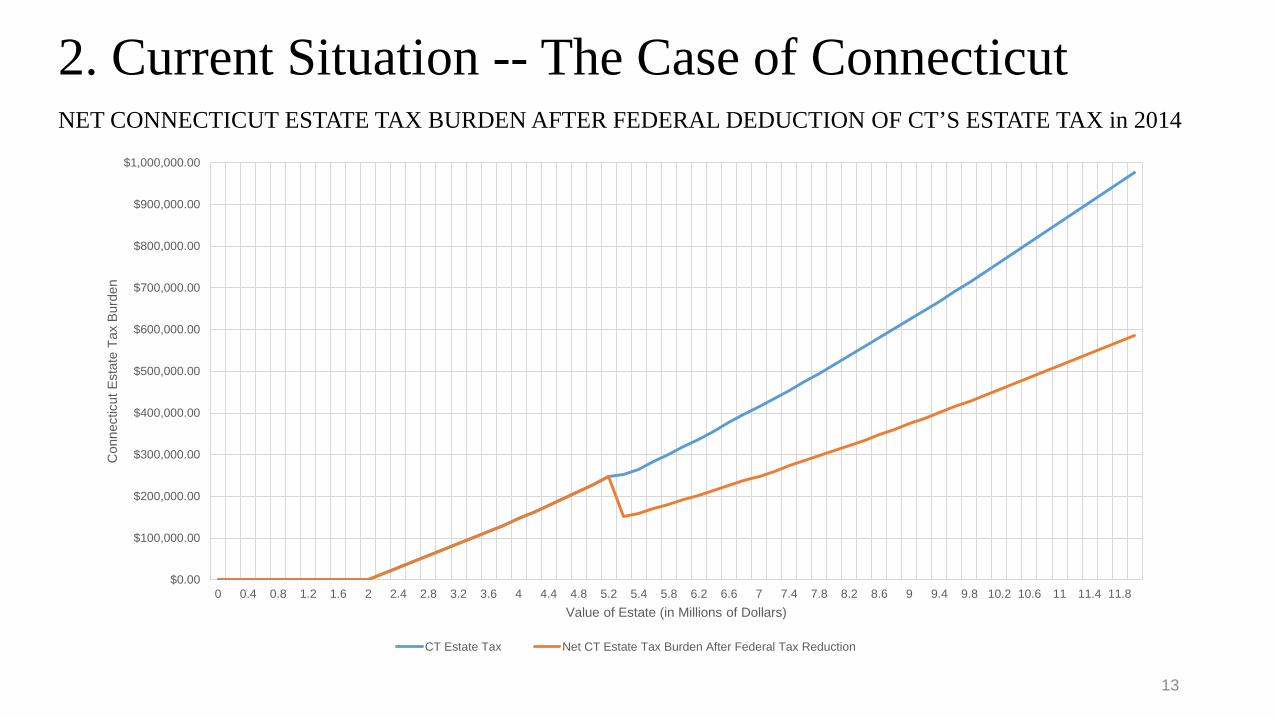
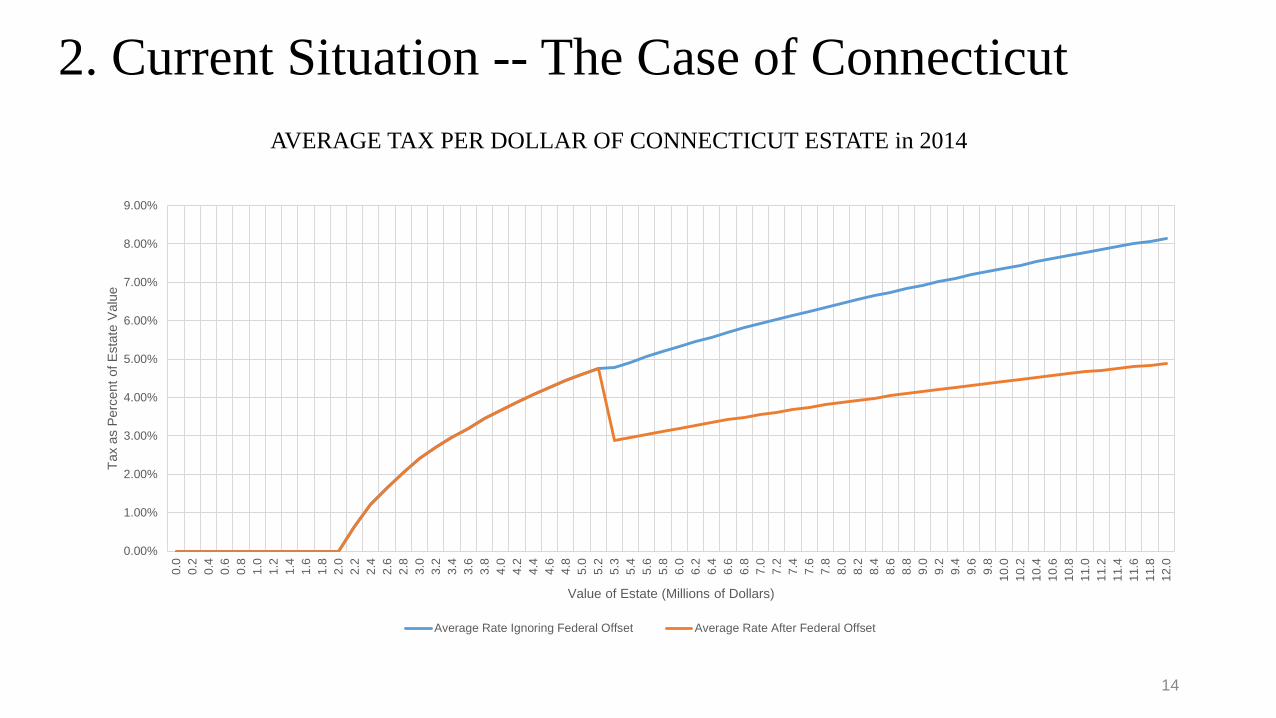
Interaction with Federal Law: • Estates large enough to face federal tax can deduct state EIG taxes paid,
effectively ‘pushing off’ when federal taxation begins and lowers the net mtr; leads the state liability (net of federal) to actually decrease for a while.
• For every dollar above $5.43M, the estate can deduct a dollar in state taxes paid, reducing their federal liability by the mtr (up to .4). Since the federal mtr > CT mtr, the net state liability actually declines with each additional $
• Once estate is large enough to be able to deduct all state taxes paid, the net mtr is no longer negative but is reduced by (1-federal mtr).
12
2. Current Situation -- The Case of Connecticut
13
$0.00
$100,000.00
$200,000.00
$300,000.00
$400,000.00
$500,000.00
$600,000.00
$700,000.00
$800,000.00
$900,000.00
$1,000,000.00
0 0.4 0.8 1.2 1.6 2 2.4 2.8 3.2 3.6 4 4.4 4.8 5.2 5.4 5.8 6.2 6.6 7 7.4 7.8 8.2 8.6 9 9.4 9.8 10.2 10.6 11 11.4 11.8
Con
nect
icut
Est
ate
Tax
Burd
en
Value of Estate (in Millions of Dollars)
CT Estate Tax Net CT Estate Tax Burden After Federal Tax Reduction
NET CONNECTICUT ESTATE TAX BURDEN AFTER FEDERAL DEDUCTION OF CT’S ESTATE TAX in 2014
2. Current Situation -- The Case of Connecticut
14
0.00%
1.00%
2.00%
3.00%
4.00%
5.00%
6.00%
7.00%
8.00%
9.00%
0.0
0.2
0.4
0.6
0.8
1.0
1.2
1.4
1.6
1.8
2.0
2.2
2.4
2.6
2.8
3.0
3.2
3.4
3.6
3.8
4.0
4.2
4.4
4.6
4.8
5.0
5.2
5.3
5.4
5.6
5.8
6.0
6.2
6.4
6.6
6.8
7.0
7.2
7.4
7.6
7.8
8.0
8.2
8.4
8.6
8.8
9.0
9.2
9.4
9.6
9.8
10.0
10.2
10.4
10.6
10.8
11.0
11.2
11.4
11.6
11.8
12.0
Tax
as P
erce
nt o
f Est
ate
Valu
e
Value of Estate (Millions of Dollars)
Average Rate Ignoring Federal Offset Average Rate After Federal Offset
AVERAGE TAX PER DOLLAR OF CONNECTICUT ESTATE in 2014
2. Current Situation – Case of Connecticut Another interaction with the federal law is whether the state allows a separate state QTIP (Qualified Terminable Interest Property). QTIPs are a way to transfer assets to spouses while dictating who receives the assets upon the spouse’s death. • CT, along with NY, NJ, VT & DC, does not allow a separate state
QTIP election • This complicates estate planning for estates below the federal
exemption because • If choose QTIP equal to federal exemption, it creates a tax burden at state level • If choose QTIP equal to lower state exemption, it may waste a portion of the
decedent’s federal exemption
15
3. Issues to Consider & Available Evidence Distributional Considerations: • EIG taxes are typically desirable from the ‘ability to pay’ criteria as they are
paid by the very top of the wealth distribution • In 2000, 9.17% of CT deaths faced an EIG tax • In 2013, 1.75% of CT deaths faced an EIG tax
• 2014 CT DRS Tax Incidence report finds • the EIG tax is the most progressive tax • the EIG tax is only one of two progressive taxes out of the 9 considered • Paid by the top 3 deciles of the income distribution and 98% paid by top two
• A preliminary study (Brewer et al 2015) finds that • CT experienced the largest growth in income inequality (measured by the Gini)
between 1990 & 2013 of all the US states • CT has the 4th highest Gini (largest inequality) in the country in 2013 • The % of CT elderly residents in the bottom 25% of the national income distribution
has grown as well – so it is not just that the top is growing. 16
3. Issues & Evidence – Behavioral Effects Most concerns about EIG taxes regard possible effects on behaviors and incentives – such as work & investment/savings decisions. Past academic research finds that • Donor responses are complicated by the motive of the donor
• ‘Accidental’ bequests may elicit no response • Other motives include altruism (alternative definitions) towards children or exchange
(for services from children) • Presumes people are rational about planning for their deaths – some evidence that is
not true • Heirs’ behaviors may also be affected by anticipating and receiving the
bequest. (Examples – may work less in anticipation of $ or work more to gain favor…)
The empirical evidence is mixed and the bottom line is that EIG taxes could have behavioral effects that are either beneficial or detrimental to economic growth 17
3. Issues & Evidence -- Migration For state EIG taxes, the behavioral response that gets the most attention is the concern that people may move to another state to avoid them.
The challenge of these studies is to control for other state characteristics and factors that affect decisions to move (e.g., climate, cost of living, family connections, vacation habits, need for assistance)
Example – the southern states have no EIG taxes, but also have low cost-of-living and the onset of air conditioning has made their climate more attractive. These states have experienced strong in-migration from all age and income levels for
decades. How much is due to EIG taxes?
Most studies therefore focus on the elderly and try to control for other characteristics via statistical analyses.
18
3. Evidence for Migration Effects – past research Some stylized facts: • Elderly interstate migration is somewhat rare (< 1% move in any given
year) • The geographic patterns of elderly migration are very persistent over
the last 30+ years -- even while EIG taxes have changed alot
Earliest studies = find some effect of EIG taxes but often in a puzzling way – it discourages people from moving in (expected) and from moving out (not expected).
• “Same sign” problem often present in studies that only consider one point in time.
• Studies that use only 1 point in time run the danger of attributing to EIG taxes (or any policy) the effects of other characteristics the state possesses but is not controlled for.
19
3. Evidence for Migration Effects – past research More recent studies = examine how changes in tax policy lead to changes in migration (and EIG taxes have changed a lot).
These studies tend to find little or no effect of taxes. Some key studies: • Our past work using census-based migration data, by age & income=finds no
effect of EIG taxes or income tax breaks for the elderly • Bakija & Slemrod (2004) use an indirect measure of migration, the # of federal
estate tax returns filed in the state = finds a modest effect but not strong enough to make up for lost revenues
• Brulhart & Parchet (2014) study cantonal estate taxes in Switzerland = finds no effect
• Studies of ‘millionaire taxes’ by Varner & Young (2011, forthcoming) = finds little or no effect of millionaire income taxes on migration.
• Two studies that have found effects of income taxes on migration are limited to inventors (Moretti and Wilson 2015) and star athletes (Kleven et al 2010).
Recent research therefore provides little evidence that migration is substantially
affected by EIG taxes (or millionaire taxes) 20
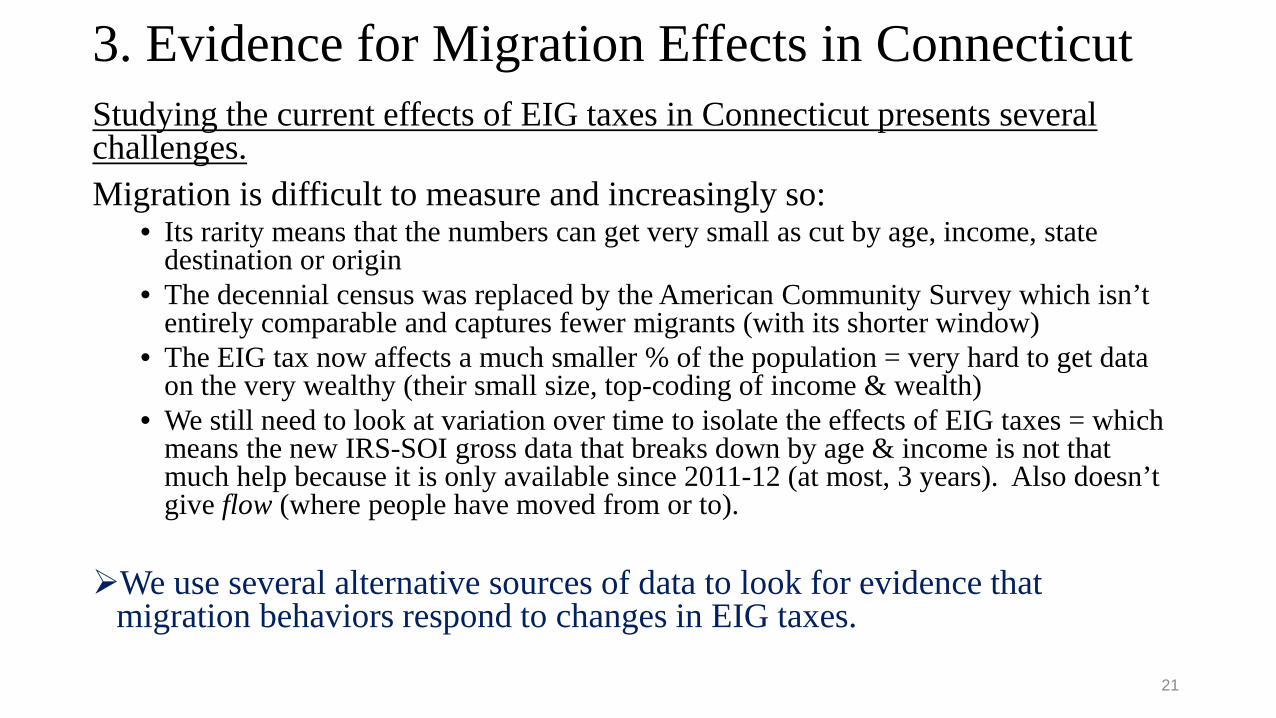
3. Evidence for Migration Effects in Connecticut Studying the current effects of EIG taxes in Connecticut presents several challenges. Migration is difficult to measure and increasingly so:
• Its rarity means that the numbers can get very small as cut by age, income, state destination or origin
• The decennial census was replaced by the American Community Survey which isn’t entirely comparable and captures fewer migrants (with its shorter window)
• The EIG tax now affects a much smaller % of the population = very hard to get data on the very wealthy (their small size, top-coding of income & wealth)
• We still need to look at variation over time to isolate the effects of EIG taxes = which means the new IRS-SOI gross data that breaks down by age & income is not that much help because it is only available since 2011-12 (at most, 3 years). Also doesn’t give flow (where people have moved from or to).
We use several alternative sources of data to look for evidence that migration behaviors respond to changes in EIG taxes.
21
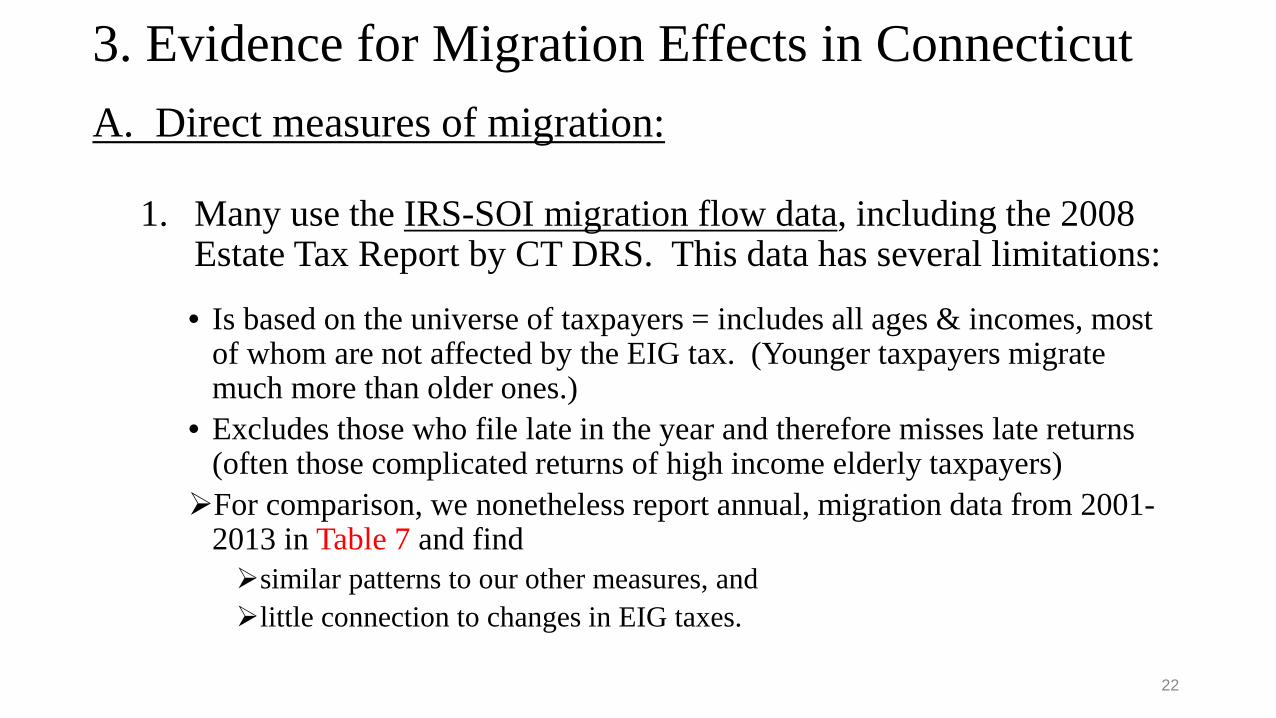
3. Evidence for Migration Effects in Connecticut A. Direct measures of migration:
1. Many use the IRS-SOI migration flow data, including the 2008
Estate Tax Report by CT DRS. This data has several limitations:
• Is based on the universe of taxpayers = includes all ages & incomes, most of whom are not affected by the EIG tax. (Younger taxpayers migrate much more than older ones.)
• Excludes those who file late in the year and therefore misses late returns (often those complicated returns of high income elderly taxpayers) For comparison, we nonetheless report annual, migration data from 2001-
2013 in Table 7 and find similar patterns to our other measures, and little connection to changes in EIG taxes.
22
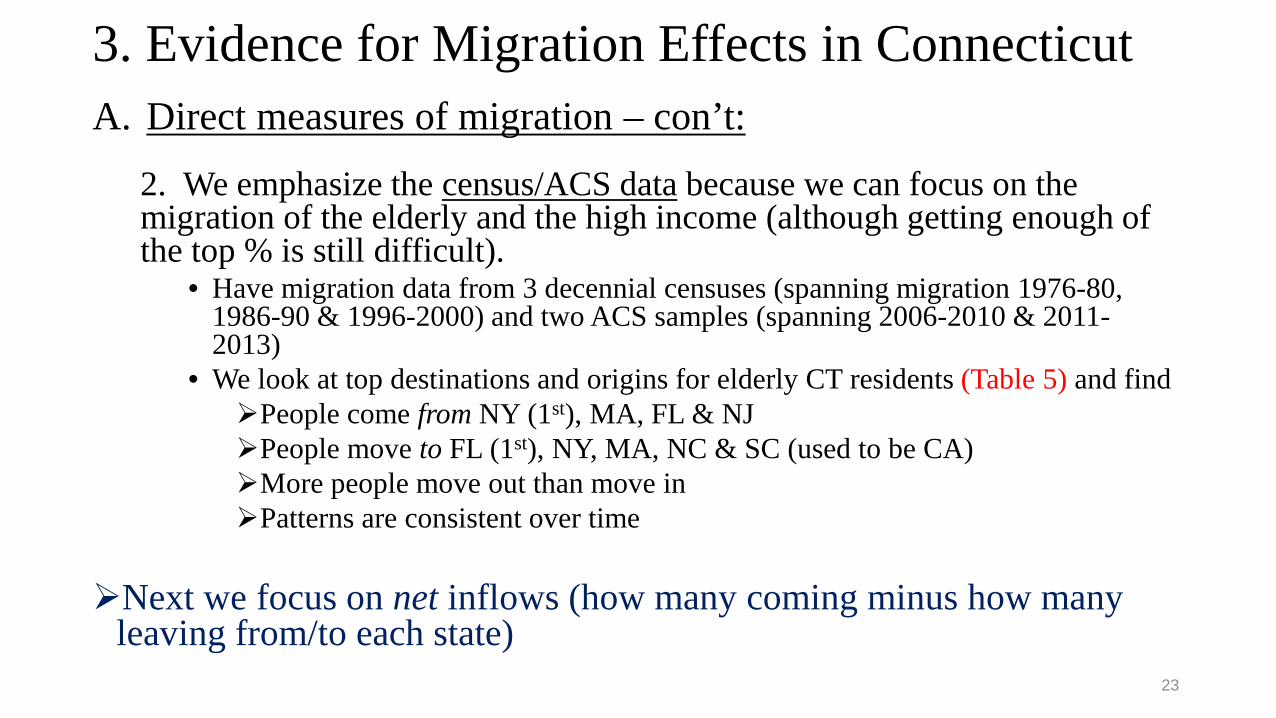
3. Evidence for Migration Effects in Connecticut A. Direct measures of migration – con’t:
2. We emphasize the census/ACS data because we can focus on the migration of the elderly and the high income (although getting enough of the top % is still difficult).
• Have migration data from 3 decennial censuses (spanning migration 1976-80, 1986-90 & 1996-2000) and two ACS samples (spanning 2006-2010 & 2011-2013)
• We look at top destinations and origins for elderly CT residents (Table 5) and find People come from NY (1st), MA, FL & NJ People move to FL (1st), NY, MA, NC & SC (used to be CA) More people move out than move in Patterns are consistent over time
Next we focus on net inflows (how many coming minus how many
leaving from/to each state) 23
24
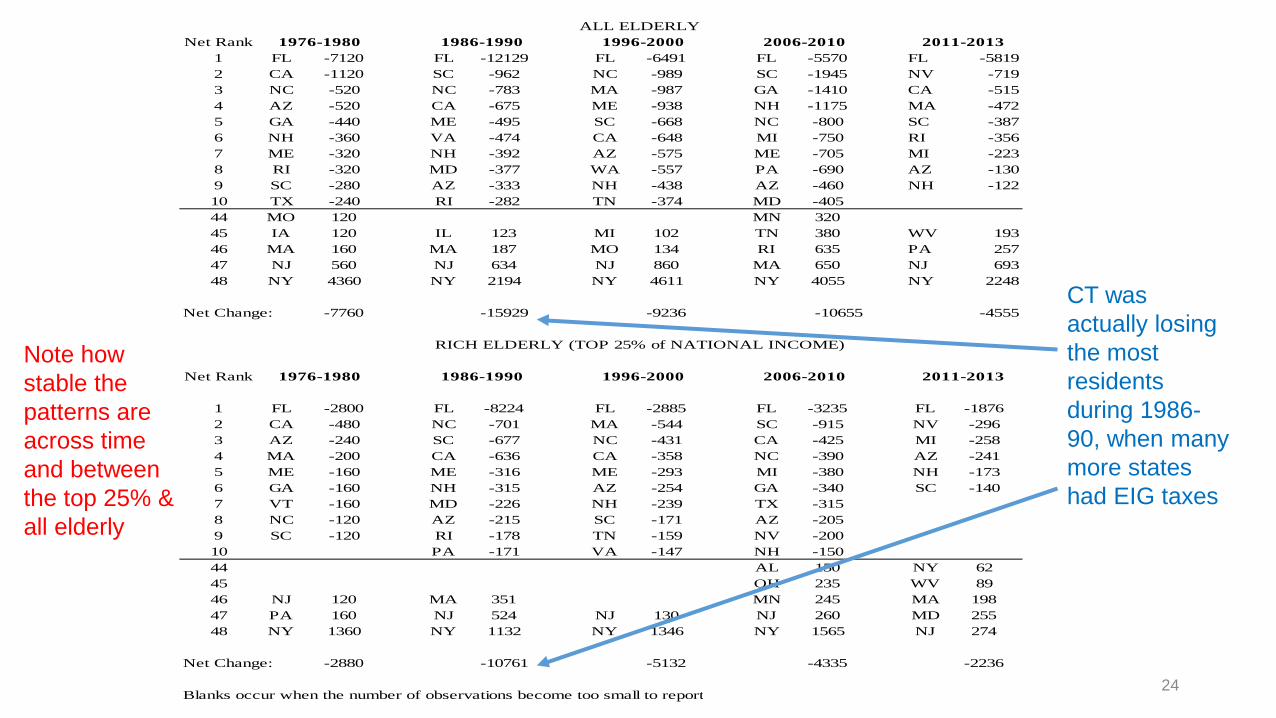
Net Rank1 FL -7120 FL -12129 FL -6491 FL -5570 FL -58192 CA -1120 SC -962 NC -989 SC -1945 NV -7193 NC -520 NC -783 MA -987 GA -1410 CA -5154 AZ -520 CA -675 ME -938 NH -1175 MA -4725 GA -440 ME -495 SC -668 NC -800 SC -3876 NH -360 VA -474 CA -648 MI -750 RI -3567 ME -320 NH -392 AZ -575 ME -705 MI -2238 RI -320 MD -377 WA -557 PA -690 AZ -1309 SC -280 AZ -333 NH -438 AZ -460 NH -12210 TX -240 RI -282 TN -374 MD -40544 MO 120 MN 32045 IA 120 IL 123 MI 102 TN 380 WV 19346 MA 160 MA 187 MO 134 RI 635 PA 25747 NJ 560 NJ 634 NJ 860 MA 650 NJ 69348 NY 4360 NY 2194 NY 4611 NY 4055 NY 2248
Net Change: -7760 -15929 -9236 -10655 -4555
Net Rank
1 FL -2800 FL -8224 FL -2885 FL -3235 FL -18762 CA -480 NC -701 MA -544 SC -915 NV -2963 AZ -240 SC -677 NC -431 CA -425 MI -2584 MA -200 CA -636 CA -358 NC -390 AZ -2415 ME -160 ME -316 ME -293 MI -380 NH -1736 GA -160 NH -315 AZ -254 GA -340 SC -1407 VT -160 MD -226 NH -239 TX -3158 NC -120 AZ -215 SC -171 AZ -2059 SC -120 RI -178 TN -159 NV -20010 PA -171 VA -147 NH -15044 AL 150 NY 6245 OH 235 WV 8946 NJ 120 MA 351 MN 245 MA 19847 PA 160 NJ 524 NJ 130 NJ 260 MD 25548 NY 1360 NY 1132 NY 1346 NY 1565 NJ 274
Net Change: -2880 -10761 -5132 -4335 -2236
Blanks occur when the number of observations become too small to report
2011-2013
2011-2013
ALL ELDERLY
RICH ELDERLY (TOP 25% of NATIONAL INCOME)
1976-1980 1986-1990 1996-2000 2006-2010
1976-1980 1986-1990 1996-2000 2006-2010Note how stable the patterns are across time and between the top 25% & all elderly
CT was actually losing the most residents during 1986-90, when many more states had EIG taxes
3. Evidence for Migration Effects for Connecticut B. Indirect Measures of Migration
1. Federal estate tax returns (by year of death) filed in Connecticut (as in Bakija & Slemrod 2004). May be better at capturing the very rich, but has limitations: • An indirect measure – must have moved to the state and died
there to be counted • The number of federal estate tax returns is changing over time
because of changes in wealth but also during the 2000s because of the steep increase in the exemption
• We therefore compare the trend for CT to other states • Reported in Figures 6-8
25
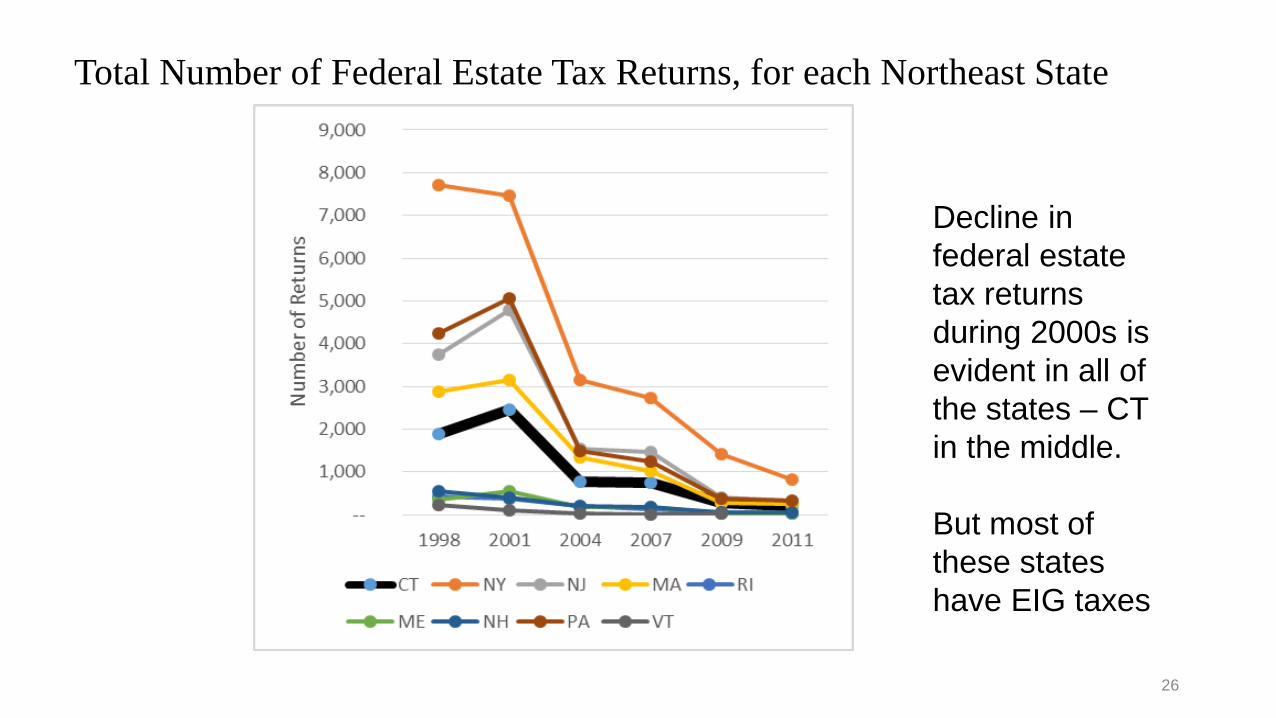
Total Number of Federal Estate Tax Returns, for each Northeast State
26
Decline in federal estate tax returns during 2000s is evident in all of the states – CT in the middle. But most of these states have EIG taxes
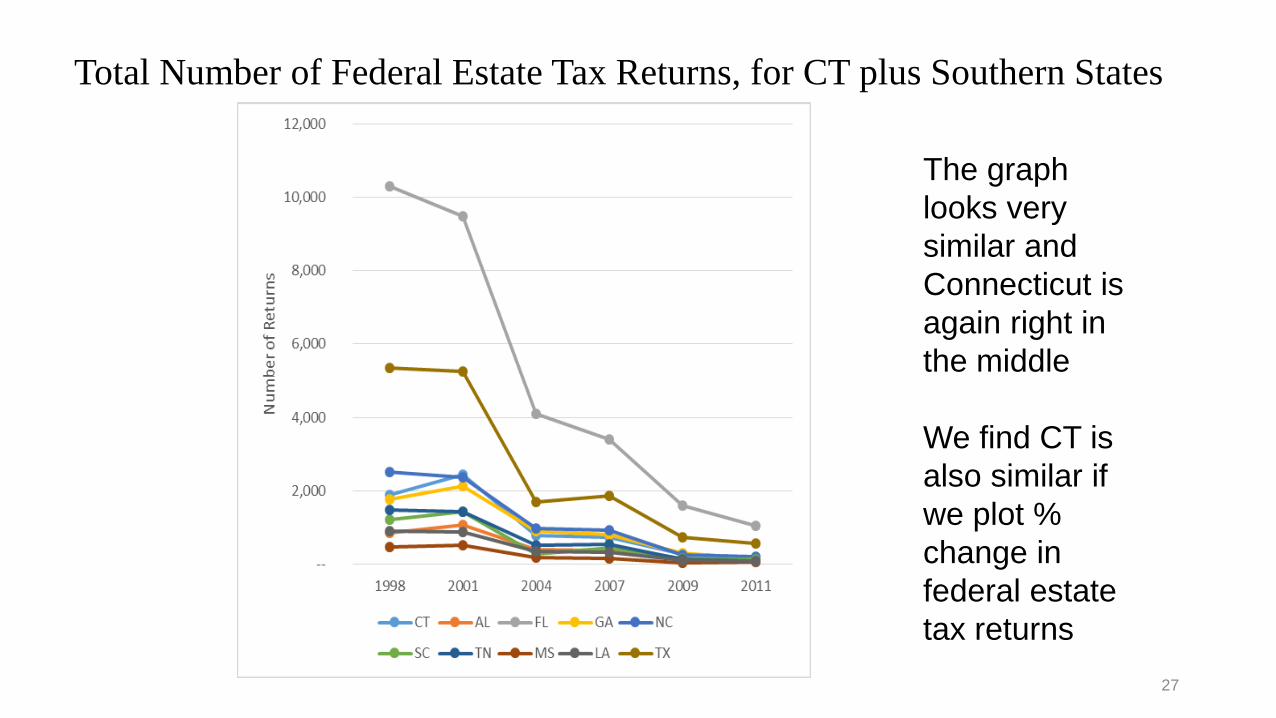
Total Number of Federal Estate Tax Returns, for CT plus Southern States
27
The graph looks very similar and Connecticut is again right in the middle We find CT is also similar if we plot % change in federal estate tax returns
3. Evidence for Migration Effects for Connecticut B. Indirect Measures of Migration
2. CT income tax returns for high income filers who seem likely to be older (are claiming the social security adjustment). May also be better at capturing the very rich, but has limitations:
• Changes in the # of returns can be due to changes in income, aging into social security, or death -- and not necessary net-migration.
• There is no measure of ‘age’ and SS adjustment claim is an imperfect measure of being elderly
• It is only available since 2007 – only big change in CT EIG tax is the 2009 law, coincided with the recession.
• We compare across income groups and to those without SS adjustment
• Reported in Figures 9A & 9B 28
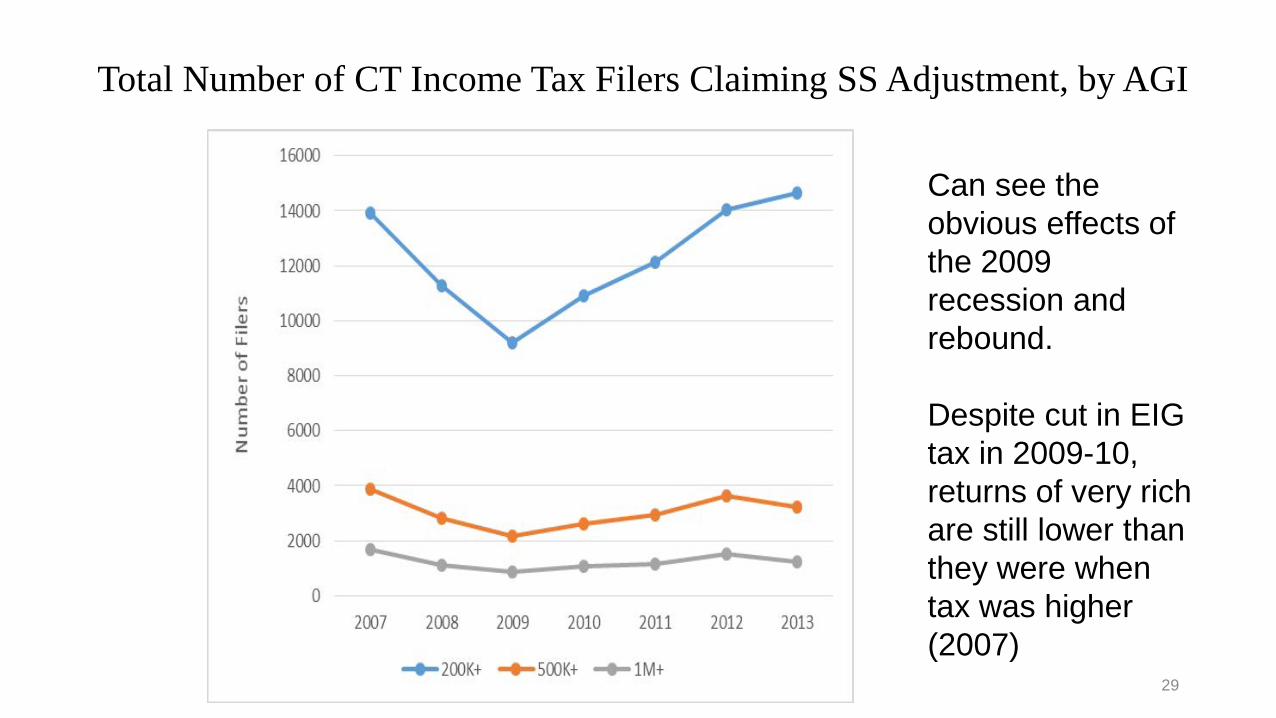
Total Number of CT Income Tax Filers Claiming SS Adjustment, by AGI
29
Can see the obvious effects of the 2009 recession and rebound. Despite cut in EIG tax in 2009-10, returns of very rich are still lower than they were when tax was higher (2007)
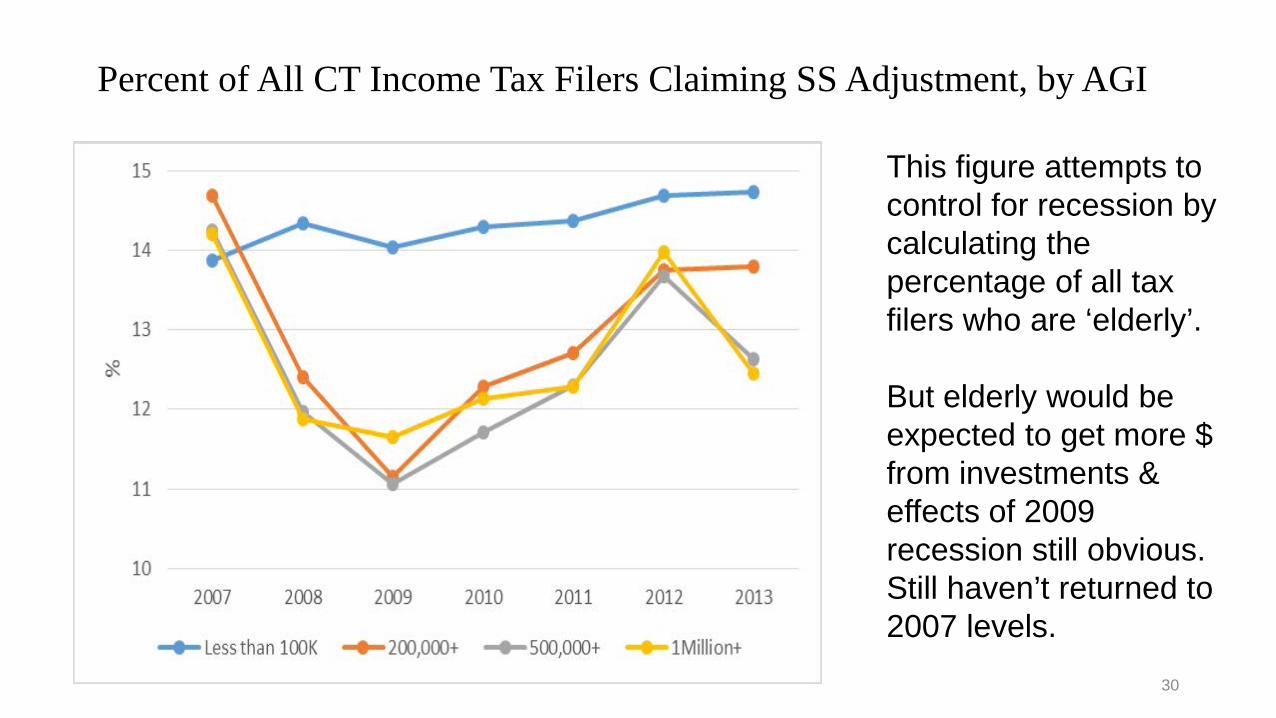
Percent of All CT Income Tax Filers Claiming SS Adjustment, by AGI
30
This figure attempts to control for recession by calculating the percentage of all tax filers who are ‘elderly’. But elderly would be expected to get more $ from investments & effects of 2009 recession still obvious. Still haven’t returned to 2007 levels.
3. Evidence for Economic Growth
• Little evidence that migration or other behaviors are affected, but they can be hard to measure and identify.
• Behavioral effects are primarily a concern because they may affect economic growth Study the effects on economic growth directly.
• To our knowledge, there are no past studies other than preliminary work by Brewer et al (2015)
• find no significant effect in standard tax growth models
31
3. Evidence for Economic Growth for CT • Two Measures of Economic Growth (both annualized growth rates) 1. Gross State Product (or GDP by state) Per Capita 2. Per Capita Income Per Capita Per capita better captures the well-being of the average CT resident. Compare across different types of states
General Findings (reported in Figures 10-12) 1. The two growth measures yield similar trends 2. CT follows the same pattern as other states, those with and those without
EIG taxes 3. CT appears to experience greater volatility in its growth, especially
personal income, but has since 1978.
32
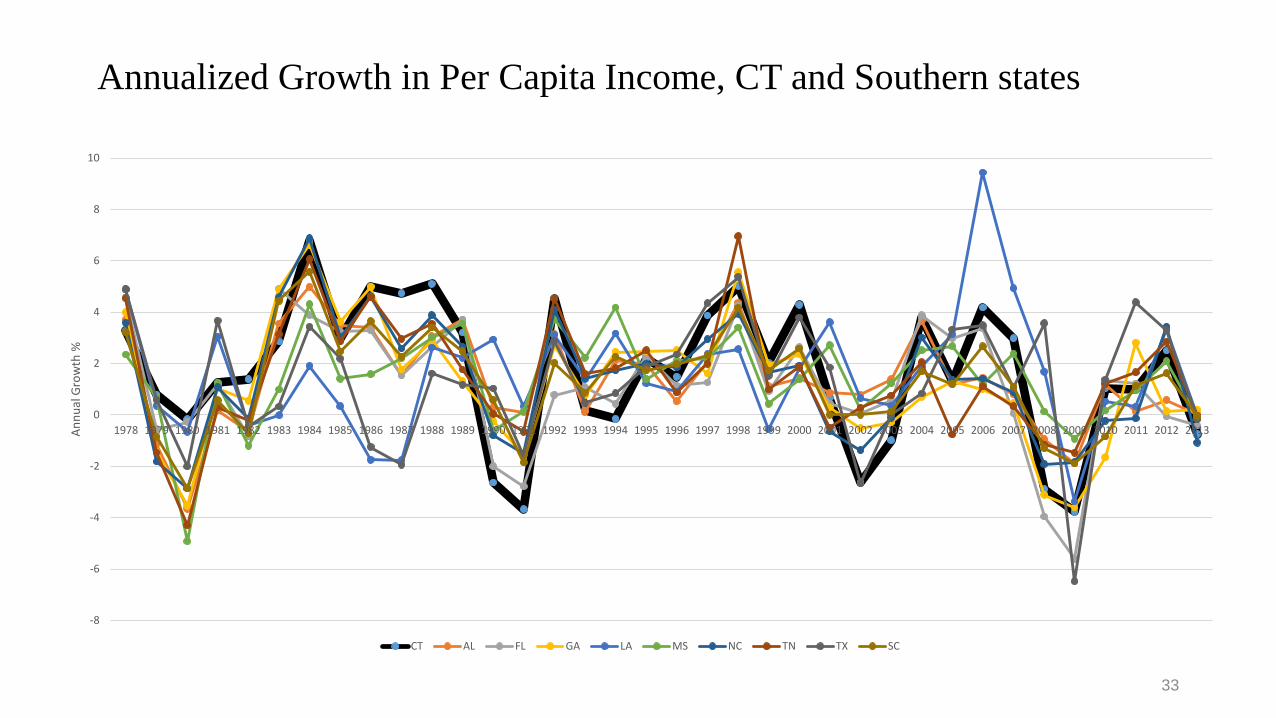
Annualized Growth in Per Capita Income, CT and Southern states
33
-8
-6
-4
-2
0
2
4
6
8
10
1978 1979 1980 1981 1982 1983 1984 1985 1986 1987 1988 1989 1990 1991 1992 1993 1994 1995 1996 1997 1998 1999 2000 2001 2002 2003 2004 2005 2006 2007 2008 2009 2010 2011 2012 2013Annu
al G
row
th %
CT AL FL GA LA MS NC TN TX SC
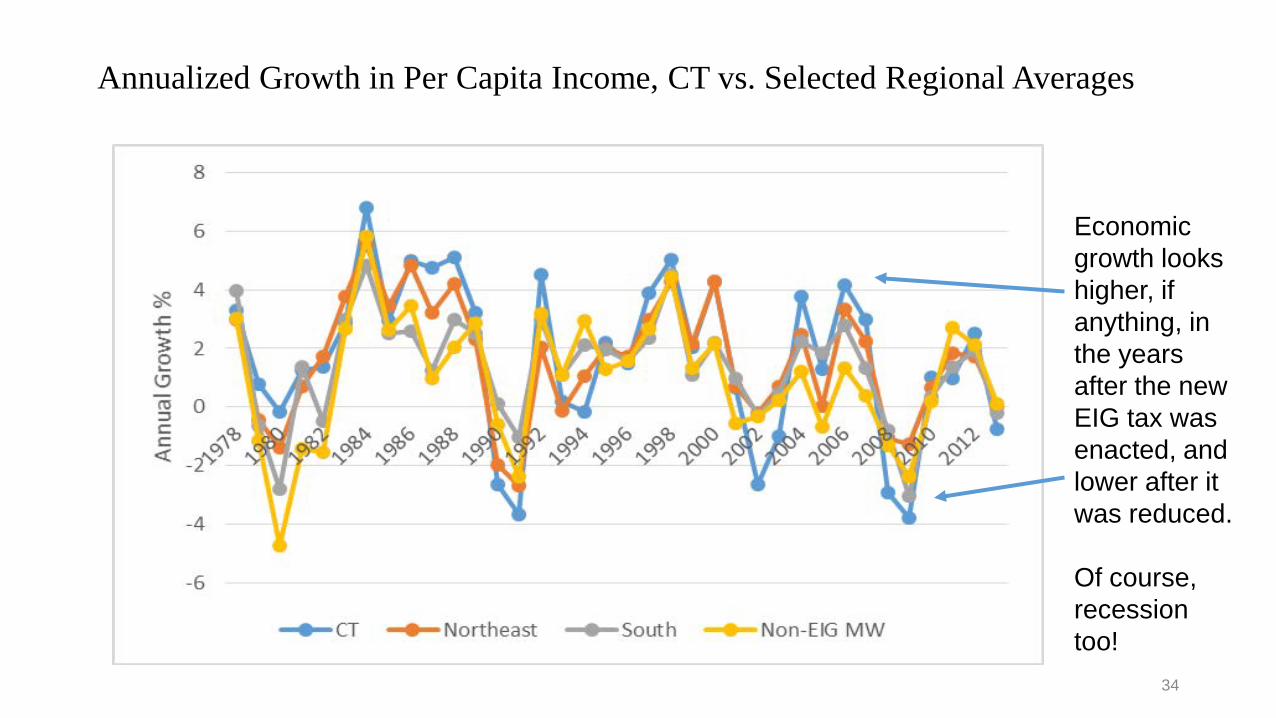
Annualized Growth in Per Capita Income, CT vs. Selected Regional Averages
34
Economic growth looks higher, if anything, in the years after the new EIG tax was enacted, and lower after it was reduced. Of course, recession too!
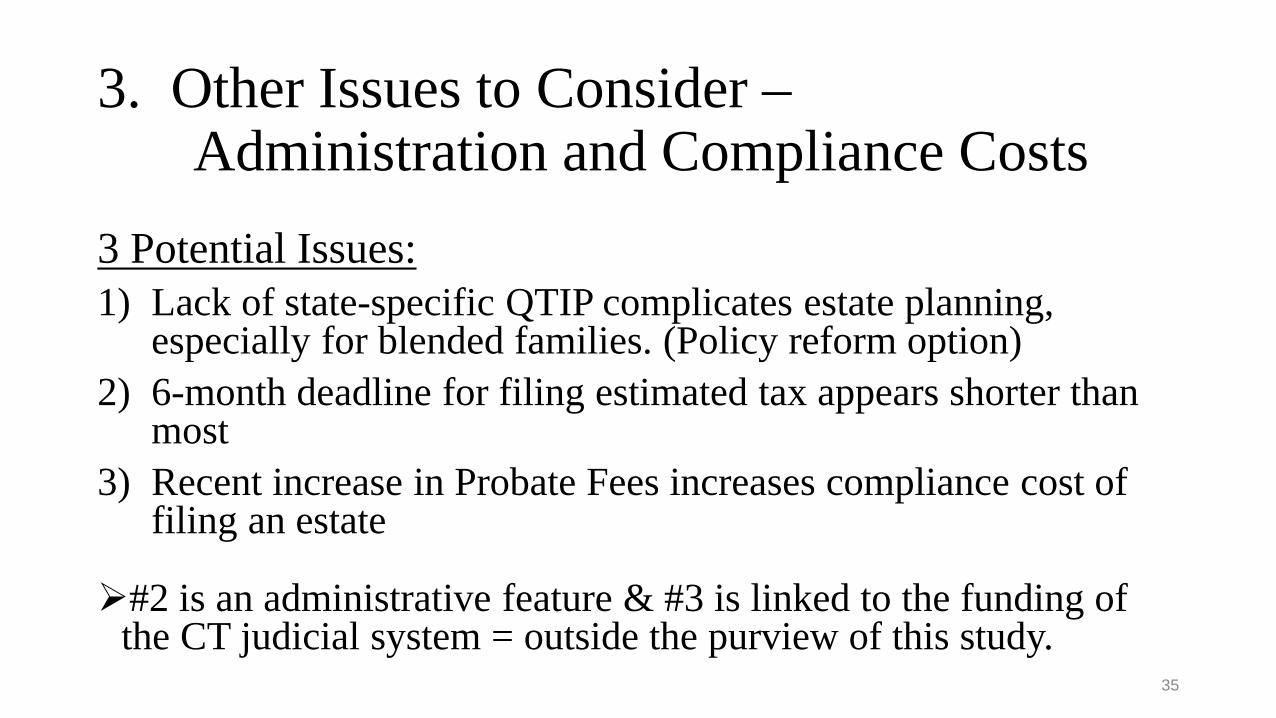
3. Other Issues to Consider – Administration and Compliance Costs 3 Potential Issues: 1) Lack of state-specific QTIP complicates estate planning,
especially for blended families. (Policy reform option) 2) 6-month deadline for filing estimated tax appears shorter than
most 3) Recent increase in Probate Fees increases compliance cost of
filing an estate
#2 is an administrative feature & #3 is linked to the funding of the CT judicial system = outside the purview of this study.
35
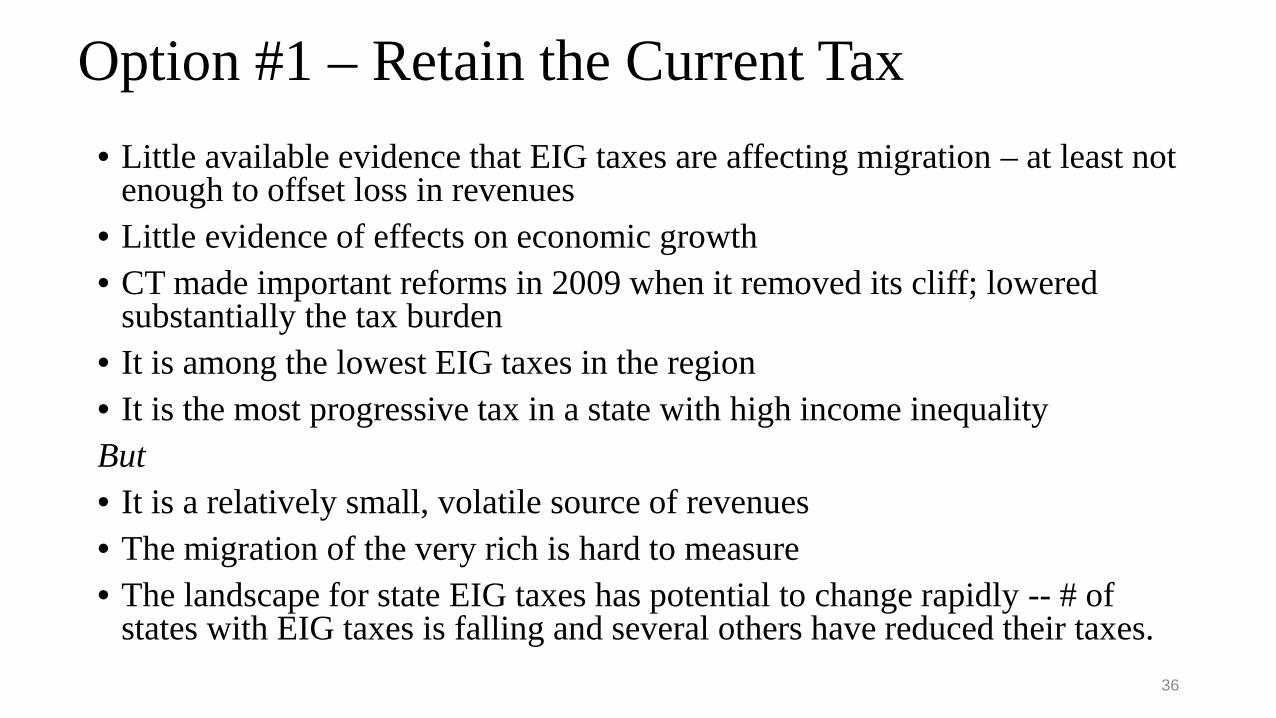
Option #1 – Retain the Current Tax • Little available evidence that EIG taxes are affecting migration – at least not
enough to offset loss in revenues • Little evidence of effects on economic growth • CT made important reforms in 2009 when it removed its cliff; lowered
substantially the tax burden • It is among the lowest EIG taxes in the region • It is the most progressive tax in a state with high income inequality But • It is a relatively small, volatile source of revenues • The migration of the very rich is hard to measure • The landscape for state EIG taxes has potential to change rapidly -- # of
states with EIG taxes is falling and several others have reduced their taxes. 36
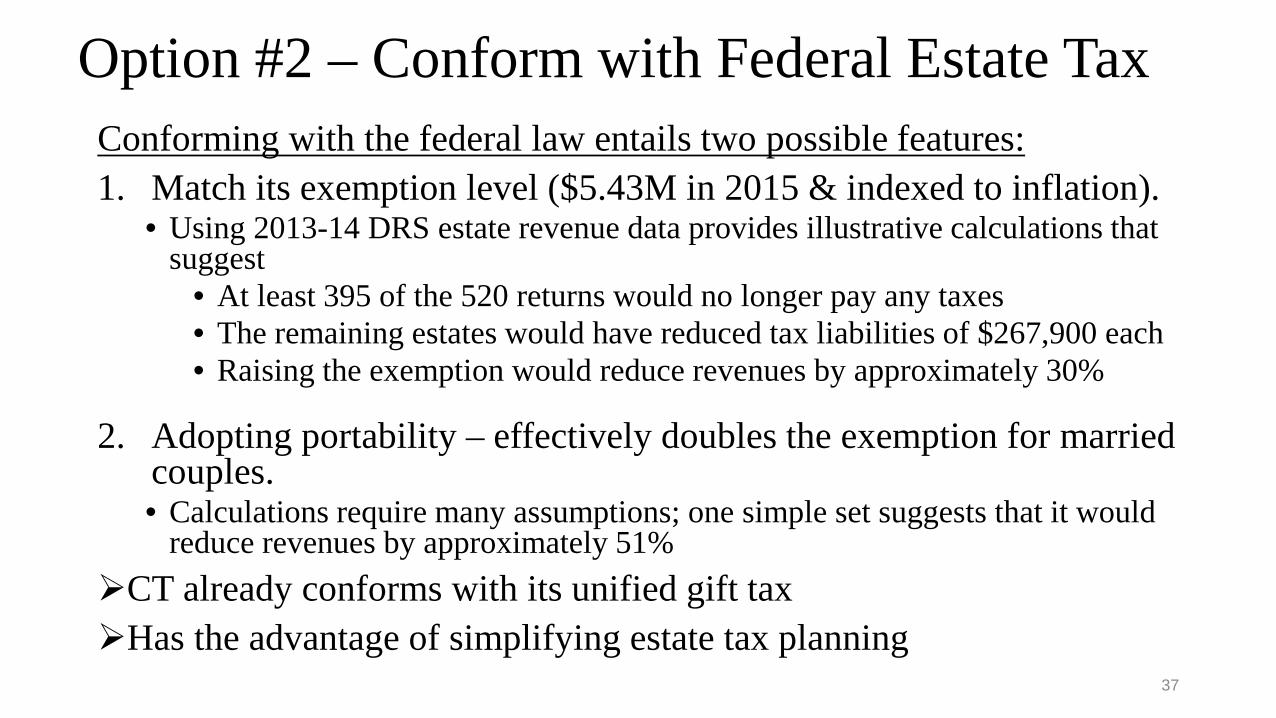
Option #2 – Conform with Federal Estate Tax Conforming with the federal law entails two possible features: 1. Match its exemption level ($5.43M in 2015 & indexed to inflation).
• Using 2013-14 DRS estate revenue data provides illustrative calculations that suggest
• At least 395 of the 520 returns would no longer pay any taxes • The remaining estates would have reduced tax liabilities of $267,900 each • Raising the exemption would reduce revenues by approximately 30%
2. Adopting portability – effectively doubles the exemption for married couples. • Calculations require many assumptions; one simple set suggests that it would
reduce revenues by approximately 51% CT already conforms with its unified gift tax Has the advantage of simplifying estate tax planning
37
Option #3 – Allow for a Different QTIP Election
• Connecticut is one of 5 states that does not allow a separate QTIP election
• A different QTIP election will allow married couples to defer the payment of CT tax without forgoing the full federal exemption
• Would simplify estate tax planning • Would result in a loss of revenue – but it seems minimal as
QTIPs fall out of favor with the advent of federal portability
38
Option #4 – Increase the Marginal Tax Rate on those Paying Federal Estate Taxes • This is the only option presented here that has the potential to increase
EIG tax revenues. • Once an estate exceeds the federal limit, state EIG taxes paid reduce
the federal liability and in effect receive a subsidy (recall Figure 5.) • The top rate of 12% is actually only (1-.4)*12 = 7.2% net of federal taxes • Estates just above the federal exemption currently face a negative marginal tax
rate net of federal taxes • States can capture a portion of federal revenues, as with the old pickup tax.
• CT’s top rate is currently one of the lowest in the country • Would increase the tax burden, but by less than the revenues raised 39
Option #5 – Eliminate the Gift Tax • Connecticut is the only state with a stand-alone gift tax. But --
• Many states have ‘gift-in-contemplation-of-death’ rules that make gifts made shortly before death (2-3 years) taxable.
• In some states that base their EIG taxes on the old pickup tax (MA is one), lifetime taxable gifts may reduce the available exemption.
• CT would lose its gift tax revenues, which equaled $8.7M in 2013-14.
• Would also open the door to deathbed gift-planning strategies which could substantially reduce estate taxes.
• State could consider enacting gifts-in-contemplation-of-death rules like other states with EIG taxes have done.
40
Option #6 – Eliminate the Estate & Gift Tax • Renders the rest of these changes moot • Connecticut would join the majority of other states without EIG taxes
and be the only state in the region besides NH without one • It would eliminate both gift & estate tax revenues, which in 2013-14
equaled $206M, a source of revenue that is typically less than 2% of revenues.
• There is little evidence to suggest that revenues would be made up for with behavioral responses such as migration or with increased economic growth.
• It would eliminate the most progressive tax in its system
41


![20151027 - MILO Study Information Poster - RCT - [FINAL]-O](https://img.pdfslide.net/doc/110x75/58ef44af1a28ab2e0a8b4649/20151027-milo-study-information-poster-rct-final-o.jpg)