Embed Size (px)
Citation preview

1
The Consequences of Allowing Home Country Auditors to Audit Cross-listed Firms: Evidence from Hong Kong-listed H Share Firms
Manyi Fan1, Bin Ke2, Wenruo Wu3, Lijun Xia4, and Qingquan Xin5
April 8, 2020
We wish to thank Xi Wu (discussant), Donghua Chen, Pingyang Gao, Yongxiang Wang, and workshop participants at the Nanjing University and the 3rd New Institutional Accounting Conference (Shanghai, 2019) for helpful comments. 1 Department of Accounting, NUS Business School, National University of Singapore, B01-03, 1 Business Link, Singapore 117592. Email: [email protected].
2 Department of Accounting, NUS Business School, National University of Singapore, Mochtar Riady Building, BIZ 1, # 07-53, 15 Kent Ridge Drive, Singapore 119245.Tel: +65 6601 3133. Fax: +65 6773 6493. Email: [email protected].
3 Antai College of Economics and Management, Shanghai Jiao Tong University, Shanghai, P.R. China 200030. Tel: +86-183 1707 8667. Email: [email protected].
4 Antai College of Economics and Management, Shanghai Jiao Tong University, Shanghai, P.R. China 200030. Tel: +86-21-6293 2639. Email: [email protected].
5 Chongqing University. Email: [email protected].

The Consequences of Allowing Home Country Auditors to Audit Cross-listed Firms: Evidence from Hong Kong-listed H Share Firms
April 8, 2020

The Consequences of Allowing Home Country Auditors to Audit Cross-listed Firms: Evidence from Hong Kong-listed H Share Firms
ABSTRACT
We examine the consequences of a 2010 Hong Kong regulation that allows, for the first time, companies incorporated in mainland China and cross-listed in Hong Kong (H share companies) to hire mainland domiciled auditors to audit their Hong Kong financial reports. We find that less than one third of the H share companies switched to mainland auditors. The switchers experience a decline in both audit fees and audit quality. Surprisingly, the non-switchers also experience a marginally significant decline in audit quality, consistent with the hypothesis that competition from mainland domiciled auditors could lead to a race to the bottom.
Key words: audit fees; audit quality; auditing regulation; cross-listed firms; auditor competition; China; Hong Kong
JEL: M41; M49; D43

1
1. Introduction
Cross listing has been a popular mechanism through which firms domiciled in home
countries with weak investor protection raise equity capital from investors domiciled in host
countries with strong investor protection.1 However, due to severe information asymmetry
between cross-listed firms from weak institutional environments and their investors in the host
countries, the financial reporting quality of these cross-listed firms has always been a concern
to regulators and investors (Chen et al. 2016). The recent admission of accounting fraud by
Luckin Coffee, a Starbucks wannabe in China, and subsequent implosion of the firm’s stock
price once again reminded investors and regulators the challenges of conducting reliable due
diligence on faraway companies. While securities regulators employ a variety of weapons to
combat such risks, audit firms have been one of the critical gatekeepers in safeguarding the
interests of cross-listed firms’ investors. Accordingly, securities regulators around the world
have spent considerable resources in regulating the behaviour of cross-listed firms’ auditors.
There are two contrasting approaches to regulating the audit market of cross-listed firms.
At one extreme, the securities regulators of a host country allow only the auditors domiciled in
the host country to audit the books of cross-listed firms (hereafter referred to as approach one).
At the other extreme, the securities regulators of a host country allow either the host country
auditors or any eligible third-country auditors (typically home country auditors) approved by
the host country regulators to audit the books of cross-listed firms (hereafter referred to as
approach two). To our best knowledge, most countries including the U.S. adopts the second
approach. However, Hong Kong adopted the first approach for mainland China incorporated H
Share firms prior to 2010 and Singapore is considering to adopt the first approach.2
1 For example, China’s Alibaba raised a whopping USD25 billion in its IPO on NYSE on September 18, 2014. It was the largest IPO in the world before the listing of Saudi Arabia’s giant state-owned oil company, Saudi Aramco, in 2019. 2 See https://www.sgx.com/regulation/public-consultations/20200116-consultation-paper-enhancements-regulatory-regime-property.

2
Ex ante it is difficult to predict which regulatory approach can better serve the interests of
cross-listed firms’ investors because the auditors under the two contrasting approaches are
subject to different incentives, local information advantage, and production cost function (Ke
et al. 2015). To our best knowledge, there has been little research on the costs and benefits of
adopting these two contrasting regulatory approaches.
The objective of this study is to shed light on this important issue by taking advantage of
an exogenous Hong Kong regulatory regime change for the H share firms listed on the Hong
Kong Stock Exchange. H share firms are mainland Chinese investor-controlled companies that
are incorporated in mainland China but listed in Hong Kong. Prior to the regulatory regime
change in 2010, H share companies were required by the Hong Kong Stock Exchange to
prepare their financial reports under the International Financial Reporting Standards (IFRS)
and be audited by a Hong Kong domiciled audit firm (i.e., approach one).3,4 On December 10,
2010, the Hong Kong Stock Exchange announced the “Consultation Conclusions on
Acceptance of Mainland Accounting and Auditing Standards and Mainland Audit Firms for
Mainland Incorporated Companies Listed in Hong Kong” that would allow H share companies
to use mainland Chinese accounting and auditing standards and mainland Chinese audit firms
for the purposes of Hong Kong reporting (i.e., approach two).5 The new regime took effect for
the H share companies whose annual accounting periods ended on or after December 15, 2010.
Subsequently China’s Ministry of Finance (MOF) allowed 12 largest mainland Chinese audit
firms (including the Big Four affiliates in mainland China) to be eligible to audit the H share
3 Hong Kong Financial Reporting Standards (HKFRS) were fully converged with IFRS starting with annual reporting periods commencing from 1 January 2005 (IFRS Foundation 2018). 4 Prior to 2010, if an H share company was also listed on a mainland China’s stock exchange (referred to as an AH firm), the firm would also be required to prepare another set of financial reports based on mainland China’s GAAP and audited by a mainland Chinese audit firm for mainland Chinese investors. 5 Since 2007 mainland China’s accounting standards have been substantially converged with the IFRS. In December 2007, the China Accounting Standards Committee and the Hong Kong Institute of Certified Public Accountants (HKICPA) jointly declared that the accounting standards in mainland China and Hong Kong have been substantially converged, after a line-by-line examination by professional accountants and auditors across the borders (Chan 2008). The 2007 annual reports of AH firms prepared under the mainland Chinese GAAP and the Hong Kong GAAP showed almost no differences (Chu 2008).

3
companies for the purposes of Hong Kong reporting.6 We investigate two specific research
questions: (1) which types of H share companies would switch to mainland auditors? (2) What
are the effects of the regulation on H share companies’ audit fees and audit quality?
We start our empirical analyses by analysing whether any existing H share companies
switched to mainland Chinese auditors after the regulation. Ex ante the answer is unclear
because switching entails both costs and benefits. For example, switching to mainland auditors
could allow an H share firm to save audit costs due to mainland auditors’ lower audit production
costs and local information advantage. On the other hand, Hong Kong auditors are regarded as
higher quality auditors due to the stronger regulatory enforcement and market institutions (Ke
et al. 2015) and therefore switching to mainland auditors could send a negative signal to the
capital market and increase an H share firm’s future capital raising costs. There were a total of
144 H share companies immediately prior to the 2010 regulation change. 66% (92%) of the H
share companies in 2009 were audited by the Big Four based on the number of audit clients
(based on the total assets of audit clients). From 2009 to 2015, our last sample year, the market
share of the Hong Kong auditors as a whole dropped from 100% to 68% based on the number
of audit clients and from 100% to 84% based on the total assets of audit clients, suggesting that
larger audit clients are less likely to switch to mainland auditors. The market share of the Hong
Kong Big Four dropped from 66% to 44% based on the number of audit clients and 92% to 76%
based on the total assets of audit clients. The comparable market share changes for the Hong
Kong non-Big Four are 34% to 24% based on the number of audit clients and 8% to 8% based
on the total assets of audit clients. Overall, these results show that the Hong Kong auditors still
hold the majority share of the H share market, especially in the audit market of the larger H
share companies.
6 The 12 mainland auditors include PricewaterhouseCoopers Zhong Tian (i.e. PwC China), Deloitte Huayong (i.e. Deloitte China), KPMG Huazhen (i.e. KPMG China), Ernst & Young Hua Ming (i.e. Ernst & Young China), BDO China Shu Lun Pan (i.e. BDO China), Pan-China, Shu Lun Pan Da Hua, ShineWing, Crowe Horwath China, RSM China, Grant Thornton China and WUYIGE.
4
We next examine the determinants of the H share companies’ switching decisions following
the regulation change. The first factor we consider is the expected audit fee saving resulting
from the auditor switch because one of the Hong Kong Stock Exchange’s motivations for the
2010 regulatory change was to reduce H share companies’ compliance costs and facilitate
mainland Chinese companies’ capital raising in Hong Kong (HKEx 2009; Zheng 2011). The
second factor we consider is managerial incentives. Following Fan and Wong (2005), we use
the wedge between a firm controlling shareholder’s voting rights and cash flow rights as a
proxy for managerial incentives. The third factor we consider is a firm’s external financing
needs (Durnev and Kim 2005). Due to the significant differences in the legal environments
between Hong Kong and mainland China, some market observers expressed concerns that the
regulation reform would erode investors’ confidence in the quality of Hong Kong’s capital
markets (O’Keeffe 2011; Lee 2009). We find that H share firms that expect greater audit fee
saving are more likely to switch to mainland auditors after the regulation. We find no evidence
that H share firms’ wedge affects the switching decision, but we find that H share firms with
greater external financing need are less likely to switch. Overall, these results suggest that the
management of H share companies considers both the benefits (i.e., expected audit fee saving)
and costs (i.e., cost of capital) when deciding to switch or not.
Our second research question investigates the impact of the regulation on H share
companies’ audit fees and audit quality. Follow prior research (e.g. DeFond et al. 2000; Chen
et al. 2001), we use audit opinion as the proxy for audit quality. To control for potential
confounding effects, we use the Red Chip firms, which are not subject to the regulation change,
as our control sample in our difference-in-differences research design. Red Chip firms are

5
defined as mainland Chinese investor-controlled firms that are incorporated outside mainland
China and listed on the Hong Kong Stock Exchange.7
Because the regulation change applies to all H share companies, we first examine the impact
of the regulation change on all H share companies as a whole. We find that, compared with Red
Chip firms, H share companies experience a significant reduction in both audit fees and audit
quality after the regulation change.
To identify the sources of the reduction in audit fees and audit quality, we also examine the
impact of the regulation change on the H share companies that switch to mainland auditors after
the regulation (the switchers) and the H share companies that continue to employ Hong Kong
auditors after the regulation (the non-switchers). We find that the audit fee reduction for the
full sample is attributed to the switchers only. We find no evidence that the non-switchers
experience a reduction in audit fees following the regulation. However, we find that the
reduction in audit quality for the full sample is attributed to both the switchers and non-
switchers. The fact that the non-switchers also experience an audit quality reduction in the post-
regulation period suggests that introducing the mainland Chinese auditors into the Hong Kong
audit market put a competitive pressure on the incumbent Hong Kong auditors, resulting in a
race to the bottom. It is interesting to note that the channel through which this competitive
pressure manifests is audit quality rather than audit fees. One interpretation of this finding is
that incumbent Hong Kong auditors and their audit clients are reluctant to reduce the audit fees
because such reductions would be highly visible to stock market investors. On the other hand,
audit quality is a classic example of credence goods (Dulleck and Kerschbamer 2006; Causholli
and Knechel 2012) and therefore any compromise in audit quality would not raise immediate
alarm among investors.
7 As shown in section 3, we find no evidence that the auditors of Red Chip firms are affected by the 2010 regulation change.

6
We contribute to two streams of existing literature. Our first contribution is to the literature
on audit firm regulation. Most studies in the literature focus on audit firm regulation within one
single jurisdiction (e.g. the studies on the effect of Sarbanes-Oxley Act). Since the
establishment of the PCAOB, the regulation of auditors across jurisdictions has attracted
growing interest around the world, partially due to the PCAOB’s limited ability to inspect
foreign domiciled auditors (e.g. PCAOB 2010; SEC 2018). However, most studies take the
existing U.S. auditing regulatory regime as given and instead focus on the operations and
effectiveness of the PCAOB. In contrast, our study examines the costs and benefits of two
alternative approaches to regulating auditors across different jurisdictions.
Second, we contribute to the ongoing debate on the effect of audit market competition on
audit quality. Due to the increasing concentration of the audit market in many countries, policy
makers around the world have shown a great interest in understanding the degree of audit
market competition and the effect of competition on audit firm behavior (e.g., Pickard and
Marriage 2018). The existing literature has tackled this issue using different approaches. Many
studies examine the relation between endogenous audit market concentration and audit fees
and/or audit quality and report mixed results.8 Other studies analyze the effect of audit market
competition using audit firm mergers (e.g. Sullivan 2002; Ivancevich and Zardkoohi 2000;
McMeeking et al. 2007; Gong et al. 2016; Choi et al. 2017; Chen et al. 2018). However, audit
firm mergers could be endogenous. In addition, the relation between audit firm mergers and
competition is ambiguous because mergers per se could reduce competition resulting from
fewer competitors but the synergies created from audit firm mergers could lead to greater audit
market competition (Gong et al. 2016; Kitto 2019; Sullivan 2002). To deal with the endogeneity
8 For the relation between audit market competition and audit fees, some studies find a negative relation (e.g. Ettredge and Greenberg 1990; Bandyopadhyay and Kao 2004; Kallapur et al. 2010; Dunn et al. 2013; Keune et al. 2015; Ettredge et al. 2018; Huang et al. 2016). However, Pearson and Trompeter (1994) find a positive relation. For the relation between audit market competition and audit quality, some studies find a negative relation (e.g. Kallapur et al 2010; Newton et al. 2013; Dunn et al. 2013; Newton et al. 2016) but other studies find a positive relation (e.g. Boone et al. 2012; Cziffra et al. 2019).

7
of audit market competition, a few studies have used relatively exogenous shocks such as the
collapse of Arthur Anderson (Geng et al. 2018) and regulation changes (e.g., Jensen and Payne
2005; Cheng et al. 2019). All of these studies focus on competition among audit firms operating
within one single jurisdiction. We contribute to this literature by showing how a regulatory
change that increases the competition from potentially lower quality auditors from another
jurisdiction affects the incumbent auditors’ audit quality.
The findings from our study are also relevant to policy makers in both Hong Kong and
mainland China. While the 2010 regulation covers more issues than considered in this study,
audit quality has attracted the most attention of the media. Even though some commentators
highlight the potential benefits (e.g., attracting more mainland firms to list in Hong Kong,
reduced compliance costs and increased market efficiency) of the regulation (Dongfang Daily
2010; Li 2010), many commentators express a concern on the potential negative effect of the
regulation on audit market competition and H share firms’ audit quality (Wenhui Daily 2010;
Yam 2009). Our study provides direct evidence on this important question. Our results suggest
that the regulatory approach adopted by Hong Kong regulators prior to 2010 (i.e., approach one)
seems more effective than the existing U.S. approach (i.e., approach two) in improving the
audit quality of cross-listed firms while avoiding the difficulty that the PCAOB has encountered
in inspecting foreign auditors from foreign jurisdictions (Carcello et al. 2014; He et al. 2017).
However, we also wish to note that our study does not speak to the overall optimality of the
two approaches because we could not quantify all costs and benefits of the two approaches.
The rest of the paper is organized as follows. Section 2 analyzes the H share firms’ auditor
switching decision after the regulation. Section 3 examines the impact of the regulation on audit
fees and audit quality for all H share firms as a whole. Section 4 considers the impact of the
regulation for the switchers and non-switchers. Section 5 concludes.

8
2. H share firms’ auditor choice after the regulation
Before analyzing the impact of the regulation on audit fees and audit quality, we first
examine H share firms’ auditor switching decisions. Section 2.1 examines how the regulation
affects the Hong Kong auditors’ market share of the H share firms after the regulation. Section
2.2 investigates the role of three important factors, audit fee saving, managerial agency conflict,
and external financing need, in explaining H share firms’ auditor choice after the regulation.
2.1.Market share of Hong Kong auditors after the regulation
Prior to adoption of the 2010 regulation, the Hong Kong auditors owned 100% of the H
share audit market. Hence, it is almost guaranteed that the Hong Kong auditors’ market share
of H share firms will decline after the regulation. However, less certain is the magnitude of the
decline.
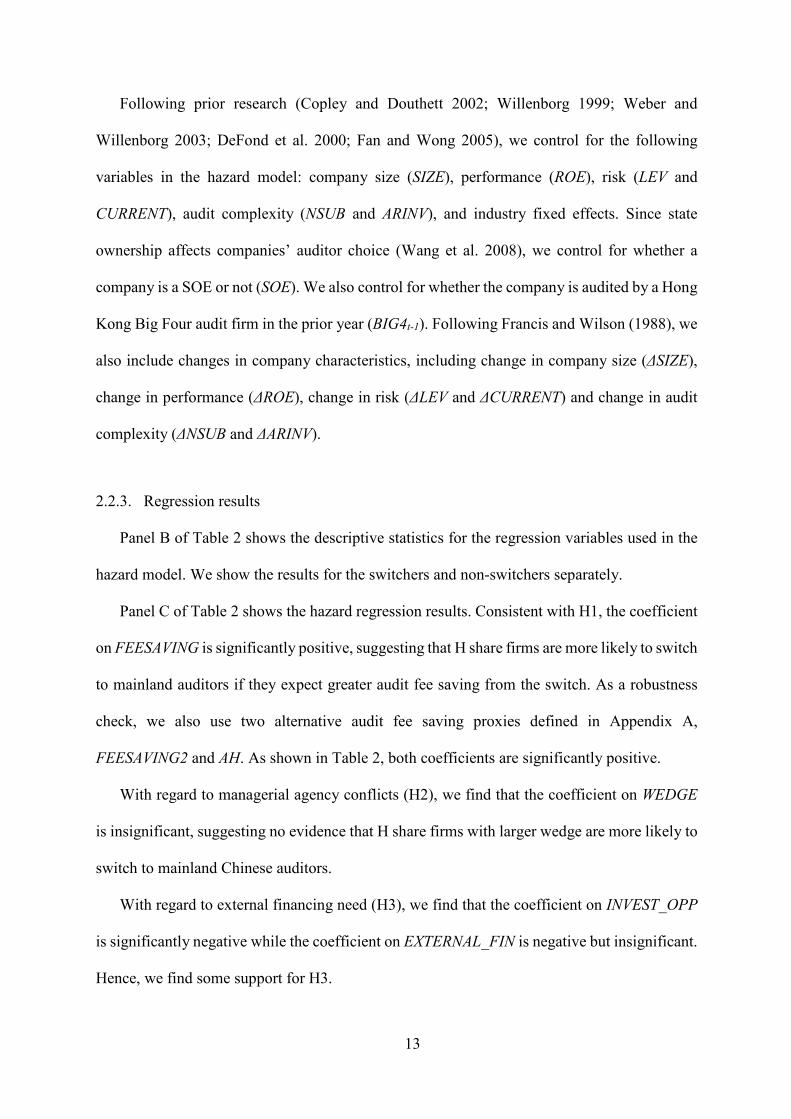
Figure 1 plots the distribution of the timing of the H share firms’ switching to mainland
auditors. As expected, there is a spike of switches right after the regulation. Nevertheless, there
is still a significant number of switches after 2011.
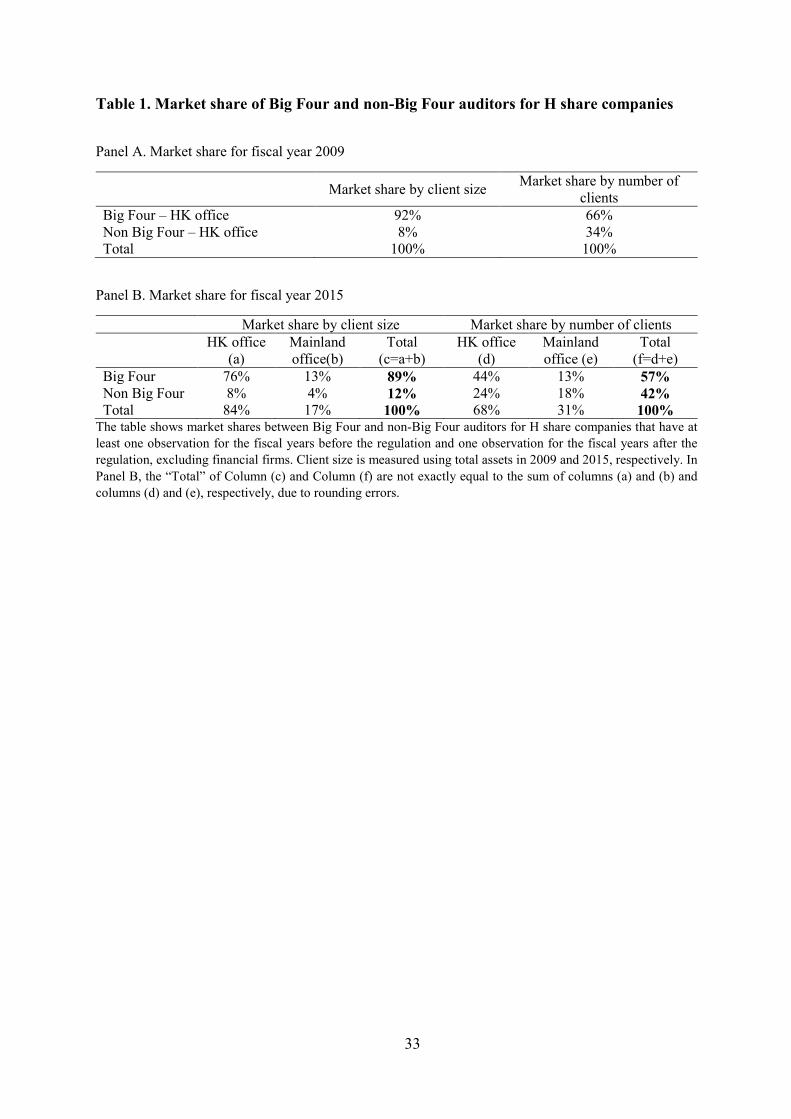
Table 1 shows the market share of the Hong Kong auditors before versus after the regulation.
We use the year immediately before the regulation to measure Hong Kong auditors’ market
share of the H share firms in the pre-period. Since H share firms’ auditor switching decisions
could take time, we measure Hong Kong auditors’ market share in the post-period as of the end
of 2015, more than five years after the regulation’s passage. We also decompose the Hong
Kong auditors into two groups: The Big Four and the non-Big Four. We measure the market
share using two different methods: the number of audit clients (equal weighting) and the total
assets of the audit clients (value weighting).
Looking at the Hong Kong auditors as a whole, we find that the Hong Kong auditors’
market share of the H share firms dropped from 100% to 68% based on the number of audit

9
clients and from 100% to 84% based on the total assets of audit clients. These numbers suggest
that the Hong Kong auditors still retained the majority of the H share audit clients after the
regulation. In addition, the difference in the equally weighted and value weighed percentages
suggests that the lost audit clients are smaller H share firms.
Table 1 shows that 66% (92%) of the H share companies are audited by the Hong Kong Big
Four in the pre-period based on the number of audit clients (based on the total assets of audit
clients), suggesting that the Hong Kong Big Four dominated the H share audit market in the
pre-period, especially for the larger H share firms. The Hong Kong Big Four’s market share of
the H share firms dropped to 44% (76%) in the post-period based on the number of audit clients
(based on the total assets of audit clients). In terms of number of clients, the Hong Kong Big
Four no longer dominated the H share audit market in the post-period, but in terms of the total
assets of audit clients, the Hong Kong Big Four still held the majority of the H share audit
market in the post-period.
The Hong Kong non-Big Four’s market share of the H share firms dropped from 34% (8%)
to 24% (8%) after the regulation based on the number of audit clients (based on the total assets
of audit clients). While the Hong Kong non-Big Four lost some audit clients, its market share
based on the total assets of H share firms remained the same. Hence, the descriptive statistics
in Table 1 suggest that the regulation exerts a larger impact on the Hong Kong Big Four than
on the Hong Kong non-Big Four.
2.2. Determinants of H share firms’ auditor choice after the regulation
2.2.1. Hypotheses
After the adoption of the 2010 regulation, each H share company has two choices: keep the
existing Hong Kong audit firm or switch to a mainland Chinese audit firm. Each choice entails
a tradeoff of costs and benefits. One potential advantage for an H share firm to switch to a

10
mainland audit firm is to pay lower audit fees because mainland Chinese audit firms tend to
have a cost advantage. In addition, mainland Chinese auditors may also have a local
information advantage and therefore they could conduct their audits more efficiently (Wang et
al. 2008). Therefore, holding everything else constant, we expect the H share firms to be more
likely to switch to mainland auditors if they could reduce audit fees from the switch. This
discussion leads to the following hypothesis stated in its alternative form:
H1: Expected audit fee saving is positively associated with H share companies’ switch to
mainland Chinese auditors.
Due to mainland China’s weaker institutional environment, mainland Chinese auditors may
be less independent than Hong Kong auditors (Ke et al. 2015). Hence, H share companies that
suffer from greater managerial agency problems could have a stronger incentive to switch to a
mainland audit firm so that these companies’ insiders could enjoy greater flexibility in earnings
management. However, auditor switching is publicly observable. Hence, an H share firm with
the suspicion of severe managerial agency problems may refrain from switching to a mainland
audit firm because the switch could fully reveal the firm type, resulting in the capital market’s
discount of the firm’s earnings (Fan and Wong 2005). For this reason, H share firms with
greater agency problems do not necessarily have stronger incentives to switch to mainland
Chinese auditors. Because of the ambiguity of this prediction, we state the following hypothesis
in the null form:
H2: Managerial agency conflicts are not associated with H share companies’ switch to
mainland Chinese auditors.
While all H share companies may hesitate to switch to mainland Chinese auditors for the
fear of the capital market’s negative reaction to the switch, the H share companies that are

11
expected to raise future equity capital should be more likely to refrain from the switch (Fan and
Wong 2005). This argument leads to the following hypothesis stated in the alternative form:
H3: H share companies that are expected to raise equity capital are less likely to switch to
mainland Chinese auditors.
An implicit assumption for H2 and H3 is that mainland Chinese audit firms have lower
incentives to maintain high quality audit standards than Hong Kong domiciled audit firms.
Recognizing such potential differences between the two financial markets, the regulators on
both sides had adopted various policies to mitigate such risks. For example, only the 12 largest
and strongest mainland Chinese audit firms were allowed to audit H share firms, reducing the
risk of excessive competition from low quality mainland audit firms. China’s Ministry of
Finance (MOF) also implemented the following key policies to help strengthen the audit quality
of the 12 selected audit firms (MOF 2011). First, MOF required the audit firms to be
transformed from LLC to LLP. Second, the MOF required the audit firms to strengthen their
internal controls and audit quality controls. Third, the MOF required the audit firms to develop
internationalized human capital. Fourth, the MOF adopted a continuous monitoring mechanism
so that any audit firm that fails to maintain high quality audit standards would lose the license
to audit H share firms. Because of these enhanced regulatory policies, it is possible that there
are no longer significant differences in audit quality between the Hong Kong domiciled audit
firms and the 12 selected mainland Chinese audit firms.
2.2.2. Research design
We use a Cox proportional hazard regression to study H share firms’ audit firm choice
following the regulation. As the regulation took effect for the H share firms whose fiscal periods
ended on or after December 15, 2010, the hazard analysis sample starts from the beginning of
the fiscal year 2010 and ends in the year of switching to a mainland audit firm or 2015 (the end
12
of our sample), whichever is earlier. See Panel A of Table 2 for the detailed sample selection
procedures.
Our key variables of interest are expected audit fee saving (FEESAVING), the managerial
agency conflict proxy (WEDGE), and two proxies for future equity financing need
(INVEST_OPP and EXTERNAL_FIN) per Durnev and Kim (2005) and Demirguc-Kunt and
Maksimovic (1998). FEESAVING is the difference between the expected audit fees if
employing a Hong Kong audit firm and the expected audit fees if switching to a mainland
Chinese audit firm. Please refer to appendix A for the detailed construction of FEESAVING.
Higher values of FEESAVING represent greater expected audit fee saving from switching to a
mainland audit firm and therefore the coefficient on FEESAVING is predicted to be positive
under H1. WEDGE measures the difference between the controlling owner’s voting rights and
cash flow rights. Following Gong et al. (2013), WEDGE is a dummy variable that equals one
if the controlling owner’s voting rights are larger than cash flows rights and the voting rights
of the controlling shareholder is greater than 10%. Inferences are similar if we use a cutoff of
20%. Following Durnev and Kim (2005) and Demirguc-Kunt and Maksimovic (1998), we
define a company’s investment opportunity set (INVEST_OPP) as the 2-year geometric average
of the annual percentage growth in net sales and a firm’s demand for external equity financing
using EXTERNAL_FIN, which is the difference between the firm’s actual growth rate and the
sustainable growth rate with retained earnings and short-term and long-term debt financing that
maintains a constant debt-to-assets ratio. We estimate a company’s actual growth rate as a 2-
year geometric average of the annual growth rate in total assets, and the sustainable growth rate
as a 2-year average of ROE/(1-ROE), whether ROE is the return on equity. H3 predicts that H
share firms with higher values of INVEST_OPP and EXTERNAL_FIN to be less likely to switch
to mainland Chinese auditors.
13
Following prior research (Copley and Douthett 2002; Willenborg 1999; Weber and
Willenborg 2003; DeFond et al. 2000; Fan and Wong 2005), we control for the following
variables in the hazard model: company size (SIZE), performance (ROE), risk (LEV and
CURRENT), audit complexity (NSUB and ARINV), and industry fixed effects. Since state
ownership affects companies’ auditor choice (Wang et al. 2008), we control for whether a
company is a SOE or not (SOE). We also control for whether the company is audited by a Hong
Kong Big Four audit firm in the prior year (BIG4t-1). Following Francis and Wilson (1988), we
also include changes in company characteristics, including change in company size (ΔSIZE),
change in performance (ΔROE), change in risk (ΔLEV and ΔCURRENT) and change in audit
complexity (ΔNSUB and ΔARINV).
2.2.3. Regression results
Panel B of Table 2 shows the descriptive statistics for the regression variables used in the
hazard model. We show the results for the switchers and non-switchers separately.
Panel C of Table 2 shows the hazard regression results. Consistent with H1, the coefficient
on FEESAVING is significantly positive, suggesting that H share firms are more likely to switch
to mainland auditors if they expect greater audit fee saving from the switch. As a robustness
check, we also use two alternative audit fee saving proxies defined in Appendix A,
FEESAVING2 and AH. As shown in Table 2, both coefficients are significantly positive.
With regard to managerial agency conflicts (H2), we find that the coefficient on WEDGE
is insignificant, suggesting no evidence that H share firms with larger wedge are more likely to
switch to mainland Chinese auditors.
With regard to external financing need (H3), we find that the coefficient on INVEST_OPP
is significantly negative while the coefficient on EXTERNAL_FIN is negative but insignificant.
Hence, we find some support for H3.
14
3. The impact of the regulation for all H share firms
We now examine the impact of the regulation on audit fees and audit quality. As the
regulation applied to all H share companies, we first analyze the impact of the regulation for
all H share firms as a whole in this section. Section 4 examines the impact of the regulation for
the switchers and non-switchers separately in order to identify the sources of the observed
changes in section 3.
3.1. Hypotheses
The incumbent Hong Kong auditors could respond to the shock of the regulation in two
ways: adjust the audit fees or the audit quality. Facing the competition from the mainland audit
firms, the incumbent Hong Kong audit firms could reduce either audit fees or audit quality or
both. Ex ante it is difficult to predict the incumbent Hong Kong audit firms’ preferred response.
We first analyze the impact of the regulation on audit fees. As shown in section 2, the
regulation creates two types of H share firms in the post-period: the H share firms who switch
to mainland auditors (switchers) and the H share firms who choose to retain the Hong Kong
auditors (non-switchers). Table 2 shows that the H share firms that expect more audit fee saving
from the switch are more likely to switch. Hence, we expect the audit fees of the switchers to
decline after the regulation. On the other hand, the impact of the regulation on the audit fees of
the non-switchers is ambiguous. One possibility is that the non-switchers do not experience any
change in audit fees after the regulation because they continue to employ the same Hong Kong
auditors, ceteris paribus. Another possibility is that introducing the 12 mainland Chinese
auditors creates a competitive pressure on the incumbent Hong Kong auditors and therefore the
latter could be forced to lower the audit fees in order to retain the H share clients. Because the
majority of the H share firms do not switch to mainland auditors (see Table 1), it is difficult to
15
predict the impact of the regulation on the audit fees of the H share firms as a whole. Hence,
we state the following hypothesis in the null form:
H4: there is no change in the H share firms’ audit fees after the passage of the regulation.
Next, we examine the impact of the regulation on the H share firms’ audit quality. Again,
we analyze the impact of the regulation for the switchers and non-switchers separately. For the
switchers, there are two possible outcomes. One possibility is that the switchers suffer from
more severe agency problems and therefore they switch to mainland Chinese audit firms who
are willing to compromise audit quality. Another possibility is that due to the potential negative
signaling effect of auditor changes, the switchers are not necessarily firms who demand lower
quality audit. Therefore, the switchers’ audit quality may not decline after the regulation.
For the non-switchers, there are three possibilities with regard to the impact of the
regulation on audit quality. First, the non-switchers’ audit quality does not change after the
regulation because they employ the same Hong Kong auditors. Second, the competition from
the 12 mainland Chinese auditors pressure the incumbent Hong Kong auditors to cave in to the
demand for lower audit quality by H share firms’ management (Shleifer 2004). Third, H share
firms’ management demand high quality audit and therefore the entry of the mainland Chinese
auditors has little impact on the incumbent Hong Kong auditors because the mainland auditors
are still viewed as lower quality auditors by Hong Kong investors.
Because of these conflicting possibilities, we state the following hypothesis in the null form:
H5: there is no change in the H share firms’ audit quality after the passage of the regulation.
3.2. Research design
We use the following difference-in-differences research design to test H4:
AFit =α+β1POST1t×HSHAREi+β2Controlsit+µi+µt+εit (1)

16
To control for potential confounding effects, we use Red Chip firms as a control sample. Both
H share firms and Red Chip firms are mainland Chinese investors-controlled firms and have
their major business operations in mainland China. Therefore, both types of firms are subject
to similar political, economic and legal environments. However, Red Chip firms are not subject
to the 2010 regulation and therefore can serve as good control firms. HSHAREi equals one for
H share firms and zero for Red Chip firms. AFit is the natural log of the inflation-adjusted audit
fees of firm i for financial reporting of year t. POST1t equals one if the fiscal year end is on or
after December 31, 2010, and zero otherwise.
Following Ke et al. (2015) and Ireland and Lennox (2002), we include several control
variables, including company size (SIZE), financial health (LEV, LOSS, ROE), audit complexity
(NSUB, CURRENT and ARINV), indicator of whether the auditor is a Big Four audit firm
(BIG4), an indicator for AH company (AH), and an indicator for SOEs (SOE). Year and firm
fixed effects (µt and µi respectively) are included.
It is important to note that the definition of year in the difference-in-differences model is
different from calendar year or fiscal year. The reason is that the fiscal year end for all H share
firms are December 31, but the fiscal year ends of the Red Chip companies are not always
December 31. Because the 2010 regulation took effect for the accounting periods ending on or
after December 15, 2010, using either calendar year or fiscal year would misclassify a small
number of firm years into the wrong pre- or post- period. To illustrate, let’s assume that firm
A’s fiscal year end is November 30, 2010 and firm B’s fiscal year end is December 31, 2010.
Hence, both firms belong to the same fiscal year 2010 or calendar year 2010, even though firm
A belongs to the pre-period while firm B belongs to the post-period. To deal with this issue, we
redefine year as follows: we set year T=0 for the first fiscal year after the regulation. Then we
define all the other fiscal years of the same firm accordingly relative to year T. For the above

17
two examples, year T=0 is the fiscal year ending on November 30, 2011 for firm A and the
fiscal year ending on December 31, 2010 for firm B.
To test H5, we use the same difference-in-differences research design for H4 except that
the dependent variable is audit quality. Following DeFond et al. (2000) and Ke et al. (2015),
audit quality is measured using OPINIONit, which equals one if the audit opinion for the Hong
Kong reporting is non-clean, and zero otherwise. Following Ke et al. (2015), we control for the
following variables: accounting performance (LOSS), profitability (ROE), liquidity
(CURRETN, CASH and ARINV), company size (SIZE), leverage (LEV), state ownership (SOE),
annual market-adjusted abnormal returns (RETURN). We also control for whether the company
is audited by a Big Four audit firm (BIG4) as Big Four audit firms could be more likely to issue
non-clean opinions. We also control for log of the number of years a company has been listed
on the Hong Kong Stock Exchange (AGE) as Chinese firms are more susceptible to financial
distress after they have exhausted the capital raised in initial public offerings, and younger firms
are less likely to receive modified audit opinions (Chan and Wu 2011; DeFond et al. 2000).
Year and firm fixed effects (µt and µi respectively) are included.
3.3. Regression results
Table 3 shows the sample selection procedures for our H4 and H5 tests. The sample for the
difference-in-differences research design starts from 2006, one year after Hong Kong adopted
IFRS. The sample ends in 2015, the end of our sample collection period. To create a relatively
balanced sample, we require each firm to have observations for at least one year before and
after the regulation. The final sample for the AF regression contains 138 unique H share firms
and 352 unique Red Chip firms while the final sample for the OPINION regression contains
144 unique H share firms and 354 unique Red Chip firms.
18
Table 4 shows the regression results for H4. Panel A reports the summary statistics for the
regression variables for the pre- and post- periods for the H share firms and Red Chip firms
separately. The H share firms’ mean AF is 14.954 in the pre-period and 15.121 in the post-
period, while the Red Chip firms’ mean AF is 14.398 in the pre-period and 14.663 in the post-
period. Hence, the univariate statistics do not show significant change of H share firms’ audit
fees after the regulation. Panel B shows the OLS regression results. Most of the control
variables’ coefficients are significant and as predicted. The coefficient on POST1×HSHARE is
significantly negative (two-tailed p=0.056). This result suggests that after controlling for the
other determinants of audit fees, the H share firms paid lower audit fees after the regulation.
Table 5 shows the regression results for H5. As shown in Panel A, The H share firms’ mean
OPINION is 10.5% in the pre-period and 5.7% in the post-period, while the Red Chip firms’
mean OPINION is 12.3% in the pre-period and 13.3% in the post-period. Hence, the univariate
statistics show visible decline of H share firms’ modified audit opinions after the regulation.
Panel B shows the regression results. Because the dependent variable is a dummy variable,
we report both the OLS regression results and the conditional logit regression results because
linear regression model’s coefficients are easier to interpret. Many of the control variables’
coefficients are significant and as predicted. The coefficient on POST1×HSHARE is
significantly negative for both the OLS regression and the conditional logit regression at the
two-tailed 5% significance level. This result suggests that after controlling for the other
determinants of audit opinions, the H share firms are less likely to receive modified audit
opinions after the regulation, suggesting that the H share firms’ auditors become less
independent after the regulation.
3.4. Robustness checks

19
We perform several robustness checks to rule out potential alternative explanations for the
results in Tables 4 and 5. First, we check the parallel trends assumption for the difference-in-
differences regression models. Specifically, we create a pseudo-event dummy variable
PSEUDO_POST1 that equals one for the two years immediately before the regulation and zero
for the all the other years in the pre-period (i.e., the observations with POST1=0). Then, we
estimate a difference-in-differences model similar to model (1) for PSEUDO_POST1 using the
pre-period sample. Table 6 reports the regression results. For brevity, we have omitted the
coefficients on the control variables in Table 6. The coefficient on
PSEUDO_POST1×HSHARE is insignificant for both AF and OPIONION, suggesting no
violation of the parallel trends assumption.
Second, we rule out one alternative explanation for the audit opinion results in Table 5.
Specifically, one could argue that the audit opinions issued by the Hong Kong domiciled audit
firms are excessively conservative due to lack of understanding of H share firms. In contrast,
one could argue that mainland Chinese auditors have a much better understanding of H share
firms and therefore the H share firms’ reduced frequency of modified audit opinions after the
regulation could reflect mainland auditors’ better understanding of the switched H share firms
rather than lower audit quality. To rule out this explanation, we break HSHARE into two
subgroups: H share firms that also had listed A shares prior to the regulation (PRE_AH) and H
share firms that had no listed A shares prior to the adoption of the 2010 regulation (PRE_H).
Then, we rerun the difference-in-differences audit opinion regression model using PRE_AH
and PRE_H instead of HSHARE. If our audit opinion results in Table 5 are due to mainland
auditors’ local information advantage, we should expect the coefficient on POST1×PRE_AH
to be less negative than the coefficient on POST1×PRE_H. This is because the PRE_AH firms
had already had mainland auditors’ local information advantage in the pre-period and therefore
these firms should not be affected by this alternative explanation. Specifically, prior to the

20
adoption of the 2010 regulation, most of the AH firms hired a Big Four for the audit of both
sets of financial reports, with the Hong Kong office of the Big Four responsible for the H share
report and the mainland office of the same Big Four responsible for the A share report. As
explained by Ke et al. (2015, footnote 7), the two sides generally form a joint audit team and
the Hong Kong office typically sends senior members of its staff to oversee the joint fieldwork
conducted in mainland China by the mainland Chinese auditors. Following the adoption of the
2010 regulation, some AH firms could choose to keep only the mainland office of the Big Four
as their auditors. As the audit fieldwork is performed by the same mainland auditors for the
pre- and post-regulation periods, the information advantage of the AH firm auditors over the
two periods should not change.
Table 7 shows the regression results for this alternative explanation. Inconsistent with this
alternative explanation, we find no evidence that the coefficient on POST1×PRE_AH is less
negative than the coefficient on POST1×PRE_H.
Third, we examine whether the behaviour of Red Chip firms’ Hong Kong auditors is
indirectly affected by the 2010 regulation and as a result our inferences in Tables 4 and 5 could
be affected. Specifically, one could argue that Hong Kong domiciled auditors’ loss of H share
firms could increase the Hong Kong auditors’ market competition for Red Chip firms who
share many similarities with H share firms and serve as good substitutes for the lost H share
firm clients. To test this hypothesis, we use the Hong Kong listed firms included in the Hang
Seng Composite Stock Index (excluding the H share firms, Red Chip firms and financial firms)
as control firms (referred to as Hong Kong firms). Then, we repeat the same regression models
in Tables 4 and 5 for the Red Chip firms versus Hong Kong firms. We find no evidence that
the coefficient on POST1×REDCHIP (where REDCHIP is one for Red Chip firms and zero for
Hong Kong firms) is significantly different from zero for both models (untabulated). Hence,

21
we find little evidence that the 2010 regulation has a spillover effect on the audit market
competition for the Red Chip firms.
4. The impact of the regulation for the switchers and non-switchers
We next examine whether the documented effects of the regulation on audit fees and audit
opinions in Tables 4 and 5 are attributed to the switchers or non-switchers or both. For the non-
switchers, we can continue to use POST1 to define the pre- and post- periods. But the
definitions of pre- and post- periods are more complicated for the switchers because the
switching event may not occur in the same time immediately after the regulation for all the
switchers. To illustrate, let’s assume a switcher made the switching decision in year T=+3,
where T=0 is defined as in section 3.2. Therefore, we decompose POST1 into two components
for the switchers: POST2 for the years T=0 to T=+2 and POST3 for the years on and after T=+3.
The sum of POST2 and POST3 is equal to POST1. This way we can separately assess the impact
of the regulation for the switchers in the POST2=1 and POST3=1 periods separately.
Table 8 shows the regression results of AF for the switchers and non-switchers. For both
regression models in Table 8, the control firms are always the Red Chip firms. We find that the
coefficient on POST1×NON_SWITCHER is insignificant. On the other hand, the coefficient on
POST3×SWITCHER is significantly negative while the coefficient on POST2×SWITCHER is
insignificant. These results suggest that the negative impact of the regulation on H share firms’
audit fees in Table 4 is solely attributed to the switchers in the post-switch years.
Table 9 shows the regression results of OPINION for the switchers and non-switchers. For
both regression models in Table 9, the control firms are always the Red Chip firms. We find
that the coefficient on POST1×NON_SWITCHER is significantly negative. On the other hand,
the coefficients on POST2×SWITCHER and POST3×SWITCHER are both significantly
negative. These results suggest that the negative impact of the regulation on H share firms’
22
audit opinions in Table 5 is attributed to both the switchers and non-switchers. The negative
coefficient on POST1×NON_SWITCHER is particularly interesting because these firms did not
switch to mainland Chinese auditors and yet their H share clients’ audit quality declined after
the regulation, consistent with the hypothesis that the entry of the mainland Chinese auditors
to the Hong Kong H share audit market creates a competitive pressure on the incumbent Hong
Kong auditors, leading to a race to the bottom in audit quality.
The contrasting results in Tables 8 and 9 for the non-switchers also indicate that the
competitive pressure on the incumbent Hong Kong audit firms resulting from the entry of the
12 mainland Chinese audit firms is run through audit quality rather than audit fees. These
findings may not be surprising because audit fees are highly visible to capital market investors
while audit quality is a credence good whose quality cannot be discerned easily in the short run
(Causholli and Knechel 2012). Therefore, by lowering audit quality, the incumbent Hong Kong
audit firms can cave in to the competitive pressure while avoiding the public’s scrutiny.
5. Conclusion
The objective of the study is to compare the costs and benefits of two contrasting
approaches to regulating the audit market of cross-listed firms. Approach one allows only the
auditors domiciled in the host country to audit the books of cross-listed firms while approach
two allows either the host country auditors or any eligible third-country auditors (typically
home country auditors) approved by the host country regulators to audit the books of cross-
listed firms. We test our research question by taking advantage of an exogenous Hong Kong
regulation change in 2010 that allows mainland Chinese auditors to audit the books of H share
companies (mainland Chinese investors-controlled firms that are incorporated in mainland
China but listed in Hong Kong). Prior to the regulation change, only Hong Kong domiciled
auditors were allowed to audit the books of the H share companies. We address two specific
23
questions. First, we examine how the Hong Kong auditors’ market share of the H share
companies changes after the regulation change. Second, we examine the impact of the
regulation change on the H share companies’ audit fees and audit quality.
With regard to the first question, we find that the majority of the H share companies
continues to employ Hong Kong auditors after the regulation change. As of the end of 2015,
the end of our sample, 43 out of the 144 H share companies switched to mainland Chinese
auditors. We find that the H share companies that expected greater audit fee saving and lower
external financing need are more likely to make the switch. However, we find no evidence that
the H share companies with greater managerial agency problems are more likely to switch to
mainland auditors.
With regard to our second question, we find that the H share companies as a whole
experience a significant decline in both audit fees and audit quality (proxied by the frequency
of modified audit opinions) after the regulation change. In addition, we find that the H share
companies’ audit fee decline is driven by the switchers. On the other hand, the H share
companies’ audit quality decline is attributed to both the switchers and non-switchers.
Overall, our results illustrate the costs and benefits of the two contrasting regulatory
approaches to regulating the audit of cross-listed firms in financial markets with strong investor
protection. While approach one may require the H share companies to pay more in audit fees,
this approach also delivers higher quality audit due to the host country’s stronger institutional
environment quality. In addition, our results suggest that allowing home country auditors to
compete with host country auditors for the audit of cross-listed firms may also create an
unintended consequence: even though many cross-listed firms continue to employ host country
auditors, these firms’ audit quality also suffers due to the competition from the home country
auditors, resulting in a race to the bottom. Our results provide useful information to the ongoing
debate on the regulation of cross-listed firms’ auditors.

24
REFERENCE
Bandyopadhyay, S. P., & Kao, J. L. (2004). Market Structure and Audit Fees: A Local Analysis. Contemporary Accounting Research, 21(3), 529-562.
Boone, J. P., Khurana, I. K., & Raman, K.K. (2012). Audit Market Concentration and Auditor Tolerance for Earnings Management. Contemporary Accounting Research, 29(4), 1171-1203.
Carcello, J. V., Carver, B. T., Lennox, C. S., & Neal, T. L. (2014). When bonding fails: Audit firm oversight of US-listed Chinese companies. Working paper.
Causholli, M. & Knechel W. R. (2012). An Examination of the Credence Attributes of an Audit. Accounting Horizons 26 (4), 631-656.
Chan, K. H., & Wu, D. (2011). Aggregate quasi rents and auditor independence: Evidence from audit firm mergers in China. Contemporary Accounting Research, 28(1), 175-213. Chan, M. (2008, January 18). Making the right connection Hong Kong helps break information barrier for mainland companies that want access to global capital markets. South China Morning Post.
Chen, C. J., Chen, S., & Su, X. (2001). Profitability regulation, earnings management, and modified audit opinions: Evidence from China. Auditing: A Journal of Practice & Theory, 20(2), 9-30.
Chen, Kun-Chih, Qiang Cheng, Ying Chou Lin, Yu-Chen Lin, and Xing Xiao. (2016). Financial Reporting Quality of Chinese Reverse Merger Firms: The Reverse Merger Effect or the Weak Country Effect?. The Accounting Review: 91(5), 1363-1390.
Chen, T.Y., Dong, X., & Yu, Y. (2018). Audit Market Competition and Audit Quality: Evidence from the Entry of Big 4 into City-Level Audit Markets in the U.S. Working paper.
Cheng, S. F., Hope, O. K., & Hu, D. (2019). Strategic Entry Deterrence in the Audit Industry: Evidence from the Merger of Professional Accounting Bodies. Working paper.
Choi, J.H., Kim, S., & Raman, K. K. (2017). Did the 1998 Merger of Price Waterhouse and Coopers & Lybrand Increase Audit Quality?. Contemporary Accounting Research, 34(2), 1071-1102.
Chu,Y. (2008, July 1). Smooth transition to Chinese Accounting Standards for Business Enterprises. Shanghai Securities News. (In Chinese).
Copley, P. A., & Douthett Jr, E. B. (2002). The association between auditor choice, ownership retained, and earnings disclosure by firms making initial public offerings. Contemporary accounting research, 19(1), 49-76. Cziffra, J., Fortin, S., & Singer, Z. (2018). The Effects of Audit Market Concentration and Auditor Reputation on Audit Quality: Evidence from Government Auditors. Working paper.
DeFond, M. L., Wong, T. J. & Li S. (2000). The impact of improved auditor independence on audit market concentration in China. Journal of Accounting and Economics, 28: 269–305. Dulleck, U., & Kerschbamer R. (2006). On doctors, mechanics, and computer specialists: The economics of credence goods. Journal of Economic Literature 44 (1): 5–42.
25
Demirguc-Kunt, A., & Maksimovic. V. (1998). Law, Finance and Firm Growth. Journal of Finance, 53: 2107-2137. Dongfang Daily. (2010). H share firms allowed to hire mainland audit firms. December 11.
Dunn, K. A., Kohlbeck, M. J., & Mayhew, B. W. (2013). The Impact of Market Structure on Audit Price and Quality. Working paper.
Durnev, A., & Kim. E. H. (2005). To Steal or Not to Steal: Firm Attributes, Legal Environment, and Valuation. Journal of Finance, 60: 1461-1493. Ettredge, M., & Greenberg, R. (1990). Determinants of Fee Cutting on Initial Audit Engagements. Journal of Accounting Research, 28(1), 198-210. Ettredge, M., Sherwood, M., & Sun, L. (2018). Office-client balance and metro area audit market competition. Working paper.
Fan, J. P., & Wong, T. J. (2005). Do external auditors perform a corporate governance role in emerging markets? Evidence from East Asia. Journal of accounting research, 43(1), 35-72. Francis, J. R., & Wilson, E. R. (1988). Auditor changes: A joint test of theories relating to agency costs and auditor differentiation. The Accounting Review, 63 (4), 663-682. Geng, H., Zhang, C., & Zhou, F. (2018). The Economic Consequences of Audit Market Competition: Evidence from Cost of Bank Financing. Working paper.
Gong, G., Ke, B., & Yu, Y. (2013). Home country investor protection, ownership structure and cross‐listed firms' compliance with SOX‐Mandated internal control deficiency disclosures. Contemporary Accounting Research, 30(4), 1490-1523. Gong, Q., Li, O. Z., Lin, Y., & Wu, L. (2016). On the benefits of audit market consolidation: Evidence from merged audit firms. The Accounting Review, 91(2), 463-488.
He, Y., Li, B., Liu, Z., & Pittman, J. (2017). Does the Threat of a PCAOB Inspection Mitigate US Institutional Investors’ Home Bias?. Working paper. HKEx. (2009). Consultation paper on acceptance of mainland accounting and auditing standards and mainland audit firms for mainland incorporated companies listed in Hong Kong. Available at: https://www.hkex.com.hk/eng/newsconsul/mktconsul/documents/cp200908_e.pdf Huang, T. C., Chang, H., & Chiou, J. R. (2016). Audit market concentration, audit fees, and audit quality: Evidence from China. Auditing: A Journal of Practice & Theory, 35(2), 121-145.
IFRS Foundation. (2018). IFRS Application around the World Jurisdictional Profile: Hong Kong. Available at: https://www.ifrs.org/-/media/feature/around-the-world/jurisdiction-profiles/hong-kong-sar-ifrs-profile.pdf
Ireland, J. C., & Lennox, C. S. (2002). The large audit firm fee premium: A case of selectivity bias?. Journal of Accounting, Auditing & Finance, 17(1), 73-91.
Ivancevich, S. H., & Zardkoohi, A. (2000). An exploratory analysis of the 1989 accounting firm megamergers. Accounting Horizons, 14(4), 389-401.

26
Jensen, K. L., & Payne, J. L. (2005). The Introduction of Price Competition in a Municipal Audit Market. Auditing: A Journal of Practice & Theory, 24(2), 137–152.
Kallapur, S., Sankaraguruswamy, S., & Zang, Y. (2010). Audit Market Concentration and Audit Quality. Working paper. Ke, B., Lennox, C.S., & Xin, Q. (2015). The effect of China’s weak institutional environment on the quality of Big 4 audits. The Accounting Review, 90(4), 1591-1619.
Keune, M. B., Mayhew, B. W., & Schmidt, J. J. (2015). Non-Big 4 Local Market Leadership and its Effect on Competition. The Accounting Review, 91(3), 907–931.
Kitto, A. (2019). The Effects of Non-Big 4 Mergers on Audit Production Efficiency and Audit Market Competition. Working paper.
Lee, P. (2009). Re: acceptance of mainland accounting and auditing standards and mainland audit firms for mainland incorporated companies listed in Hong Kong. Available at: http://www.hkex.com.hk/eng/newsconsul/mktconsul/responses/Documents/cp200908r_IN02.pdf
Lennox, C. (2000). Do companies successfully engage in opinion-shopping? Evidence from the UK. Journal of accounting and economics, 29(3), 321-337.
Li, J. (2010). Mainland accounting standards get green light from local Bourse. China Daily, December 11.
MOF (Ministry of Finance). (2011). Q&A regarding the permission for select mainland Chinese audit firms to audit H share firms. Available at: http://www.csrc.gov.cn/pub/newsite/zjhxwfb/xwdd/201101/t20110113_190504.html. (In Chinese).
McMeeking, K. P., Peasnell, K. V., & Pope, P. F. (2007). The effect of large audit firm mergers on audit pricing in the UK. Accounting and Business Research, 37(4), 301-319.
Newton, N. J., Wang, D., & Wilkins, M. S. (2013). Does a Lack of Choice Lead to Lower Quality? Evidence from Auditor Competition and Client Restatements. Auditing: A Journal of Practice & Theory, 32(3), 31–67.
Newton N.J., Persellin, J.S., Dechun W., & Wilkins, M.S. (2016) Internal Control Opinion Shopping and Audit Market Competition. The Accounting Review, 91(2), 603-623.
O’Keefee, K. (2011, July 18). Update: Fitch cites China Accounting Standards as risks in review. Dow Jones International News.
Pearson, T., & Trompeter, G. (1994). Competition in the market for audit services: the effect of supplier concentration on audit fees. Contemporary Accounting Research, 11(1), 115-135.
PCAOB. (2010). Statement of Daniel L. Goelzer. Available at: https://pcaobus.org/News/Speech/Documents/05212010_Goelzer_HFSC_Testimony.pdf
Pickard, J. & Marriage, M. (2018, September 21). Labour considers breaking up Big Four accounting firms. Financial Times.
27
SEC. (2018). Statement on the Vital Role of Audit Quality and Regulatory Access to Audit and Other Information Internationally—Discussion of Current Information Access Challenges with Respect to U.S.-listed Companies with Significant Operations in China. Available at: https://www.sec.gov/news/public-statement/statement-vital-role-audit-quality-and-regulatory-access-audit-and-other
Shleifer, A. (2004). Does Competition Destroy Ethical Behavior? American Economic Review 94(2):414-418.
Sullivan, M. W. (2002). The effect of the Big Eight accounting firm mergers on the market for audit services. The Journal of Law and Economics, 45(2), 375-399.
Wang, Q., Wong, T. J., & Xia, L. (2008). State ownership, the institutional environment, and auditor choice: Evidence from China. Journal of accounting and economics, 46(1), 112-134.
Weber, J., & Willenborg, M. (2003). Do expert informational intermediaries add value? Evidence from auditors in microcap initial public offerings. Journal of Accounting Research 41 (4): 681–720.
Wenhui Daily. (2010). Twelve mainland audit firms received permission to audit H share firms. December 11.
Willenborg, M. (1999). Empirical Analysis of the economic demand for auditing in the initial public offerings market. Journal of Accounting Research 37 (1): 225-238.
Wong, J. 2020. What Investors Can Learn from Luckin’s Caffeine Crash. The Wall Street Journal, April 3. Available at https://www.wsj.com/articles/what-investors-can-learn-from-luckins-caffeine-crash-11585910558?mod=searchresults&page=1&pos=3&mod=article_inline.
Yam, S. (2009, November 14). HK should get fair deal over entry of mainland auditors. South China Morning Post.
Zheng, X. (2011, January 14). Launch of a new round of approval for mainland audit firms to do H-share audit, keeping around 10 firms eligible for H-share audit. Securities Times. (In Chinese).
28
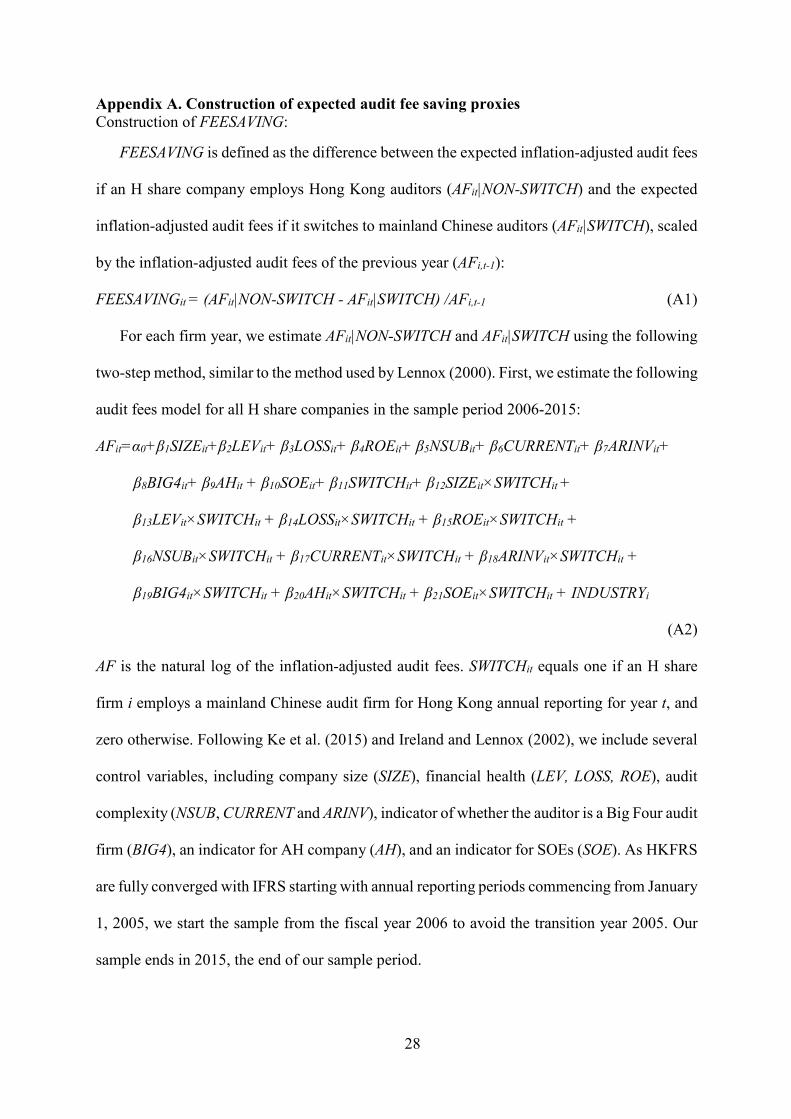
Appendix A. Construction of expected audit fee saving proxies Construction of FEESAVING:
FEESAVING is defined as the difference between the expected inflation-adjusted audit fees
if an H share company employs Hong Kong auditors (AFit|NON-SWITCH) and the expected
inflation-adjusted audit fees if it switches to mainland Chinese auditors (AFit|SWITCH), scaled
by the inflation-adjusted audit fees of the previous year (AFi,t-1):
FEESAVINGit = (AFit|NON-SWITCH - AFit|SWITCH) /AFi,t-1 (A1)
For each firm year, we estimate AFit|NON-SWITCH and AFit|SWITCH using the following
two-step method, similar to the method used by Lennox (2000). First, we estimate the following
audit fees model for all H share companies in the sample period 2006-2015:
AFit=α0+β1SIZEit+β2LEVit+ β3LOSSit+ β4ROEit+ β5NSUBit+ β6CURRENTit+ β7ARINVit+
β8BIG4it+ β9AHit + β10SOEit+ β11SWITCHit+ β12SIZEit×SWITCHit +
β13LEVit×SWITCHit + β14LOSSit×SWITCHit + β15ROEit×SWITCHit +
β16NSUBit×SWITCHit + β17CURRENTit×SWITCHit + β18ARINVit×SWITCHit +
β19BIG4it×SWITCHit + β20AHit×SWITCHit + β21SOEit×SWITCHit + INDUSTRYi
(A2)
AF is the natural log of the inflation-adjusted audit fees. SWITCHit equals one if an H share
firm i employs a mainland Chinese audit firm for Hong Kong annual reporting for year t, and
zero otherwise. Following Ke et al. (2015) and Ireland and Lennox (2002), we include several
control variables, including company size (SIZE), financial health (LEV, LOSS, ROE), audit
complexity (NSUB, CURRENT and ARINV), indicator of whether the auditor is a Big Four audit
firm (BIG4), an indicator for AH company (AH), and an indicator for SOEs (SOE). As HKFRS
are fully converged with IFRS starting with annual reporting periods commencing from January
1, 2005, we start the sample from the fiscal year 2006 to avoid the transition year 2005. Our
sample ends in 2015, the end of our sample period.

29
Second, we use the coefficients estimated in the first step to compute AFit|NON-SWITCH
and AFit|SWITCH for each firm year. Specifically, AFit|NON-SWITCH is estimated by setting
SWITCH to zero and AFit|SWITCH is estimated by setting SWITCH to one.
Construction of FEESAVING2:
We can observe the realised value of AFit|SWITCH after an H share company switches to
mainland Chinese auditors, and the realised value of AFit|NON-SWITCH if an H share company
still hires Hong Kong auditors. Hence, for these two situations, instead of using the estimated
values for AFit|NON-SWITCH and AFit|SWITCH, we use the realised value of AFit|SWITCH or
AFit|NON-SWITCH to define FEESAVING2 as follows:
FEESAVING2it = (AFit|NON-SWITCH - AFit) /AFi,t-1, if SWITCHit=1 (A3)
FEESAVING2it = (AFit - AFit|SWITCH) /AFi,t-1, if SWITCHit=0 (A4)
Construction of AH:
Finally, we use AH as an alternative proxy for the audit fee saving. Compared with
companies only listed in Hong Kong, before switch, AH companies paid audit fees to both
Hong Kong auditors for Hong Kong reporting and mainland Chinese auditors for mainland
reporting. Hence, we expect AH firms to save more audit fees by switching to mainland Chinese
auditors after the regulation. We define AH equal to one if the company is an AH company at
the fiscal year end, and zero otherwise.

30
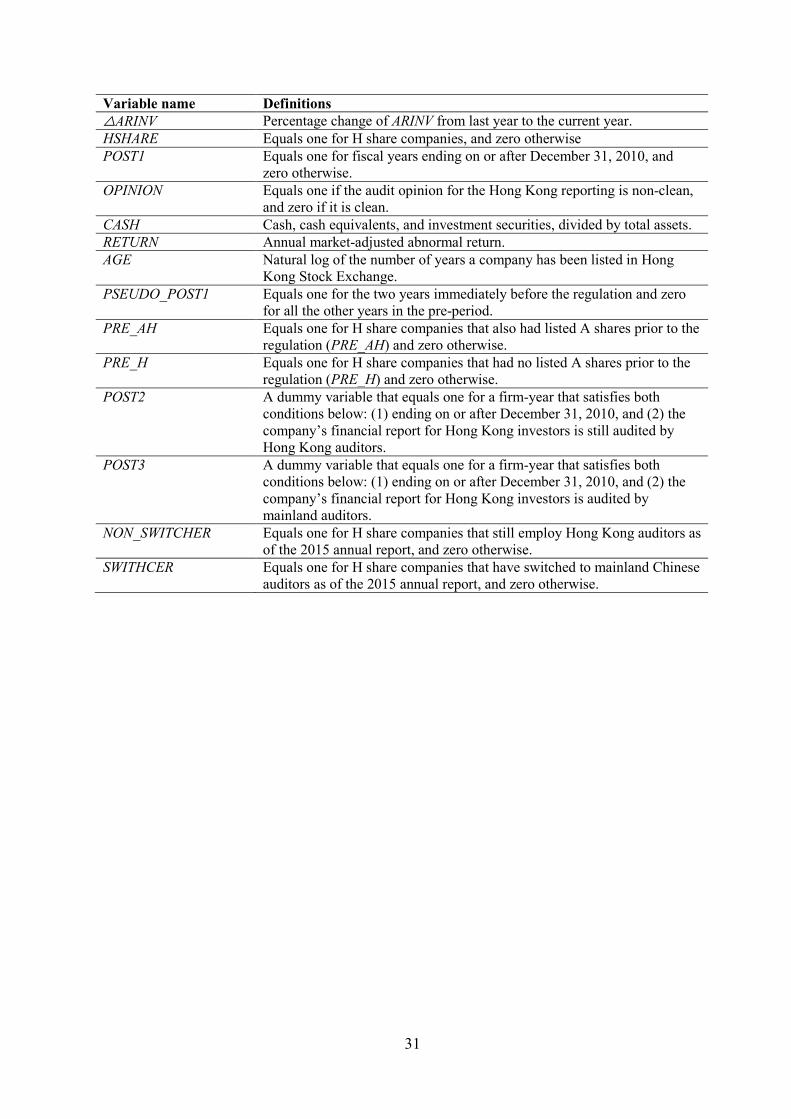
Appendix B. Variable definitions Variable name Definitions WEDGE Equals one if the control rights minus the cash flows rights of the ultimate
controlling shareholder is positive, and the voting rights of the ultimate shareholder is greater than 10%.
FEESAVING Difference between the expected inflation-adjusted audit fees if an H share company employs Hong Kong auditors and the expected inflation-adjusted audit fees if it switches to mainland Chinese auditors, scaled by the inflation-adjusted audit fees in the previous year. See Appendix A for the details.
FEESAVING2 For companies that have switched to mainland Chinese auditors, it is the difference between the expected inflation-adjusted audit fees had the companies still employed Hong Kong auditors and the inflation-adjusted actual audit fees in the year, scaled by the inflation-adjusted audit fees of the previous year. For companies that still employ Hong Kong auditors, it is the difference between the inflation-adjusted actual audit fees of the year and the expected inflation-adjusted audit fees had the companies switched to mainland Chinese auditors, scaled by the inflation-adjusted audit fees of the previous year. See Appendix A for the details.
AH Equals one if the company is an AH firm at the fiscal year end, and zero otherwise.
INVEST_OPP Measuring investment opportunities. Equals 2-year geometric average of the annual percentage growth in net sales.
EXTERNAL_FIN Measuring the need for external financing. It equals the difference between the firm’s actual growth rate and the sustainable growth rate with retained earnings and short-term and long-term debt financing that maintain a constant debt-to-assets ratio. The actual growth rate is the 2-year geometric average of the annual growth rate in total assets. The sustainable growth rate is the 2-year average of ROE/(1-ROE).
SIZE The natural logarithm total assets at the end of the year. LEV Total liabilities divided by total assets at the end of the year. LOSS Equals one if the company reports a loss at the annual report, and zero
otherwise. ROE Net operating income divided by total equity. NSUB Square root of the number of subsidiaries included in the consolidated
financial statements. CURRENT Current assets divided by current liabilities. ARINV Accounts receivable and inventory, divided by total assets. BIG4 Equals one if the company’s Hong Kong annual reporting is audited by a
Big Four auditor, and zero otherwise. SOE Equals one if the company is a state-owned company, and zero otherwise. AuditFees (HKD million)
Audit fees in HKD million. For companies only listed in Hong Kong, audit fees include fees paid for the Hong Kong audit. For AH firms, audit fees include fees paid for both mainland and Hong Kong audit.
AF The natural log of the inflation-adjusted audit fees. △AF Percentage change of inflation-adjusted audit fees from last year to the
current year. △SIZE Percentage change of SIZE from last year to the current year. △LEV Percentage change of LEV from last year to the current year. △CURRENT Percentage change of CURRENT from last year to the current year. △NSUB Percentage change of NSUB from last year to the current year.
31
Variable name Definitions △ARINV Percentage change of ARINV from last year to the current year. HSHARE Equals one for H share companies, and zero otherwise POST1 Equals one for fiscal years ending on or after December 31, 2010, and
zero otherwise. OPINION Equals one if the audit opinion for the Hong Kong reporting is non-clean,
and zero if it is clean. CASH Cash, cash equivalents, and investment securities, divided by total assets. RETURN Annual market-adjusted abnormal return. AGE Natural log of the number of years a company has been listed in Hong
Kong Stock Exchange. PSEUDO_POST1 Equals one for the two years immediately before the regulation and zero
for all the other years in the pre-period. PRE_AH Equals one for H share companies that also had listed A shares prior to the
regulation (PRE_AH) and zero otherwise. PRE_H Equals one for H share companies that had no listed A shares prior to the
regulation (PRE_H) and zero otherwise. POST2 A dummy variable that equals one for a firm-year that satisfies both
conditions below: (1) ending on or after December 31, 2010, and (2) the company’s financial report for Hong Kong investors is still audited by Hong Kong auditors.
POST3 A dummy variable that equals one for a firm-year that satisfies both conditions below: (1) ending on or after December 31, 2010, and (2) the company’s financial report for Hong Kong investors is audited by mainland auditors.
NON_SWITCHER Equals one for H share companies that still employ Hong Kong auditors as of the 2015 annual report, and zero otherwise.
SWITHCER Equals one for H share companies that have switched to mainland Chinese auditors as of the 2015 annual report, and zero otherwise.

32
Figure 1. Distribution of the timing of the H share firms’ switching to mainland auditors
Notes:
Same brand: the mainland audit firm hired after the switch and the Hong Kong audit firm hired before the switch are under the same brand.
Different brands: the mainland audit firm hired after the switch and the Hong Kong audit firm hired before the switch are under different brands.
3
0
22
3
6
12
0 0
32
1
05
1015
20nu
mbe
r of c
ompa
nies
2010 2011 2012 2013 2014 2015year of switch
same brand different brands
33
Table 1. Market share of Big Four and non-Big Four auditors for H share companies
Panel A. Market share for fiscal year 2009
Market share by client size Market share by number of clients
Big Four – HK office 92% 66% Non Big Four – HK office 8% 34% Total 100% 100%
Panel B. Market share for fiscal year 2015
Market share by client size Market share by number of clients
HK office (a)
Mainland office(b)
Total (c=a+b)
HK office (d)
Mainland office (e)
Total (f=d+e)
Big Four 76% 13% 89% 44% 13% 57% Non Big Four 8% 4% 12% 24% 18% 42% Total 84% 17% 100% 68% 31% 100%
The table shows market shares between Big Four and non-Big Four auditors for H share companies that have at least one observation for the fiscal years before the regulation and one observation for the fiscal years after the regulation, excluding financial firms. Client size is measured using total assets in 2009 and 2015, respectively. In Panel B, the “Total” of Column (c) and Column (f) are not exactly equal to the sum of columns (a) and (b) and columns (d) and (e), respectively, due to rounding errors.

34
Table 2. Cox hazard regression results on the determinants of H share firms’ auditor choice following the regulation
Panel A: Sample selection
Switchers Non-switchers No. of firm-year observations Initial Sample a 258 580 Exclude Firms years after switch for switchers (143) 0 Firms listed in Hong Kong in 2009, thus missing data for INVEST_OPP and EXTERNAL_FIN as of December 31, 2010
(2) (2)
Firm years with missing data for NSUB 0 (13) Firm years that do not disclose audit fee in the previous year, thus missing data for FEESAVING and FEESAVING2
(11) (37)
Firm years that do not disclose audit fee in the current year, thus missing data for FEESAVING2
(2) (6)
Firm years with NSUB as 0 in the previous year, thus no valid data for ΔNSUB
(1) (3)
Final Sample 99 519 Switchers Non-switchers No. of unique companies Initial Sample 43 101 Final Sample 40 94
a: The initial sample includes all H share companies that were listed in Hong Kong before the end of 2009 and have at least one annual report for fiscal year ending on or after December 15, 2010. Firms in financial industry are excluded.

35
Panel B: Summary Statistics
Variable N Mean Median Std. Dev Min. 25% 75% Max. Non-switchers WEDGE 519 0.268 0.000 0.443 0.000 0.000 1.000 1.000 FEESAVING 519 0.325 0.300 0.289 -0.357 0.142 0.475 1.349 FEESAVING2 519 0.224 0.253 0.413 -1.136 -0.005 0.530 1.612 AH 519 0.366 0.000 0.482 0.000 0.000 1.000 1.000 INVEST_OPP 519 0.156 0.127 0.276 -0.468 0.012 0.255 1.363 EXTERNAL_FIN 519 0.037 0.019 0.193 -0.562 -0.069 0.117 0.757 SIZE 519 23.412 23.815 2.576 17.404 21.414 25.523 28.241 ROE 519 0.052 0.095 0.299 -2.072 0.040 0.151 0.397 LEV 519 0.565 0.530 0.478 0.115 0.329 0.692 3.795 CURRENT 519 1.640 1.296 1.204 0.190 0.835 1.984 5.943 NSUB 519 4.093 3.606 2.459 0.000 2.449 5.568 11.916 ARINV 519 0.221 0.194 0.164 0.000 0.084 0.328 0.663 SOE 519 0.734 1.000 0.442 0.000 0.000 1.000 1.000 BIG4t-1 519 0.669 1.000 0.471 0.000 0.000 1.000 1.000 ΔSIZE 519 0.004 0.004 0.008 -0.022 0.001 0.008 0.033 ΔROE 519 -0.128 -0.081 2.136 -10.318 -0.444 0.168 9.577 ΔLEV 519 0.020 0.008 0.175 -0.468 -0.047 0.068 0.775 ΔCURRENT 519 0.046 0.000 0.335 -0.602 -0.104 0.115 1.797 ΔNSUB 519 0.037 0.000 0.151 -0.390 0.000 0.061 0.789 ΔARINV 519 0.108 0.021 0.604 -0.637 -0.083 0.149 4.859 Switchers WEDGE 99 0.374 0.000 0.486 0.000 0.000 1.000 1.000 FEESAVING 99 0.393 0.315 0.321 -0.085 0.159 0.521 1.349 FEESAVING2 99 0.194 0.151 0.566 -1.136 -0.155 0.482 1.612 AH 99 0.515 1.000 0.502 0.000 0.000 1.000 1.000 INVEST_OPP 99 0.165 0.140 0.203 -0.202 0.036 0.243 0.689 EXTERNAL_FIN 99 0.068 0.046 0.157 -0.206 -0.016 0.100 0.615 SIZE 99 22.721 22.594 1.922 18.663 21.304 24.167 26.747 ROE 99 0.071 0.079 0.127 -0.443 0.019 0.138 0.393 LEV 99 0.490 0.502 0.194 0.115 0.337 0.625 0.894 CURRENT 99 1.743 1.356 1.136 0.379 1.084 2.145 5.943 NSUB 99 3.929 3.464 1.812 1.732 2.646 4.899 11.916 ARINV 99 0.307 0.304 0.153 0.011 0.196 0.419 0.663 SOE 99 0.788 1.000 0.411 0.000 1.000 1.000 1.000 BIG4t-1 99 0.515 1.000 0.502 0.000 0.000 1.000 1.000 ΔSIZE 99 0.006 0.005 0.008 -0.017 0.001 0.011 0.032 ΔROE 99 0.043 -0.013 2.571 -10.318 -0.465 0.403 9.577 ΔLEV 99 0.056 0.020 0.194 -0.326 -0.034 0.117 0.775 ΔCURRENT 99 0.012 -0.020 0.343 -0.602 -0.124 0.101 1.797 ΔNSUB 99 0.051 0.000 0.152 -0.293 0.000 0.074 0.789 ΔARINV 99 0.164 0.054 0.583 -0.464 -0.052 0.171 4.859

36
Panel C: Regression results
Dependent variable=hazard rate of auditor switch (1) (2) (3) FEESAVINGi,t 2.589*** (0.002) FEESAVING2 i,t 1.676*** (0.001) AHi,t 1.737*** (0.001) WEDGEi,t -0.004 -0.242 -0.128 (0.994) (0.626) (0.787) INVEST_OPPi,t -2.669*** -2.433*** -2.161*** (0.002) (0.001) (0.009) EXTERNAL_FINi,t -0.160 -0.180 -0.220 (0.915) (0.913) (0.867) BIG4i,t-1 0.617 0.019 -0.516 (0.304) (0.972) (0.245) SIZEi,t -0.605** -0.423** -0.312** (0.017) (0.032) (0.045) ROEi,t 0.817 0.538 0.949 (0.391) (0.631) (0.244) LEVi,t -2.931* -4.616*** -1.855* (0.053) (0.005) (0.100) CURRENTi,t -0.402 -0.651** -0.132 (0.111) (0.047) (0.593) NSUBi,t 0.229* 0.259** 0.156* (0.063) (0.015) (0.089) ARINVi,t 4.832*** 4.081*** 5.110*** (0.001) (0.005) (0.001) SOEi,t 1.275* 1.094 0.656 (0.070) (0.150) (0.345) ΔSIZEi,t 6.803 13.938 13.739 (0.832) (0.675) (0.718) ΔROEi,t 0.057 0.100 0.099* (0.263) (0.108) (0.057) ΔLEVi,t 1.238 1.877 2.056 (0.252) (0.103) (0.179) ΔCURRENTi,t 1.555*** 1.855*** 1.223*** (0.000) (0.000) (0.004) ΔNSUBi,t 1.225 0.796 1.617** (0.173) (0.337) (0.027) ΔARINVi,t 0.121 0.007 -0.017 (0.628) (0.982) (0.950) INDUSTRY yes yes yes N 618 618 618 Pseudo R2 0.164 0.180 0.161 Log lik. -150.579 -147.691 -151.079 Chi-squared 16370.310 19666.698 165.342
All continuous variables are winsorized at the top and bottom 1% percentiles. See Appendix B for variable definitions. *, **, and *** denote significance at 10%, 5%, and 1% levels (two-tailed), respectively. The p values reported in parentheses are based on standard errors clustered by company.

37
Table 3. Sample selection for difference-in-difference tests
Panel A. Sample selection
Number of firm-year observations Tests of audit fees Test of audit opinions All H share companies and Red Chip companies with financial year end from Dec-31-2006 to Dec-31-2015, firms in financial industry excluded
5,837 5,837
Exclude Companies with no annual report for all periods before regulation or all periods after the regulation (1,417) (1,417)
Firm year not equal to 12 months (31) (31) No disclosure of audit fees (213) No disclosure of number of subsidiaries (31) Missing RETURN due to first year listing (128) Final Sample 4,145 4,261
Panel B. Distribution of sample firms for audit fees
Number of firms H share Non-switchers 95 Switchers 43 138 Red Chip 352 Total 490
Panel C. Distribution of sample firms for audit opinions
Number of firms H share Non-switchers 101 Switchers 43 144 Red Chip 354 Total 498
See Appendix B for variable definitions.

38
Table 4. Impact of the regulation on audit fees for all H share companies
Panel A. Descriptive statistics for H share and Red Chips before and after the reform
Before the reform After the reform N Mean Median S.D N Mean Median S.D H share AuditFees (HKD million) 485 7.593 3.060 12.879 777 8.554 3.590 12.979 AF 485 14.954 14.897 1.255 777 15.121 15.057 1.269 SIZE 485 22.656 22.756 2.092 777 23.326 23.532 2.348 LEV 485 0.479 0.475 0.247 777 0.536 0.524 0.307 LOSS 485 0.186 0.000 0.389 777 0.193 0.000 0.395 ROE 485 0.072 0.102 0.301 777 0.053 0.087 0.285 NSUB 485 3.434 3.162 1.953 777 4.175 3.606 2.352 CURRENT 485 1.873 1.311 2.018 777 1.646 1.295 1.215 ARINV 485 0.213 0.186 0.150 777 0.248 0.225 0.169 BIG4 485 0.732 1.000 0.443 777 0.613 1.000 0.487 AH 485 0.344 0.000 0.476 777 0.441 0.000 0.497 SOE 485 0.757 1.000 0.430 777 0.737 1.000 0.440 Red Chip AuditFees (HKD million) 1,025 3.362 1.720 6.804 1,858 4.126 2.220 7.285 AF 1,025 14.398 14.330 0.972 1,858 14.663 14.589 0.945 SIZE 1,025 21.577 21.504 1.785 1,858 22.384 22.332 1.835 LEV 1,025 0.462 0.407 0.380 1,858 0.486 0.464 0.311 LOSS 1,025 0.287 0.000 0.453 1,858 0.346 0.000 0.476 ROE 1,025 0.051 0.093 0.347 1,858 0.003 0.063 0.377 NSUB 1,025 4.057 3.606 1.836 1,858 4.459 4.000 1.969 CURRENT 1,025 3.122 1.795 3.974 1,858 2.643 1.571 3.443 ARINV 1,025 0.218 0.188 0.184 1,858 0.231 0.175 0.198 BIG4 1,025 0.686 1.000 0.464 1,858 0.681 1.000 0.466 AH 1,025 0.000 0.000 0.000 1,858 0.000 0.000 0.000 SOE 1,025 0.318 0.000 0.466 1,858 0.329 0.000 0.470

39
Panel B. Regression results
Dependent variable=AFi,t Coefficients p-value POST1t×HSHAREi -0.059* (0.056) SIZEi,t 0.227*** (0.000) LEVi,t 0.127*** (0.004) LOSSi,t 0.034** (0.023) ROEi,t -0.043** (0.023) CURRENTi,t -0.012*** (0.000) NSUBi,t 0.032*** (0.002) ARINVi,t -0.115 (0.154) BIG4i,t 0.407*** (0.000) AHi,t -0.086 (0.420) SOEi,t 0.064 (0.215) Constant 9.050*** (0.000) Year fixed effects yes Firm fixed effects yes N 4,145 Adj. R2 0.951
All continuous variables are winsorized at the top and bottom 1% level. See Appendix B for variable definitions. *, **, and *** denote significance at 10%, 5%, and 1% levels (two-tailed), respectively. The p values reported in parentheses are based on standard errors clustered by company.
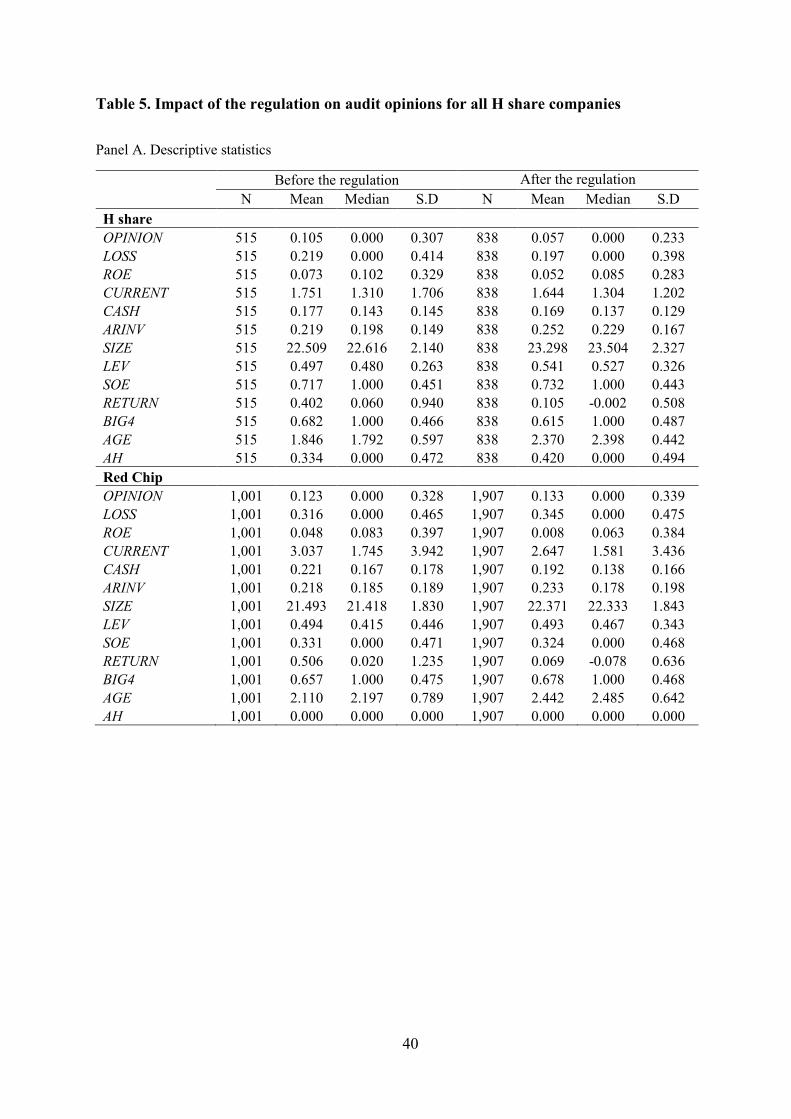
40
Table 5. Impact of the regulation on audit opinions for all H share companies
Panel A. Descriptive statistics
Before the regulation After the regulation N Mean Median S.D N Mean Median S.D H share OPINION 515 0.105 0.000 0.307 838 0.057 0.000 0.233 LOSS 515 0.219 0.000 0.414 838 0.197 0.000 0.398 ROE 515 0.073 0.102 0.329 838 0.052 0.085 0.283 CURRENT 515 1.751 1.310 1.706 838 1.644 1.304 1.202 CASH 515 0.177 0.143 0.145 838 0.169 0.137 0.129 ARINV 515 0.219 0.198 0.149 838 0.252 0.229 0.167 SIZE 515 22.509 22.616 2.140 838 23.298 23.504 2.327 LEV 515 0.497 0.480 0.263 838 0.541 0.527 0.326 SOE 515 0.717 1.000 0.451 838 0.732 1.000 0.443 RETURN 515 0.402 0.060 0.940 838 0.105 -0.002 0.508 BIG4 515 0.682 1.000 0.466 838 0.615 1.000 0.487 AGE 515 1.846 1.792 0.597 838 2.370 2.398 0.442 AH 515 0.334 0.000 0.472 838 0.420 0.000 0.494 Red Chip OPINION 1,001 0.123 0.000 0.328 1,907 0.133 0.000 0.339 LOSS 1,001 0.316 0.000 0.465 1,907 0.345 0.000 0.475 ROE 1,001 0.048 0.083 0.397 1,907 0.008 0.063 0.384 CURRENT 1,001 3.037 1.745 3.942 1,907 2.647 1.581 3.436 CASH 1,001 0.221 0.167 0.178 1,907 0.192 0.138 0.166 ARINV 1,001 0.218 0.185 0.189 1,907 0.233 0.178 0.198 SIZE 1,001 21.493 21.418 1.830 1,907 22.371 22.333 1.843 LEV 1,001 0.494 0.415 0.446 1,907 0.493 0.467 0.343 SOE 1,001 0.331 0.000 0.471 1,907 0.324 0.000 0.468 RETURN 1,001 0.506 0.020 1.235 1,907 0.069 -0.078 0.636 BIG4 1,001 0.657 1.000 0.475 1,907 0.678 1.000 0.468 AGE 1,001 2.110 2.197 0.789 1,907 2.442 2.485 0.642 AH 1,001 0.000 0.000 0.000 1,907 0.000 0.000 0.000
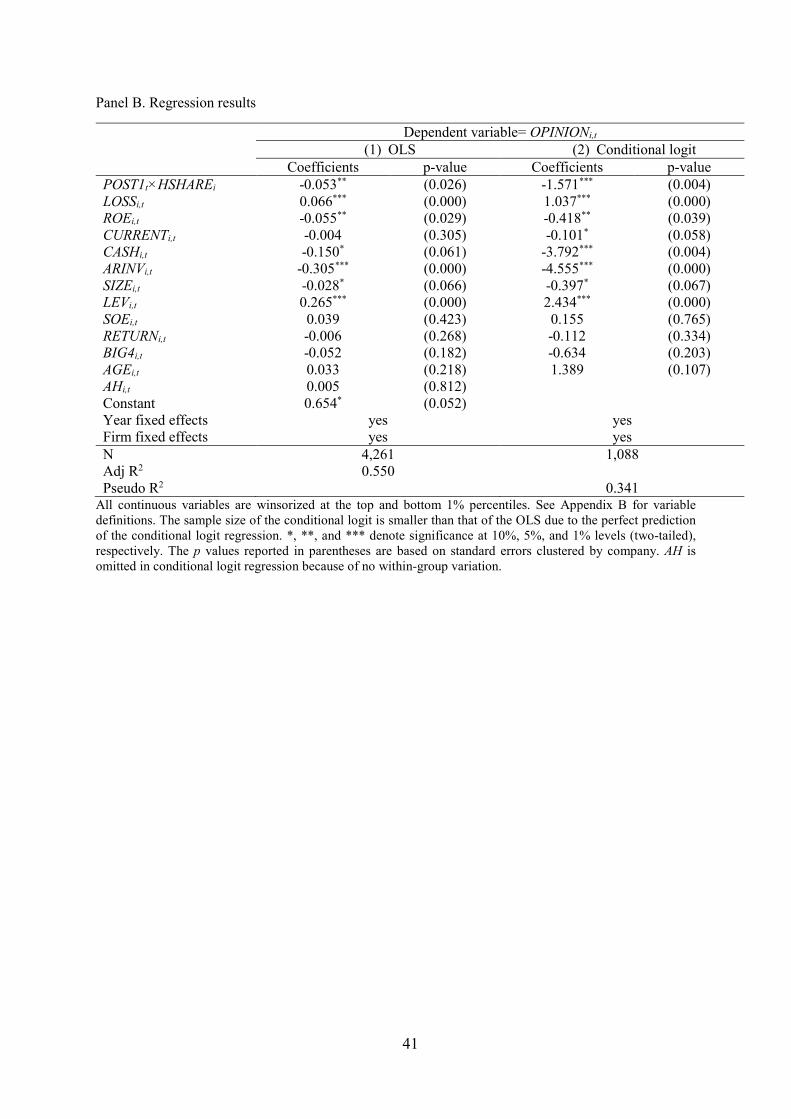
41
Panel B. Regression results
Dependent variable= OPINIONi,t (1) OLS (2) Conditional logit Coefficients p-value Coefficients p-value POST1t×HSHAREi -0.053** (0.026) -1.571*** (0.004) LOSSi,t 0.066*** (0.000) 1.037*** (0.000) ROEi,t -0.055** (0.029) -0.418** (0.039) CURRENTi,t -0.004 (0.305) -0.101* (0.058) CASHi,t -0.150* (0.061) -3.792*** (0.004) ARINVi,t -0.305*** (0.000) -4.555*** (0.000) SIZEi,t -0.028* (0.066) -0.397* (0.067) LEVi,t 0.265*** (0.000) 2.434*** (0.000) SOEi,t 0.039 (0.423) 0.155 (0.765) RETURNi,t -0.006 (0.268) -0.112 (0.334) BIG4i,t -0.052 (0.182) -0.634 (0.203) AGEi,t 0.033 (0.218) 1.389 (0.107) AHi,t 0.005 (0.812) Constant 0.654* (0.052) Year fixed effects yes yes Firm fixed effects yes yes N 4,261 1,088 Adj R2 0.550 Pseudo R2 0.341
All continuous variables are winsorized at the top and bottom 1% percentiles. See Appendix B for variable definitions. The sample size of the conditional logit is smaller than that of the OLS due to the perfect prediction of the conditional logit regression. *, **, and *** denote significance at 10%, 5%, and 1% levels (two-tailed), respectively. The p values reported in parentheses are based on standard errors clustered by company. AH is omitted in conditional logit regression because of no within-group variation.

42
Table 6. Test of the parallel trends assumption (1) Dependent variable=AFi,t (2) Dependent variable=OPINIONi,t Coefficients p-value Coefficients p-value PSEUDO_POST1t× HSHAREi
0.031 (0.393) -0.030 (0.287)
N 1,510 1,534 Adj. R2 0.959 0.646
OLS regressions are used. We are not able to run the conditional logit model for audit opinion because the sample size is too small and therefore the conditional logit regression fails to converge. All continuous variables are winsorized at the top and bottom 1% percentiles. See Appendix B for variable definitions. *, **, and *** denote significance at 10%, 5%, and 1% levels (two-tailed), respectively. The control variables, year and firm fixed effects are included in estimation but not reported. The p values reported in parentheses are based on standard errors clustered by company.
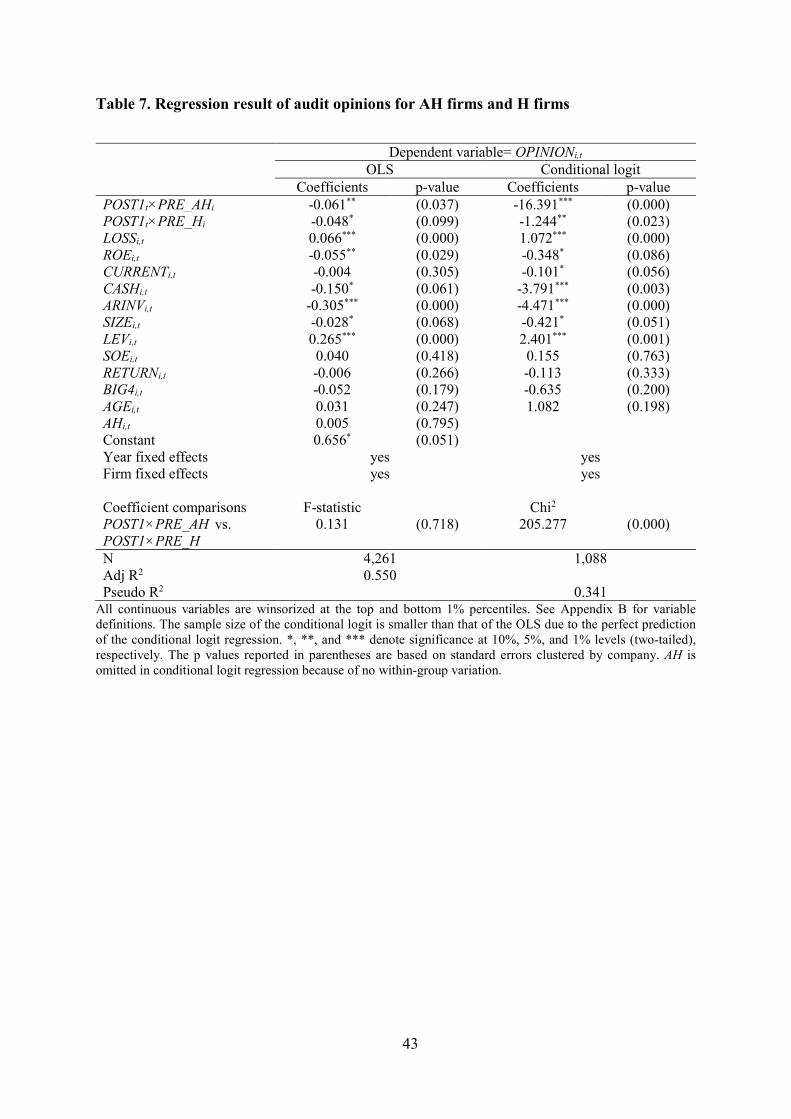
43
Table 7. Regression result of audit opinions for AH firms and H firms
Dependent variable= OPINIONi,t OLS Conditional logit Coefficients p-value Coefficients p-value POST1t×PRE_AHi -0.061** (0.037) -16.391*** (0.000) POST1t×PRE_Hi -0.048* (0.099) -1.244** (0.023) LOSSi,t 0.066*** (0.000) 1.072*** (0.000) ROEi,t -0.055** (0.029) -0.348* (0.086) CURRENTi,t -0.004 (0.305) -0.101* (0.056) CASHi,t -0.150* (0.061) -3.791*** (0.003) ARINVi,t -0.305*** (0.000) -4.471*** (0.000) SIZEi,t -0.028* (0.068) -0.421* (0.051) LEVi,t 0.265*** (0.000) 2.401*** (0.001) SOEi,t 0.040 (0.418) 0.155 (0.763) RETURNi,t -0.006 (0.266) -0.113 (0.333) BIG4i,t -0.052 (0.179) -0.635 (0.200) AGEi,t 0.031 (0.247) 1.082 (0.198) AHi,t 0.005 (0.795) Constant 0.656* (0.051) Year fixed effects yes yes Firm fixed effects yes yes Coefficient comparisons F-statistic Chi2 POST1×PRE_AH vs. POST1×PRE_H
0.131 (0.718) 205.277 (0.000)
N 4,261 1,088 Adj R2 0.550 Pseudo R2 0.341
All continuous variables are winsorized at the top and bottom 1% percentiles. See Appendix B for variable definitions. The sample size of the conditional logit is smaller than that of the OLS due to the perfect prediction of the conditional logit regression. *, **, and *** denote significance at 10%, 5%, and 1% levels (two-tailed), respectively. The p values reported in parentheses are based on standard errors clustered by company. AH is omitted in conditional logit regression because of no within-group variation.

44
Table 8. The impact of the regulation on audit fees for the switchers and non-switchers
Dependent variable=AFi,t (1) (2) Coefficients p-value Coefficients p-value POST1t×NON_SWITCHERi -0.027 (0.453) POST2i,t×SWITCHERi -0.020 (0.564) POST3i,t×SWITCHERi -0.189*** (0.000) SIZEi,t 0.226*** (0.000) 0.222*** (0.000) LEVi,t 0.126*** (0.005) 0.130*** (0.008) LOSSi,t 0.034** (0.027) 0.032** (0.044) ROEi,t -0.036* (0.051) -0.056** (0.012) CURRENTi,t -0.013*** (0.000) -0.013*** (0.000) NSUBi,t 0.036*** (0.001) 0.034*** (0.003) ARINVi,t -0.112 (0.178) -0.130 (0.137) BIG4i,t 0.386*** (0.000) 0.449*** (0.000) AHi,t -0.141 (0.394) 0.049 (0.730) SOEi,t 0.062 (0.250) 0.077 (0.176) Constant 9.067*** (0.000) 9.042*** (0.000) Year fixed effects yes yes Firm fixed effects yes yes Coefficient comparisons p-value POST1×NON_SWITCHER vs. (POST2× SWITCHER+ POST3× SWITCHER) 0.0056 N 3,752 3,276 Adj. R2 0.951 0.938
All continuous variables are winsorized at the top and bottom 1% percentiles. See Appendix B for variable definitions. *, **, and *** denote significance at 10%, 5%, and 1% levels (two-tailed), respectively. The p values reported in parentheses are based on standard errors clustered by company.
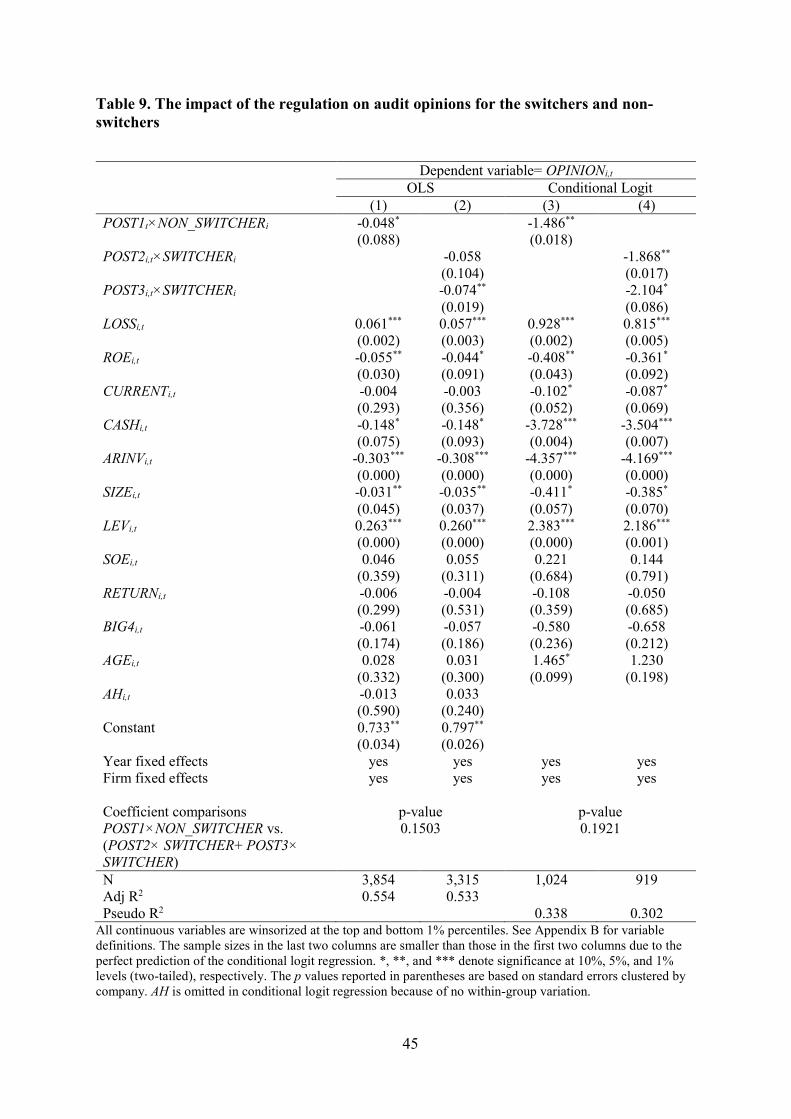
45
Table 9. The impact of the regulation on audit opinions for the switchers and non-switchers
Dependent variable= OPINIONi,t OLS Conditional Logit (1) (2) (3) (4) POST1t×NON_SWITCHERi -0.048* -1.486** (0.088) (0.018) POST2i,t×SWITCHERi -0.058 -1.868** (0.104) (0.017) POST3i,t×SWITCHERi -0.074** -2.104* (0.019) (0.086) LOSSi,t 0.061*** 0.057*** 0.928*** 0.815*** (0.002) (0.003) (0.002) (0.005) ROEi,t -0.055** -0.044* -0.408** -0.361* (0.030) (0.091) (0.043) (0.092) CURRENTi,t -0.004 -0.003 -0.102* -0.087* (0.293) (0.356) (0.052) (0.069) CASHi,t -0.148* -0.148* -3.728*** -3.504*** (0.075) (0.093) (0.004) (0.007) ARINVi,t -0.303*** -0.308*** -4.357*** -4.169*** (0.000) (0.000) (0.000) (0.000) SIZEi,t -0.031** -0.035** -0.411* -0.385* (0.045) (0.037) (0.057) (0.070) LEVi,t 0.263*** 0.260*** 2.383*** 2.186*** (0.000) (0.000) (0.000) (0.001) SOEi,t 0.046 0.055 0.221 0.144 (0.359) (0.311) (0.684) (0.791) RETURNi,t -0.006 -0.004 -0.108 -0.050 (0.299) (0.531) (0.359) (0.685) BIG4i,t -0.061 -0.057 -0.580 -0.658 (0.174) (0.186) (0.236) (0.212) AGEi,t 0.028 0.031 1.465* 1.230 (0.332) (0.300) (0.099) (0.198) AHi,t -0.013 0.033 (0.590) (0.240) Constant 0.733** 0.797** (0.034) (0.026) Year fixed effects yes yes yes yes Firm fixed effects yes yes yes yes Coefficient comparisons p-value p-value POST1×NON_SWITCHER vs. (POST2× SWITCHER+ POST3× SWITCHER)
0.1503 0.1921
N 3,854 3,315 1,024 919 Adj R2 0.554 0.533 Pseudo R2 0.338 0.302
All continuous variables are winsorized at the top and bottom 1% percentiles. See Appendix B for variable definitions. The sample sizes in the last two columns are smaller than those in the first two columns due to the perfect prediction of the conditional logit regression. *, **, and *** denote significance at 10%, 5%, and 1% levels (two-tailed), respectively. The p values reported in parentheses are based on standard errors clustered by company. AH is omitted in conditional logit regression because of no within-group variation.