Embed Size (px)
Citation preview

The Consequences of Earlier Reproduction in Declining Populations
CHRISTOPHER G. HOOGENDYK*
School of Naturul Resources, The University of Michigan, Ann Arbor, Michigan 48109
AND
GEORGE F. ESTABROOK
Division of Biological Sciences, The University of Michigan, Ann Arbor, Michigan 48109
Received 18 Mu-v 1984; revised 25 May 1984
ABSTRACT
Conflicting claims have been published concerning the consequences of earlier repro-
duction. In particular, it has been claimed that earlier reproduction will increase the rate of
decline in a declining population, have no effect in a stable population, and enhance the
rate of growth in an increasing population. However, if fecundity and mortality are
conceptually separated so that earlier reproduction is defined as moving the fecundity
column of the life table forward in time but not changing the mortality column, then earlier
reproduction will nearly always cause the rate of change of a population to become more
positive. This definition is believed to be more consistent with what biologists think of as
earlier reproduction. Also, this concept requires that the cost of reproducing earlier be
explicitly addressed rather than hiding it in assumptions implicit in a definition of earlier
reproduction. This paper reconciles published mathematical demography models with
published biological claims concerning earlier reproduction.
1. INTRODUCTION
There have been several sources of the claim that earlier reproduction causes a declining population to decline more rapidly. It usually arises from the broad interdependence of all the parameters and variables that can be derived from life tables and that describe the behavior of a population. For example, a life table or equation may occur in which the mortality rates and fertility rates are tied together by the form of the variables. Then, when the age of reproduction is changed, the mortality rates are affected as well. The
*Current address: Terrestrial and Aquatic Ecology Division, Brookhaven National
Laboratory, Upton, New York 11973; (516) 282-3744.
MATHEMATICAL BIOSCIENCES 71:217-235 (1984)
OElsevier Science Publishing Co., Inc., 1984
52 Vanderbilt Ave., New York, NY 10017
217
0025-5564/X4/$03.00

218 C. G. HOOGENDYK AND G. F. ESTABROOK
result may be a simultaneous shift of both the mortality rates and the fertility rates. In one case, this had the effect of compressing the time scale by multiplying the exponential rate of increase by some positive factor; with the time frame compressed, an increasing population increases faster and a declining population declines faster.
A similar source of confusion arises from the analogy with interest rates. The term epr.’ occurs in many demographic equations and has been de- scribed as applying a discount rate r to offspring at age x. This analogy leads to discussions concerning the selective advantage of having offspring early in life or late in life based on r, the exponential rate of increase, serving as a discount rate. Such discussions neglect the fact that by having offspring earlier in life or later in life, the life table is changed, and r, which is a function of the life table, may also change. The equations on which such discussions are based assume a constant life history and a stable age distribution. When the life history is changed, other parts of the equation also change to maintain the relationships among the variables.
The presentation of the specific examples below will assume some familiarity with the mathematical methods used in studying life histories. A good introduction may be found in Ricklefs [33] and Mertz [26].
2. EXAMPLE I
One of the earliest proponents of the idea that earlier reproduction increases the rate of decline in a declining population is Mertz [27-291. In his paper on the mathematical demography of the California condor, Mertz [27] presents an analysis of the effect of development time. He begins with a life history table for the California condor (Table 1). In this table, j3 is the probability at birth of surviving to the age of first reproduction and p is the annual adult survival rate. The birds mature at age 5 and lay one egg every other year. One half of the eggs are female.
From any life history table, the growth rate can be determined using Lotka’s [24] classic equation:
m
c X-“l,yr?l, =l, (1) x = 0
where X ( = er) is the geometric rate of increase, and r is the exponential rate of increase, of a population that has a stable age distribution and constant life history parameters as defined by 1, and m,. Substituting the entries from Table 1 into Equation (l), Mertz arrives at the following:
P p _ 2x3 _ _ = 0, P ?

DECLINING POPULATIONS
TABLE 1
The Basic California Condor Life Historya
219
x ‘x Mx lxmx
0 1.0 0 0
1 . 0
2 0
3 0
4 0 5 P I
6 PP ; I PP2 1
2 i LW5 1
G
0
0
0
0
P/2 0
PP2/2
BP8 - 5/2 (for I odd)
0 (for I even)
‘x = age in years, I, = probability at birth of living to age x,
and m, = the expected number of daughter eggs laid at age x
by a surviving female. From Mertz [27].
This equation is used to construct figures with isopleths of X as a function of
P and P. Examining the effects of development time, Mertz [27, p. 4451 writes, “For
fixed values of /? and p, development time has no effect on the equation for
R, [R, = CT=,, Ixm, = p/(2(1 - p2))]. However, X is affected, and signifying development time by the symbol 7, a generalization for equation (2) is obtained:
x’__ P P 2x7-2__ =()
2 (24
where r is an integer 2 or greater.” Equation (2~) is used with T = 4 to construct additional isopleths on the figure containing Equation (2) isopleths [see Figure l(a)]. If the dashed isopleth (7 = 4) is below the solid isopleth (T = 5), this is interpreted as meaning that when T = 4 a lower juvenile and/or adult survival rate can result in the same rate of change for the population, or, if the survival rates remain the same, then the rate of change of the population will become more positive. From Figure l(a) Mertz concludes that “for declining populations.. the shorter developmental time accelerates the population decline.” Mertz then argues that rapid develop- ment would be selected against during population declines. In applying this and other conclusions to the California condor, he cites evidence for popula- tion decline through a long span of geologic time and argues [28] that “the California condor may have had its life history shaped by many years of population contraction in the absence of many colonizing opportunities.”

220 C. <;. HOOGENDYK AND G. F. ESTABROOK
Mertz’s Equations (2) and (2~) are special cases for the particular entries
in the life table. When he begins to vary T, he neglects the fact that /-? is a
survival rate and that the time portion of /3 is 7. Changing 7 from 5 to 4 not
only increases the rate of maturation but also increases the mortality rate of
immature birds by the same factor. The I, column and the m, column of the
life table are both moved up one year. This shifting of both columns together
leaves R, unchanged and the direction of population growth or decline
unchanged, but increases the rate at which the population is either growing
or declining.
To see the effect of early development without imposing a higher rate of
mortality as well, /3 must be broken down into a yearly rate. Mertz [27] says,
“a heavy proportion of immature mortality probably falls in the first year of
life.” Taking the simplest approach, /3 can be replaced with /I, pTm ‘, in which
/I1 is first year survival, and survival in successive years is the same as for
adults. Goodman [15] used this same approach in examining the life history
% CHANGE PER YEAR
(a> I.C )-
C
-I 0%
0.2 0.4 0.6 0.8 1.0
IMMATURE SURVIVAL, ,B
I 5 %
I 0 %
5 %
0%
-5%
FIG. 1. The effect of quick development on the population growth of the Califorma
condor. The solid and dashed lines are constant percentage change isoplcths as functions of
/3 and p. The basic life history (with earliest reproduction at age 5) results in the solid
isopleths. The dotted lines show the effect of quick development with earliest reproduction
at age 4. (a) Mertz’s result with p compressed from 5 to 4 years; (b) the result when /3 ia
not compressed. j’3, is the first year mortality for both the basic life hIstory and quick
development. (a) is from Mertz [27].

DECLINING POPULATIONS
(b)
% CHANGE PER YEAR 1.0
I 0 %
0 % 4 0.8
$ -10%
5 -20 %
$ 0.6
5 3 2 0.4
d
2 z 0.2 a
0 0.2 0.4 0.6 0.8 1.0
FIRST YEAR SURVIVAL, 6,
FIG. 1. Continued
221
of the red-footed booby (Sulu sulu). If the resulting life table entries are substituted into Equation (l), the result is
x’_p2x’-2 y’-().
This equation can then be used to make a new figure corresponding to Mertz’s Figure 2 [see Figure l(b)]. B ecause the time frame of p in Mertz’s figure is in question, & is used for the scale on the x-axis in Figure l(b). There is no simple scale translation that will allow Figure l(a) and (b) to be superimposed in a meaningful way. In Figure l(a), when 7 = 5 (the solid lines), p is in units of proportion of young surviving to age 5. When r = 4 (the dashed lines), p is in units of proportion of young surviving to age 4. In Figure l(b), & is always in units of proportion of young surviving to age 1. When the time frame is fixed as in p, in Equation (2h) and Figure l(b), it is seen that earlier development, in the absence of a corresponding acceleration of immature mortality rates, makes the rate of population growth more positive even when the population is declining. Thus, we see that Mertz’s claims are correct only when “earlier reproduction” is coupled with earlier immature mortality. Earlier reproduction may sometimes contain an element of earlier immature mortality.

222 C. G. HOOGENDYK AND G. F. ESTABROOK
Nichols et al. [30] used Mertz’s approach to examine management implica-
tions for the Everglade kite. They reformulated B as we did and got results
similar to Figure l(b). In spite of this, they accepted Mertz’s results and used
them in saying that inferences drawn concerning populations with high
fecundity may not apply to populations with low growth rates. They explained
the difference in formulation of their prereproductive mortality by saying,
Lewontin [23] and Mertz [27, 281 have considered a development time which is indcpcndcnt
of prereproductive mortality, for the purpose of isolating specific effects of these factors.
We find it difficult to envisage that a change in the age of sexual maturity could occur
independently of changes in prereproductive mortality, and we have thus combined both
effects in our consideration of development-time.
But prereproductive mortality occurs over a specific span of time-the
development time. In Mertz’s formulation, when development time is changed,
prereproductive mortality occurs over the new span of time and the mortality
rate is changed. In terms of the life table functions I, and nz_, , the treatment
of Nichols et al. is independent and that of Mertz is dependent, In the
independent treatment, the question of how a change in development time
affects mortality rates is then left to be treated in an explicit fashion.
Goodman [15] explained that what Mertz had done was simply to distort
the time scale of the life history so that regardless of whether the population
were increasing or declining it would do so faster. However, Mertz’s result
has also been cited by Wiley [40] as a special case showing that “in
decreasing populations deferred reproduction does not necessarily reduce r,
. even though other life-history parameters remain unchanged.” Of course,
other life history parameters have changed. Although Mertz’s result is not
incorrect if Goodman’s [15] explanation is used, it has often been misunder-
stood. Many published references to Mertz [27] resemble Wiley [40] as
quoted but with the word “necessarily” left out [2, 4, 5. 10,
13, 16, 19, 20, 27, 28, 34, 39, 411.
3. EXAMPLE II
It has been common to avoid mathematical difficulty by lumping I, and
m \ together into a single variable u, ( = I, m, ). There is nothing wrong with
this by itself; however, results are then often presented in terms of the timing
of reproduction without reporting the fact that mortality rates are also being
changed. When reproduction is moved to an earlier age, the mortality rates
are increased so that u, has the same value at that earlier age. Lewontin [23]
used this formulation and then referred to the changes he made in the u,
curve as “reducing development time” and “decreasing the age to sexual
maturity.” Although in the beginning of the paper he did mention the
incorporation of mortality rates, this was not stressed in the later discussion.
If this approach were naively applied to declining populations, it would be

DECLINING POPULATIONS 223
tempting to reach the erroneous conclusion that “reducing development time” causes the population to decline more rapidly. MacArthur and Wilson [25] used Lewontin’s model without reiterating that “changing the age to sexual maturity” involved a quantitative change in fecundity or a shift in mortality rates to maintain a constant R,. Green and Painter [17] also used v, and referred to a shift in v, as changing “development time.” Costello and Taylor [9] used a similar formulation. They concluded that “increasing the age at first reproduction yields diminishing returns in reduction of r as r
comes close to 0,” and when r = 0, “the age at first reproduction matters not.” This conclusion is correct only when the interdependence of the variables is made explicit. In order for their “family size” (R,) to remain constant when reproduction is delayed, mortality rates must be decreased or fecundity increased. The net maternity function, v,, accomplishes this by lumping survival and fecundity together and then shifting them as a unit. This approach applied to declining populations would give the same conclu- sions as Mertz [27, 281.
Some authors have maintained I, and 171, as separate variables in their analyses [6, 11, 211. By doing so, they have kept mortality assumptions explicit.
4. EXAMPLE III
A similar situation arises in MacArthur and Wilson’s discussion [25, p. 881 of the equation
where M is the mean age at reproduction. They made the following state- ment:
Even this oversimplified formula lets us clear up one common misconception. It confirms
that when R, is large, reducing M is the easiest way to increase r. as Lewontin’s models
indicated. However, when R, is near 1, a reduction in mean age at reproduction will
increase r only to an insignificant extent.
Although they did not mention declining populations (R, < l), their reason- ing might suggest the conclusion that in declining populations “a reduction in mean age at reproduction” would cause the population to decline more rapidly. The validity of this claim depends on the relationships between
r, R,, M, and the life table. Their implicit assumption that R, remains constant requires that the mortality rates be increased as the fecundity is shifted to earlier ages. This is not simply “a reduction in the mean age at reproduction.” If only the fecundity were shifted, then R, would increase as M decreases. The overall effect would be that as reproduction is moved to

224 C. G. HOOGENDYK AND <;. F. ESTABROOK
earlier ages, r becomes more positive even in cases where r is zero or
negative. This conclusion (which is actually correct) seems to be their
unstated “common misconception.”
5. EXAMPLE IV
Stenseth [37] and Pianka and Parker [32] also exemplify the interdepen-
dence of variables in their analysis of an organism’s choice between current
and future reproduction. Their analysis begins with Fisher’s [12. p. 271
equation for the reproductive value of an individual at age x:
where w is the age at last reproduction. The reproductive value is then
partitioned into two parts:
where m, represents present progeny and OF IS the “residual reproductive
value” defined by
Equation (5) is rearranged to give
v* = e’v, - e’m, , \ (7)
which is then used in a graphical analysis to determine the optimal allocation
of reproductive effort between current and future progeny as shown in Figure
2. Using empirical or hypothetical data, the relationship between nz, and 11:
is determined for an individual at a particular age. This relationship is given
by the solid line. Any solution representing a choice of m , and a resulting OF
must fall on this line. The object is to choose the value of nz, that results in
the maximum value for 0:. Equation (7) gives a relationship for nr , , ~1,. and
u:, but it requires a value for r. Stenseth [37] determines the value of r for a
given population and enters it into Equation (7) fixing the slope of the
dashed line in Figure 2. The dashed line is then moved perpendicularly (so
that the slope is unchanged) until it just touches the solid line. The point of
contact is the solution for m, that maximizes II,, because the dashed line
going through that point has the largest intercept value of any line with the
same slope that touches the solid curve. If the solid curve were represented by
an equation, an alternative method for finding the maximum 11, would be to
use partial derivatives.

DECLINING POPULATIONS 225
PRESENT PROGENY, mX
FIG. 2. Expectation of future reproductive success, or residual reproductive value. is
plotted against current reproductive output for a hypothetical case. The solid line represents
the assumption that as an individual’s current reproductive effort increases, the cxpcnditure
of resources reduces its expectation of future reproductive success. The dashed lines
represent families of parallel lines from Equation (7). where a value of r determines the
slope of the family of lines and a value of tiV determines the intercept for particular line.
The dot represents the combination of m, and tl: which gives the maximum value for I’, as
determined by the family of lines for r = 0.231. The triangle is a similar combination for
r = ~ 0.273. Modified from Stenseth [37].
The graphic analysis in Figure 2 can be done for any given value of r and led Stenseth to the conclusion that “allocating relatively more resources to current reproduction is the optimal strategy in a growing population.” The same analysis would lead to the conclusion that in a declining population reproductive effort should be saved for future progeny. This is similar to the examples described previously. To reach Stenseth’s conclusion, changes in age dependent survivorship and fecundity must be considered. The values for r are based on and derived from an assumed constant life history. When a change is made in allocation to current versus future offspring, the life history changes and r changes. Indeed, if r did not change, there could be no

226 C. Cr. HOOGENDYK AND Cr. F. ESTABROOK
long term selective advantage to changing one’s life history (assuming of
course that such a change is passed on to one’s progeny).
Pianka and Parker [32] presented a slightly different version of the same
model. They chose to discuss only populations in which r = 0. Since r = 0,
e r = 1 and drops out of all their equations. In fact, they never give a version
of the equations with r included and only mention in passing that for a
population changing in size (i.e. r + 0) the equation is slightly more com-
plicated. Because r was eliminated only in appearance by the requirement
that it be 0, the formulation of their model is the same as Stenseth’s and is
subject to the same limitations.
6. EXAMPLE V
Bell [l] analyzed the effect of age at maturity on the rate of increase of a
population. The simplified case that he discussed at the bottom of p. 69 is for
a population with the life history shown in Table 2. The values from the life
table are substituted into Equation (1) to arrive at
which is simplified to
and rearranged to
e ru - ce rto-1) _&I ‘h = 0,
TABLE 2
A Simple Iteroparous Life Table”
(8)
(9)
(IO)
“Made up from the example
used by Bell [l, p. 691.

DECLINING POPULATIONS 227
In Equation (8) Bell had the summation terminate at age w, but the simplification to Equation (9) assumes w + cc. This is an important point, and a later section of this paper will deal with finite versus infinite summa- tions. Implicit differentiation of Equation (10) yields
de’ sbcUpl lnc -= da er(‘-‘)[a-c(a-l)ep’].
(11)
The numerator of this equation must be negative, since c < 1. If the deriva- tive is to be positive, that is, if an increase in the age at maturation is to have a positive effect on the rate of increase of the population, then the denomina- tor must also be negative. For that to be the case c( a - l)e-r must be greater than a. Rearranging, e’ ( = h) must be less than c( a - 1)/a. From this, Bell concludes that “a heritable tendency for delayed maturity may be selected.. . if the population is decreasing in numbers rather rapidly.” What must be noted is that for this example, even if there is no reproduction, the
population cannot decline faster than the death rate. After the first year, if there is no reproduction, s is no longer important and the population will decline at a rate e’ = X = c. This can be seen intuitively or it can be derived from Equation (10) by setting b = 0. The condition for the derivative de’/da
to be positive is thus impossible in the context of this model. In the context of this model a correct conclusion is that a decrease in the age at first reproduction will always cause a positive change in X.
Demetrius [ll, p. 1341 derived a similar but more detailed inequality using the Leslie matrix formulation. His inequality is
ax ax ~>7q, i<j, for X>P=max(P,), (12)
where F; is the fecundity at age i and P, is the probability that an individual age i will survive to age i + 1. This shows that a given increase in fecundity will have a greater positive effect on the growth rate if it occurs at an earlier age. The result applies to increasing or stable populations and to declining populations in which X > P. It leaves other cases where X < P unresolved. Caswell [6] gives a slightly stronger proof that applies if and only if X > P,. Both Demetrius and Caswell were working with a formulation that allows the P, to vary with age and that does not assume an infinite life span. This is different from Bell’s model, and under these circumstances X can be less than a particular P, Infinite life span will be discussed in more detail below.
7. EXAMPLE VI
Mertz [28] examines the consequences of various changes in life history. Among the equations used are Equation (1) in this paper, an extended

228 C. G. HOOGENDYK AND G. F. ESTABROOK
version of Equation (3) in this paper, and g, = em”/, m,. the “probability
density function for the age of reproducing females in an infinite stable
population.” According to Mertz [28], these three equations
show that a lengthening of dcvclopment lowers r for growing population&. product.\ no
elfect for r = 0. and actually increases r (makes it Ica strongly negative) for decreasing
populationa. In other words, a lcngthrning of development, which ih ordinarily opposed b!
selection, may be favored in declining populations lnahrnuch ah It slows the rate of
population decline.
Although the reason for these conclusions is not stated, they seem to be
based on the division by M in Equation (3) and on the appearance of e ” in
the other two equations. The interpretation of Equation (3) has already been
discussed in Example III above. The interpretation of e ” was mentioned in
the introduction and should be clear from other discussions throughout this
paper.
The reader of Mertz [28] could easily believe that the spacing of births will
be dealt with independently from death rates. However, Mertz concludes that
a change in prereproductive period in itself has no effect on R,,. For this ia to
be true, there must be a corresponding change in mortality or the magnitude
of the fecundity must change. The quotation above is valid only in very
limited conditions of complete interdependence of fecundity and mortality
that should be made explicit in each case. Nonetheless, it has been used to
explain or support results in both theoretical and applied studies by a
number of other authors [2, 4, 5, 7, 8, 10. 13, 14, 19, 20, 29. 411. It has also
appeared m reviews by Stearns [35, 361, and similar statements have been
made independently by Laughlin [22] and Hamilton [1X].
The factor emr’ appears in many of the standard demographic equations.
The analogy between it and discount rates has caused repeated difficulties in
interpretation. These difficulties have occurred most often in dealing with
reproductive values and are exemplified by Laughlin [22]:
in a dccrcasing population the older mothers actualI> make the most important contribu-
tion to reproduction.
Hamilton [18]:
For an organism which reproducea repeatedly the concept of fitnab is not so casil? dcfincd.
The expectation of offspring suffers from the obyxtion that early births arc \\orth mow
than late in an increasing population, and ww W’YW in a decreasing one..
and Hirshfield and Tinkle [19]:
In a declining population, offspring produced late in a female’s life would contrihutc more
to her fitness
(cited Mertz [28] and Hamilton [18]). These three quotations are all in
reference to reproductive value as a measure of fitness (cf. [12. p. 271).
However, the reproductive value is derived ussuming constmt life hisfoq~
DECLINING POPULATIONS 229
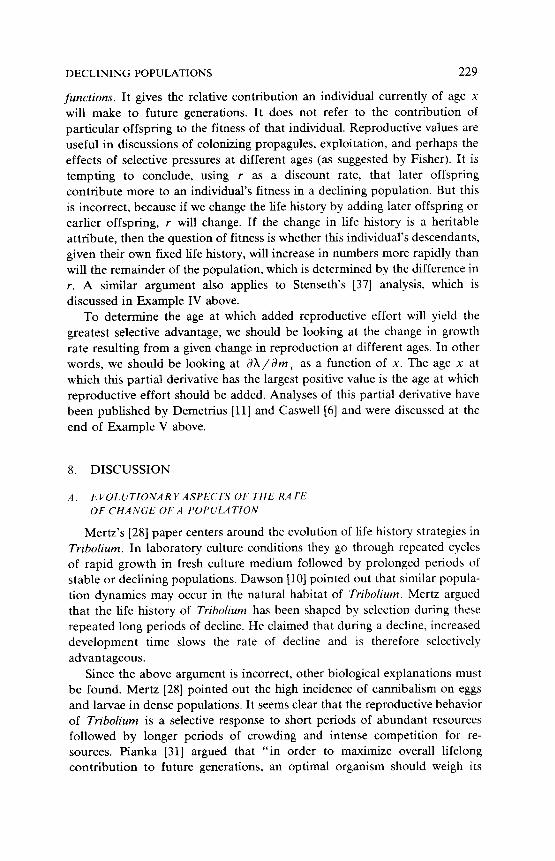
functions. It gives the relative contribution an individual currently of age x will make to future generations. It does not refer to the contribution of particular offspring to the fitness of that individual. Reproductive values are useful in discussions of colonizing propagules, exploitation, and perhaps the effects of selective pressures at different ages (as suggested by Fisher). It is tempting to conclude, using r as a discount rate, that later offspring contribute more to an individual’s fitness in a declining population. But this is incorrect, because if we change the life history by adding later offspring or earlier offspring, r will change. If the change in life history is a heritable attribute, then the question of fitness is whether this individual’s descendants, given their own fixed life history, will increase in numbers more rapidly than will the remainder of the population, which is determined by the difference in r. A similar argument also applies to Stenseth’s [37] analysis, which is discussed in Example IV above.
To determine the age at which added reproductive effort will yield the greatest selective advantage, we should be looking at the change in growth rate resulting from a given change in reproduction at different ages. In other words, we should be looking at ax/am, as a function of x. The age x at which this partial derivative has the largest positive value is the age at which reproductive effort should be added. Analyses of this partial derivative have been published by Demetrius [ll] and Caswell [6] and were discussed at the end of Example V above.
8. DISCUSSION
A. EVOLUTIONARY ASPECTS OF THE RATE
OF CHANGE OF A POPULATION
Mertz’s [28] paper centers around the evolution of life history strategies in Triholium. In laboratory culture conditions they go through repeated cycles of rapid growth in fresh culture medium followed by prolonged periods of stable or declining populations. Dawson [lo] pointed out that similar popula- tion dynamics may occur in the natural habitat of Triholium. Mertz argued that the life history of Triholium has been shaped by selection during these repeated long periods of decline. He claimed that during a decline, increased development time slows the rate of decline and is therefore selectively advantageous.
Since the above argument is incorrect, other biological explanations must be found. Mertz [28] pointed out the high incidence of cannibalism on eggs and larvae in dense populations. It seems clear that the reproductive behavior of Triholium is a selective response to short periods of abundant resources followed by longer periods of crowding and intense competition for re- sources. Pianka [31] argued that “in order to maximize overall lifelong contribution to future generations, an optimal organism should weigh its

230 C. Cr. HOOGENDYK AND G. F. ESTABROOK
immediate prospects of reproductive success against its long-term future
prospects.” (Pianka cited Williams [38] and Pianka and Parker [32].) In this
light, when the population is crowded and the rate of cannibalism on eggs
and larvae is high, it is advantageous to an individual beetle to delay
reproduction and put its resources into its own survival. Then, at some future
point when the competition has died down or the individual has emigrated, it
can reproduce with a higher likelihood of success. The declining population
does not lead to delayed reproduction; rather the reverse is true. Cannibalism
and delayed reproduction in response to overcrowding cause a population
decline.
The above argument can be applied to I and K selection in general. An
organism’s evolutionary objective is to obtain resources and convert them
into offspring. If there is an abundance of resources available, emphasis can
be put into reproduction and the result will be an increasing population. If
there is heavy competition for resources, then emphasis must be put on
obtaining resources and it is likely that a stable or declining population will
result. Thus, the rate of change of a population is not a cause of reproductive
strategies but rather an effect of reproductive strategies that arise from
conditions of resource availability or competition.
R. FI,vITI: VERSUS INFINITE SUMMATIONS
The usual demographic analysis is based on the assumption of constant
life history functions and the consequent stable age distribution that arises
under the operation of those functions. For rapidly increasing populations.
the stable age distribution is skewed so that the younger individuals form the
largest proportion of the population [see Figure 3(a)]. As individuals become
older, the age groups to which they belong become less important. Under
these circumstances the distinction between finite and infinite series in the
mathematical summations (e.g. w = 50 versus a in Bell [l]) is of little
importance. The truncated end of the series [on the right in Figure 3(a)] will
form a minute fraction of the population being considered. However, for
rapidly declining populations, the older age groups can form the most
important part of the population [see Figure 3(b)]. The stable age distribution
is given by
f = 0
For the simplest case where I, = P‘, the numerator of Equation (13) can be
rearranged to show that
P ’ c - ,
i 1 x . (14)
If P/X is greater than 1, i.e. if X < P, then c’, will increase as s increases.

DECLINING POPULATIONS 231
A
AGE
I I
MODE
I
I
B
AGE
FIG. 3. (a) General form of the stable age distribution for an increasing population. (b)
A truncated age distribution (not stable) for a rapidly declining population. In a stable age
distribution, the mode would have moved to the right and been truncated. The result would
be a mirror image of the distribution for the increasing population.
We noted above (in reference to [l]) that a population with infinite age (no senescence) and a constant death rate (I, = P" for x = 0 to 00) cannot decline at a rate faster than its death rate (i.e. A cannot be less than P). However, if the population has a finite maximum age, w, at which I, = 0, then the geometric rate of increase, A, can be less than P. Under such conditions, the older age groups make up a larger portion of the population [see Figure 3(b)], and the oldest age group is dying off entirely at each time interval. Thus, when X is small, the choice between finite and infinite series is no longer simply a question of mathematical nicety. The tails (older age groups) of the summations are no longer negligible portions of the overall population. The choice must therefore be made with careful attention to the biology of the organism that is being studied.

232 C. C;. HOOGENDYK AND G. F. ESTABROOK
A related point is that as X approaches P, the likelihood that the
population will approach a stable age distribution in a reasonable length of
time becomes much smaller. When the series of age groups is very long or
infinite, the mode of the age distribution would move continuously to older
age groups as the population declines [see Figure 3(b)]. A declining popula-
tion of Triholium, for example, is unlikely to approach the stable age
distribution determined by the modified life history functions that exist
during the population decline.
C. CASES IN WHICII SELECTION MA Y FA VOR DELA YED REPRODti~‘TlON
In some of the cases referred to in this paper, particularly those dealing
with infinite series and age independent death rates (no senescence), it is
clear that earlier reproduction will always cause the rate of increase to
become more positive. However, in dealing with finite series and with age
dependent death rates, it is a different matter. Clearly, there is not a
symmetry about r = 0 as claimed by many of the authors cited in this paper.
Demetrius [ll, p. 1341 and Caswell [6] proved that the point of change is
where X = P, (see Example V above). For example, in the simple life table
shown in Table 3, the following cases are instructive:
(a) Let P = 0.9 and m =l. Then X = 0.9. If m is now moved to age group
3, X is still 0.9. This is the turnover point at which h = P and the timing of
reproduction does not affect X.
(b) Now, let P = 0.9 and m = 0.8. In this case, X = 0.851 and is less than
P. If m is moved to age group 3, X changes to 0.835. This result indicates
that when X is less than P, earlier reproduction will accelerate the rate of
decline.
TABLE 3
A Simple Life Table
DECLINING POPULATIONS 233
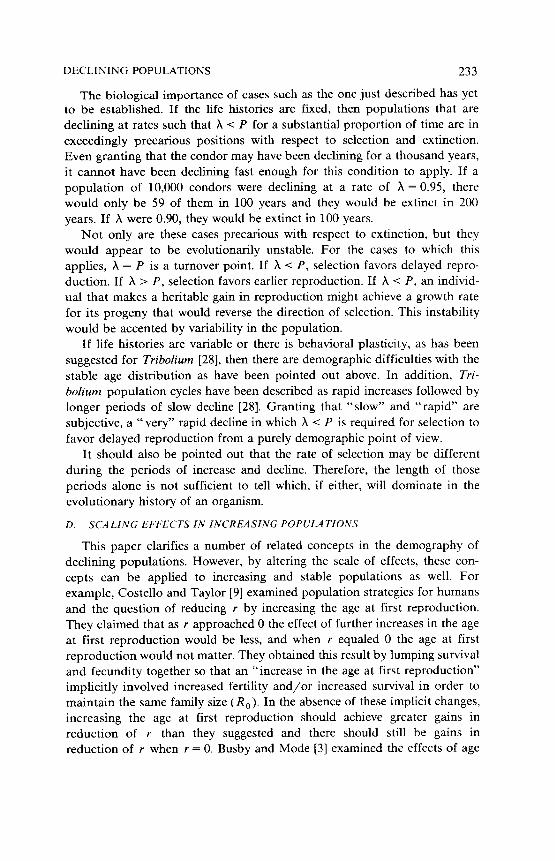
The biological importance of cases such as the one just described has yet to be established. If the life histories are fixed, then populations that are declining at rates such that X < P for a substantial proportion of time are in exceedingly precarious positions with respect to selection and extinction. Even granting that the condor may have been declining for a thousand years, it cannot have been declining fast enough for this condition to apply. If a population of 10,000 condors were declining at a rate of X = 0.95, there would only be 59 of them in 100 years and they would be extinct in 200 years. If X were 0.90, they would be extinct in 100 years.
Not only are these cases precarious with respect to extinction, but they would appear to be evolutionarily unstable. For the cases to which this applies, X = P is a turnover point. If X < P, selection favors delayed repro- duction. If X > P, selection favors earlier reproduction. If X < P, an individ- ual that makes a heritable gain in reproduction might achieve a growth rate for its progeny that would reverse the direction of selection. This instability would be accented by variability in the population.
If life histories are variable or there is behavioral plasticity, as has been suggested for Tribolium [28], then there are demographic difficulties with the stable age distribution as have been pointed out above. In addition, Tri-
bolium population cycles have been described as rapid increases followed by longer periods of slow decline [28]. Granting that “slow” and “rapid” are subjective, a “very” rapid decline in which X < P is required for selection to favor delayed reproduction from a purely demographic point of view.
It should also be pointed out that the rate of selection may be different during the periods of increase and decline. Therefore, the length of those periods alone is not sufficient to tell which, if either, will dominate in the evolutionary history of an organism.
D. SCALING EFFECTS IN INCREASING POPULATIONS
This paper clarifies a number of related concepts in the demography of declining populations. However, by altering the scale of effects, these con- cepts can be applied to increasing and stable populations as well. For example, Costello and Taylor [9] examined population strategies for humans and the question of reducing r by increasing the age at first reproduction. They claimed that as r approached 0 the effect of further increases in the age at first reproduction would be less, and when r equaled 0 the age at first reproduction would not matter. They obtained this result by lumping survival and fecundity together so that an “increase in the age at first reproduction” implicitly involved increased fertility and/or increased survival in order to maintain the same family size (R,). In the absence of these implicit changes, increasing the age at first reproduction should achieve greater gains in reduction of r than they suggested and there should still be gains in reduction of r when r = 0. Busby and Mode [3] examined the effects of age

234 C. CT. HOOGENDYK AND G. F. ESTABROOK
of marriage for human populations and showed a numerical example in which a declining population declined more rapidly when reproduction was delayed. This is particularly important and has implications for government policies since human populations have the flexibility of choice and can affect age at first reproduction without altering the biology of development up to reproductive age.
William D. Hamilton and Richurd D. Alexander provided valuable advice
and support. In addition, the following people read various drafts of this paper
and supplied useful comments and suggestions.. Bobhi S. Low, Alvin L. Jensen.
Gary E. Belovsky, Steven R. Beissinger, Margaret R. Halbeisen, Baq!
Chernoff, Godfrey R. Bourne, H. Lisle Gibbs, Stephen Dodge, and C. J. Mode.
REFERENCES
1
2
3
4
5
6
7
x
Y
10
11
12
13
14
15
16
17
Cr. Bell, On breeding more than once, ilnwr. Nc~rur. 110:57-77 (1976).
J. F. Bayer. Reproductive compensation in Trrho//un~ w,sfw~~wn~. Ew/rrtro,r 32:5 I Y
(1978).
R. C. Busby and C. J. Mode, Theory and applications of a computatlonally efficient
cohort simulation model of human reproduction. Myth. Rww. 64:45-74 (19X3).
T. V. Callaghan. Growth and population dynamics of Curer hrgelowrf in an alpine
environment, OrXos 27:402-413 (1976).
T. V. Callaghan and N. J. Collins. Strategies of growth and population dynamics of
tundra plants, 0lko.y 27:3X3-3xX (1976).
H. Caswell. A general formula for the sensitivity of population growth rate to changcb
in life history parameters. Theorer. Po~ulcrnor~ Rio/. 14:215-230 (1 Y7X).
H. Caswell and A. Hastings. Fecundity, development time. and population growth
rate: An analytical solution. Theowt. Popu/utro~~ Rd. 17:71-7Y (IYXO).
H. Caawcll and I’. A. Werner. Transient behavior and life histor) anulcsi\ of teasel
( D/p.vucu,_ .s&wu Huds.). C&g,~ 59 :53-66 (1 Y7X).
W. G. Costello and H. M. Taylor. Deterministic population growth models. Anlcr.
Muth. M0!Zfh!l. 78:841-X55 (1971).
P. S. Dawaon, Life history strategy and evolutionary history of Tr,holr~rnl flour bcctlc.\.
Ewlrrtror~ 31 :226-229 (1977).
L. Demetrius, The sensitiwty of population growth rate to perturbations in rhc life
cycle components, Moth. bow. 4:12Y-136 (1969).
R. A. Fisher. The Grmt~ul Theon~ of Natural Srlectrot~. Oxford U.P.. 1930.
N. R. French. B. G. Maza, H. 0. Hill. A. P. Aachwandcn. and H. W. Katz, A
population study of irradiated desert rodents. I:‘w/. Mor~qr. 44:45-72 (1974).
J. T. Giesel. Fitness and polymorphisms for net fecundity distribution in itcroparow
populations. .4nter. .Yurur. 10X3321-331 (1974)
D. Goodman. Natural selection and a cost wiling on reproductive effort. 4,wr. A’utur. 10X:247-268 (1974).
R. F. Green. A note on K-selection. Anw. Nu~w. 116:2Yl-2Y6 (1YXO).
R. Green and P. R. Painter. Selection for fertility and development time. rlwr~. \‘rrrw
109:l~lo (1975).

DECLINING POPULATIONS 235
18 W. D. Hamilton, The moulding of senescence by natural selection, J. Theoref. Bio/.
12:12-45 (1966).
19 M. F. Hirschfield and D. W. Tinkle, Natural selection and the evolution of reproduc-
tive effort, Proc. Nat. Acad. Sci. U.S.A. 7212227-2231 (1975).
20 R. D. Howard, Estimating reproductive success in natural populations, Amer. Nufur.
114:221-231 (1979).
21 N. Keyfitz, Linkages of intrinsic to age-specific rates. J. Amer. Stumt. Assoc.
66:275-281 (1971).
22 R. Laughlin, Capacity for increase: A useful population statistic, J. Anim. Em/.
34~11-91 (1965).
23 R. C. Lewontin, Selection for colonizing ability, in The Genetics of Colonizing Species
(H. G. Baker and G. L. Stebbins. Eds.), Academic, New York, 1965, pp. 77-94.
24 A. J. Lotka, Elemenrs of Ph,vsmd Biology, Williams and Wilkins. 1925.
25 R. H. MacArthur and E. 0. Wilson, The Theo? of Islund Biogeography, Princeton
U.P.. 1967.
26 D. B. Mertz, Notes on methods used in life-history studies, in Readings rn Ecology md
Ecologiud Generics (J. H. Connell, D. B. Mertz, and W. W. Murdoch, Eds.). Harper
and Row. New York, 1970, pp. 4-17.
27 D. B. Mertz, The mathematical demography of the California condor population,
Amer. Natur. 105:437-453 (1971).
28 D. B. Mertz. Life history phenomena in increasing and decreasing populations. in
Statisrical Ecology, Vol. 2 (G. P. Patil, E. C. Pielou and W. E. Waters, Eds.).
Pennsylvania State U.P., 1971. pp. 361-399.
29 D. B. Mertz, Senescent decline in flour beetle strains selected for early adult fitness,
Ph_vsiol. Zool. 48:1-23 (1975).
30 J. D. Nichols, G. L. Hensler, and P. W. Sykes, Jr.. Demography of the Everglade kite:
Implications for population management, Gal. Model. 9:2155232 (1980).
31 E. R. Pianka, Natural selection of optima1 reproductive tactics, Amer. Zoo/. 16:775-7X4
(1976).
32 E. R. Pianka and W. S. Parker, Age-specific reproductive tactics, Amer. N&w.
109:453-464 (1975).
33 R. E. Ricklefs. Ecology, 2nd ed., Chiron, 1979.
34 J. J. Sohn, Socially induced inhibition of genetically determined maturation in the
platyfish, Xiphophorus murulutur, Science 195:199-201 (1977).
35 S. C. Steams, Life-history tactics: A review of the ideas, Quart. Rev. BIO/. 51:3-47
(1976).
36 S. C. Stearns, The evolution of life history traits: A critique of the theory and a review
of the data, Annunl Reu. Ecol. Sjst. X:145-171 (1977).
37 N. C. Stenseth, Demographic strategies in fluctuating populations of small rodents,
Oecologiu 33:149-172 (1978).
38 G. C. Williams. Adopt&on and Natuml Selection. Princeton U.P., 1966.
39 D. R. Strong, Jr. and M. D. Wang, Evolution of insect life histories and host plant
chemistry: Hispine beetles on Heliconia, Evolution 31:854-862 (1977).
40 R. H. Wiley, Effects of delayed reproduction on survival, fecundity, and the rate of
population increase, Amer. Nutur. 108:705-709 (1974).
41 J. R. Ziegler, Evolution of the migration response: Emigration by Triholium and the
influence of age, Euolufion 30:579-592 (1976).