Embed Size (px)
Citation preview
Marquette University Marquette University
e-Publications@Marquette e-Publications@Marquette
Biological Sciences Faculty Research and Publications Biological Sciences, Department of
1-2013
The Conservation Status of the World’s Reptiles The Conservation Status of the World’s Reptiles
Tony Gamble
Follow this and additional works at: https://epublications.marquette.edu/bio_fac
Part of the Biology Commons
Marquette University
e-Publications@Marquette
Biological Sciences Faculty Research and Publications/College of Arts and Sciences
This paper is NOT THE PUBLISHED VERSION; but the author’s final, peer-reviewed manuscript. The published version may be accessed by following the link in the citation below.
Biological Conservation, Vol. 157, (January 2013): 372-385. DOI. This article is © Elsevier and permission has been granted for this version to appear in e-Publications@Marquette. Elsevier does not grant permission for this article to be further copied/distributed or hosted elsewhere without the express permission from Elsevier.
The Conservation Status of the World’s Reptiles
Monika Böhm Institute of Zoology, Zoological Society of London, Regent’s Park, London NW1 4RY, UK Ben Collen Institute of Zoology, Zoological Society of London, Regent’s Park, London NW1 4RY, UK Jonathan E.M. Baillie Conservation Programmes, Zoological Society of London, Regent’s Park, London NW1 4RY, UK Philip Bowles IUCN – CI Biodiversity Assessment Unit, Conservation International, 2011 Crystal Drive Ste 500, Arlington, VA Janice Chanson Species Programme, IUCN, Rue Mauverney 28, 1196 Gland, Switzerland IUCN – CI Biodiversity Assessment Unit, c/o 130 Weatherall Road, Cheltenham 3192, Vic., Australia Neil Cox IUCN – CI Biodiversity Assessment Unit, Conservation International, 2011 Crystal Drive Ste 500, Arlington, VA Species Programme, IUCN, Rue Mauverney 28, 1196 Gland, Switzerland
Geoffrey Hammerson NatureServe, 746 Middlepoint Road, Port Townsend, WA Michael Hoffmann IUCN SSC Species Survival Commission, c/o United Nations Environment Programme World Conservation Monitoring Centre, 219 Huntingdon Road, Cambridge CB3 0DL, UK Suzanne R. Livingstone Ecology and Evolutionary Biology, Faculty of Biomedical & Life Sciences, Graham Kerr Building, University of Glasgow, Glasgow, Scotland G12 8QQ, UK Mala Ram Institute of Zoology, Zoological Society of London, Regent’s Park, London NW1 4RY, UK Anders G.J. Rhodini Chelonian Research Foundation, 168 Goodrich St., Lunenburg, MA Simon N. Stuart IUCN Species Survival Commission, Rue Mauverney 28, 1196 Gland, Switzerland United Nations Environment Programme World Conservation Monitoring Centre, 219 Huntington Road, Cambridge CB3 0DL, UK Conservation International, 2011 Crystal Drive Ste 500, Arlington, VA 22202, USA Department of Biology and Biochemistry, University of Bath, Bath BA2 7AY, UK Al Ain Wildlife Park and Resort, PO Box 45553, Abu Dhabi, United Arab Emirates Peter Paul van Dijk Conservation International, 2011 Crystal Drive Ste 500, Arlington, VA Bruce E. Young NatureServe, 4600 N. Fairfax Dr., 7th Floor, Arlington, VA Leticia E. Afuang Institute of Biological Sciences, University of the Philippines, Los Banos, College, Laguna 4031, Philippines Aram Aghasyan Protected Areas Management Department, Bioresources Management Agency of Ministry of Nature Protection, Yerevan, Armenia Andrés García Estación de Biología Chamela, Instituto de Biología, U.N.A.M., Apdo. Postal 21, San Patricio, Jalisco 48980, Mexico César Aguilar Departamento de Herpetología, Museo de Historia Natural, Universidad Nacional Mayor de San Marcos, Peru Rastko Ajtic Institute for Nature Conservation of Serbia, dr Ivana Ribara 91, 11070 Belgrade, Serbia Ferdi Akarsu Doğa Derneği (Nature Association), Hürriyet cad. 43/12 Dikmen, Ankara, Turkey Laura R.V. Alencar
Departamento de Ecologia, Instituto de Biociencias, Universidade de São Paulo, 05508-090 São Paulo, SP, Brazil Allen Allison Bishop Museum, 1525 Bernice Street, Honolulu, HI Natalia Ananjeva Zoological Institute, Russian Academy of Sciences, St. Petersburg 199034, Universitetskaya nab. 1, Russia Steve Anderson University of the Pacific, 3601 Pacific Avenue, Stockton, California Claes Andrén Nordens Ark, Åby säteri, SE-456 93 Hunnebostrand, Sweden Daniel Ariano-Sánchez Organización Zootropic, General Projects, Edificio Geminis 10, Guatemala 1001, Guatemala Juan Camilo Arredondo Museu de Zoologia, Universidade de São Paulo, Caixa Postal 42494, São Paulo 04218-170, Brazil Mark Auliya Helmholtz Centre for Environmental Research - UFZ, Department of Conservation Biology, Permoserstrasse 15, 04318 Leipzig, Germany Christopher C. Austin Department of Biological Sciences, Museum of Natural Science, Louisiana State University, Baton Rouge, LA Aziz Avci Adnan Menderes University, Faculty of Science and Arts, Department of Biology, Aydın, Turkey Patrick J. Baker Texas A & M University System, AgriLIFE Research, Blackland Research and Extension Center, Temple, TX The Wetlands Institute, Stone Harbor, NJ André F. Barreto-Lima Universidade Federal do Rio Grande do Sul – Instituto de Biociências, Avenida Bento Gonçalves 9500, Agronomia, 91-540-000 Porto Alegre-RS, Brazil César L. Barrio-Amorós Fundación Andígena, PO Box 210, Mérida 5101-A, Mérida, Venezuela Dhruvayothi Basu The Katerniaghat Foundation, C-421 Sector-B, Mahanagar, Lucknow 226 006, India Michael F. Bates Department of Herpetology, National Museum, PO Box 266, Bloemfontein 9300, South Africa Alexandre Batistella Department of the Environment – Mato Grosso, Brazil Aaron Bauer Department of Biology, Villanova University, 800 Lancaster Avenue, Villanova, PA Daniel Bennett
Mampam Conservation, Glossop, UK Wolfgang Böhme Zoologisches Forschungsmuseum Alexander Koenig (ZFMK), Adenauerallee 160, 53113 Bonn, Germany Don Broadley Department of Herpetology, Natural History Museum of Zimbabwe, P.O. Box 240, Bulawayo, Zimbabwe Rafe Brown University of Kansas Natural History Museum and Biodiversity Institute, Department of Ecology and Evolutionary Biology, University of Kansas, Lawrence, KS Joseph Burgess Guana Tolomato Matanzas National Estuarine Research Reserve, Ponte Vedra, FL Ashok Captain 3/1 Boat Club Road, Pune 411 001, Maharashtra, India Santiago Carreira Laboratorio de Sistemática de Vertebrados e Historia Natural, Instituto de Ecología y Ciencias Ambientales, Facultad de Ciencias (UDELAR) and Museo Nacional de Historia Natural, Montevideo, Uruguay Maria del Rosario Castañeda Museum of Comparative Zoology, Harvard University, Cambridge, MA Fernando Castro Departamento de Biología, Universidad del Valle, Cali, Colombia Alessandro Catenazzi University of California, Berkeley, CA José R. Cedeño-Vázquez Instituto Tecnológico de Chetumal, Av. Insurgentes No. 330, C.P. 77013, Col. David Gustavo Gtz., Chetumal, Quintana Roo, Mexico David G. Chapple School of Biological Sciences, Monash University, Clayton, Vic. 3800, Australia Allan Wilson Centre for Molecular Ecology & Evolution, School of Biological Sciences, Victoria University of Wellington, PO Box 600, Wellington, New Zealand Marc Cheylan CNRS-UMR5175, Centre d’Ecologie Fonctionnelle et Evolutive, 1919 route de Mende, 34293 Montpellier Cedex 5, France Diego F. Cisneros-Heredia Universidad San Francisco de Quito, Colegio de Ciencias Biológicas y Ambientales, calle Diego de Robles y Vía Interoceánica, campus Cumbayá, edif. Darwin, DW-010A. Casilla Postal 17-12-841, Quito, Ecuador Dan Cogalniceanu University Ovidius Constanta, Faculty of Natural Sciences, Romania Hal Cogger Australian Museum, 6 College Street, Sydney, NSW 2010, Australia Claudia Corti
Museo di Storia Naturale dell’Università di Firenze, Sezione di Zoologia “La Specola”, Italy Gabriel C. Costa Universidade Federal do Rio Grande do Norte, Natal-RN, Brazil Patrick J. Couper Biodiversity Program, Queensland Museum, PO Box 3300, South Bank, Brisbane, Qld 4101, Australia Tony Courtney Queensland Department of Employment, Economic Development and Innovation, Southern Fisheries Centre, PO Box 76, Deception 4508, Qld, Australia Jelka Crnobrnja-Isailovic Faculty of Sciences and Mathematics, University of Niš & IBISS Beograd, Serbia Pierre-André Crochet CNRS-UMR5175, Centre d’Ecologie Fonctionnelle et Evolutive, 1919 route de Mende, 34293 Montpellier Cedex 5, France Brian Crother Department of Biological Sciences, Southeastern Louisiana University, Hammond, LA Felix Cruz INIBIOMA (CONICET-UNComa), Quintral 1250, (8400) Bariloche, Rio Negro, Argentina Jennifer C. Daltry Fauna & Flora International, Jupiter House, Station Road, Cambridge CB1 2JD, UK R.J. Ranjit Daniels Care Earth Trust, No 5, 21st Street, Thillaiganganagar, Chennai 600 061, India Indraneil Das Institute of Biodiversity and Environmental Conservation, Universiti Malaysia Sarawak, 94300 Kota Samarahan, Sarawak, Malaysia Anslemde Silva Rajarata University of Sri Lanka, Mihintale, Sri Lanka Amphibian Specialist Group IUCN SSC Working Group, Sri Lanka Arvin C. Diesmos Herpetology Department, Philippine National Museum, Padre Burgos St, Manila, Philippines Lutz Dirksen Reptile and Animal Presentation, Neukirchstr. 37a,13089 Berlin, Germany Tiffany M. Doan Department of Biology, Central Connecticut State University, New Britain, CT C. Kenneth Dodd Jr. Department of Wildlife Ecology and Conservation, University of Florida, Gainesville, FL J. Sean Doody School of Biological Sciences, Monash University, Clayton, Vic. 3800, Australia Michael E. Dorcas Department of Biology, Davidson College, Davidson, NC Jose Duarte de Barros Filho
Laboratório de Zoologia de Vertebrados, Universidade Estadual do Rio de Janeiro (LAZOVERTE – UERJ), Brazil Vincent T. Egan Department of Economic Development, Environment & Tourism, P. Bag X 9484, Polokwane 0700, Limpopo, South Africa El Hassan El Mouden Université Cadi Ayyad, Département de Biologie, BP 2390, Marrakech, Morocco Dirk Embert Fundacion Amigos de la Naturaleza, Santa Cruz de la Sierra, Bolivia Robert E. Espinoza Department of Biology, California State University, Northridge, CA Alejandro Fallabrino Karumbe, D. Murillo 6334, Montevideo, Uruguay Xie Feng Chengdu Institute of Biology, Chinese Academy of Sciences, P.O. Box 416, Chengdu, Sichuan, China Zhao-Jun Feng Xuzhou Normal University, Jiangsu Province, China Lee Fitzgerald Texas A&M University, College Station, TX Oscar Flores-Villela Museo de Zoologia, Fac. De Cienicas, Universidad Nacional Autónoma de México (U.N.A.M.), Mexico Frederico G.R. França Universidade Federal da Paraíba, Rio Tinto, PB, Brazil Darrell Frost American Museum of Natural History, Central Park West at 79th St., New York, NY Hector Gadsden Instituto de Ecología, A. C., Chihuahua 31109, Chihuahua, Mexico Tony Gamble University of Minnesota, Minneapolis, MN S.R. Ganesh Chennai Snake Park, Rajbhavan post, Chennai 600 022, Tamil Nadu, India Miguel A. Garcia Department of Natural Resources, Puerto Rico Juan E. García-Pérez Museo de Zoologı`a, UNELLEZ-Guanare, Venezuela Joey Gatus Biology Department, University of San Carlos, Cebu, Philippines Maren Gaulke GeoBio Center, Ludwig-Maximilians-Universität München, Richard-Wagner-Str. 10, 80333 München, Germany
Philippe Geniez EPHE-UMR5175, Centre d’Ecologie Fonctionnelle et Evolutive, 1919 route de Mende, 34293 Montpellier Cedex 5, France Arthur Georges Institute for Applied Ecology, University of Canberra, ACT 2601, Australia Justin Gerlach Nature Protection Trust of Seychelles, 133 Cherry Hinton Road, Cambridge CB1 7BX, UK Stephen Goldberg Whittier College, Department of Biology, Whittier, CA Juan-Carlos T. Gonzalez Institute of Biological Sciences, University of the Philippines, Los Banos, College, Laguna 4031, Philippines Edward Grey Institute for Field Ornithology, Department of Zoology, University of Oxford, South Parks Road, Oxford OX1 3PS, UK David J. Gower Department of Zoology, Natural History Museum, London SW7 5BD, UK Tandora Grant San Diego Zoo Institute for Conservation Research, 15600 San Pasqual Valley Road, Escondido, CA Eli Greenbaum Department of Biological Sciences, University of Texas at El Paso, 500 West University Avenue, El Paso, TX Cristina Grieco Istituto per le Piante da Legno e l’Ambiente, corso Casale 476, I-10132 Torino, Italy Peng Guo Yibin University, Sichuan, China Alison M. Hamilton Division of Amphibian & Reptiles, National Museum of Natural History, Smithsonian Institution, Washington, DC Kelly Hare Department of Zoology, University of Otago, P.O. Box 56, Dunedin 9054, New Zealand S. Blair Hedges Department of Biology, Pennsylvania State University, University Park, PA Neil Heideman University of the Free State, P.O. Box 339, Bloemfontein 9300, South Africa Craig Hilton-Taylor Species Programme, IUCN, 219c Huntingdon Road, Cambridge CB3 0DL, UK Rod Hitchmough Department of Conservation, P.O. Box 10-420, Wellington 6143, New Zealand Bradford Hollingsworth Department of Herpetology, San Diego Natural History Museum, P.O. Box 121390, San Diego, CA
Mark Hutchinson South Australian Museum, North Terrace, Adelaide, SA 5000, Australia Ivan Ineich Muséum National d’Histoire Naturelle, UMR CNRS 7205 (Origine, Structure et Evolution de la Biodiversite), Departement Systematique et Evolution, CP 30, 25 rue Cuvier, F-75005 Paris, France John Iverson Department of Biology, Earlham College, Richmond, IN Fabian M. Jaksic Center for Advanced Studies in Ecology and Biodiversity (CASEB), Catholic University of Chile, Santiago, Chile Richard Jenkins Madagasikara Voakajy, B.P. 5181, Antananarivo, Madagascar Durrell Institute of Conservation and Ecology, School of Anthropology and Conservation, University of Kent, Canterbury CT2 7NR, UK School of Environment, Natural Resources and Geography, Bangor University, Gwynedd LL57 2UW, UK Ulrich Joger State Natural History Museum (Staatliches Naturhistorisches Museum), Pockelsstr. 10, 38106 Braunschweig, Germany Reizl Jose Bohol Island State University, Bohol, Philippines Yakup Kaska Pamukkale University, Department of Biology, Denizli, Turkey Uğur Kaya Department of Zoology, Section of Biology, Faculty of Science, Ege University, 35100 Bornova/Izmir, Turkey J. Scott Keogh Research School of Biology, The Australian National University, Canberra, ACT 0200, Australia Gunther Köhler Senckenberg Forschungsinstitut und Naturmuseum, Senckenberganlage 25, D-60325 Frankfurt, Germany Gerald Kuchling School of Animal Biology, The University of Western Australia, 35 Stirling Highway, Crawley, Perth, WA 6009, Australia Yusuf Kumlutaş Dokuz Eylül University, Faculty of Education, Department of Biology, Buca, İzmir, Turkey Axel Kwet Staatliches Museum für Naturkunde Stuttgart, Zoologie, Rosenstein 1, D-70191 Stuttgart, Germany Enrique La Marca Laboratorio de Biogeografía, Escuela de Geografía, Facultad de Ciencias Forestales y Ambientales, Universidad de Los Andes, Apartado Postal 116, Merida 5101-A, Venezuela William Lamar
University of Texas at Tyler, 3900 University Blvd., Tyler, TX Amanda Lane Faculty of Veterinary Science, University of Sydney, NSW 2006, Australia Bjorn Lardner Colorado State University, Fort Collins, CO Craig Latta Australian Freshwater Turtle Conservation & Research Association (AFTCRA Inc.), 53 Jubilee Road, Carters Ridge, Qld, Australia Gabrielle Latta Australian Freshwater Turtle Conservation & Research Association (AFTCRA Inc.), 53 Jubilee Road, Carters Ridge, Qld, Australia Michael Lau WWF – Hong Kong, Hong Kong Special Administrative Region Pablo Lavin Universidad Autonoma de Ciudad Juarez, Chihuahua, Mexico Dwight Lawson Zoo Atlanta, 800 Cherokee Avenue, SE Atlanta, GA Matthew LeBreton Global Viral Forecasting Initiative, Cameroon Edgar Lehr Illinois Wesleyan University, Bloomington, IL Duncan Limpus Environment and Resource Science Division, Department of Environment and Resource Management, Australia Nicola Lipczynski WildScreen, Ground Floor, The Rackhay, Queen Charlotte Street, Bristol BS1 4HJ, UK Aaron S. Lobo Department of Zoology, University of Cambridge CB2 3EJ, UK Marco A. López-Luna Universidad Juárez Autónoma de Tabasco, División Académica de Ciencias Biológicas, Villahermosa, Tabasco, Mexico Luca Luiselli Centre of Environmental Studies Demetra, via Olona 7, 00198 Roma, Italy Vimoksalehi Lukoschek University of California, Irvine, CA ARC Centre of Excellence for Coral Reef Studies, James Cook University, Townsville, Qld 4811, Australia Mikael Lundberg Staatliche Naturhistorische Sammlungen Dresden, Museum für Tierkunde, Königsbrücker Landstr. 159, D-01109 Dresden, Germany Petros Lymberakis Natural History Museum of Crete, University of Crete, 71409 Irakleio, Greece
Robert Macey Department of Biology, Merritt College, 12500 Campus Drive, Oakland, CA William E. Magnusson Instituto Nacional de Pesquisas da Amazônia, Av. André Araújo, 2936, Aleixo, CEP 69083-000, Manaus, Amazonas, Brazil D. Luke Mahler Center for Population Biology, University of California at Davis, Davis, CA Anita Malhotra School of Biological Sciences, College of Natural Sciences, Bangor University, Deiniol Road, Bangor LL57 2UW, UK Jean Mariaux Museum of Natural History, Route de Malagnou 1, 1208 Geneva, Switzerland Bryan Maritz School of Animal, Plant and Environmental Sciences, University of the Witwatersrand, P.O. Wits 2050, South Africa Otavio A.V. Marques Laboratório de Ecologia e Evolução, Instituto Butantan, Av. Vital Brazil 1500, São Paulo, SP 05503-900, Brazil Rafael Márquez Fonoteca Zoológica, Dept Biodiversidad y Biologia Evolutiva, Museo Nacional de Ciencias Naturales (CSIC), José Gutierrez Abascal 2, 28006 Madrid, Spain Marcio Martins Departamento de Ecologia, Instituto de Biociencias, Universidade de São Paulo, 05508-090 São Paulo, SP, Brazil Gavin Masterson School of Animal, Plant and Environmental Sciences, University of the Witwatersrand, P.O. Wits 2050, South Africa José A. Mateo BIOGES, University of Las Palmas, 35001 Las Palmas, Canary Islands, Spain Rosamma Mathew Zoological Survey of India, North Eastern Regional Centre, Fruit Garden, Risa Colony, Shillong 793 003, Meghalaya, India Nixon Mathews Wildlife Trust for India (WTI), Species Recovery Program, India Gregory Mayer Department of Biological Sciences, University of Wisconsin-Parkside, Kenosha, WI James R. McCranie Smithsonian Institution Research Associate G. John Measey School of Environmental Sciences and Development, North-West University, Private Bag X6001, Potchefstroom 2520, South Africa
Fernando Mendoza-Quijano Instituto Tecnológico de Huejutla, Carr. Huejutla-Chalahuiyapa, A.P. 94, Huejutla de Reyes, Hidalgo 43000, Mexico Michele Menegon Museo Tridentino di Scienze Naturali, Via Calepina 14, 38122 Trento, Italy Sébastien Métrailler Ch. du Bosquet 6, 1967 Bramois, Switzerland David A. Milton CSIRO Marine and Atmospheric Research, P.O. Box 120, Cleveland, 4163 Qld, Australia Chad Montgomery Truman State University, Kirksville, MO Sérgio A.A. Morato Universidade Tuiuti do Paraná, Curitiba, Parana State, Brazil Tami Mott Departamento de Biologia e Zoologia, Instituto de Biociências, Universidade Federal do Mato Grosso, Cuiabá, Brazil Antonio Muñoz-Alonso El Colegio de la Frontera Sur, Chiapas, Mexico John Murphy Field Museum of Natural History, 1400 S. Lake Shore Dr, Chicago, IL Truong Q. Nguyen Zoologisches Forschungsmuseum Alexander Koenig (ZFMK), Adenauerallee 160, 53113 Bonn, Germany Institute of Ecology and Biological Resources, 18 Hoang Quoc Viet St., Hanoi, Viet Nam Göran Nilson Göteborg Natural History Museum, Box 7283, SE-402 35 Göteborg, Sweden Cristiano Nogueira Departamento de Zoologia, Universidade de Brasilia, ICC Ala Sul – Campus Darcy Ribeiro, Asa Norte, Brasilia-DF 70910-900, Brazil Herman Núñez Museo Nacional de Historia Natural, Interior de la Quinta Normal, Santiago, Chile Nikolai Orlov Zoological Institute, Russian Academy of Sciences, St. Petersburg 199034, Universitetskaya nab. 1, Russia Hidetoshi Ota Institute of Natural and Environmental Sciences, University of Hyogo, Yayoigaoka 6, Sanda, Hyogo 669-1546, Japan José Ottenwalder Medio Ambiente, Salud & Seguridad Ocupacional, Aerodom SIGLO XXI, Dominican Republic Theodore Papenfuss Museum of Vertebrate Zoology, 3101 Valley Life Sciences Building, University of California, Berkeley, CA
Stesha Pasachnik University of Tennessee, Knoxville, TN Paulo Passos Departamento de Vertebrados, Museu Nacional, Universidade Federal do Rio de Janeiro, São Cristovão, Rio de Janeiro, RJ 20940-040, Brazil Olivier S.G. Pauwels Département des Vertébrés Récents, Institut Royal des Sciences naturelles de Belgique, Rue Vautier 29, 1000 Brussels, Belgium Néstor Pérez-Buitrago Universidad de Puerto Rico, Puerto Rico Valentín Pérez-Mellado Facultad de Biología, Universidad de Salamanca, Salamanca, Spain Eric R. Pianka Integrative Biology C0930, The University of Texas at Austin, One University Station, Austin, TX Juan Pleguezuelos Dep Animal Biology, Fac Sciences, Granada Univer, E-18071 Granada, Spain Caroline Pollock Species Programme, IUCN, 219c Huntingdon Road, Cambridge CB3 0DL, UK Paulino Ponce-Campos Bosque Tropical, A. C., Privada Marlin # 10, Fraccionamiento Roca Azul, Jocotepec 45800, Jalisco, Mexico Robert Powell Department of Biology, Avila University, Kansas City, MO Fabio Pupin Museo Tridentino di Scienze Naturali, Via Calepina 14, 38122 Trento, Italy Gustavo E. Quintero Díaz Universidad Autónoma de Aguascalientes, C. P. 20131, Aguascalientes, Mexico Raju Radder School of Biological Sciences A08, University of Sydney, NSW 2006, Australia Jan Ramer Indianapolis Zoo, Indianapolis, IN Arne R. Rasmussen School of Conservation, The Royal Danish Academy of Fine Arts, Esplanaden 34, DK-1263 Copenhagen K, Denmark Chris Raxworthy American Museum of Natural History, Central Park West at 79th St., New York, NY Robert Reynolds USGS Patuxent Wildlife Research Center, National Museum of Natural History, Washington, DC Nadia Richman Institute of Zoology, Zoological Society of London, Regent’s Park, London NW1 4RY, UK
Edmund L. Rico Fauna & Flora International Philippines, c/o International Institute of Rural Reconstruction Y.C. James Yen Centre Silang, Cavite 4118, Philippines Elisa Riservato Via Maestra 81, I-28100 Novara, Italy Gilson Rivas Museo de Biologia, Facultad Experimental de Ciencias, La Universidad del Zulia, apartado postal 526, Maracaibo 4011, Estado Zulia, Venezuela Pedro L.B. da Rocha Instituto de Biologia, Universidade Federal da Bahia, 40170-290 Salvador, Bahia, Brazil Mark-Oliver Rödel Museum für Naturkunde at the Humboldt University, Invalidenstr. 43, 10115 Berlin, Germany Lourdes Rodríguez Schettino Institute of Ecology and Systematics, La Habana, Cuba Willem M. Roosenburg Ohio Center for Ecology and Evolutionary Studies, Department of Biological Sciences, Ohio University, 107 Irvine Hall, Athens, OH James P. Ross Department of Wildlife Ecology and Conservation, University of Florida, Gainesville, FL IUCN SSC Crocodile Specialist Group Riyad Sadek Biology Department, American University of Beirut, Beirut, Lebanon Kate Sanders School of Earth and Environmental Sciences, University of Adelaide, Adelaide 5005, Australia Georgina Santos-Barrera Facultad de Ciencias, Universidad Nacional Autonoma de Mexico (U.N.A.M.), Mexico Hermann H.S chleich Instituto y Nucleo Zoologico ARCO, E-04200 Tabernas, Spain Benedikt R. Schmidt nstitute of Evolutionary Biology and Environmental Studies, University of Zurich, Winterthurerstrasse 190, 8057 Zürich, Switzerland karch, Passage Maximilien-de-Meuron 6, 2000 Neuchâtel, Switzerland Andreas Schmitz Department of Herpetology & Ichthyology, Muséum d’histoire naturelle, 1 route de Malagnou, 1208 Geneve, Switzerland Mozafar Sharifi Department of Biology, Razi University, Kermanshah, Iran Glenn Shea Faculty of Veterinary Science, University of Sydney, NSW 2006, Australia Hai-Tao Shi College of Life Science, Hainan Normal University, Haikou 571158, China
Richard Shine School of Biological Sciences A08, University of Sydney, NSW 2006, Australia Roberto Sindaco Istituto per le Piante da Legno e l’Ambiente, corso Casale 476, I-10132 Torino, Italy Tahar Slimani Université Cadi Ayyad, Département de Biologie, BP 2390, Marrakech, Morocco Ruchira Somaweera chool of Biological Sciences A08, University of Sydney, NSW 2006, Australia Steve Spawls Department of Health and Science, City College, Norwich NR2 2LJ, UK Peter Stafford Department of Zoology, Natural History Museum, London SW7 5BD, UK Rob Stuebing Field Museum of Natural History, 1400 S. Lake Shore Dr, Chicago, IL Sam Sweet Ecology and Evolutionary Biology, University of California, Santa Barbara, CA Emerson Sy Herpetological Society of the Philippines, Philippines Helen J. Temple The Biodiversity Consultancy, Cambridge, UK Marcelo F. Tognelli UCN – CI Biodiversity Assessment Unit, Conservation International, 2011 Crystal Drive Ste 500, Arlington, VA Instituto Argentino de Investigaciones de las Zonas Áridas (IADIZA-CONICET), CC 507, CP 5500 Mendoza, Argentina Krystal Tolley South African National Biodiversity Institute, Private Bag X7, Claremont 7735, Cape Town, South Africa Peter J. Tolson Toledo Zoo, PO Box 140130, Toledo, OH Boris Tuniyev 354000 Sochi, ul. Moskovskaya 21, Russia Sako Tuniyev 354000 Sochi, ul. Moskovskaya 21, Russia Nazan Üzüm Adnan Menderes University, Faculty of Science and Arts, Department of Biology, Aydın, Turkey Gerardvan Buurt Kaya Oy Sprock 18, Curaçao Monique Van Sluys Depto. Ecologia, IBRAG, Universidade do Estado do Rio de Janeiro, Rua São Francisco Xavier 524, Maracanã, CEP 20550-013 Rio de Janeiro, Brazil
Alvaro Velasco IUCN SSC Crocodile Specialist Group, Caracas, Venezuela Miguel Vences Technical University of Braunschweig (Technische Universität Braunschweig), 38092 Braunschweig, Germany Milan Veselý Palacký University Olomouc, 771 47 Olomouc, Czech Republic Sabine Vinke Filadelfia 853, 9300 Fernheim, Paraguay Thomas Vinke Filadelfia 853, 9300 Fernheim, Paraguay Gernot Vogel Society for Southeast Asian Herpetology, Im Sand 3, D-69115 Heidelberg, Germany Milan Vogrin DPPVN, Rače, Slovenia Richard C. Vogt Instituto Nacional de Pesquisas da Amazônia, Av. André Araújo, 2936, Aleixo, CEP 69083-000, Manaus, Amazonas, Brazil Oliver R. Wearn Institute of Zoology, Zoological Society of London, Regent’s Park, London NW1 4RY, UK Yehudah L. Werner Institute of Life Sciences (EEB), The Hebrew University of Jerusalem, 91904 Jerusalem, Israel Museum für Tierkunde, Senckenberg Dresden, A. B. Meyer Building, Königsbrücker Landstrasse 159, 01109 Dresden, Germany Martin J. Whiting Macquarie University, Sydney, NSW 2109, Australia Thomas Wiewandt Wild Horizons, Inc, Tucson, AZ John Wilkinson Amphibian and Reptile Conservation, 655A Christchurch Road, Boscombe, Bournemouth, BH1 4AP Dorset, UK Byron Wilson University of the West Indies, Mona, Jamaica Sally Wren Conservation Programmes, Zoological Society of London, Regent’s Park, London NW1 4RY, UK Tara Zamin Department of Biology, Queens University, Kingston, Ont., Canada K7L 3N6 Kaiya Zhou
College of Life Sciences, Nanjing Normal University, Nanjing, China
George Zug
Division of Amphibian & Reptiles, National Museum of Natural History, Smithsonian Institution, Washington, DC
Abstract Effective and targeted conservation action requires detailed information about species, their distribution, systematics and ecology as well as the distribution of threat processes which affect them. Knowledge of reptilian diversity remains surprisingly disparate, and innovative means of gaining rapid insight into the status of reptiles are needed in order to highlight urgent conservation cases and inform environmental policy with appropriate biodiversity information in a timely manner. We present the first ever global analysis of extinction risk in reptiles, based on a random representative sample of 1500 species (16% of all currently known species). To our knowledge, our results provide the first analysis of the global conservation status and distribution patterns of reptiles and the threats affecting them, highlighting conservation priorities and knowledge gaps which need to be addressed urgently to ensure the continued survival of the world’s reptiles. Nearly one in five reptilian species are threatened with extinction, with another one in five species classed as Data Deficient. The proportion of threatened reptile species is highest in freshwater environments, tropical regions and on oceanic islands, while data deficiency was highest in tropical areas, such as Central Africa and Southeast Asia, and among fossorial reptiles. Our results emphasise the need for research attention to be focussed on tropical areas which are experiencing the most dramatic rates of habitat loss, on fossorial reptiles for which there is a chronic lack of data, and on certain taxa such as snakes for which extinction risk may currently be underestimated due to lack of population information. Conservation actions specifically need to mitigate the effects of human-induced habitat loss and harvesting, which are the predominant threats to reptiles.
Keywords IUCN Red List, Extinction risk, Threatened species, Lizards, Snakes, Turtles, Distribution maps
1. Introduction Reptiles1 and their immediate diapsid ancestors have had a long and complex evolutionary history, having first appeared on the planet in the late Palaeozoic Era, more than 250 million years ago (based on molecular phylogeny estimates and early fossil records: e.g., Hedges and Poling, 1999, Reisz et al., 2011, van Tuinen and Hadly, 2004). High rates of cladogenesis in the Triassic and Jurassic periods (Vidal and Hedges, 2009) produced a diverse group of animals adapted to almost every temperate, tropical and desert environment, and to terrestrial, freshwater and marine habitats. Reptiles play important roles in natural systems, as predators, prey, grazers, seed dispersers and commensal species; they serve as bioindicators for environmental health, and their often specific microhabitat associations provide the ideal study system to illustrate the biological and evolutionary processes underlying speciation (Raxworthy et al., 2008, Read, 1998). Reptiles generally have narrower distributional ranges than other vertebrates such as birds and mammals (Anderson, 1984, Anderson and Marcus, 1992), making them more susceptible to threat processes; however, it should be noted that there is some marked variation in range size between different clades of reptiles, so that generalisations and comparisons may not hold true universally [e.g., range sizes of snakes are generally larger than those of lizards (Anderson and Marcus, 1992)]. This combination of often small range and narrow niche requirements makes reptiles susceptible to anthropogenic threat processes, and they are therefore a group of conservation concern. Regional assessments in Europe (Cox and Temple, 2009) and southern Africa (South Africa, Lesotho and Swaziland; Bates et al., in press) indicate that one-fifth and one-tenth of reptilian species respectively are threatened with extinction. It has also been proposed that reptilian declines are similar in taxonomic breadth,
geographic scope and severity to those currently observed in amphibians (Gibbons et al., 2000), although this claim was not quantitatively assessed by the authors. Reptilian declines have been attributed to habitat loss and degradation, as well as unsustainable trade, invasive species, pollution, disease and climate change (Cox and Temple, 2009, Gibbons et al., 2000, Todd et al., 2010).
A total of 9,084 species of reptiles have been described so far (Uetz, 2010), and new molecular evidence continues to unearth numerous cryptic species that had not previously been detected by morphological analyses (e.g., Adalsteinsson et al., 2009, Nagy et al., 2012, Oliver et al., 2009). Yet as a group, reptiles are currently poorly-represented on the IUCN Red List of Threatened Species, with only 35% of described species evaluated, and those that are evaluated were done so in a non-systematic manner (IUCN, 2011a). Although the Global Reptile Assessment (GRA) will in the long run address this bias, the current assessment process relies on regional workshops and the formation of IUCN SSC Specialist Groups for specific reptilian taxa, which introduces geographical as well as taxonomic bias into the analysis. Specifically, the Global Reptile Assessment has carried out comprehensive assessments for North America, Madagascar and New Caledonia, with complete endemic-only assessments having been carried out in the Philippines, Europe and selected island groups (Seychelles, Comoros and Socotra). As a result, there are still large geographical gaps which are only slowly being addressed, namely in Africa, Latin America, Asia and Australia. This limits our understanding of how threat processes affect reptiles, so that these taxa are often overlooked in conservation decisions, specifically because the geographical, taxonomic and threatened species bias still inherent in the current IUCN Red List for reptiles makes taking conservation decisions impractical.
We present the results of the first assessment of extinction risk in a randomly selected, representative and global sample of 1500 reptiles, as a shortcut for deriving group patterns on which to base sound global conservation action. We produce the first global species- and threatened species-richness maps for reptiles. The results highlight key regions, taxa and anthropogenic threat processes which need to be urgently targeted to effectively conserve the world’s reptiles.
2. Methods 2.1. Sampled approach to Red Listing Following an approach set out in Baillie et al. (2008), we randomly selected 1500 species from a list of all described reptilian species (Uetz, 2010), using the sample function in R [sample (x, size); R Development Core Team, 2007]. A sample of 1500 species is sufficiently large to report on extinction risk and trends, and buffers against falsely detecting improvements in extinction risk (Baillie et al., 2008). Similarly, the representation of spatial patterns derived from a sample of 1500 species was found to be in broad agreement with spatial patterns derived from comprehensive assessments in both mammals and amphibians (Collen, unpublished data). Although the taxonomy of the full species list by Uetz (2010) does not necessarily follow the taxonomy used by all herpetologists, it is the only comprehensive reptile species list available for the purpose of this project. Nevertheless, taxonomic changes based on new research have been incorporated into the sampled species list throughout the project (e.g., the split of Colubridae into numerous families, as suggested by Zaher et al., 2009). It should be noted that the rapid rate at which new species are being described may have some bearing on the representativeness of our sample in the future. Overall, however, we believe that this sampled approach allows for analysis of extinction risk as well as the depiction of broad-scale spatial threat status and processes. A full list of species in the sample, and summaries by habitat system and biogeographical realm, are given in Tables S1 and S2 in the online supplementary material.
Our sample closely reflected the contribution of each group towards total reptilian diversity, with the sample being made up of 58% lizards, 37% snakes, 3% turtles/tortoises, 2% amphisbaenians and <1% crocodiles
(tuataras were not represented). Overall, 220 of the 1500 selected species had been previously assessed by IUCN, and these assessments were still up-to-date (i.e., they had been assessed since 2006); for the remaining 1280 species, new or updated assessments were produced through consultation with a global network of herpetologists and following the IUCN Red List Categories and Criteria (IUCN, 2001). Through a centralised editorial and reviewing process we ensured that the IUCN Red List Categories and Criteria were consistently applied between species and regions. A total of 124 species were re-assessed from previous assessments, and genuine changes (category changes showing a real increase or decrease in extinction risk) or non-genuine changes (changes in category which are due to new or better information becoming available, incorrect information used previously, taxonomic change affecting the species, or previously incorrect application of the IUCN Red List Criteria, rather than a true improvement or decline in Red List category) were noted.
Extinction risk was assessed using the IUCN Red List Categories and Criteria (IUCN, 2001). The IUCN Red List Categories classify species’ extinction risk from Extinct (EX) and Extinct in the Wild (EW), via the threatened categories Critically Endangered (CR), Endangered (EN) and Vulnerable (VU) to Near Threatened (NT) and Least Concern (LC). A species is listed as Data Deficient (DD) if insufficient data are available to make a conservation assessment. The Red List categories are assigned objectively based on a number of criteria that indicate level of extinction risk, e.g., rate of population decline (Criterion A), population size (Criteria C and D), geographic range size and decline (Criterion B), or quantitative analyses (Criterion E) (IUCN, 2001, Mace et al., 2008). Given the nature of biological information available for reptiles, and the general lack of population data for this group, most of the threatened species in the sample were listed on the basis of restricted geographic range under criteria B or D2 (see Appendix S3 in the online supplementary material for more information on the assessment process and the use of criteria).
Threats were recorded for each species. These were coded following Salafsky et al. (2008) and broadly defined as: threats due to agriculture/aquaculture; biological resource use (e.g., hunting and harvesting of species; logging activities); urban development (residential and commercial); pollution; invasive or problematic species; energy production and mining (oil drilling and mining); natural system modifications (e.g., fire regimes, damming and channelling of waterways); climate change and severe weather; human intrusion and disturbance; transportation and service corridors (e.g., roads and shipping lanes); and geological events.
All of the species assessments have been reviewed and accepted by the IUCN and are now published online (www.iucnredlist.org, IUCN, 2011a), with the exception of some turtle and crocodilian assessments which are still undergoing sign-off.
2.2. Species distributions and maps of threat processes Distributions were mapped in ArcGIS for 1497 species [three species lacked adequate distributional data: Anolis baccatus (DD), Dipsas maxillaris (DD), Typhlops filiformis (DD)], based on georeferencing of distribution maps published in the literature, conversion of point locations into ranges and expert feedback. Only extant ranges were included in the analysis (i.e., extinct, possibly extinct and uncertain parts of the range were omitted). We produced maps of global species richness, threatened species richness and Data Deficient species richness, by overlaying a hexagonal grid onto the aggregated species’ distribution. The grid is defined on an icosahedron, projected to the sphere using the inverse Icosahedral Snyder Equal Area (ISEA) projection, and takes account of the Earth’s spherical nature. We then summed the number of species occurring in each hexagonal grid cell (cell size was approximately 7770 km2) to obtain the species richness pattern of our sample. We also mapped the proportion of species classed as threatened (CR, EN and VU categories), Near Threatened and Data Deficient per grid cell.
We mapped underlying threat processes for all 1497 mapped species as the number of threatened and Near Threatened species within each grid cell affected by the threat process in question. We expressed threat process
prevalence using two approaches. Approach A used the number of species affected by a predominant threat and approach B the proportion of species affected by each predominant threat type out of the total number of species (all categories) present in each grid cell. Although coarse in resolution, as threat processes are unlikely to be equally distributed across a species’ range, these aggregations provide an impression of those locations where each threat is affecting a particularly large number of species. The two approaches to threat mapping are likely to emphasise different aspects of the pattern, with approach A more likely to be influenced by underlying species richness patterns, and approach B by threat patterns being observed across areas of low reptile numbers in our sample, where the presence of threat in one or a few species is going to result in a larger proportional value compared to species rich areas. It is also likely to be more easily affected by biases in our sample in areas of overall low reptile numbers. In terms of conservation action, approach A is likely to correspond most closely to prioritisation measures which maximise species richness through targeted conservation (similar to hotspot approaches, although in this case driven by underlying threat processes), while approach B gives a better indication of areas where a threat process is affecting a larger proportion of species (though most likely in areas of low species richness).
2.3. Summarising the extinction risk of the world’s reptiles We summarised extinction risk across all reptiles and sub-groups (amphisbaenians, crocodiles, lizards, snakes, turtles/tortoises), and by biogeographical realm (see S3.3 in the online supplementary material for information on the geographical extent of biogeographical realms) and habitat system (terrestrial, freshwater, marine). We calculated proportions of threatened (Critically Endangered, Endangered and Vulnerable) species by assuming that Data Deficient species will fall into these categories in the same proportion as non-Data Deficient species:
Propthreat = (CR + EN + VU)/(𝑁𝑁 − DD),
where N is the total number of species in the sample, CR, EN and VU are the numbers of species in the Critically Endangered, Endangered and Vulnerable categories respectively, and DD is the number of species in the Data Deficient category. Threat levels have been reported in this way in similar studies (e.g., Clausnitzer et al., 2009, Hoffmann et al., 2010, Schipper et al., 2008), representing the current consensus among conservation biologists about how the proportion of threatened species should be presented, while also accounting for the uncertainty introduced by DD species. The approach is likely to result in a conservative estimate of threat proportions, since Data Deficient reptiles are often rare and restricted in range, thus likely to fall within a threatened category in future based on additional data [although in other taxa, indications are that DD species will often fall into Least Concern categories (e.g., birds; Butchart and Bird, 2010) or remain largely Data Deficient (e.g., mammals; Collen et al., 2011)]. Overall, the re-assessment of DD species into different categories is very taxon-specific and depends greatly on the attitude of the assessor to risk, so that it is difficult to make any generalisations about what the future status of DD species might be. To deal with this uncertainty we calculated upper and lower bounds of threat proportions by assuming that (a) no Data Deficient species were threatened [lower margin: Propthreat = (CR + EN + VU)/(N)], and (b) all Data Deficient species were threatened [upper margin; Propthreat = (CR + EN + VU + DD)/N].
2.4. Taxonomic differences in extinction risk and the effect of range size We followed Bielby et al. (2006) to evaluate whether extinction risk is randomly distributed across taxonomic families [based on the taxonomy by Uetz (2010), but including some Australasian geckos in the Diplodactylidae (Han et al., 2004), see Table S1 for details], and tested for significant variation in threat levels across families using a chi-square test. The absence of a random distribution of risk suggests that biological or geographical drivers of risk exist, which can help focus conservation activity (Cardillo and Meijaard, 2011). Where we detected taxonomically non-random extinction risk, further analyses were employed to determine which families deviated from the expected level of threat. Using binomial tests, we calculated the smallest family size
necessary to detect a significant deviation from the observed proportion of threatened species and excluded families represented by an insufficient number of species from subsequent analysis. We generated a null frequency distribution of the number of threatened species from 10,000 unconstrained randomizations, by randomly assigning Red List categories to all species, based on the frequency of occurrence of each category in the sample. We then counted the number of threatened species in the focal family and compared this with the null frequency distribution. The null hypothesis (extinction risk is taxonomically random) was rejected if this number fell in the 2.5% at either tail.
Because reptiles are mostly listed as threatened under the range-size dependent criteria B and D2, we explored differences in range size between species groups (specifically between lizards and snakes) in order to assess whether increased threat status in the absence of population data could be potentially linked to taxa-specific patterns of range size. This is particularly of interest since it has previously been observed that snakes have larger range sizes (and hence extent of occurrences) than lizards (Anderson, 1984, Anderson and Marcus, 1992). All tests and randomizations were conducted in R version 2.11.1 (R Development Core Team, 2007).
3. Results 3.1. Global extinction risk of reptiles We classified more than half of reptilian species (59%) in the assessment as Least Concern, 5% as Near Threatened, 15% as threatened (Vulnerable, Endangered or Critically Endangered) and 21% as Data Deficient. Based on this, we estimated the true percentage of threatened reptiles in the world to be 19% (range: 15–36%), as described in Section 2.3. Using the same approach, another 7% of species are estimated as Near Threatened (range: 5–26%); these species are the most likely candidates to become threatened in the future if measures are not taken to eliminate anthropogenic processes which currently affect populations of these species. None of the species in our sample was classed as Extinct or Extinct in the Wild, although three lizard species in the Critically Endangered category were flagged as possibly extinct (Anolis roosevelti, Ameiva vittata and Stenocercus haenschi) and may be up-listed during future reassessments, once “exhaustive surveys in known and/or expected habitat, at appropriate times (diurnal, seasonal, annual), throughout its historic range have failed to record an individual” (IUCN, 2001).
Of the 223 reptilian species classed as threatened, around half (47%) were assigned to the Vulnerable category; another 41% and 12% were assessed as Endangered and Critically Endangered, respectively. Threat estimates for terrestrial species mirrored that recorded for all reptiles (19% threatened), because the vast majority of reptiles inhabit terrestrial systems (N = 1473; Table 1). However, for reptiles associated with marine and freshwater environments, 30% were estimated to be threatened (N = 94; Table 1). Note that 68 species were dependent on both terrestrial and non-terrestrial environments.
Table 1. Extinction risk in a subsample of 1500 reptiles by order, biogeographic realm and habitat system. The number of species falling into each IUCN Category are listed, from which % threatened has been calculated as described in Section 2.3.
Taxon DD LC NT VU EN CR N No. of species
% Threatened
Described % Sampled
Threatened %
Lower Upper
Reptiles 318 881 78 105 92 26 1500 9413 15.9 18.9 14.9 36.1 Amphisbaenia 14 11 2 0 1 0 28 181 15.5 7.1 3.6 53.6 Crocodylia 0 1 0 2 0 1 4 24 16.7 75 75 75 Sauria 164 506 48 72 63 14 867 5537 15.7 21.2 17.2 36.1 Serpentes 135 352 19 24 20 5 555 3346 16.6 11.7 8.8 33.2 Testudines 5 11 9 7 8 6 46 323 14.2 51.2 45.7 56.5
Realm Afrotropical 53 161 15 33 22 5 289
25.4 20.8 39.1
Australasian 32 149 9 10 14 5 219
15.5 13.2 27.9 Indomalayan 105 167 13 15 10 5 315
14.3 9.5 42.9
Nearctic 2 72 7 7 3 3 94
14.1 13.8 16.0 Neotropical 107 309 27 38 35 11 527
20.0 15.9 36.2
Oceanian 0 4 0 0 2 1 7
42.9 42.9 42.9 Palaearctic 25 105 8 6 8 2 154
12.4 10.4 26.6
Habitat system Terrestrial 313 861 78 105 91 25 1473
19.1 15.0 36.3
Freshwater and marine
16 44 11 9 8 6 94
29.5 24.5 41.5
Subsurface 50 46 5 1 5 0 107
10.5 5.6 57.0 DD – Data Deficient; LC – Least Concern; NT – Near Threatened; VU – Vulnerable; EN – Endangered; CR – Critically Endangered. Percentage threatened: assumes DD species are threatened in the same proportion as non-DD species; Lower margin: no DD species threatened; Upper margin: all DD species threatened. Number of described species is based on Uetz (2010). Rhynchocephalia (Tuatara) was not represented in our random sample. Subsurface includes completely or primarily fossorial families: Amphisbaenidae, Anomalepidae, Dibamidae, Leptotyphlopidae, Trogonophidae, Typhlopidae, Uropeltidae, Xenopeltidae.
Of the 124 species reassessed during this project, 72 species did not change from the previously assigned category. Overall, 46 category changes were documented, only three of which were genuine changes showing an increase in extinction risk. All other changes (N = 43) were non-genuine changes. Six species had previously been listed on the IUCN Red List as Not Evaluated, but have now been assigned categories.
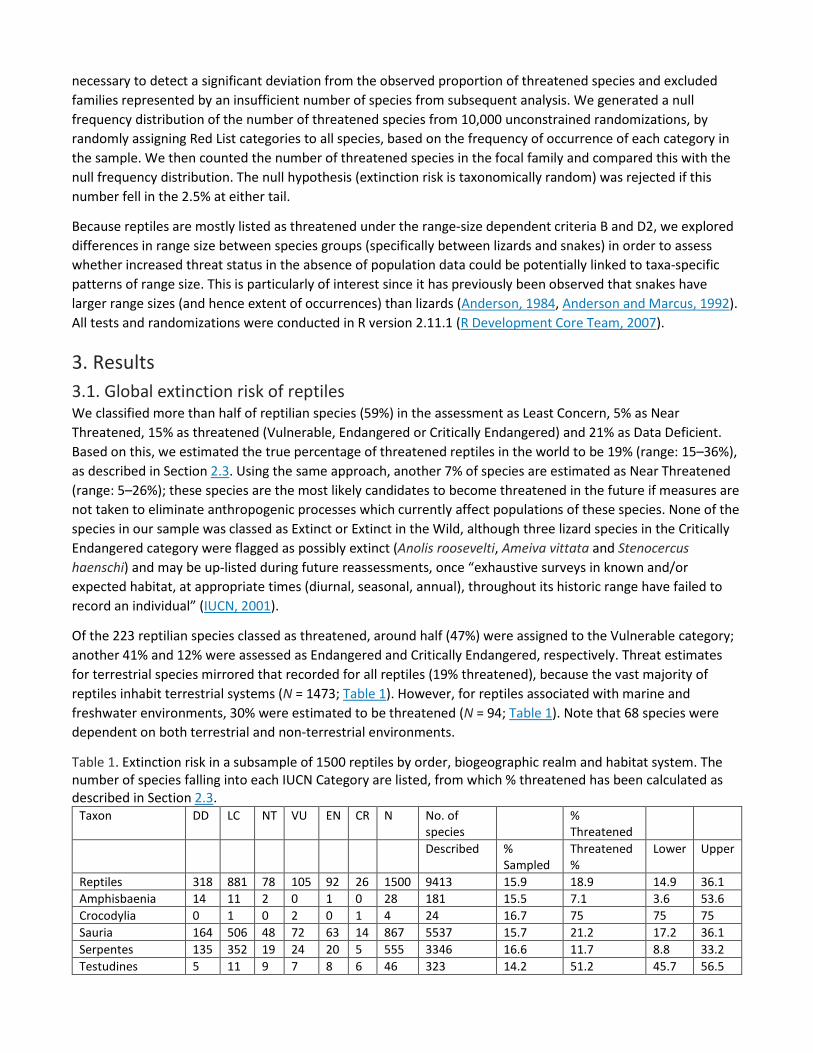
3.2. Global species richness and distribution of threatened and Data Deficient reptiles Overall species richness in our sample was highest in tropical regions, specifically in Central America and parts of northern South America (especially Brazil), tropical West Africa, parts of Southeast Africa, Sri Lanka and Southern India and throughout Southeast Asia, from Eastern India to Indonesia and the Philippines (Fig. 1).
Fig. 1. Global species richness distribution of the sampled reptile assessment (Nterr/fw = 1485; Nmarine = 22), showing number of species and proportion of species in sample per grid cell. Terr/fw – terrestrial and freshwater species.
The tropics also harboured the highest proportions of threatened and Data Deficient species in the sample. Data deficiency was highest in the Indomalayan realm (33%), followed by the Neotropics (20%) and Afrotropics (18%; Table 1). A high percentage of Data Deficient species will give rise to wide margins of uncertainty on any estimates of the percentage of threatened species (see upper and lower margins in Table 1). Oceania had the highest proportion of threatened species (43%; Table 1), although this was based on very low species richness in our sample (N = 7), while 25% and 20% of species were estimated as threatened in the Afrotropical and Neotropical realms, respectively (Table 1). The lowest level of extinction risk was recorded in the Palaearctic, where 12% of species were estimated as threatened (Table 1).
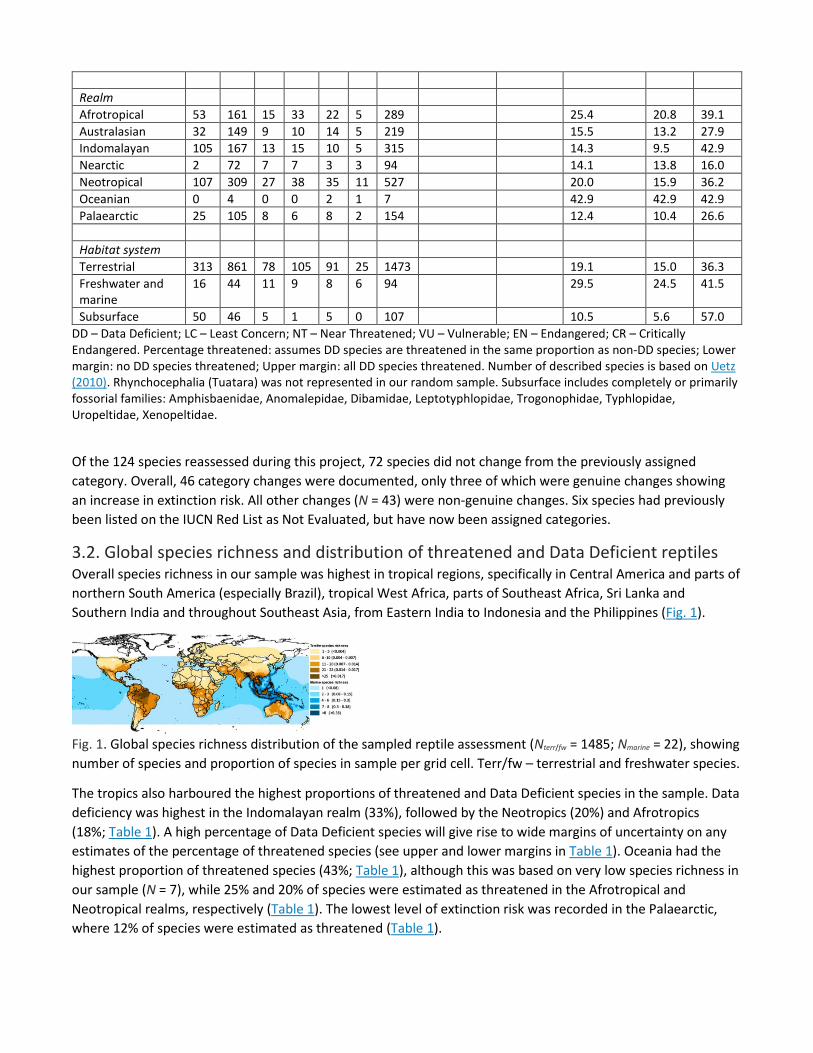
Localised centres of threatened species richness were particularly apparent in the Caribbean (Hispaniola), Florida and the Florida panhandle, the Ecuadorian Andes, Madagascar, the northeastern Indian subcontinent, Central Asia, Eastern China and oceanic islands such as New Caledonia (Fig. 2A). Prevalence of Near Threatened species was particularly pronounced across Europe, central North America, Central and West Africa, Central China and the South Island of New Zealand (Fig. 2B). Data deficiency was particularly pronounced in tropical regions, specifically in parts of the Indomalayan realm (e.g., throughout India, Borneo and the Philippines) and Central Africa (Fig. 2C).
Fig. 2. Distribution of threatened (CR, EN, VU), Near Threatened (NT) and Data Deficient (DD) species in the sample (terrestrial and freshwater only), expressed as the proportion of all species present per grid cell: (A) proportion of species classed as threatened, adjusted to account for DD species as described in Section 2.3; (B) proportion of species classed as Near Threatened, adjusted to account for DD species as described in Section 2.3; and (C) proportion of species classed as Data Deficient per grid cell.
Some apparently low-diversity areas (for species richness, as well as threatened species richness) are likely explained by the lack of research in particularly inaccessible areas (e.g., the Congo basin; Fig. 2C) and isolated island groups. It is likely that both relative species richness and data deficiency is higher in these areas than is currently apparent. Furthermore, in some localised areas, the fact that all our analysis was based on a random sample may have led to a slight underestimate of species richness, threatened species richness or Data Deficient species richness. Additional maps of species richness are available in the online supplementary material (S4).
3.3. Global distribution of threat processes Over 80% of all threatened species in our sample were affected by more than one threat process. Agriculture and biological resource use (predominantly logging and harvesting) present the most common threats to terrestrial reptiles (74% and 64% of threatened species affected, respectively). Urban development (34%), natural system modification (by use of fire, damming, etc., 25%) and invasive or problematic native species (22%) also played a role in threat to terrestrial species.
Biological resource use was also the most significant threat to freshwater and marine reptiles (87% of threatened species), with most of this threat stemming from targeted harvesting of species. This reflects the large percentage of turtles in the threatened freshwater and marine sample and their role in human trade
activities. Agriculture and aquaculture, urban development and pollution (all affecting 43% of threatened species) were also significant threats to non-terrestrial reptiles.
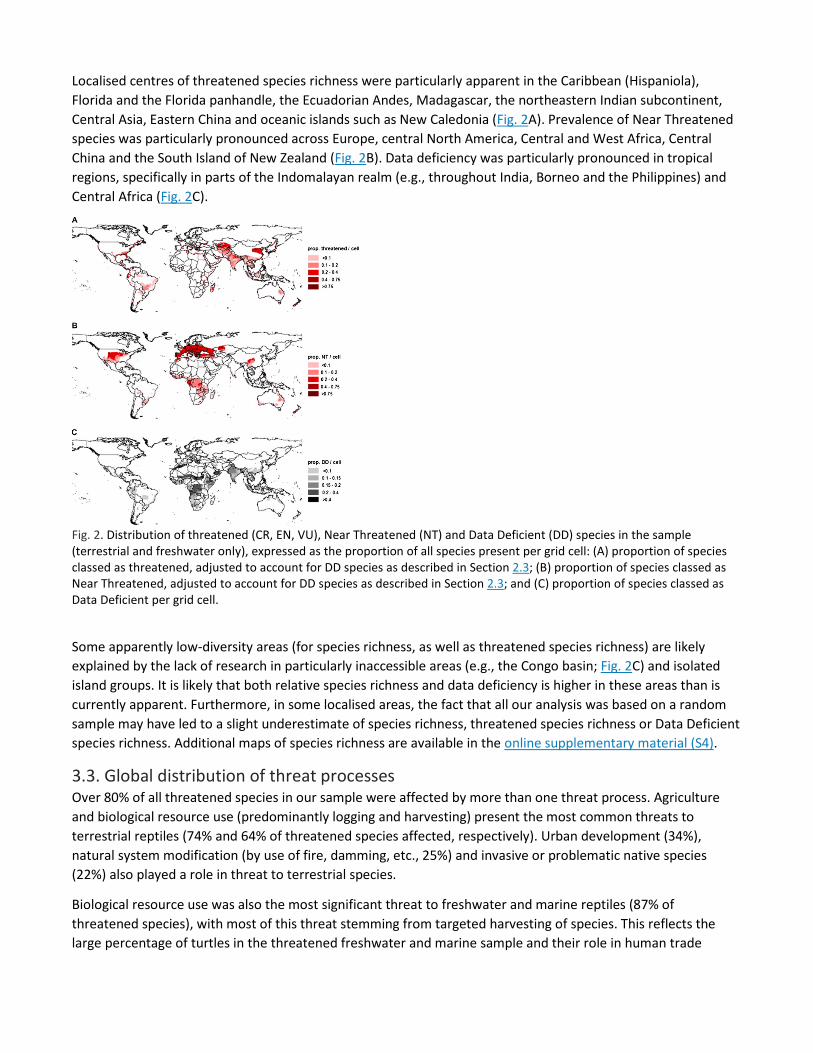
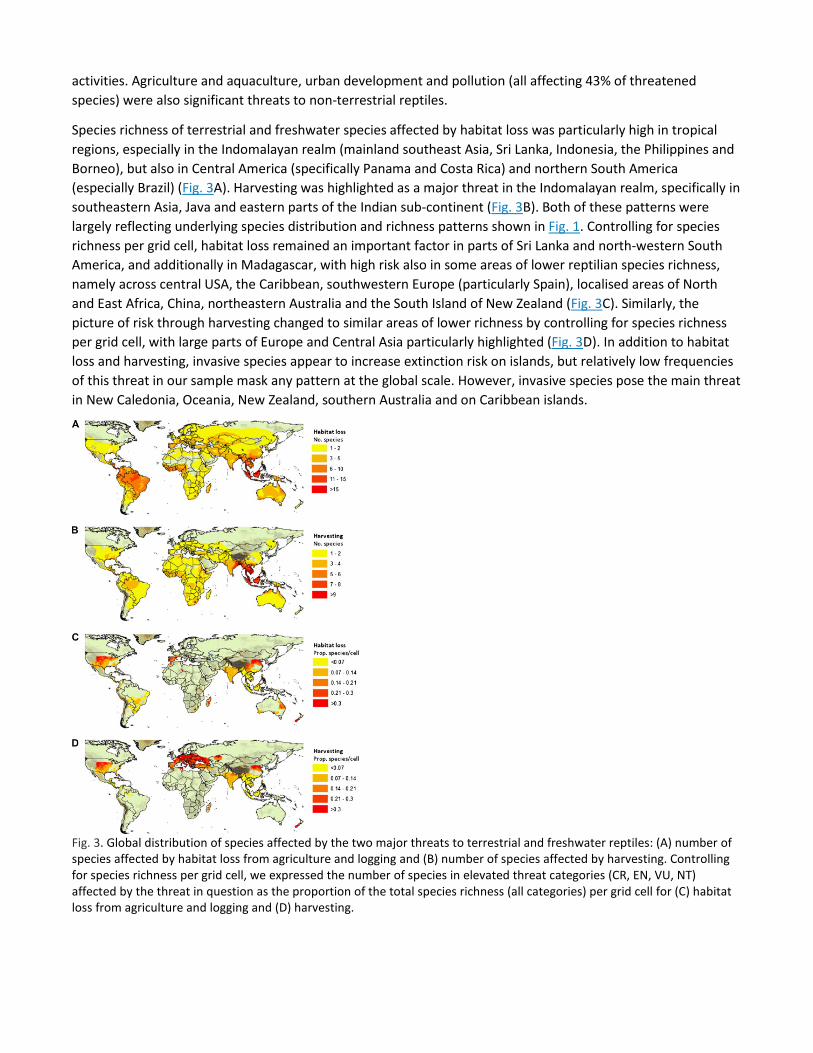
Species richness of terrestrial and freshwater species affected by habitat loss was particularly high in tropical regions, especially in the Indomalayan realm (mainland southeast Asia, Sri Lanka, Indonesia, the Philippines and Borneo), but also in Central America (specifically Panama and Costa Rica) and northern South America (especially Brazil) (Fig. 3A). Harvesting was highlighted as a major threat in the Indomalayan realm, specifically in southeastern Asia, Java and eastern parts of the Indian sub-continent (Fig. 3B). Both of these patterns were largely reflecting underlying species distribution and richness patterns shown in Fig. 1. Controlling for species richness per grid cell, habitat loss remained an important factor in parts of Sri Lanka and north-western South America, and additionally in Madagascar, with high risk also in some areas of lower reptilian species richness, namely across central USA, the Caribbean, southwestern Europe (particularly Spain), localised areas of North and East Africa, China, northeastern Australia and the South Island of New Zealand (Fig. 3C). Similarly, the picture of risk through harvesting changed to similar areas of lower richness by controlling for species richness per grid cell, with large parts of Europe and Central Asia particularly highlighted (Fig. 3D). In addition to habitat loss and harvesting, invasive species appear to increase extinction risk on islands, but relatively low frequencies of this threat in our sample mask any pattern at the global scale. However, invasive species pose the main threat in New Caledonia, Oceania, New Zealand, southern Australia and on Caribbean islands.
Fig. 3. Global distribution of species affected by the two major threats to terrestrial and freshwater reptiles: (A) number of species affected by habitat loss from agriculture and logging and (B) number of species affected by harvesting. Controlling for species richness per grid cell, we expressed the number of species in elevated threat categories (CR, EN, VU, NT) affected by the threat in question as the proportion of the total species richness (all categories) per grid cell for (C) habitat loss from agriculture and logging and (D) harvesting.
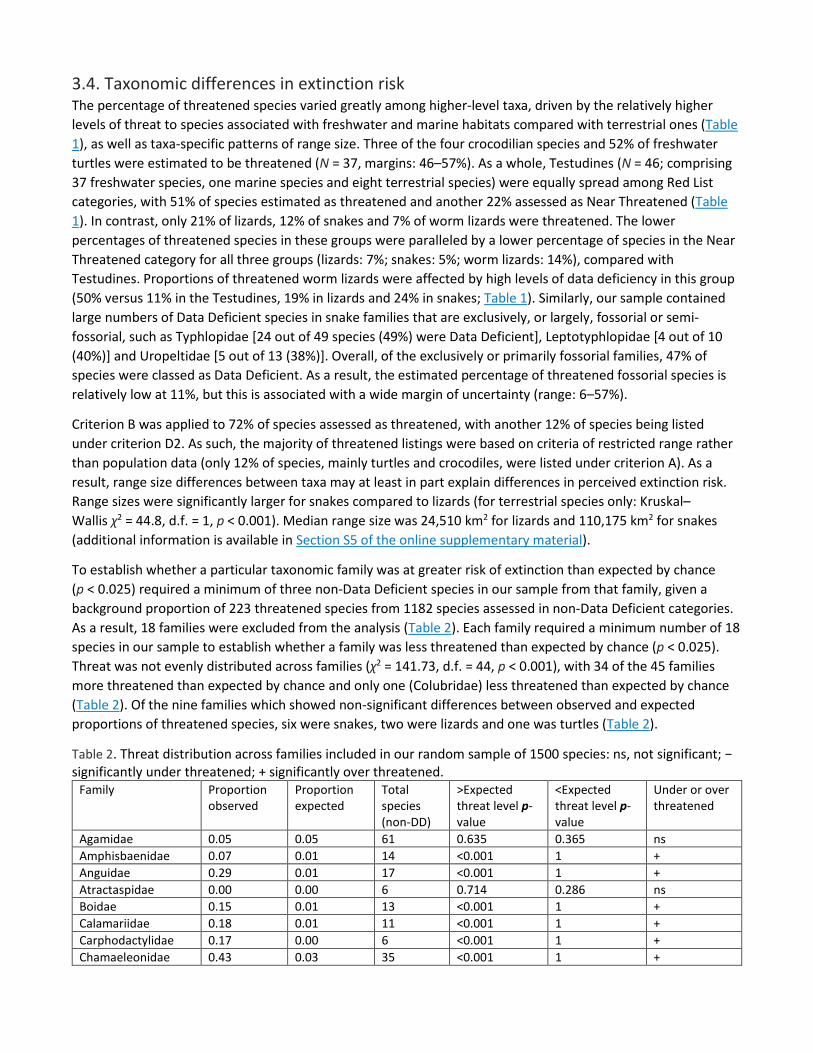
3.4. Taxonomic differences in extinction risk The percentage of threatened species varied greatly among higher-level taxa, driven by the relatively higher levels of threat to species associated with freshwater and marine habitats compared with terrestrial ones (Table 1), as well as taxa-specific patterns of range size. Three of the four crocodilian species and 52% of freshwater turtles were estimated to be threatened (N = 37, margins: 46–57%). As a whole, Testudines (N = 46; comprising 37 freshwater species, one marine species and eight terrestrial species) were equally spread among Red List categories, with 51% of species estimated as threatened and another 22% assessed as Near Threatened (Table 1). In contrast, only 21% of lizards, 12% of snakes and 7% of worm lizards were threatened. The lower percentages of threatened species in these groups were paralleled by a lower percentage of species in the Near Threatened category for all three groups (lizards: 7%; snakes: 5%; worm lizards: 14%), compared with Testudines. Proportions of threatened worm lizards were affected by high levels of data deficiency in this group (50% versus 11% in the Testudines, 19% in lizards and 24% in snakes; Table 1). Similarly, our sample contained large numbers of Data Deficient species in snake families that are exclusively, or largely, fossorial or semi-fossorial, such as Typhlopidae [24 out of 49 species (49%) were Data Deficient], Leptotyphlopidae [4 out of 10 (40%)] and Uropeltidae [5 out of 13 (38%)]. Overall, of the exclusively or primarily fossorial families, 47% of species were classed as Data Deficient. As a result, the estimated percentage of threatened fossorial species is relatively low at 11%, but this is associated with a wide margin of uncertainty (range: 6–57%).
Criterion B was applied to 72% of species assessed as threatened, with another 12% of species being listed under criterion D2. As such, the majority of threatened listings were based on criteria of restricted range rather than population data (only 12% of species, mainly turtles and crocodiles, were listed under criterion A). As a result, range size differences between taxa may at least in part explain differences in perceived extinction risk. Range sizes were significantly larger for snakes compared to lizards (for terrestrial species only: Kruskal–Wallis χ2 = 44.8, d.f. = 1, p < 0.001). Median range size was 24,510 km2 for lizards and 110,175 km2 for snakes (additional information is available in Section S5 of the online supplementary material).
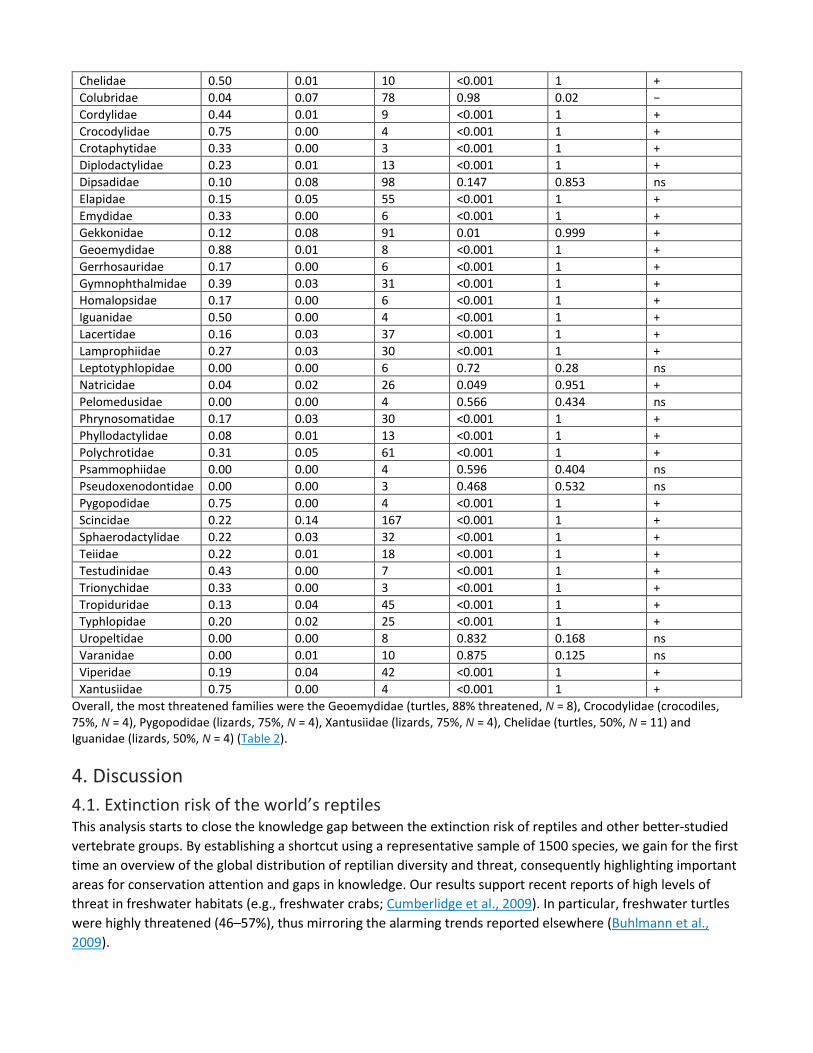
To establish whether a particular taxonomic family was at greater risk of extinction than expected by chance (p < 0.025) required a minimum of three non-Data Deficient species in our sample from that family, given a background proportion of 223 threatened species from 1182 species assessed in non-Data Deficient categories. As a result, 18 families were excluded from the analysis (Table 2). Each family required a minimum number of 18 species in our sample to establish whether a family was less threatened than expected by chance (p < 0.025). Threat was not evenly distributed across families (χ2 = 141.73, d.f. = 44, p < 0.001), with 34 of the 45 families more threatened than expected by chance and only one (Colubridae) less threatened than expected by chance (Table 2). Of the nine families which showed non-significant differences between observed and expected proportions of threatened species, six were snakes, two were lizards and one was turtles (Table 2).
Table 2. Threat distribution across families included in our random sample of 1500 species: ns, not significant; − significantly under threatened; + significantly over threatened.
Family Proportion observed
Proportion expected
Total species (non-DD)
>Expected threat level p-value
<Expected threat level p-value
Under or over threatened
Agamidae 0.05 0.05 61 0.635 0.365 ns Amphisbaenidae 0.07 0.01 14 <0.001 1 + Anguidae 0.29 0.01 17 <0.001 1 + Atractaspidae 0.00 0.00 6 0.714 0.286 ns Boidae 0.15 0.01 13 <0.001 1 + Calamariidae 0.18 0.01 11 <0.001 1 + Carphodactylidae 0.17 0.00 6 <0.001 1 + Chamaeleonidae 0.43 0.03 35 <0.001 1 +
Chelidae 0.50 0.01 10 <0.001 1 + Colubridae 0.04 0.07 78 0.98 0.02 − Cordylidae 0.44 0.01 9 <0.001 1 + Crocodylidae 0.75 0.00 4 <0.001 1 + Crotaphytidae 0.33 0.00 3 <0.001 1 + Diplodactylidae 0.23 0.01 13 <0.001 1 + Dipsadidae 0.10 0.08 98 0.147 0.853 ns Elapidae 0.15 0.05 55 <0.001 1 + Emydidae 0.33 0.00 6 <0.001 1 + Gekkonidae 0.12 0.08 91 0.01 0.999 + Geoemydidae 0.88 0.01 8 <0.001 1 + Gerrhosauridae 0.17 0.00 6 <0.001 1 + Gymnophthalmidae 0.39 0.03 31 <0.001 1 + Homalopsidae 0.17 0.00 6 <0.001 1 + Iguanidae 0.50 0.00 4 <0.001 1 + Lacertidae 0.16 0.03 37 <0.001 1 + Lamprophiidae 0.27 0.03 30 <0.001 1 + Leptotyphlopidae 0.00 0.00 6 0.72 0.28 ns Natricidae 0.04 0.02 26 0.049 0.951 + Pelomedusidae 0.00 0.00 4 0.566 0.434 ns Phrynosomatidae 0.17 0.03 30 <0.001 1 + Phyllodactylidae 0.08 0.01 13 <0.001 1 + Polychrotidae 0.31 0.05 61 <0.001 1 + Psammophiidae 0.00 0.00 4 0.596 0.404 ns Pseudoxenodontidae 0.00 0.00 3 0.468 0.532 ns Pygopodidae 0.75 0.00 4 <0.001 1 + Scincidae 0.22 0.14 167 <0.001 1 + Sphaerodactylidae 0.22 0.03 32 <0.001 1 + Teiidae 0.22 0.01 18 <0.001 1 + Testudinidae 0.43 0.00 7 <0.001 1 + Trionychidae 0.33 0.00 3 <0.001 1 + Tropiduridae 0.13 0.04 45 <0.001 1 + Typhlopidae 0.20 0.02 25 <0.001 1 + Uropeltidae 0.00 0.00 8 0.832 0.168 ns Varanidae 0.00 0.01 10 0.875 0.125 ns Viperidae 0.19 0.04 42 <0.001 1 + Xantusiidae 0.75 0.00 4 <0.001 1 +
Overall, the most threatened families were the Geoemydidae (turtles, 88% threatened, N = 8), Crocodylidae (crocodiles, 75%, N = 4), Pygopodidae (lizards, 75%, N = 4), Xantusiidae (lizards, 75%, N = 4), Chelidae (turtles, 50%, N = 11) and Iguanidae (lizards, 50%, N = 4) (Table 2).
4. Discussion 4.1. Extinction risk of the world’s reptiles This analysis starts to close the knowledge gap between the extinction risk of reptiles and other better-studied vertebrate groups. By establishing a shortcut using a representative sample of 1500 species, we gain for the first time an overview of the global distribution of reptilian diversity and threat, consequently highlighting important areas for conservation attention and gaps in knowledge. Our results support recent reports of high levels of threat in freshwater habitats (e.g., freshwater crabs; Cumberlidge et al., 2009). In particular, freshwater turtles were highly threatened (46–57%), thus mirroring the alarming trends reported elsewhere (Buhlmann et al., 2009).
Some authors have argued that reptiles are undergoing similar declines to those experienced by amphibians, in terms of taxonomic breadth, geographic scope and severity (Gibbons et al., 2000). On a global scale, our assessment shows that threat levels are more severe in amphibians (42% of amphibians are threatened, assuming Data Deficient species are threatened in the same proportion as non-Data Deficient species) relative to reptiles (20%). Overall, threat levels in reptiles are slightly lower than those observed in other taxa such as mammals and freshwater fish (both 25% threatened; Collen, B., unpublished data; Hoffmann et al., 2010), but higher than in birds (13%; IUCN, 2011a). Estimates of 5% for Near Threatened species were similar to those observed in other vertebrate species groups, such as mammals, amphibians (6% each) and freshwater fishes (4%).
Recently reported local declines in snake and lizard populations (Cagle, 2008, Reading et al., 2010, Sinervo et al., 2010) suggest localised elevated extinction risks for both taxa. While we estimate that about one in five lizard species is threatened with extinction, only 12% of snakes were estimated to be threatened with extinction. One barrier to listing, which could be partly responsible for the discrepancy between our analysis and those of snake population trends, is that in the majority of cases there are sufficient data on species distributions only, rather than population trends, at a global scale. Therefore the majority of reptilian species were listed under criteria B and D2 (restricted range). The differences in extinction risk between snakes and lizards may therefore be partly explained by the fact that snakes in our sample (and in previous studies, e.g., Anderson and Marcus, 1992) had larger ranges than lizards. Local population declines such as those reported by Sinervo et al. (2010) are evaluated with finer scale population data than those used to evaluate extinction risk, so could serve as a warning sign of what is to come. In order to understand more fully what is happening to the world’s snakes, it is vital that we obtain better global population data for this species group. Based on range size estimation alone, we may be missing ongoing declines which are occurring at sub-threshold levels and thus underestimating extinction risk to this particular species group. Furthermore, snakes are morphologically more conservative and harder to sample (fewer specimens are generally available compared to lizards) which, compared to lizards, makes it harder to detect cryptic species. Thus, larger ranges for some snake species may be masking the range of one or more cryptic species.
4.2. Data deficiency: addressing the knowledge gap High proportions of data deficiency can significantly hinder our understanding of threat, yet such uncertainty is apparent in many species groups that have been assessed to date. Levels of data deficiency in reptiles (21%) were lower than those reported for amphibians (25%; IUCN, 2011a), dragonflies and damselflies (35%; Clausnitzer et al., 2009) and freshwater crabs (49%; Cumberlidge et al., 2009), but still exceeded those of the more charismatic or conspicuous birds and mammals (less than 1% and 15% respectively; BirdLife International, 2008b, Schipper et al., 2008). Patterns of regional or taxonomical data deficiency could be used to prompt research programmes on specific local faunas or taxonomical groups. For example, data deficiency in reptiles was highest in tropical regions and in exclusively fossorial or semi-fossorial reptiles such as the Amphisbaenia. Similar patterns have been observed in amphibians, where approximately two-thirds of caecilians were classified as Data Deficient (Gower et al., 2005), despite estimates that fossorial species potentially comprise around 20% of the world’s herpetofauna (Measey, 2006). It is clear that research attention should focus specifically on fossorial and other elusive taxa (e.g., arboreal species) in order to reduce rates of data deficiency during the course of future re-assessments of the sample.
4.3. Conservation prioritisation: lessons from the world’s reptiles Conservation priorities often focus on regions of high biodiversity value and/or high threat to effectively target conservation funds (Brooks et al., 2006). The assessment of biodiversity value often relies on the distribution patterns of certain indicator taxa (e.g., birds), and the effectiveness of the resulting prioritisation mechanism greatly depends on the degree to which such distribution patterns are congruent with those of other taxa.
However, cross-taxon congruence varies with given metrics of biodiversity (Grenyer et al., 2006). While reptilian species richness broadly mirrored species richness patterns observed in mammals, amphibians and birds (BirdLife International, 2008a, Schipper et al., 2008, Stuart et al., 2004), additional areas rich in reptiles (e.g., around the Gulf of Guinea and southern Africa) or threatened reptiles (e.g., islands such as Hispaniola, Sri Lanka, New Caledonia) were highlighted in our assessment and may be overlooked if conservation priorities are set based on patterns in a small number of non-reptilian taxa alone. This has also recently been demonstrated for Australian lizards (Powney et al., 2010). Thus far, both amphibians and reptiles have been greatly overlooked in reserve selection strategies based on coarse-scale biodiversity surrogate measures (Araújo et al., 2001). Our results provide the opportunity for a more representative view of biodiversity to be compiled in order to benefit multiple taxa.
Assessing the global distribution of threat processes, both current and projected, has the potential to provide another powerful tool for conservation prioritization. While for some taxa, the distribution of predominant threats significantly overlaps areas of high species richness (e.g., amphibians, Hof et al., 2011), other studies have shown incongruence between threat distribution and endemic or threatened species richness (e.g., Grenyer et al., 2006, Lee and Jetz, 2008, Orme et al., 2005); however, the latter has traditionally been favoured as a selection tool for conservation priority areas. Similarly, distributions of different threat types may not always spatially overlap (Hof et al., 2011), so that effective mitigation strategies have to be developed in a spatially explicit context in order to reduce extinction risk of species. Reptiles in general are particularly sensitive to habitat degradation because of their comparatively low dispersal ability, morphological specialisation on substrate type, relatively small home ranges and thermoregulatory constraints (Kearney et al., 2009). Clearly, the distribution and severity of threat processes, such as habitat loss from agricultural conversion, logging and over-exploitation, will shape the future fortune of reptiles. Identifying centres of threat, and tackling the origins and effects of anthropogenic threats in these regions through targeted projects (particularly in areas affected by multiple threat processes such as Southeast Asia) will allow more proactive action to be taken to secure the future of reptiles. At the moment the spatial resolution of our species-specific maps of threat processes is still somewhat coarse and allows only the depiction of broad patterns in threat distribution, but future developments and refinements of the method are likely to provide a powerful tool with which to focus threat-specific mitigation projects.
4.4. Reptile conservation: the next steps This study provides a first step in assessing the global extinction risk of reptiles by employing a short-cut method based on a representative sample of 1500 species. While this assessment feeds into broader scale assessments of biodiversity as a whole, as part of the Sampled Red List Index project (Baillie et al., 2008), it is also important to feed this information into similar regional assessments, since concrete policy decisions are generally being taken at sub-global levels. Specifically, it is important that the data presented here is used to assess how existing and planned protected areas are benefitting the world’s reptiles. This will allow us to identify species which at present fall outside protected areas and are most in need of conservation actions, and address the fact that the world’s herpetofauna is still often overlooked when conservation decisions are taken. The Global Reptile Assessment (GRA) is currently carrying out assessments via regional workshops, which bring together species experts to discuss extinction risk and conservation priorities. For example, the recent assessment of Madagascan snakes and lizards has helped in evaluating the effectiveness of protected areas for reptiles, with new conservation areas being designated across the island aiming to provide protection to some of the most threatened species (IUCN, 2011b).
While the extensive expert network established during this project is undoubtedly going to feed into global and regional assessment projects, regional data gaps are apparent. It is vital that these are addressed in order to complete our picture of the distribution and extinction risk patterns of reptiles, so that conservation actions can
be targeted at regions and areas most in need. Specifically, surveys are needed for key areas (e.g., areas rich in Data Deficient reptiles) and species (e.g., possibly extinct and Data Deficient species; establishing snake population time series to complement distribution data) in order to fill knowledge gaps and to build regional survey capacity via collaborations and targeted capacity building projects.
While we have established a snapshot of the current status of reptiles worldwide, it is now vital to establish trends in this status in order to gauge the rate of change in reptilian extinction risk over time. The next step is to establish a baseline for reptilian extinction risk against which we can compare current status as well as future re-assessments of the sample. This information is vital in order to assess our progress toward global biodiversity targets, such as the Aichi targets and the Millennium Development Goals, and fuel efforts to address the conservation needs of reptiles.
Acknowledgements MB and MR were funded by a grant from the Esmée Fairbairn Foundation, BC by the Rufford Foundation. North American and Mexican species assessments were funded by the Regina Bauer Frankenberg Foundation for Animal Welfare. Species assessments under the Global Reptile Assessment (GRA) initiative are supported by: Moore Family Foundation, Gordon and Betty Moore Foundation, Conservation International, Critical Ecosystem Partnership Fund (CEPF), and European Commission. Additional acknowledgements are included in the online supplementary material.
The assessment workshop for Mexican reptiles was kindly hosted by Ricardo Ayala and the station personnel of the Estación de Biología Chamela, Instituto de Biología, Universidad Nacional Autonoma de Mexico. Workshop and logistical organisation of the Philippines assessments was provided by the Conservation International Philippines Office, in particular Ruth Grace Rosell-Ambal, Melizar V. Duya and Oliver Coroza. Workshop and logistical organisation for the European Reptile and Amphibian Assessments was provided by Doğa Derneği, in particular Özge Balkiz and Özgür Koç. Workshop and logistical organisation for assessments of sea snakes and homalopsids was provided by the International Sea Turtle Symposium and Dr. Colin Limpus (Australian Government Environmental Protection Agency). Special thanks to Jenny Chapman (EPA) and Chloe Schauble (ISTS). Thank you also to Dr. Gordon Guymer (Chief Botanist – Director of Herbarium) for accommodating us at the Herbarium in the Brisbane Botanical Gardens, and Mark Read and Kirsten Dobbs (Great Barrier Reef Marine Parks Association) and Dave Pollard and Brad Warren (OceanWatch Australia) for institutional support. Mohamed Bin Zayed Species Conservation Fund, Conservation International Madagascar and the Darwin Initiative contributed to funding the costs of the Madagascar reptile workshop.
We would also particularly like to thank all our assessors and the following people who helped with the compilation and finalisation of SRLI Red List assessments and distribution maps: Jennifer Sears, Gary Powney, Paul Lintott, Sarah Lewis, Penny Wilson, Maiko Lutz, Felix Whitton, Ranmali de Silva and Harriet Milligan. For facilitating working groups at GRA and other workshops: Melanie Bilz, Thomas Brooks, Oliver Coroza, Naamal De Silva, Melizar V. Duya, Michael Jensen, Jason Van de Merwe, Kate Hodges, Matthew Foster, Penny Langhammer, Seema Mundoli, Ana Nieto, Lily Paniagua, Ruth Grace Rosell-Ambal, Jan Schipper and Sarah Wyatt.
Shai Meiri, Lital Dabool, Anat Feldman, Yuval Itescu, Amy Kadison, Erez Maze, Maria Novosolov, Lian Pin Koh and other anonymous reviewers commented on and helped to greatly improve an earlier version of this manuscript.
References Adalsteinsson et al., 2009 S.A. Adalsteinsson, W.R. Branch, S. Trape, L.J. Vitt, S.B. Hedges Molecular phylogeny,
classification, and biogeography of snakes of the Family Leptotyphlopidae (Reptilia, Squamata) Zootaxa, 2244 (2009), pp. 1-50
Anderson, 1984 S. Anderson Aerography of North American fishes, amphibians, and reptiles American Museum Novitates, 2802 (1984), pp. 1-6
Anderson and Marcus, 1992 Anderson, S., Marcus, L.F., 1992. Aerography of Australian Tetrapods. Australian Journal of Zoology 40, 627-651.
Araújo et al., 2001 M.B. Araújo, C.J. Humphries, P.J. Densham, R. Lampinen, W.J.M. Hagemeijer, A.J. Mitchell-Jones, J.P. Gasc Would environmental diversity be a good surrogate for species diversitys Ecography, 24 (2001), pp. 103-110
Baillie et al., 2008 J.E.M. Baillie, B. Collen, R. Amin, H.R. Akcakaya, S.H.M. Butchart, N. Brummitt, T.R. Meagher, M. Ram, C. Hilton-Taylor, G.M. Mace Towards monitoring global biodiversity Conservation Letters, 1 (2008), pp. 18-26
Bates et al., in press Bates, M.F., Branch, W.R., Bauer, A.M., Burger, M., Marais, J., Alexander, G.J., de Villiers, M.S. (Eds.), in press. Atlas and Red List of the reptiles of South Africa, Lesotho and Swaziland. South African National Biodiversity Institute, Pretoria, South Africa.
Bielby et al., 2006 J. Bielby, A.A. Cunningham, A. Purvis Taxonomic selectivity in amphibians: ignorance, geography or biology? Animal Conservation, 9 (2006), pp. 135-143
BirdLife International, 2008a BirdLife International, 2008a. State of the world’s birds: indicators for our changing world. BirdLife International, Cambridge, UK.
BirdLife International, 2008b BirdLife International, 2008b. State of the world’s birds: indicators for our changing world. BirdLife International, Cambridge, UK.
Brooks et al., 2006 T.M. Brooks, R.A. Mittermeier, G.A.B. da Fonseca, J. Gerlach, M. Hoffmann, J.F. Lamoreux, C.G. Mittermeier, J.D. Pilgrim, A.S.L. Rodrigues Global biodiversity conservation priorities Science, 313 (2006), pp. 58-61
Buhlmann et al., 2009 K.A. Buhlmann, T.S.B. Akre, J.B. Iverson, D. Karapatakis, R.A. Mittermeier, A. Georges, A.G.J. Rhodin, P.P. van Dijk, J.W. Gibbons A global analysis of tortoise and freshwater turtle distributions with identification of regional priority conservation areas Chelonian Conservation and Biology, 8 (2009), pp. 116-149
Butchart and Bird, 2010 S.H.M. Butchart, J.P. Bird Data Deficient birds on the IUCN Red List: what don’t we know and why does it matter? Biological Conservation, 143 (2010), pp. 239-247
Cagle, 2008 N.L. Cagle Snake species distributions and temperate grasslands: a case study from the American tallgrass prairie Biological Conservation, 141 (2008), pp. 744-755
Cardillo and Meijaard, 2011 M. Cardillo, E. Meijaard Are comparative studies of extinction risk useful for conservation? Trends in Ecology & Evolution, 27 (2011), pp. 167-171
Clausnitzer et al., 2009 V. Clausnitzer, V.J. Kalkman, M. Ram, B. Collen, J.E.M. Baillie, M. Bedjanic, W.R.T. Darwall, K.-D.B. Dijkstra, R. Dow, J. Hawking, H. Karube, E. Malikova, D. Paulson, K. Schütte, F. Suhling, R. Villanueva, N. von Ellenrieder, K. Wilson Odonata enter the biodiversity crisis debate: the first global assessment of an insect group Biological Conservation, 142 (2009), pp. 1864-1869
Collen et al., 2011 B. Collen, S.T. Turvey, C. Waterman, H.M.R. Meredith, T.S. Kuhn, J.E.M. Baillie, N.J.B. Isaac Investing in evolutionary history: implementing a phylogenetic approach for mammal conservation Philosophical Transactions of the Royal Society of London B, 366 (2011), pp. 2611-2622
Cox and Temple, 2009 N.A. Cox, H.J. Temple European Red List of Reptiles Office for Official Publications of the European Communities, Luxembourg (2009)
Cumberlidge et al., 2009 N. Cumberlidge, P.K.L. Ng, D.C.J. Yeo, C. Magalhães, M.R. Campos, F. Alvarez, T. Naruse, S.R. Daniels, L.J. Esser, F.Y.K. Attipoe, F.-L. Clotilde-Ba, W. Darwall, A. McIvor, J.E.M. Baillie, B. Collen, M. Ram Freshwater crabs and the biodiversity crisis: importance, threats, status, and conservation challenges Biological Conservation, 142 (2009), pp. 1665-1673
Gibbons et al., 2000 J.W. Gibbons, D.E. Scott, T.J. Ryan, T.D. Buhlmann, B.S. Metts, J.L. Greene, T. Mills, Y. Leiden, S. Poppy, C.T. Wine The global decline of reptiles, déjà vu amphibians BioScience, 50 (2000), pp. 653-666
Gower et al., 2005 D.J. Gower, S.N. Stuart, G. Bhatta, N. Cox, J. Gerlach, S.P. Loader, J. Long, J.D. Lynch, G.J. Measey, R.A. Nussbaum, O.V. Oommen, K. Manamendra-Arachchi, M.S. Ravichandran, M. Wilkinson, B.E. Young Caecilians and the 2004 global amphibian assessment Conservation Biology, 19 (2005), pp. 54-55
Grenyer et al., 2006 R. Grenyer, C.D.L. Orme, S.F. Jackson, G.H. Thomas, R.G. Davies, T.J. Davies, K.E. Jones, V.A. Olson, R.S. Ridgely, P.C. Rasmussen, T.-S. Ding, P.M. Bennett, T.M. Blackburn, K.J. Gaston, J.L. Gittleman, I.P.F. Owens Global distribution and conservation of rare and threatened vertebrates Nature, 444 (2006), pp. 93-96
Han et al., 2004 D. Han, K. Zhou, A.M. Bauer Phylogenetic relationships among gekkotan lizards inferred from Cmos nuclear DNA sequences and a new classification of the Gekkota Biological Journal of the Linnean Society, 83 (2004), pp. 353-368
Hedges and Poling, 1999 S.B. Hedges, L.L. Poling A molecular phylogeny of reptiles Science, 283 (1999), pp. 998-1001
Hof et al., 2011 C. Hof, M.B. Araújo, W. Jetz, C. Rahbek Additive threats from pathogens, climate and land-use change for global amphibian diversity Nature, 480 (2011), pp. 516-519
Hoffmann et al., 2010 M. Hoffmann, C. Hilton-Taylor, A. Angulo, M. Böhm, T.M. Brooks, S.H.M. Butchart, K.E. Carpenter, J. Chanson, B. Collen, N.A. Cox, W.R.T. Darwall, N.K. Dulvy, L.R. Harrison, V. Katariya, C.M. Pollock, S. Quader, N.I. Richman, A.S.L. Rodrigues, M.F. Tognelli, J.-C. Vié, et al. The impact and shortfall of conservation on the status of the world’s vertebrates Science, 330 (2010), pp. 1503-1509
IUCN, 2001 IUCN, 2001. IUCN Red List Categories and Criteria: Version 3.1. IUCN, Gland, Switzerland. IUCN, 2011a IUCN, 2011a. The IUCN Red List of Threatened Species 2011.2. IUCN, 2011b IUCN, 2011b. News release (10/11/2011): another leap towards the barometer of life. IUCN, Gland,
Switzerland. <http://www.iucnredlist.org/news/another-leap-towards-the-barometer-of-life>. Kearney et al., 2009 M. Kearney, R. Shine, W.P. Porter The potential for behavioral thermoregulation to buffer
“cold-blooded” animals against climate warming Proceedings of the National Academy of Sciences USA, 106 (2009), pp. 3835-3840
Lee and Jetz, 2008 T.M. Lee, W. Jetz Future battlegrounds for conservation under global change Proceedings of the Royal Society B – Biological Sciences, 275 (2008), pp. 1261-1270
Mace et al., 2008 G.M. Mace, N.J. Collar, K.J. Gaston, C. Hilton-Taylor, H.R. Akcakaya, N. Leader-Williams, E.J. Milner-Gulland, S.N. Stuart Quantification of extinction risk: IUCN’s system for classifying threatened species Conservation Biology, 22 (2008), pp. 1424-1442
Measey, 2006 G.J. Measey Surveying biodiversity of soil herpetofauna: towards a standard quantitative methodology European Journal of Soil Biology, 42 (2006), pp. S103-S110
Nagy et al., 2012 Z.T. Nagy, G. Sonet, F. Glaw, M. Vences First large-scale DNA barcoding assessment of reptiles in the biodiversity hotspot of Madagascar, based on newly designed COI primers PLos One, 7 (2012), p. e34506
Oliver et al., 2009 P.M. Oliver, M. Adams, M.S.Y. Lee, M.N. Hutchinson, P. Doughty Cryptic diversity in vertebrates: molecular data double estimates of species diversity in a radiation of Australian lizards (Diplodactylus, Gekkota) Proceedings of the Royal Society B – Biological Sciences, 276 (2009), pp. 2001-2007
Orme et al., 2005 C.D.L. Orme, R.G. Davies, M. Burgess, F. Eigenbrod, N. Pickup, V.A. Olson, A.J. Webster, T.S. Ding, P.C. Rasmussen, R.S. Ridgely, A.J. Stattersfield, P.M. Bennett, T.M. Blackburn, K.J. Gaston, I.P.F. Owens Global hotspots of species richness are not congruent with endemism or threat Nature, 436 (2005), pp. 1016-1019
Powney et al., 2010 G.D. Powney, R. Grenyer, C.D.L. Orme, I.P.F. Owens, S. Meiri Hot, dry and different: Australian lizard richness is unlike that of mammals, amphibians and birds Global Ecology and Biogeography, 19 (2010), pp. 386-396
R Development Core Team, 2007 R Development Core Team, 2007. R: a language and environment for statistical computing. R Foundation for Statistical Computing, Vienna, Austria.
Raxworthy et al., 2008 C.J. Raxworthy, R.G. Pearson, B.M. Zimkus, S. Reddy, A.J. Deo, R.A. Nussbaum, C.M. Ingram Continental speciation in the tropics: contrasting biogeographic patterns of divergence in the Uroplatus leaf-tailed gecko radiation of Madagascar Journal of Zoology, 275 (2008), pp. 423-440
Read, 1998 J.L. Read Are geckos useful bioindicators of air pollution? Oecologia, 114 (1998), pp. 180-187 Reading et al., 2010
C.J. Reading, L.M. Luiselli, G.C. Akani, X. Bonnet, G. Amori, J.M. Ballouard, E. Filippi, G. Naulleau, D. Pearson, L. Rugiero Are snake populations in widespread decline? Biology Letters, 6 (2010), pp. 777-780
Reisz et al., 2011 R.R. Reisz, S.P. Modesto, D.M. Scott A new early permian reptile and its significance in early diapsid evolution Proceedings of the Royal Society B-Biological Sciences, 278 (2011), pp. 3731-3737
Salafsky et al., 2008 N. Salafsky, D. Salzer, A.J. Stattersfield, C. Hilton-Taylor, R. Neugarten, S.H.M. Butchart, B. Collen, N. Cox, L.L. Master, S. O’Connor, D. Wilkie A standard lexicon for biodiversity conservation: unified classifications of threats and actions Conservation Biology, 22 (2008), pp. 897-911
Schipper et al., 2008 J. Schipper, J.S. Chanson, F. Chiozza, N.A. Cox, M. Hoffmann, V. Katariya, J. Lamoreux, A.S.L. Rodrigues, S.N. Stuart, H.J. Temple, J. Baillie, L. Boitani, T.E. Lacher, R.A. Mittermeier, A.T. Smith, D. Absolon, J.M. Aguiar, G. Amori, N. Bakkour, R. Baldi, et al. The status of the world’s land and marine mammals: diversity, threat, and knowledge Science, 322 (2008), pp. 225-230
Sinervo et al., 2010 B. Sinervo, F. Méndez-de-la-Cruz, D.B. Miles, B. Heulin, E. Bastiaans, M. Villagrán-Santa Cruz, R. Lara-Resendiz, N. Martínez-Méndez, M.L. Calderón-Espinosa, R.N. Meza-Lázaro, H. Gadsden, L.J. Avila, M. Morando, I.J. De la Riva, P.V. Sepulveda, C.F. Duarte Rocha, N. Ibargüengoytía, C. Aguilar Puntriano, M. Massot, V. Lepetz, et al. Erosion of lizard diversity by climate change and altered thermal niches Science, 328 (2010), pp. 894-899
Stuart et al., 2004 S.N. Stuart, J.S. Chanson, N.A. Cox, B.E. Young, A.S. Rodrigues, D.L. Fischman, R.W. Waller Status and trends of amphibian declines and extinctions worldwide Science, 306 (2004), pp. 1783-1786
Todd et al., 2010 B.D. Todd, J.D. Willson, J.W. Gibbon The global status of reptiles and causes of their decline D.W. Sparling, G. Linder, C.A. Bishop, S. Krest (Eds.), Ecotoxicology of Amphibians and Reptiles (second ed.), CRC Press, Boca Raton, USA (2010)
Uetz, 2010 P. Uetz The original descriptions of reptiles Zootaxa, 2334 (2010), pp. 59-68 van Tuinen and Hadly, 2004 M. van Tuinen, E.A. Hadly Error in estimation of rate and time inferred from the
early amniote fossil record and avian molecular clocks Journal of Molecular Evolution, 59 (2004), pp. 267-276
Vidal and Hedges, 2009 N. Vidal, S.B. Hedges The molecular evolutionary tree of lizards, snakes, and amphisbaenians Comptes Rendus Biologies, 332 (2009), pp. 129-139
Zaher et al., 2009 H. Zaher, F.G. Grazziotin, J.E. Cadle, R.W. Murphy, J.C. de Moura-Leite, S.L. Bonatto Molecular phylogeny of advanced snakes (Serpentes, Caenophidia) with an emphasis on South American Xenodontines: a revised classification and descriptions of new taxa Papéis Avulsos de Zoologia, 49 (2009), pp. 115-153