Embed Size (px)
Citation preview
07.07' סדרת ניירות לדיון מס
The Construct Validity of Schein's Career Anchors
Orientation Inventory By
*Nira Danziger *Dalia Rachman-Moore *Rony Valency
*The authors' names are listed in alphabetical order. Nira Danziger The College of Management, Academic Studies, School of Business Administration, 7 Rabin Blvd., P.O.B 25073, Rishon Le-Zion, Israel 75190 Dalia Rachman-Moore The College of Management, Academic Studies, School of Business Administration, 7 Rabin Blvd., P.O.B 25073, Rishon Le-Zion, Israel 75190 Rony Valency The College of Management, Academic Studies, School of Business Administration, 7 Rabin Blvd., P.O.B 25073, Rishon Le-Zion, Israel 75190 August 2007
______________________________________________________________________ The research was supported by the Research Unit at The School of Business Administration, The College of Management, Academic Studies.
1

The Construct Validity of Schein's Career Anchors Orientation Inventory.
Abstract
Purpose
The purpose of this paper is to test the construct validity of the measurement model of
Schein's Career Orientation Inventory (1990) where entrepreneurship and creativity
constitute two separate constructs.
Design
A fairly representative sample of 1,847 Israeli working adults completed Schein's
Career Anchor Inventory (COI) questionnaire. The data was subjected to
confirmatory factor analysis to compare the fit of the proposed nine-construct model
to Schein's eight
Findings
The findings demonstrate that a) the proposed nine-construct model of the COI,
which distinguishes between Entrepreneurship and Creativity constructs has a better
fit than the eight-construct model. b) The nine-construct model has convergent and
discriminant validity and unidimensionality.
2
Value
The study's contributions are threefold: first, it generally supports Schein's Career
Anchor Theory, yet, with nine anchors rather than with the original eight; second, it
confirms the distinction between entrepreneurship and creativity; and third, it
highlights the need to rephrase several existing items, and add new ones.
The suggested changes and the conceptual framework of the nine-anchor model will
make the COI a more valid and reliable instrument, both for theory-building, as well
as for practical and diagnostic use by career counselors.
Key Words Career anchors, Career Orientation Inventory, construct validity, confirmatory factor analysis, E. Schein
3
The Construct Validity of Schein's Career Anchors Orientation Inventory
Introduction
Edgar Schein (1975, 1978, and 1987) suggests that the life experiences that people
undergo give them a more accurate and stable “career-self-concept”, a construct
which he labels "career anchor". A career anchor has three components: (1) self-
perceived talent and abilities; (2) self-perceived motives and needs; and (3) self-
perceived concept attitudes and values. The first two are based on actual experience
in a work setting, while the third is derived from the individual's reaction to a variety
of norms and values encountered in different social and work situations. Schein
regards a career anchor as "That one element in a person's self-concept, which he or
she will not give up, even in the face of difficult choices" (Schein, 1990:18). Schein
(1990) posits that an individual’s future career choices are affected as he matures and
his anchor stabilizes.
The names and the description of the anchors appear in Table I.
Insert Table I
Schein claims that each individual has only one true career anchor which emerges
after the person has accumulated a meaningful amount of life and work experiences.
Schein's main contribution is that his work describes how a stable career identity is
formed and distinguishes this process from initial vocational choice (Feldman and
Bolino, 1996).
4
According to Schein, when individuals achieve congruence between their career
anchor and their work, they are more likely to attain positive career outcomes, such as
job effectiveness, satisfaction and stability. However, because people do not always
work in jobs that fit their career anchors, large variations in job outcomes occur in the
population. On the whole, however, individuals with congruence will most likely
achieve higher career outcomes than those who have failed to attain it.
Individual career anchors can be measured by qualitative or quantitative
methodologies. The quantitative measurement is the Career Orientation Inventory. It
consists of 40 statements (Table II), five for each of the eight career anchors that
Schein posited (Schein, 1990).
Insert Table II
Schein and his students performed 14 studies on managers. The largest contained 44
participants (Schein, 1978), and the average sample size was 23 (Schein, 1987). All
of these studies used the qualitative procedure to assess the individual's anchor. Those
studies, which were based on large samples, relied only on the COI questionnaire
described above (e.g., Igbaria and Greenhaus (1991) Yarnell (1998), Marshal and
Bonner (2003).
Feldman and Bolino (1996) suggested factor analyses tests of Schein's COI to
determine the factor structure which underlines the career anchor typology.
Exploratory factor analysis was performed by Nordvik (1991), Igbaria and Greenhaus
(1991), Petroni (2000), Marshal and Bonner (2003) and Summer, Yager and Franke
(2205). Nordvik (1991) found a four-factor solution. However, as he used an ipsative
5

scale, his results cannot be directly compared to the studies below. Igbaria and
Greenhaus's (1991) study on 464 information technology professionals reveals an 11-
factor structure with three anchors: Security, Technical Functional and Challenge,
each split into two factors. However, their sample is quite homogeneous and
therefore, the findings can not be generalized to other populations. Petroni (2000)
performed a factor analysis on 25 of the 40 items of the COI and found a nine factor
solution, with Security anchor splitting into 2 factors: Organizational Security and
Geographical Security. However, his sample size (n=151 R&D professionals) was too
small for such an analysis. Likewise, Sumner et al (2005) performed a factor analysis
of the COI, but their sample size of 66 respondents is inadequate for such an analysis.
Marshal and Bonner's study (2003) on a heterogeneous sample of 423
graduate students, in 5 different countries, found a nine-factor structure. The
entrepreneurial-creativity anchor is loaded on two separate factors: Creativity (3
items) and entrepreneurial factor (2 items).
Marshal and Bonner's results are the closest to Schein's paradigm with the
exception of the entrepreneurial-creativity scale. Their findings indicate a possible
semantic difference between entrepreneurship and creativity. Indeed, according to the
Oxford Dictionary (2007)i entrepreneurship has to do with setting up a business,
whereas creativity is the use of imagination or original ideas in order to create
something, which in most cases is not meant to be converted into a business. Hisrich
and Peters (2002) define entrepreneurship as the process of creating something new
of value, by devoting the necessary time and effort, assuming the accompanying
financial, psychic and social risk, and receiving the resulting rewards of monetary and
6

personal satisfaction and independence. Dollinger (1999) defines entrepreneurship as
"the creation of an innovative organization. For example, creative artists are often the
antithesis of entrepreneurs". ..(p. 4). Contrary to entrepreneurship, the definition of
the construct 'creativity' is elusive. Parkhurst (1999) in his review article "Confusion,
lack of consensus and the definition of creativity as a construct" does not find a
comprehensive and accepted definition. He quotes Torrance (1988) that said that
"creativity defies precise definition". Similarly, Ford and Harris (1992) in their article
"The elusive definition of creativity" arrive at similar conclusion. Nevertheless, Kao
(1989) emphasizes the difference between creativity and entrepreneurship: "The
capacity to develop new ideas, concepts, and processes is not the same as the capacity
to make things happen, to implement in practical terms" (p. 18). Furthermore, Kao
(1991) identified 11 common characteristics of entrepreneurs; creativity is not one of
them.
A close examination of the five items which comprise the
entrepreneurship – creativity anchor in the COI (Schein, 1990), as presented in table
II, reveals that three items (# 5, 13 and 37) have to do with setting up a new business
(e.g., # 37 "I dream of starting up and building my own business"). The other two
items (# 21 and 29) concern creativity (e.g., "I will feel successful in my career only
if I have succeeded in creating or building something that is entirely my own product
or idea).
Following Marshal and Bonner's findings (2003) (whose sample most
resembles ours in terms of size and heterogeneity), and on the semantic differences
described above, we hypothesize the presence of nine career anchors rather than
Schein's eight-anchor paradigm.
7

In order to examine the validity of any measurement model, a confirmatory
factor analysis is more appropriate than the exploratory factor analysis used to date.
It is surprising that the COI, being widely accepted and used, was not subjected to
such tests.
The purpose of this paper is to test the construct validity of the measurement
model of the nine-factor structure of Schein's COI (1990).
Method
Data Collection
The data were collected over two semesters in 2003. As part of a course requirement,
teams of MBA students at an Israeli institution of higher education were asked to
collect data among working adults and test some aspects of career anchor theory.
Each team distributed and collected 30-40 questionnaires from among various work
associates, acquaintances and family members. The course professors subsequently
asked the students for permission to use the data for a research project. Those who
agreed anonymously put the questionnaires in the professors' mailboxes.
The sample consists of 2010 questionnaires. Since important data were missing in
163 questionnaires, they were deleted and the final sample consists of 1847 valid
questionnaires.
Sample characteristics: Respondents included 899 males and 947 females (48.7
percent and 51.3 percent, respectively). This resembles the gender distribution in the
total Israeli population (Israeli Central Bureau of Statistics, 2000). The average age of
the respondents was 42.5 years (s. d. 8.16) and the median age was between 39-40.
8

Two-thirds of the sample has a higher education. Forty-nine of the respondents (2.6
percent) have a doctoral degree; 436 (24.0 percent) have a second degree (M.A,
M.Sc. or MBA); and 725 (39.0 percent) have a B.A or B.Sc. The rest, 579 (31.3
percent) do not have an academic degree. Overall, there are no significant gender
differences in the proportion of men and women with academic degree. However,
there are significantly more men than women with a bachelor degree (p=.003); more
women than men with a masters degree (p= .001); and more men than women with a
Ph.D. degree (p=.018). Fifty-eight individuals (3.1 percent) did not answer this
question. According to the Israel Central Bureau of Statistics (1995), 34.9 percent of
the population, age 25-64, has obtained a higher education, compared to the 66.5
percent in the sample of this study
Among the respondents, 1,623 were salaried employees (88 percent), and 192 were
self-employed (10.5 percent). Thirty-two individuals (1.5 percent) did not answer the
questionnaire. According to the Central Bureau of Statistics (1995), 84.5 percent of
the Israeli work force consists of salaried employees (80.2 percent of the males and
90.2 percent of the females in the labor force) while 10 percent are self-employed.
These figures resemble the US data of about 13.6 percent self-employed in the labor
force (U.S. Census Bureau News, 2005).
Overall, the sample is relatively more educated than the Israeli population. This can
be attributed to the fact that the MBA students sampled their own social and work
environments. However, the distribution of gender and type of employment, i.e.,
salaried vs. self-employed, resembles the distribution of the total population.
9

Measures
All respondents were requested to report on a six point Likert scale (1= low
agreement, 6= high agreement) the extent of their agreement with Schein's 40-item
COI (1990) translated into Hebrew. The Hebrew version is widely used by Israeli
career-counselors and placement companies to assess career anchors of candidates.
Seven anchor constructs comply with Schein's typology (1990). Each is reflected
by five indicators (items): the Technical/Functional Competence (TF) construct;
General Management Competence (GM); Autonomy/Independence (AU);
Security/Stability (SE); Service/Dedication (SV); Pure Challenge (CH) and
Lifestyle (LS). However, the Entrepreneurial-Creativity construct (EC) is divided
into two distinct ones: Entrepreneurship (E) and Creativity (C): Three indicators
reflect the Entrepreneurship construct, whereas two indicators reflect the Creativity
construct. Each of the constructs is expected to be unidimensional. The list of the
indicators (items) is presented in Table II.
Methodology
To test the construct validity of the proposed measurement model of career anchors
with the nine constructs, we employed confirmatory factor analysis using EQS
software (Bentler, 1995). The initial measurement model was subjected to
confirmatory factor analysis (CFA) to assure convergent and discriminant validity
and unidimensionality (Jöreskog and Sörbom, 1989). We purified the measurement
scales by reviewing each construct that emerged from our analysis and, as a result,
deleted one indicator reflecting the TF construct (#25 Table II), as it has low loading
on its construct (.23) . Thus, the final proposed measurement model is based on the 39
items described in Table II. The overall fit of the proposed model is assessed and
10
compared to the model suggested by Schein. The comparison is evaluated according
to the Satorra-Bentler chi-square scaled difference test (Bentler, 1995) and the three
fit indices: the robust normed fit index (NFI); the robust comparative fit index (CFI);
and the SRMSR index (standardized root mean-squares of the residuals) suggested by
Bentler (1980) and Hu and Bentler (1995). Moreover, the proposed model is
evaluated according to the following criteria: convergent validity, discriminant
validity and unidimensionality. Convergent validity is assessed by examining the
loadings of the indicators and the reliability (Cronbach alpha), and the discriminant
validity is assessed by the methods suggested by Anderson and Gerbing (1988) and
Jöreskog (1971). The unidimensionality is evaluated by the three fit indices and by
the examination, based on Lagrange multiplier tests (Bentler, 1995), of the correlated
errors among the indicators.
Results
Overall Model Fit
Table III summarizes the results of our CFA for the measurement model with the
nine constructs and that of Schein's eight constructs. The table presents the Satorra-
Bentler chi-square scaled and the chi-square difference test between the nine- and the
eight- construct model (Bentler, 1995). The significant difference (χ2=845.05, df=8,
p<.0001) indicates that the measurement model with the nine constructs fits the data
significantly better than that with the eight constructs. In addition, the three
descriptive fit indices -- the NFI, CFI, and the SRMSR -- indicate that the
measurement model of the nine constructs fits the data better than the eight-construct
model. Both, the NFI (.836 vs. 802) and the CFI (.859 vs.824), presented in Table III,
have higher values for the nine- than for the eight-construct model. The SRMSR
11
index is lower for the nine-construct model than for the eight-construct model (.063
vs. 078). The fit values NFI and CFI for the model with the nine constructs are
slightly below the acceptable fit level of 0.90 (Bentler, 1980; Hu and Bentler,
1995). However, the value of the SRMSR index obtained for the nine-construct
model is .063 which fits the criteria recommended by Hu and Bentler (1995).
Therefore, we can conclude that the proposed nine-construct model is close to a good
fit and fits the data better than Schein's eight-construct model.
Insert Table III
The following analysis suggests that the main reason for not reaching the acceptable
level of the NFI and CFI is due to the wording of several items of Schein's Career
Orientation Inventory. The results of the LaGrange multiplier tests (Bentler, 1995)
show correlated errors among a number of items. Each of the following items #4, 22,
26 , 27, 32 and 39 (Table II) are ipsative, i.e., a high agreement with the statement
means a high score on one anchor and a low score on another. For example, item #4
"Security and stability are more important to me than freedom and autonomy".
Statistically, the ipsative items are expressed as a positive loading on one anchor and
a negative loading on the other. Therefore, the data was subjected to an additional
CFA based on the nine-construct model, allowing positive and negative loading on
the above six items (i.e., #4: positive loading on SE and negative loading on AU;
#22: positive on SE and negative on GM; # 26: positive on GM and negative on TF;
# 27: positive on AU and negative SE; # 32: positive on LS and negative on GM; #
39: positive on CH and negative on GM). Table IV shows that the nine constructs
with the negative loading improve significantly (χ2=557.19, df=6, p<.0001) the fit of
the model. The fit value NFI is increased from .836 to .859; the fit value CFI is
increased from .859 to .883; and the SRMSR value is deceased from .063 to .054.
12
These results demonstrate that the model with the negative loadings fits the data
significantly better than the model without the negative loadings.
Insert Table IV
Convergent Validity
The overall fit of the measurement model, as expressed by the fit indices, supports the
convergent validity of each construct. Table II provides standardized factor loadings.
0f the 39 loadings of the indictors for the nine-construct model, thirty four are above
0.5; four range between .4 and .5; and one has the value of .39. Each indicator loads
significantly on its respective construct (p<.0001), suggesting that the measurement
scale for each construct demonstrates high convergent validity (Anderson and
Gerbing, 1988). As shown in Table II, the Cronbach alpha scores range from .601 to
.887. TF and C obtained Cronbach alpha scores less than .70 (.601 and .680,
respectively). In light of the small number of items measuring these constructs, four
and two items, respectively, this is an acceptable result (Cortina, 1993).
Discriminant Validity
The overall fit of the measurement model, as expressed by the fit indices,
supports the discriminant validity of each construct. To further assess the
discriminant validity, the estimated inter-factor correlations were examined and the
confidence intervals for the estimates of the inter-factor correlations were calculated
(Anderson and Gerbing, 1988). The methodology examines whether the confidence
interval for the estimated correlations in the measurement model does or does not
include the value of 1.0. Such a correlation between two constructs means that there
is no discrimination between the two. Table V provides estimates of the correlations
and their standard errors. The size of the estimates of the correlations between the
13
factors ranges from -.320 to .727. Since none of the confidence intervals, for the
estimated correlations in the measurement model, contained the value of 1.0
(p<0.001), we concluded that the constructs possess discriminant validity.
Insert Table V
We also performed a complementary assessment of discriminant validity by
performing a chi-square difference test on the values obtained for the unconstrained
(i.e. a model where the factor correlations are not constrained to unity) and
constrained models (Jöreskog, 1971). A significantly lower chi-square value obtained
from the unconstrained model compared to the constrained model indicates that the
factors are not perfectly correlated, and that discriminant validity is achieved with
respect to the nine constructs (Bagozzi and Phillips, 1982). The two absolute highest
correlations between the estimated factors are between TF and CH (estimated
correlation =.727), and between CH and C (estimated correlation=.667). Two
constrained models were performed where the correlation between each of the two
pairs was constrained to unity. The results, as presented in Table VI, show that the
two chi-square differences between the paired differences of the constrained and the
unconstrained models (for 1=CHTF ,ρ : χ2 =374.35, df=8; for 1=CHC ,ρ : χ2 =450.75,
df=8) are significant at p<0.0001 These significant differences which were found
between the constrained and unconstrained model, for the pairs with highest
correlations, imply that we will obtain significant differences for all other pairs
which have lower correlations. This indicates that the constructs are not perfectly
correlated and while they do measure something in common, each construct measures
something uniquely its own.
Insert Table VI
Unidimensionality
14

The fit of the measurement model, as expressed by the fit indices, indicates that each
factor is unidimensional. The Lagrange multiplier tests (Bentler, 1995) reveal
correlated errors of the items within each factor. However, since there is no
theoretical explanation for these correlations, we conclude that the constructs are
unidimensional. We suggest that the correlated errors that were found are probably
due to the wording of the items (described earlier in the results section), and not to the
misspecification of the theoretical constructs.
Overall, these results show that the proposed nine-construct measurement model
almost reaches the acceptable level of fit and is more appropriate than Schein's eight-
construct model. The findings show that the nine-construct model has convergent
and discriminant validity, and unidimensionality.
Conclusions and further research
Marshal and Bonner's (2003) exploratory factor analysis suggested a nine-factor
solution to the COI. The Entrepreneurial - Creativity anchor was split into two
anchors: an entrepreneurial anchor and a creativity anchor. A close look at the items
and the literature (Hisrich and Peters, 2002; Dollinger, 1999; Kao (1991) regarding
entrepreneurship and creativity highlights the difference between these two
constructs.
The present study tests the nine-construct measurement model of Schein's Career
Orientation Inventory and finds that it fits the data better than his eight-construct
model. Furthermore, the study demonstrates that the proposed model has convergent
and discriminant validity, and unidimensionality.
15

Nevertheless, the proposed nine-construct model only approaches the acceptable
level of fit. This could be due to the wording of some of the items, which causes
correlated errors. As described in the results section, some of the items are ipsative
and cause correlated errors (i.e., #17 " Becoming a senior functional manager in my
area of expertise is more attractive to me than becoming a general manager"). We
showed that allowing positive and negative loadings improves the level of fit of the
model. Moreover, several items start with "I would rather leave the organization
than...". This wording may be creating artificial commonality among the items and
contributing to the correlated error.
The present study is the first rigorous test of the construct validity of Schein's Career
Orientation Inventory. Its contributions are threefold: first, it supports Schein's Career
Anchor Theory, but with nine anchors rather than with the original eight; second, it
confirms the distinction between entrepreneurship and creativity; and third, it
highlights the need to rephrase several existing items, and add new ones. The
suggested changes and the conceptual framework of nine-anchor model will make the
COI a more valid and reliable instrument, both for theory building, as well as for
practical and diagnostic use by career counselors.
We would like to emphasize that the present investigation is limited to the original
Schein's forty items COI. However, some researchers raised the possibility that there
might be anchors which are not included in the COI. Baruch (2004) suggests
additional anchors for the 21st century, such as employability, and spiritual purpose,
while Suutari and Taka (2004) suggest the addition of an Internationalism anchor,
16

which may characterize internationally oriented managers. This direction should be
explored by future studies.
17

References
Anderson, J. C. and Gerbing, D. W. (1988) "Structural equation modeling in practice:
A review and recommended two-step approach", Psychological Bulletin, Vol.103,
No. 3, pp. 411-423.
Bagozzi, R. P. and Phillips L. W. (1982) "Representing and testing organizational
theories: A holistic construct", Administrative Science Quarterly, Vol. 27, No. 3,
pp. 459-489.
Baruch, Y. (2004) Managing Careers: Theory and Practice, Harlow, England,
Prentice Hall, FT, pp. 79-80.
Bentler, P. M. (1980) "Comparative fit indexes in structural models", Psychological
Bulletin, Vol. 107, No.2, pp. 238-246.
Bentler, P. M. (1995). Program manual, Encino, CA, Multivariate Software, Inc.
Cortina, J. M. (1993) "What is coefficient alpha? An examination of theory and
applications", Journal of Applied Psychology, Vol. 78, pp. 98-104.
Dollinger, M.J. (1999) Entrepreneurship: Strategies and Resources, 2nd. Ed. Upper
Saddle River, NJ: Prentice Hall.
Feldman, D.C. and Bolino, M.C. (1996) "Careers within Careers: Reconceptualizing
the Nature of Career Anchors and their Consequences", Human Resource
Management Review, Vol. 6, No. 2, pp.89-112.
18

Feldman, D.C. and Bolino, M.C. (2000) "Career Patterns of the Self-Employed:
Career Motivations and Career Outcomes", Journal of Small Business Management,
Vol. 38, No. 3, pp. 53-68.
Ford, D. Y and Harris J. J (1992) "The elusive definition of creativity". Journal of
Creative Behavior, Vol. 26m no 3, pp. 186-198.
Holland, J.L. (1973) Making Vocational Choices: A Theory of Careers, Englewood-
Cliffs, NJ, Prentice-Hall.
Hisrich, R. D. and Peters, M. P. (2002) Entrepreneurship, 5th edition, McGrow-Hill.
Hu, L. and Bentler, P. M. (1995) "Evaluating model fit", In R. H. Hoyle (Ed)
Structural Equation Modeling: Concepts, Issues and Applications, Thousand Oaks,
CA, Sage Publications, pp. 76-99.
Igbaria, M. and Greenhaus, J.H. (1991) "Career Orientations of MIS Employee: An
Empirical Analysis". MIS Quarterly, Vol. 15, No. 2, 22p.
Israel's Central Bureau of Statistics, (2000) Statistical Abstract of Israel, 51,
Jerusalem, Israel
Jöreskog, K. G. (1971) "Statistical analysis of sets of congeneric tests",
Psychometrika, Vol. 36, No. 2, pp.109-133.
Jöreskog, K. G. and Sörbom, D. (1989) LISREL 7: A Guide to the Program and
Applications (2nd Edition), Chicago, SPSS.
Kao, J.J. (1989) Entrepreneurship, Creativity, and Organization: Text, Cases, and
Readings, Englewood Cliffs, NJ, Prentice-Hall.
19

Kuratko, D.F. and Hodgetts, R.M. (2007) Entrepreneurship: Theory, Process,
Practice. International student edition, 7th ed. United Kingdom, Thomson/South-
Western.
Marshal, V. and Bonner, D. (2003) "Career Anchors and the Effects of Downsizing:
Implications for Generations and Cultures at Work: A Preliminary Investigation",
Journal of European Industrial Training, Vol. 27, No. 6, pp. 281-291.
Nordvik, H. (1996) "Relationships between Holland's Vocational Typology, Schein's
Career Anchors and Myers-Briggs' Types", Journal of Occupational and
Organizational-psychology. Vol. 69 Part 3, pp. 263-276.
Parhurst, H. D. (1999) Confusion, lack of consensus, and the definition of creativity
as a construct. Journal of Creative Behavior, Vol. 33, no 1, pp. 1-21.
Petroni, A. (2000) Strategic Career Development for R&D Staff: a Field Research.
Team Performance Management, Vol. 6, No 3/4, p. 52
Schein, E. H. (1975) "How Career Anchors Hold Executives to their Career Paths",
Personnel, Vol. 52, pp.11-24.
Schein, E. H. (1978) Career Dynamics: Matching Individual and Organizational
Needs. Reading, MA, Addison-Wesley.
Schein, E. H. (1987) "Individuals and Careers", In Lorsch, J. (Ed.) Handbook of
Organizational Behavior, Englewood Cliffs, NJ, Prentice–Hall, Pp.155-171
Schein, E. H. (1990) Career Anchors: Discovering Your Real Values, San Diego,
CA, Pfeiffer& Company.
Sumner, M., Yager, S. and Franke, D. 2005) Career Orientation and Organizational
Commitment of IT personnel. ACM 1-59593-011. New York, ACM press
20

Suutari, V. and Taka, M. (2004) Career Anchors of Managers with Global Careers.
Journal of Management Development, Vol. 23, No. 9, pp. 833-847
Yarnell, J. (1998) "Career Anchors: Results of an Organisational Study in the UK",
Career Development International, Vol. 3, No. 2, pp.56- 63.
_________ 1 http://www.askoxford.com/dictionaries/?view=uk : accessed Dec. 28th, 2006
21

Table I - Schein's typology of career anchors1
_____________________________________________________________
1. Technical/Functional Competence: Primarily excited by the content of the work
itself; prefers advancement only in his/her technical or functional area of
competence; generally disdains and fears general management as too political.
2. General Managerial Competence: Primarily excited by the opportunity to analyze and
solve problems under conditions of incomplete information and uncertainty; likes
harnessing people together to achieve common goals; stimulated (rather than
exhausted) by crisis situations.
3. Autonomy/independence: Primarily motivated to seek work situations which are
maximally free to organizational constraints; wants to set own schedule and own
pace of work; is willing to trade-off opportunities for promotion to have more
freedom.
4. Security/Stability: Primarily motivated by job security and long- term attachment to
one organization; willing to conform and to be fully socialized into an organization's
values and norms; tends to dislike travel and relocation.
5. Entrepreneurial Creativity: Primarily motivated by the need to build or create
something that is entirely their own project; easily bored and likes to move from
project to project; more interested in initiating new enterprises than in managing
established ones.
6. Service/Dedication to a cause: Primarily motivated to improve the world in some
fashion; wants to align work activities with personal values about helping society;
more concerned with finding jobs which meet their values than their skills.
7. Pure Challenge: Primarily motivated to overcome major obstacles, solve almost
unsolvable problems, or to win out over extremely tough opponents; define their
careers in terms of daily combat or competition in which winning is everything; very
single-minded and intolerant of those without comparable aspirations.
8. Lifestyle: Primarily motivated to balance career with lifestyle; highly concerned with
such issues as paternity/maternity leaves, day-care options, etc.; looks for
organizations that have strong pro-family values and programs.
1 Source: Schein, E.H. 1990. Career Anchors: Discovering Your Real Values. San Diego, CA: Pfeiffer & Company
22

Table II- Results of confirmatory factor analysisa
Item # in COI
Scale α Factor loading
Technical/Functional Competence (TF) .601 1 1. I dream of being so good at what I do that my expert advice will be
sought continuously. .474
9 2. I will feel successful in my career only if I can develop my technical or functional skills to a very high level of competence.
.641
17 3. Becoming a senior functional manager in my area of expertise is more attractive to me than becoming a general manager.
.392
25* 4. I would rather leave my organization than accept a rotational assignment that would take me out of my area of expertise.
33 5. I am most fulfilled in my work when I have been able to use my special skills and talents.
.725
GM .795 2 1. I am most fulfilled in my work when I have been able to integrate
and manage the efforts of others. .412
10 2. I dream of being in charge of a complex organization and making decisions that affect many people.
.581
18 3. I will feel successful in my career only if I become a general manager in some organization.
.829
26 4. Becoming a general manager is more attractive to me than becoming a senior functional manager in my current area of expertise.
.825
34 5. I would rather leave my organization than accept a job that would take me away from the general managerial track.
.676
AU .723 3 1. I dream of having a career that will allow me the freedom to do a job
my own way and on my schedule. .522
11 2. I am most fulfilled in my work when I am completely free to define my own tasks, schedules, and procedures.
.571
19 3. I will feel successful in my career only if I achieve complete autonomy and freedom.
.663
27 4. The chance to do a job my own way, free of rules and constraints is more important to me than security.
.649
35 5. I would rather leave my organization than accept a job that would reduce my autonomy and freedom.
.543
SE .821 4 1. Security and stability are more important to me than freedom and
autonomy. .662
12 2. I am most fulfilled in my work when I am completely free to define my own tasks, schedules, and procedures.
.519
20 3. I seek jobs in organizations that will give me a sense of security and stability .822 28 4. I am most fulfilled in my work when I feel that I have complete financial .696
23

and employment security. 36 5. I dream of having a career that will allow me to feel a sense of security and
stability. .787
E .887 5 1. I am always on the lookout for ideas that would permit me to start
my own enterprise. .817
13 2. Building my own business is more important to me than achieving a high-level managerial position in someone else's organization.
.819
37 3. I dream of starting up and building my own business. .923 C .680
21 1. I am most fulfilled in my career when I have been able to build something that is entirely the result of my own ideas and efforts
.668
29 2. I will feel successful in my career only if I have succeeded in my creating or building something that is entirely my own product or idea.
.771
SV .786 6 1. I will feel successful in my career only if I have a feeling of having made a
real contribution to the welfare of society .718
14 2. I am most fulfilled in my career when I have been able to use my talents in the service of others.
.494
22 3. Using my skills to make the world a better place to live and work is more important to me than achieving a high-level managerial position
.700
30 4. I dream of having a career that makes a real contribution to humanity and society.
.789
38 5. I would rather leave my organization than accept an assignment that would undermine my ability to be of service to others.
.557
CH .779 7 1. I dream of a career in which I can solve problems or win out in situations
that are extremely challenging. .732
15 2. I will feel successful in my career only if I face and overcome very difficult challenges.
.726
23 3. I have been most fulfilled in my career when I have solved seemingly unsolvable problems or won out over seemingly impossible odds.
.621
31 4. I seek out work opportunities that strongly challenge my problem solving and/or competitive skills.
.759
39 5. Working on problems that are almost unsolvable is more important to me than achieving a high level managerial position.
.424
LS .811 8 1. I would rather leave my organization than to be put into a job that would
compromise my ability to pursue personal and family concerns .568
16 2. I dream of a career that will permit me to integrate my personal, family, and work needs.
.689
24 3. I feel successful in my life only if I have been able to balance my personal, family, and career requirements.
.710
32 4. Balancing the demands of personal and professional life is more important to me than achieving a high level managerial position.
.743
40 5. I would rather leave my organization than accept a job that would take me away from the general managerial track.
.706
* this item was omitted due to a low loading on all the factors a All factor loadings are significant at the p<0.0001, n=1800
24
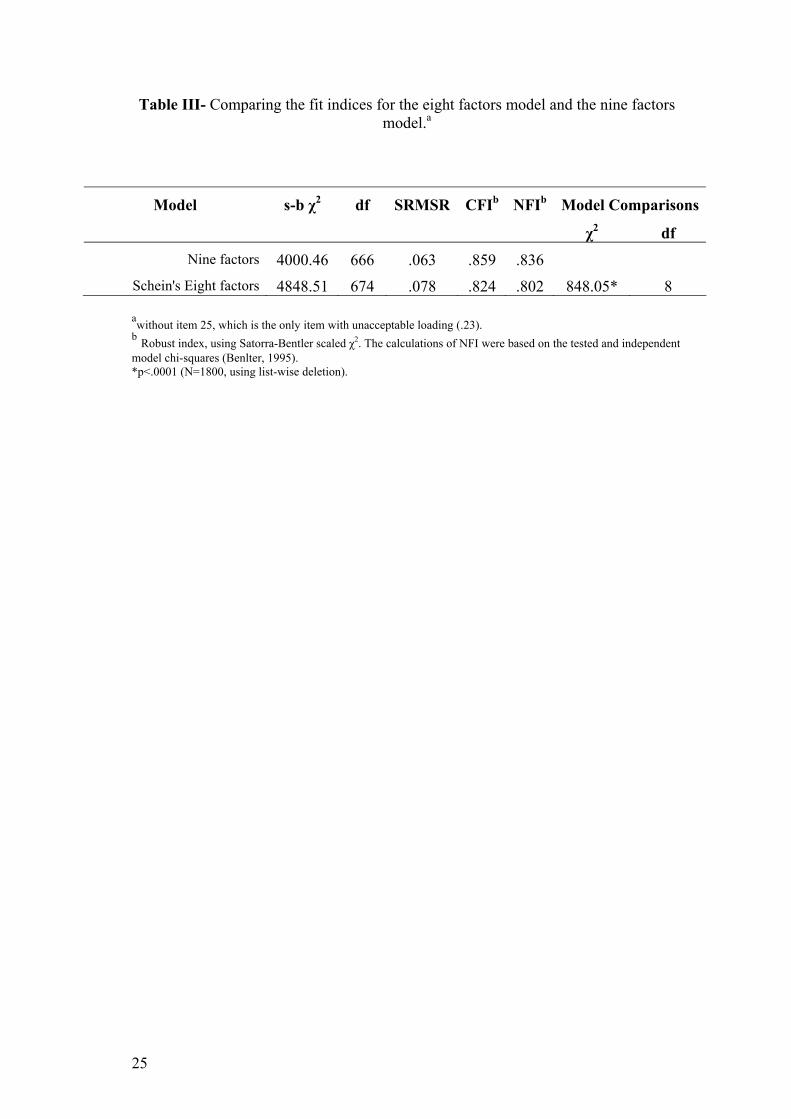
Table III- Comparing the fit indices for the eight factors model and the nine factors model.a
Model s-b χ2 df SRMSR CFIb NFIb Model Comparisons
χ2 df Nine factors 4000.46 666 .063 .859 .836
Schein's Eight factors 4848.51 674 .078 .824 .802 848.05* 8 awithout item 25, which is the only item with unacceptable loading (.23). b Robust index, using Satorra-Bentler scaled χ2. The calculations of NFI were based on the tested and independent model chi-squares (Benlter, 1995). *p<.0001 (N=1800, using list-wise deletion).
25

Table IV- Comparing the fit indices for the nine factors model with and without negative loadings.a
Model s-b χ2 df SRMSR CFIa NFIa Model comparisons χ2 df Nine factors 4000.46 666 .063 .859 .836 Nine factors with negative loadings
3443.27 660 .054 .883 .859 557.19* 6
a without item 25, which is the only item with unacceptable loading (.23). b Robust index, using Satorra-Bentler scaled χ2. The calculations of NFI were based on the tested and independent model chi-squares. *p<.0001 (N=1800, using list-wise deletion).
26

Table V- Estimated correlations between the nine factors of career anchors.a
GM AU SE SV CH LS E C
TF 1 -.039
(.032)
.357***
(.035)
.156***
(.032)
.347***
(.029)
.727***
(.023)
.211***
(.034)
.026
(.029)
.471***
(.031)
GM 2 .417***
(.026)
-.123***
(.029)
-.042
(.029)
.294***
(.026)
-.320***
(.028)
.420***
(.025)
.424***
(.027)
AU -.206***
(.038)
.167***
(.031)
.457***
(.026)
.124**
(.033)
.434***
(.024)
.588***
(.030)
SE .238***
(.029)
-.076*
(.030)
.449***
(.029)
-.186***
(.028)
-.045
(.034)
SV .369***
(.028)
.323***
(.030)
.089*
(.029)
.378***
(.031)
CH -.018
(.032)
.148***
(.028)
.667***
(.032)
LS -.051
(.028)
.036
(.034)
E .498***
(.025)
a values in parentheses are the standard errors, n=1800 (using list-wise deletion).
* p<0.01; ** p<0.001; *** p<0.0001
27

Table VI- Comparing the fit indices and the paired chi-square difference test between the constrained and unconstrained models. a
Model s-b χ2 df SRMSR CFIa NFIa Model comparisons
χ2 df Nine factors: no correlations constrained
4000.46 666 .063 .859 .836
Eight factors: 1=CHTF ,ρ 4374.81 674 .067 .844 .821 374.35* 8 Eight factors: 1=CHC ,ρ 4451.21 674 .068 .841 .818 450.75* 8
e a without item 25, which is the only item with unacceptable loading (.23). b Robust index, using Satorra-Bentler scaled χ2. the calculation of NFI were based on the tested and independent model chi-squares (Bentler, 1995). *p<.0001 (N=1800, using list-wise deletion).)
28