Embed Size (px)
Citation preview
22/08/2013
1
The continuing gender revolution in unpaid work
John Robinson, Jonathan Gershuny,
Oriel Sullivan, Kimberly Fisher
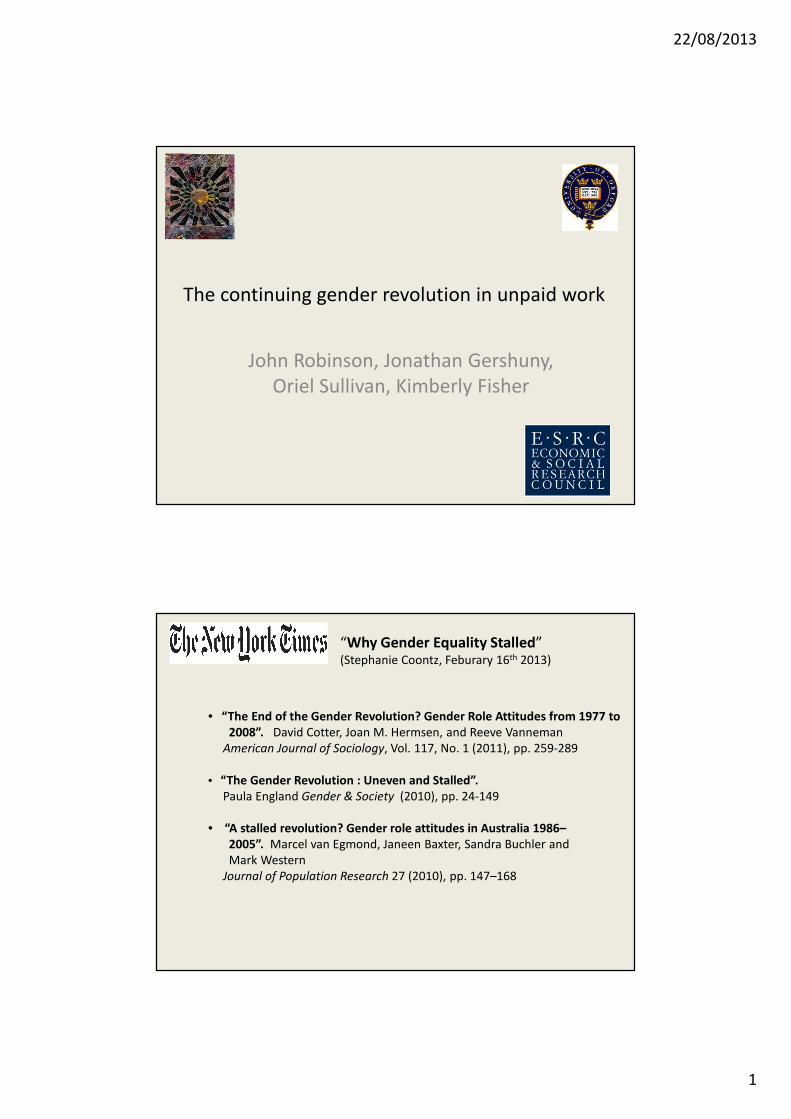
“Why Gender Equality Stalled” (Stephanie Coontz, Feburary 16th 2013)
• “The End of the Gender Revolution? Gender Role Attitudes from 1977 to
2008”. David Cotter, Joan M. Hermsen, and Reeve Vanneman
American Journal of Sociology, Vol. 117, No. 1 (2011), pp. 259-289
• “The Gender Revolution : Uneven and Stalled”.
Paula England Gender & Society (2010), pp. 24-149
• “A stalled revolution? Gender role attitudes in Australia 1986–
2005”. Marcel van Egmond, Janeen Baxter, Sandra Buchler and
Mark Western
Journal of Population Research 27 (2010), pp. 147–168
22/08/2013
2
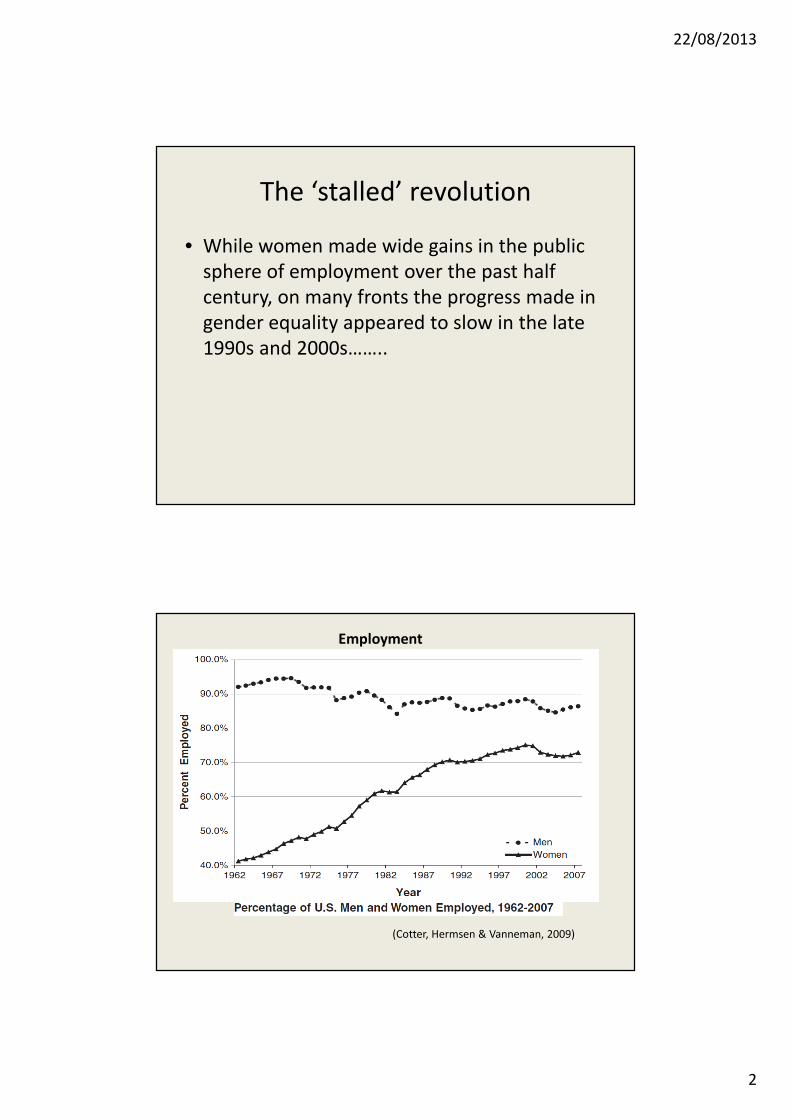
The ‘stalled’ revolution
• While women made wide gains in the public
sphere of employment over the past half
century, on many fronts the progress made in
gender equality appeared to slow in the late
1990s and 2000s……..
(Cotter, Hermsen & Vanneman, 2009)
Employment
22/08/2013
3
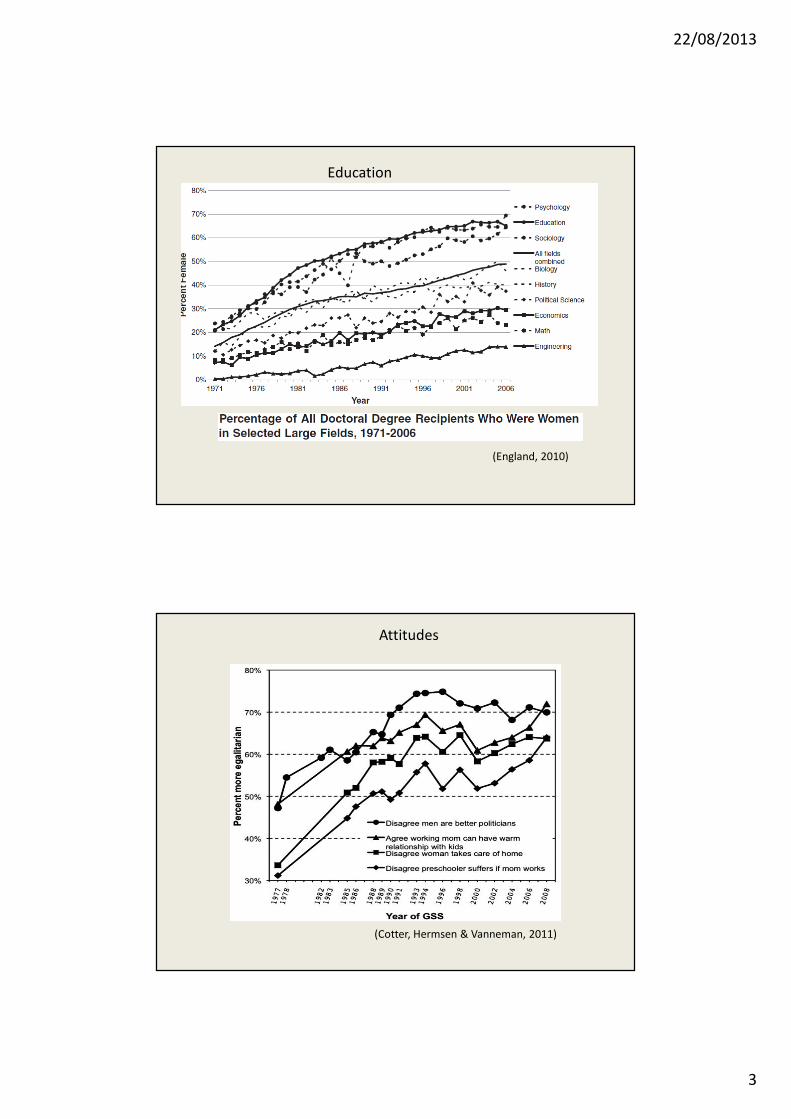
(England, 2010)
Education
(Cotter, Hermsen & Vanneman, 2011)
Attitudes
22/08/2013
4
• One explanation offered (e.g. Cotter, Hermsen
& Vanneman) is that this ‘stalling’ reflects a
new “egalitarian essentialism”, that “blends
aspects of feminist equality and traditional
motherhood roles”................
• Another, more convincing, explanation is that
neither the institutional context nor men
themselves appear to have adapted
sufficiently to women’s new engagement in
the labor force. While women’s lives have
become more like men’s, the reverse has not
been the case.
22/08/2013
5
• Only through an equal movement by men into
what has been traditionally considered
‘women’s work’, and a corresponding
institutional support of this move, can the
movement towards gender equality continue.
Melinda Beck
22/08/2013
6
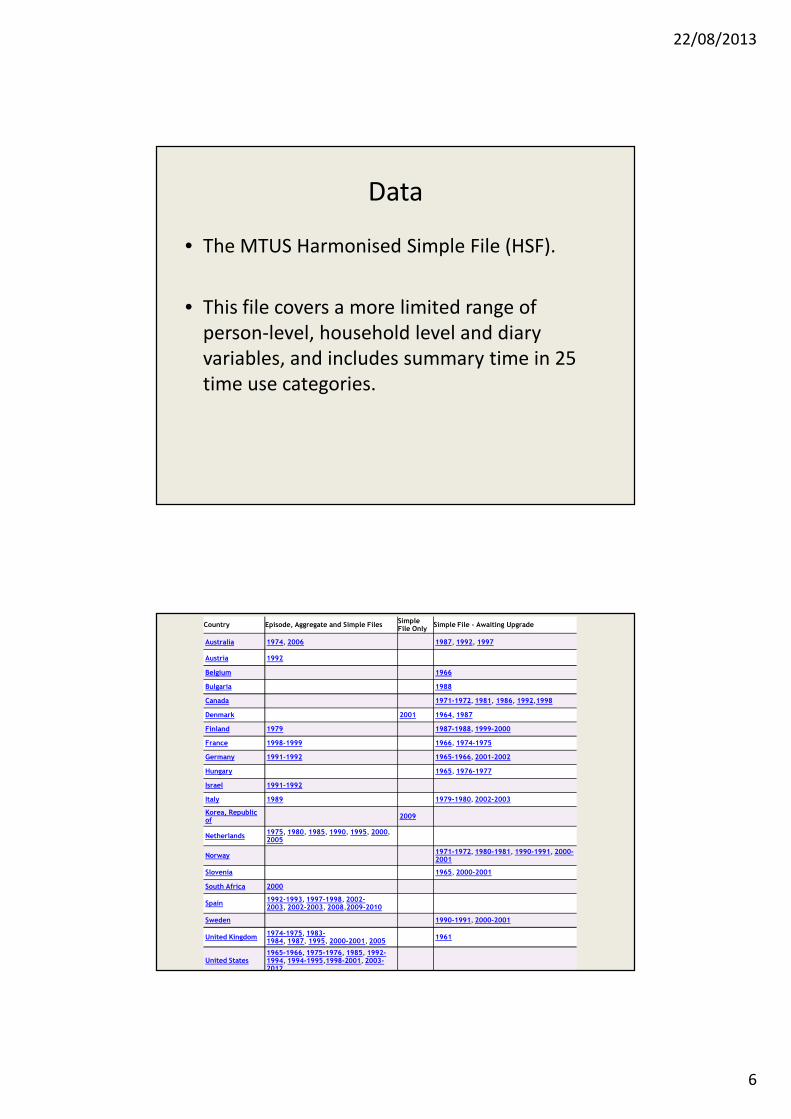
Data
• The MTUS Harmonised Simple File (HSF).
• This file covers a more limited range of
person-level, household level and diary
variables, and includes summary time in 25
time use categories.
Country Episode, Aggregate and Simple FilesSimple File Only
Simple File - Awaiting Upgrade
Australia 1974, 2006 1987, 1992, 1997
Austria 1992
Belgium 1966
Bulgaria 1988
Canada 1971-1972, 1981, 1986, 1992,1998
Denmark 2001 1964, 1987
Finland 1979 1987-1988, 1999-2000
France 1998-1999 1966, 1974-1975
Germany 1991-1992 1965-1966, 2001-2002
Hungary 1965, 1976-1977
Israel 1991-1992
Italy 1989 1979-1980, 2002-2003
Korea, Republic of
2009
Netherlands1975, 1980, 1985, 1990, 1995, 2000,2005
Norway1971-1972, 1980-1981, 1990-1991, 2000-2001
Slovenia 1965, 2000-2001
South Africa 2000
Spain1992-1993, 1997-1998, 2002-2003, 2002-2003, 2008,2009-2010
Sweden 1990-1991, 2000-2001
United Kingdom1974-1975, 1983-1984, 1987, 1995, 2000-2001, 2005
1961
United States1965-1966, 1975-1976, 1985, 1992-1994, 1994-1995,1998-2001, 2003-2012
22/08/2013
7
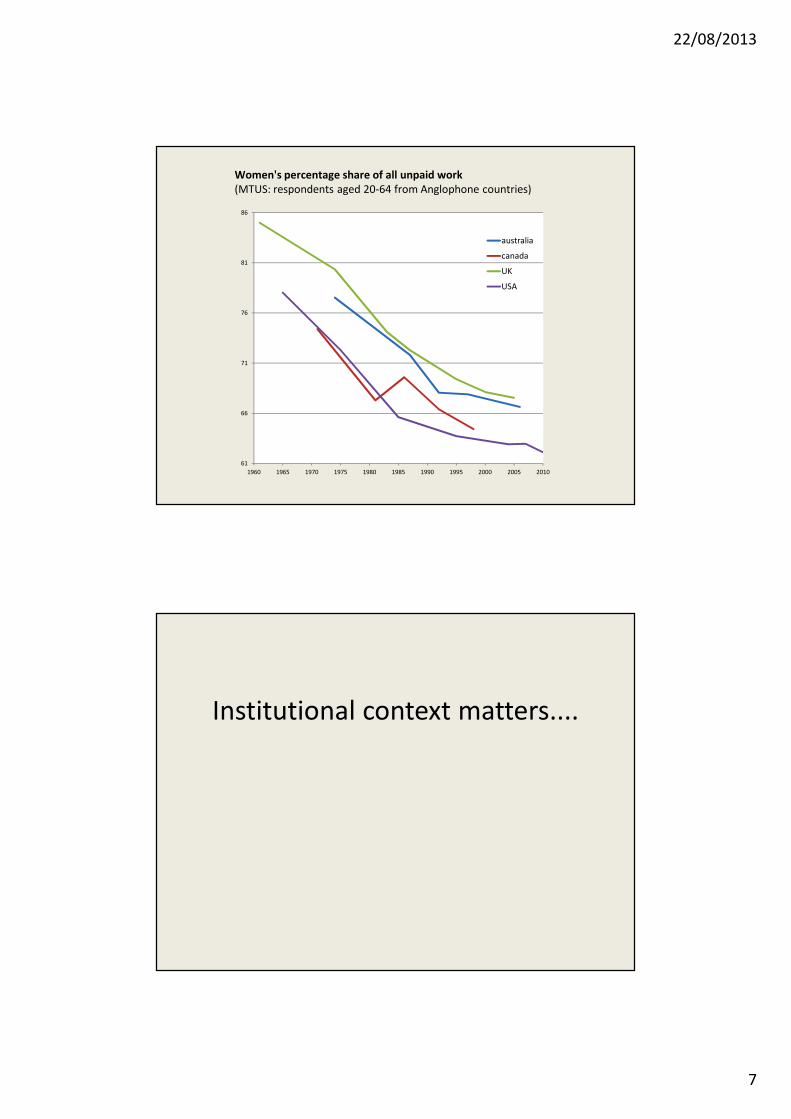
61
66
71
76
81
86
1960 1965 1970 1975 1980 1985 1990 1995 2000 2005 2010
australia
canada
UK
USA
Women's percentage share of all unpaid work
(MTUS: respondents aged 20-64 from Anglophone countries)
Institutional context matters....
22/08/2013
8
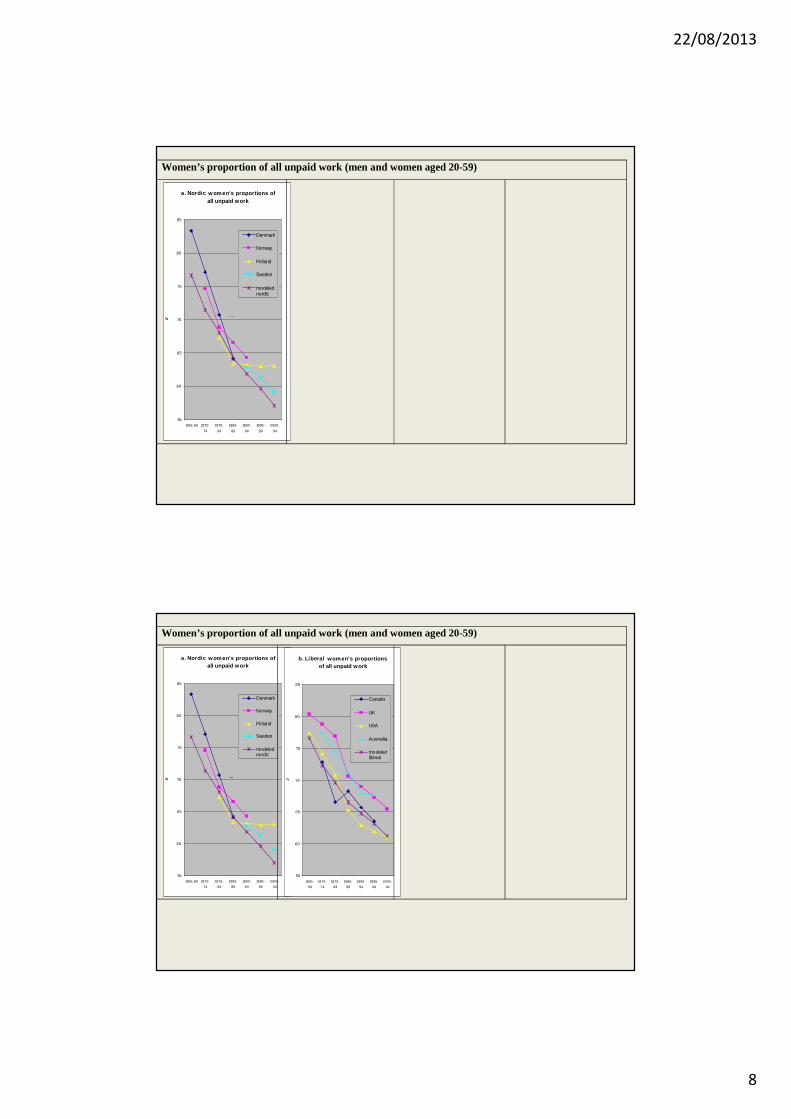
Women’s proportion of all unpaid work (men and women aged 20-59)
a. Nordic w omen's proportions of all unpaid work
55
60
65
70
75
80
85
1961-69 1970-
74
1975-
84
1985-
89
1990-
94
1995-
99
2000-
04
%
Denmark
Norway
Finland
Sweden
modelednordic
ew
Women’s proportion of all unpaid work (men and women aged 20-59)
a. Nordic w omen's proportions of all unpaid work
55
60
65
70
75
80
85
1961-69 1970-
74
1975-
84
1985-
89
1990-
94
1995-
99
2000-
04
%
Denmark
Norway
Finland
Sweden
modelednordic
ew
b. Liberal women's proportions of all unpaid work
55
60
65
70
75
80
85
1961-
69
1970-
74
1975-
84
1985-
89
1990-
94
1995-
99
2000-
04
%
Canada
UK
USA
Australia
modeledliberal
e
22/08/2013
9
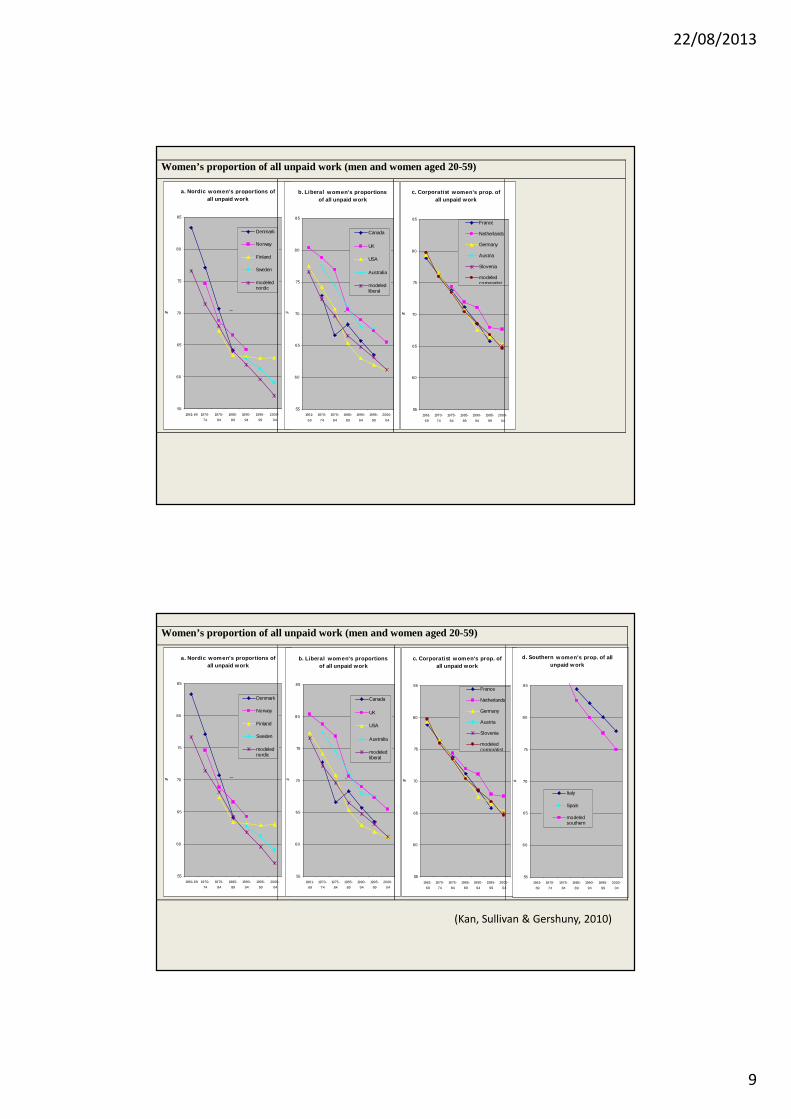
Women’s proportion of all unpaid work (men and women aged 20-59)
a. Nordic women's proportions of all unpaid work
55
60
65
70
75
80
85
1961-69 1970-
74
1975-
84
1985-
89
1990-
94
1995-
99
2000-
04
%
Denmark
Norway
Finland
Sweden
modelednordic
ew
b. Liberal women's proportions of all unpaid work
55
60
65
70
75
80
85
1961-
69
1970-
74
1975-
84
1985-
89
1990-
94
1995-
99
2000-
04
%
Canada
UK
USA
Australia
modeledliberal
e
c. Corporatist women's prop. of all unpaid work
55
60
65
70
75
80
85
1961-
69
1970-
74
1975-
84
1985-
89
1990-
94
1995-
99
2000-
04
%
France
Netherlands
Germany
Austria
Slovenia
modeledcorporatist
Women’s proportion of all unpaid work (men and women aged 20-59)
a. Nordic women's proportions of all unpaid work
55
60
65
70
75
80
85
1961-69 1970-
74
1975-
84
1985-
89
1990-
94
1995-
99
2000-
04
%
Denmark
Norway
Finland
Sweden
modelednordic
ew
b. Liberal women's proportions of all unpaid work
55
60
65
70
75
80
85
1961-
69
1970-
74
1975-
84
1985-
89
1990-
94
1995-
99
2000-
04
%
Canada
UK
USA
Australia
modeledliberal
e
c. Corporatist w omen's prop. of all unpaid work
55
60
65
70
75
80
85
1961-
69
1970-
74
1975-
84
1985-
89
1990-
94
1995-
99
2000-
04
%
France
Netherlands
Germany
Austria
Slovenia
modeledcorporatist
d. Southern w omen's prop. of all unpaid w ork
55
60
65
70
75
80
85
1961-
69
1970-
74
1975-
84
1985-
89
1990-
94
1995-
99
2000-
04
%
Italy
Spain
modeledsouthern
(Kan, Sullivan & Gershuny, 2010)
22/08/2013
10
• So trends are in the right direction, and we
also know that there is a widely-held norm of
‘fairness’ within couples in the distribution of
total work………..
• Why then is the remaining inequality in
unpaid work so important?
• When a child is born, social norms and post-
childbirth biology mean that it is generally the
woman who takes time out, or goes part-time
• � the wage gap bind
22/08/2013
11
2 institutional solutions
• One (almost inconceivable in the present US
political climate, but widely practiced
elsewhere) is to raise taxes so as to
substantially subsidize childcare provision.
• The other is statutory reduction of working
hours for both partners in combination with
genuine flexibility to the point that their paid
work can be staggered, enabling a shorter
duration of paid childcare.
22/08/2013
12
• A combination of both of these lines of action
helps explain why the Nordic countries
perform better than the Anglophone at
sharing unpaid work.
Long-term trends in unpaid work in the
direction of greater gender equality (i.e.
convergence)
Not a call for complacency!
- A historical process, rather than a
revolution......
22/08/2013
13
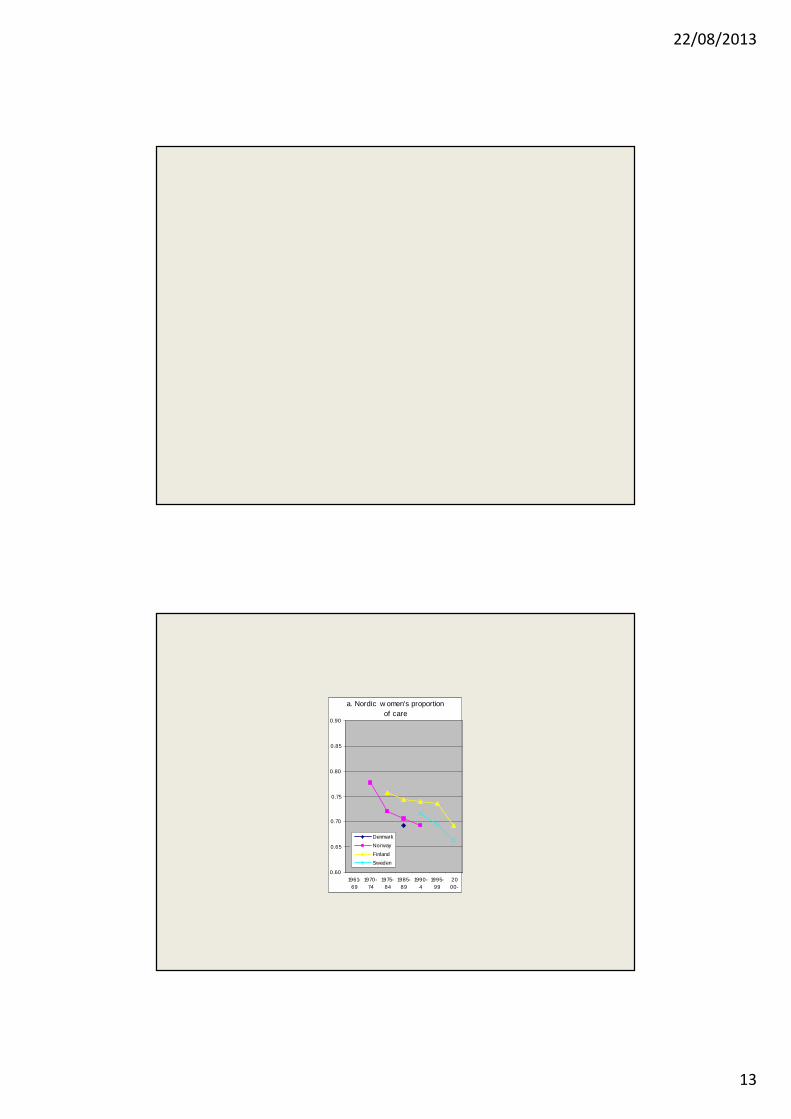
a. Nordic w omen's proportion of care
0.60
0.65
0.70
0.75
0.80
0.85
0.90
1961-69
1970-74
1975-84
1985-89
1990-4
1995-99
2000-
Denmark
Norway
Finland
Sweden
22/08/2013
14
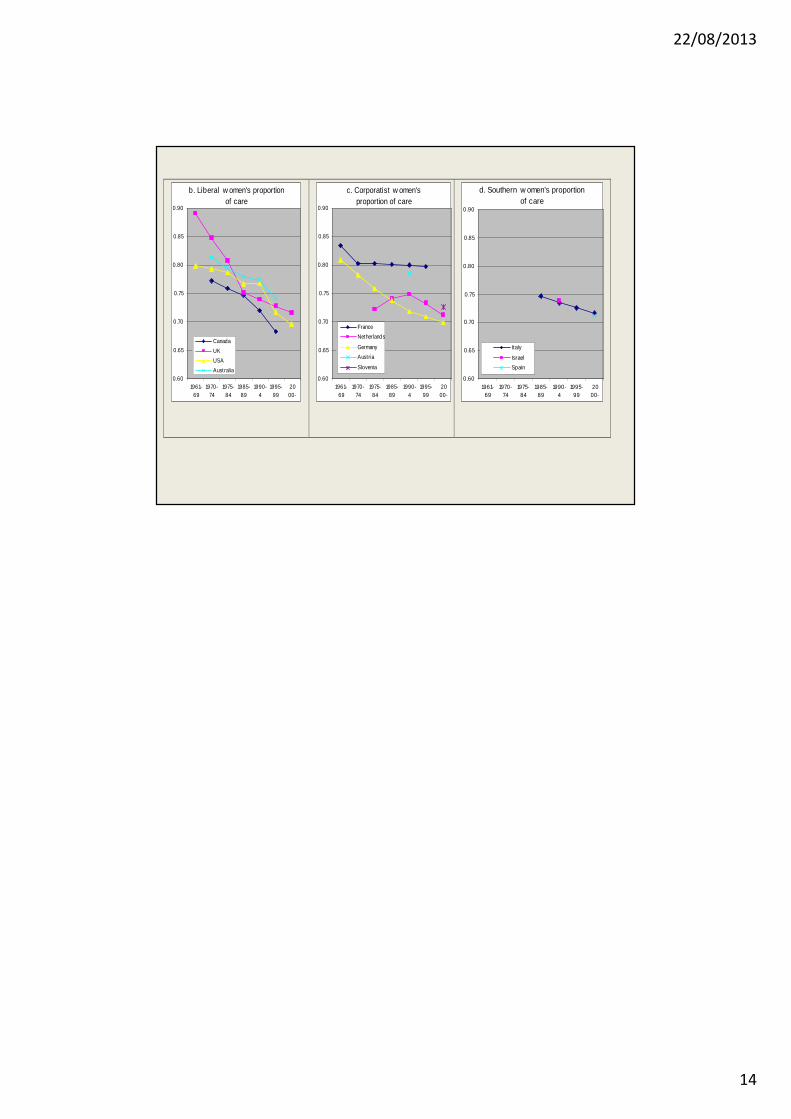
b. Liberal w omen's proportion of care
0.60
0.65
0.70
0.75
0.80
0.85
0.90
1961-69
1970-74
1975-84
1985-89
1990-4
1995-99
2000-
Canada
UK
USA
Australia
c. Corporatist w omen's proportion of care
0.60
0.65
0.70
0.75
0.80
0.85
0.90
1961-69
1970-74
1975-84
1985-89
1990-4
1995-99
2000-
France
Netherlands
Germany
Austria
Slovenia
d. Southern w omen's proportion of care
0.60
0.65
0.70
0.75
0.80
0.85
0.90
1961-69
1970-74
1975-84
1985-89
1990-4
1995-99
2000-
Italy
Israel
Spain