Embed Size (px)
Citation preview
lable at ScienceDirect
Atmospheric Environment 43 (2009) 4278–4282
Contents lists avai
Atmospheric Environment
journal homepage: www.elsevier .com/locate/a tmosenv
The contribution of biological particles to observed particulate organic carbonat a remote high altitude site
Christine Wiedinmyer a,*, Robert M. Bowers b, Noah Fierer b,c, Eszter Horanyi d, Michael Hannigan d,A. Gannet Hallar e, Ian McCubbin e, Kelly Baustian f
a National Center for Atmospheric Research, 1850 Table Mesa Dr., Boulder, CO 80301, USAb Department of Ecology and Evolutionary Biology, University of Colorado, Boulder, CO, USAc Cooperative Institute for Research in Environmental Sciences, University of Colorado, Boulder, CO, USAd Department of Mechanical Engineering, University of Colorado, Boulder, CO, USAe Desert Research Institute, Storm Peak Laboratory, Steamboat Springs, CO, USAf Department of Atmospheric and Oceanic Science, University of Colorado, Boulder, CO, USA
a r t i c l e i n f o
Article history:Received 13 February 2009Received in revised form22 May 2009Accepted 9 June 2009
Keywords:Primary biological particlesParticulate organic carbonHigh altitude siteStorm peak laboratoryBacteriaFungal spores
* Corresponding author. Tel.: þ1 303 497 1414; faxE-mail address: [email protected] (C. Wiedinmyer
1352-2310/$ – see front matter � 2009 Elsevier Ltd.doi:10.1016/j.atmosenv.2009.06.012
a b s t r a c t
Although a significant fraction of atmospheric particulate mass is organic carbon, the sources ofparticulate organic carbon (POC) are not always apparent. One potential source of atmospheric POC isbiological particles, such as bacteria, pollen, and fungal spores. Measurements of POC and biologicalparticles, including bacteria, fungal spores, and pollen, were made as part of the Storm Peak Aerosol andCloud Characterization Study in Steamboat Springs, CO in March–April 2008. Biological particles wereidentified and characterized using several methods. The results suggest that biological particles couldaccount for an average of 40% of the organic carbon mass in particles with aerodynamic diameters lessthan 10 mm. These estimates of POC mass from biological particles are highly uncertain; however, theresults suggest that biological particles could be a significant source of organic aerosol in the backgroundcontinental atmosphere and further observations are needed to better constrain these estimates.
� 2009 Elsevier Ltd. All rights reserved.
1. Introduction
Atmospheric aerosols impact climate through direct and indi-rect forcing, degrade air quality and visibility, and have detrimentaleffects on human health, and are therefore important on manyscales. Particulate organic carbon (POC) is a significant componentof atmospheric aerosols in polluted urban airsheds as well as inmore remote regions (e.g., Zhang et al., 2007). Despite the impor-tance of POC in the atmosphere, the sources of POC are oftenundetermined. Many model simulations of POC in polluted atmo-spheres underestimate the POC mass by as much as an order ofmagnitude when compared to observations (e.g., Heald et al.,2005), whereas remote areas show closer agreement, but arenonetheless highly uncertain due to slow rates of POC formation(Tunved et al., 2006). Possible explanations for this model/measurement discrepancy include incorrect emission estimates ofprimary POC and precursor volatile organic compounds, missingprecursors of secondary organic aerosol production, and missing
: þ1 303 497 1400.).
All rights reserved.
chemical and physical processes that lead to secondary organicaerosol production. Several studies suggest that a main source ofmeasured POC is modern, in other words not derived from fossilfuel sources. For example, Ke et al. (2007) used organic tracer-basedchemical mass balance (CMB) modeling and radiocarbon (C-14)measurements in the Tennessee Valley Region of the eastern U.S.and determined that as much as 84% of the observed summertimePOC was contemporary (i.e., modern carbon, and not from fossilfuel combustion).
One major source of contemporary POC is secondary aerosolformation via the photo-oxidation of biogenic volatile organiccompounds. Although this is estimated to be a significant source ofatmospheric POC (e.g., Henze and Seinfeld, 2006), inclusion ofsecondary aerosols does not necessarily rectify the aforementionedmodel/measurement discrepancies. For example, Sakulyanontvittayaet al. (2008) show that inclusion of biogenic sesquiterpene emissionsand subsequent secondary aerosol formation improves modelperformance in regional chemical model simulations of the U.S.;however, the model results still underpredict POC when compared tonetwork observations. Another source of POC to the atmosphere thatis not currently considered in most model simulations is primarybiological particles, which include bacteria, fungal spores, and plant
C. Wiedinmyer et al. / Atmospheric Environment 43 (2009) 4278–4282 4279
pollen. Recent studies suggest that primary biological particles cancontribute significantly to atmospheric POC; however, the results ofthese studies are limited and vary substantially. Based on measure-ments in the Amazon, Elbert et al. (2007) attributed an average of 35%of the total aerosol mass to be fungal spores. At a continental back-ground site in the Austrian Alps in March 2000, Bauer et al. (2002b)measured biological components in atmospheric samples andestimated that bacteria comprise to 0.03% and fungal spores 0.9% ofthe total observed POC mass. However, at a suburban site, Bauer et al.(2008) report that fungal spores comprise 6% and 14% of the POC massconcentration in the spring and summer, respectively. Not only areprimary biological particles potentially an important contribution oforganic aerosol in the atmosphere, specific microbial species maydirectly influence climatic conditions by acting as cloud and icenucleators (e.g., Vali, 1971, 1996).
In March and April 2008, measurements of POC and biologicalparticles were made at a remote mountain laboratory. Using thesemeasurements, the potential contribution of biological particles tothe observed mass of particulate organic carbon with diametersless than 10 mm (POC10) is estimated. The results of the observa-tions and analysis suggest that the biological component of theobserved POC10 was substantial and further study is warranted.
2. Methods
The Storm Peak Aerosol and Cloud Characterization Study(SPACCS08) was conducted from March 24 though April 15, 2008 atthe Storm Peak Laboratory (SPL), located on top of Mt. Wernerwithin the Steamboat Springs ski resort in Colorado (40.45�N,106.73�W; 3200 m ASL). Measurements of meteorological vari-ables, particle number and size distribution, organic and elementalcarbon mass concentrations in particles with aerodynamic diame-ters less than 10 mm, and biological particle concentrations andcomposition were completed as part of SPACCS08. Site meteorologyparameters, including wind speed and direction, temperature,relative humidity, and pressure, were observed throughout thestudy at 5 min intervals. Measurements of particle numberconcentrations and size distributions of particles with aerodynamicdiameters from 530 nm to 18.4 mm were made with a TSI Aero-dynamic Particle Sizer (TSI APS; Model 3320). The instrument wascalibrated by the manufacture (TSI) in October 2007. The instru-ment flow was checked previous to the SPACCS08 campaign. Thenumber and size distribution of particles with aerodynamicdiameters from 10 to 330 nm were measured with a TSI ScanningMobility Particle Sizer (SMPS; Model 3396L22 with a TSI 3022Condensation Particle Counter). Particles measured with the APSand SMPS were sampled at a flow rate of w50 L min�1 from aninsulated, 15 cm diameter manifold within approximately 1 m of itshorizontal entry point through an outside wall. The 4 m highvertical section outside the building is capped with an inverted canto exclude cloud and ice. The APS, SMPS, and meteorological dataare collected regularly as part of the SPL instrument suite.
As part of SPACC08, a semi-continuous Sunset LaboratoryOrganic and Elemental Carbon (OC/EC) thermo-optical trans-mission analyzer (Birch and Cary, 1996) was deployed at SPL. Thisfield instrument was compared with the laboratory-based NIOSH5040 method (NIOSH, 1996; Bae et al., 2004) when both were runoff the same inlet for an entire year as part of the St. Louis-MidwestSupersite. Excellent agreement was observed with a coefficient ofregression, r2, for total carbon (EC þ POC) of 0.89 and an r2 for POCof 0.90. The precision of the field instrument was evaluated by aspart of the Southern California Supersite (Arhami et al., 2006) astwo instruments were run side-by-side. The r2 for side-by-sidehourly POC was 0.98 and 0.97 for hourly EC. For this study, atmo-spheric samples were collected at a flow rate of 6.2 L m�1 through
a URG cyclone, which restricted the sampling to those particleswith diameters less than 10 mm. Incoming air samples were passedthrough a carbon paper organic gas denuder (provided by SunsetLabs) and collected on a quartz filter in the instrument. The stan-dard four-step helium environment heating procedure (340, 500,615, and 870 �C) was used to analyze POC. Samples were collectedover a 4 h period to maximize the number of measurements withEC and OC above detection limits (manufacturer states detectionlimit of 0.05 mg m�3 for a 4 h sample) while still providing a hightime resolution image of aerosol properties. OC/EC measurementswere made from March 31 through April 15, 2009.
Biological particles (bacteria, fungal spores, and plant pollen)were collected from a separate system comprised of two 0.2 mmcellulose nitrate filters (Fisher Scientific, Pittsburgh, PA). Ambientair was pulled through each of two filters simultaneously witha flow rate of 7.5 L min�1 per filter for periods of time that rangedfrom 5.5 to 12.25 h. Samples were collected at 9 different timeperiods from March 23 to April 07, 2008 and the total volume of aircollected during each sampling period ranged from 2.5 m3 to 5.4 m3
per filter. After each sampling period, the two filters were imme-diately frozen at �20 �C. One filter of each set was used for totalmicrobial abundance measurements via epifluorescence micros-copy and the second used for DNA extraction and microbialcommunity composition analyses. For the first, particles (includingmicrobial cells) were shaken from the filters into 8 mL of HPLC-grade water in a small Petri dish for 2 h at 4 �C. A subset of the filterswas examined under a microscope after this shaking process toassure that most visible particles were removed from the filter.While the efficiency of particle removal was not evaluated for everyindividual sample, all sample filters were treated identically, andtherefore any bias associated with this method should be heldconstant across the sample set. The particles were stained with40-60-Diamidino-2-phenylindole (DAPI), a DNA binding dye (KPL,Gaithersburg, MD) at a final working concentration of 500 mg mL�1,and counted at 1000� magnification using a Nikon Eclipse E400-epifluorescence microscope following a similar protocol to the onedescribed in Hernandez et al. (1999). Briefly, intact cells werecounted on 25 mm diameter black polycarbonate filters with poresizes of 0.22 mm (GEI-W&PT, Trevose, PA). Microbial abundance isexpressed as cells per cubic meter of air, taking into account thedilution, the flow rate, and the number of hours sampled.
The second filter of each set was used to measure the relativeabundance of bacteria, fungal spores, and pollen in the air samples.This was determined using the molecular, sequence-based tech-nique described in Fierer et al. (2008). Briefly, the Ultra-Clean PlantDNA isolation kit (MoBio Laboratories, Carlsbad, CA) was used toextract the DNA from microbial cells trapped on the filters. Small-subunit rRNA genes were amplified using a universal PCR primerset (515F, 1391R; Angenent et al., 2005), the amplicons were clonedusing the TOPO TA cloning kit (Invitrogen), and on average, 53clones per sample were sequenced at Agencourt Bioscience(Beverly, MA). The sequences were then assigned to taxa using theBLAST algorithm against the GenBank nr database, assuming thatthe proportional representation of sequences in each clone libraryreflects the representation of bacterial, fungal, and plant pollencells in each collected air sample. Considering the fact that DNA isvery unstable in the free environment (e.g., when not containedwithin a cell) due to UV radiation and other atmospheric stresses,this method should allow us to assess the relative abundances ofbacterial, fungal, and pollen cells in the atmosphere.
Five of the biological particle samples had corresponding POC10measurements. Not all of the samples were coincident due to thetiming of the different sampling techniques, and instrumentmalfunction of the OC/EC analyzer that required it to be offline forpart of the study.
C. Wiedinmyer et al. / Atmospheric Environment 43 (2009) 4278–42824280
3. Results
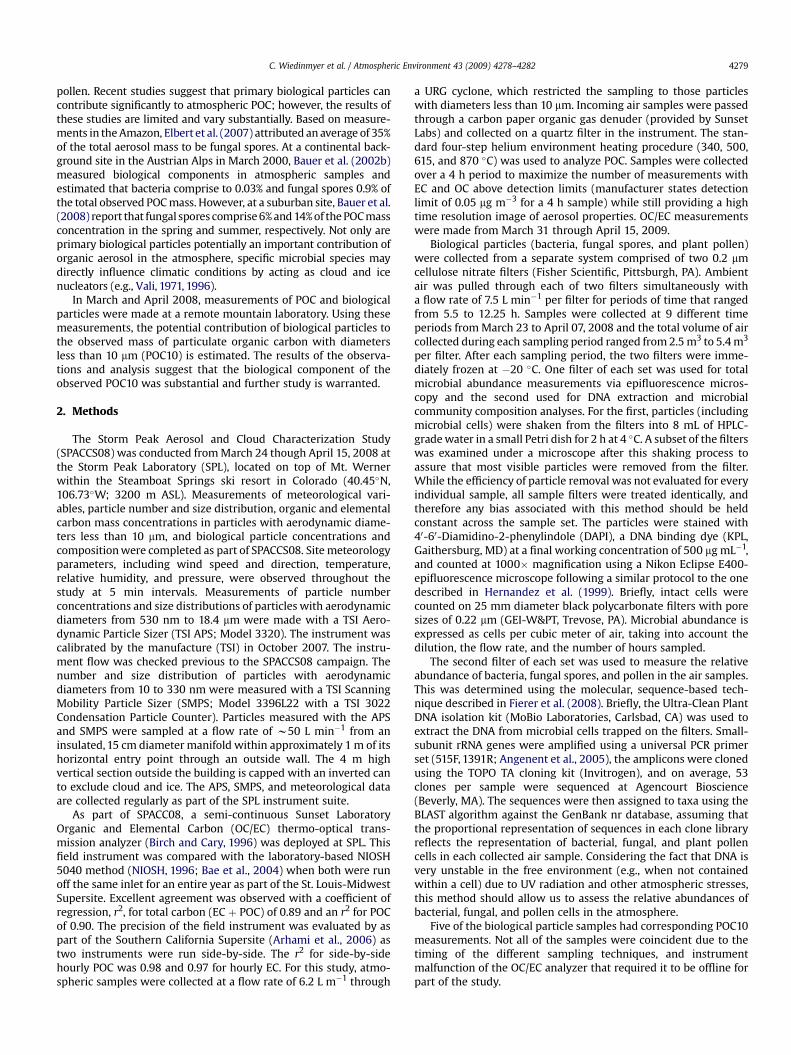
Averaged over the study period from March 24 to April 15, 2008,hourly total particle number concentrations measured with theSMPS and the APS averaged 1900 cm�3 and 140 cm�3, respectively(Fig. 1). These concentrations are similar to those reported byLowenthal et al. (2002) during a study at SPL in February–May,2001, where they observed particle number concentrations(particles > 10 nm) of 1221 and 3893 cm�3 during cloudy and clearconditions, respectively. These values are typical of continental toremote regions, where particle number concentrations character-istically range from 2000 to 10,000 cm�3 (Seinfeld and Pandis,1998). The average number concentrations of the smaller particlesmeasured by the SMPS showed a diurnal profile (Fig. 1a), which issuspected to be due to the mixing up of the boundary layer air fromthe valley below with clean tropospheric air and the resultingaerosol formation. These types of observations have been observedat other sites (e.g., Shaw, 2007). Although daytime increases in thesmall particle number concentrations were observed regularly, the
Fig. 1. Average diurnal particle number concentrations (March 30–April 10, 2008) of 10–330 nm and 0.5–5 mm and particles measured by the SMPS (1a, top) and APS (1b,bottom), respectively. Explanation of symbols in boxplot: Vertical lines represent thelower quartile, median, and upper quartile values. Means are shown as gray squares.Whiskers extend from each end of the box to the adjacent values in the data; the mostextreme values within 1.5 times the interquartile range from the ends of the box.Outliers are data with values beyond the ends of the whiskers and are displayed witha gray dot.
larger particle (>0.5 mm) number concentrations do not appear toshow this same diurnal trend (Fig. 1b). Since the larger particlescomprise the majority of the measured particulate mass, weassume that the observed particulate mass was not significantlyinfluenced by diurnal variations and was more indicative of theregional background aerosol that has experienced much longeratmospheric lifetimes.
Between April 01 and April 07, when the biological particle andPOC10 measurements were coincident, the measured POC10 rangedfrom 0.39 to 1.64 mg m�3, with an average of 0.74 mg m�3 (Table 1).These observations show no distinct diurnal profile and do notappear to have been influenced by the meteorological conditions.The POC10 measurements are consistent with organic aerosolmeasurements made at SPL in April and May 2004, where an averageof w1 mm m�3 organic aerosol (diameters < 1 mm) were observed(Zhang et al., 2007; E. Dunlea, personal communications). Theobserved POC concentrations are also similar to those observed atother remote high mountain sites. For example, measurements ofPOC at a high alpine site in the Swiss Alps (Jungfraujoch;3580 m.a.s.l.), where a Sunset Labs OC/EC instrument was deployedbetween February and March 2005, were up to w2 mg m�3, althoughconcentrations were typically <1 mg m�3 (Cozic et al., 2008). Basedon a comparison with other observations from remote continentalmountain sites, the observations made as part of SPACCS08 werevery similar in magnitude, suggesting that this site is representativeof remote, high altitude background concentrations.
Biological particle concentrations and community compositionwere determined by DAPI counts (Bauer et al., 2002b) and ribo-somal DNA sequencing, respectively. The ribosomal sequencingapproach allowed us to determine the approximate proportions ofbacteria, fungi, and pollen for each of the nine air samples. Overall,plant pollen contributed the least to the DNA-containing particles(average of 4%): fungal spores and bacteria made up the majority(Table 2). DNA analysis of the biological particles shows a consistentspecies distribution through all samples, suggesting that theairborne microbial abundance and community composition ofthe high alpine environment is surprisingly stable throughout theshifting atmospheric conditions (Bowers et al., in press). This resultis consistent with work performed by Despres et al. (2007), as theair above the high alpine environment was found to be the leastmicrobially diverse of three surveyed landscapes (urban, rural, andhigh-alpine).
Using the results of the biological particle analysis and themeasured concentrations of POC10 from SPL during SPACCS08, weattempt to constrain the relative contributions of biological parti-cles to measured POC10 in remote, continental air masses. Thenumber concentration of biological particles was on the order of106 m�3, ranging from 9.56 � 105 to 6.61 � 106 m�3 (Table 1).Because pollen is typically larger than 10 mm in diameter (e.g.,Ingrouille and Eddie, 2006), it is assumed that none of the observedpollen was measured by the Sunset Labs OC/EC instrument. Addi-tionally, based on a qualitative assessment during the DAPI counts,approximately 1–10% of the biological particles counted werelarger than 10 mm. To account for these larger particles that wereidentified in the biological particle analysis, but would not havebeen measured by the OC/EC instrument, we assume that only 90%of the total measured biological particle number concentrationsrepresent particles observed by the OC/EC instrument.
To estimate the mass of the observed biological particles, anempirical fit was used to estimate the dry weight (DW) of thebiological particles as a function of the cell volume (V):DW ¼ 485 � V0.86 (Loferer-Krossbacher et al., 1998), assuming anaverage cell size to estimate the volume of the observed biologicalparticles measured at SPL. Bacteria typically range in size from0.5 mm to 2.5 mm (Wiedinmyer et al., 2006 and references therein)
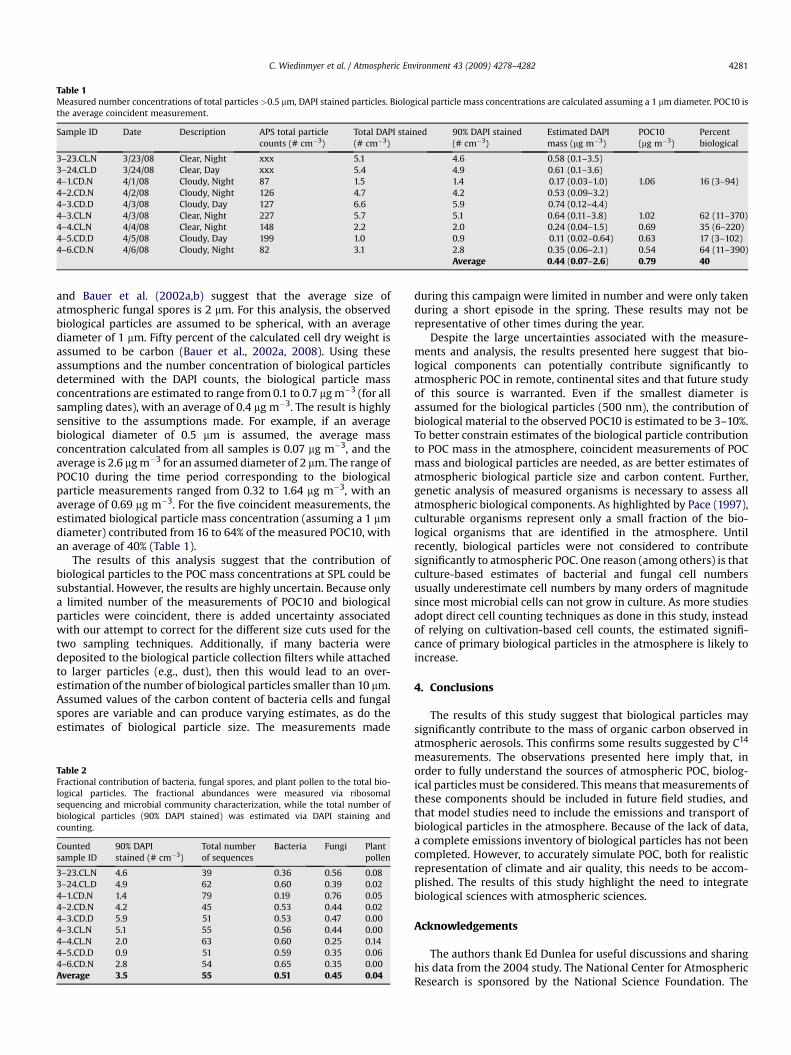
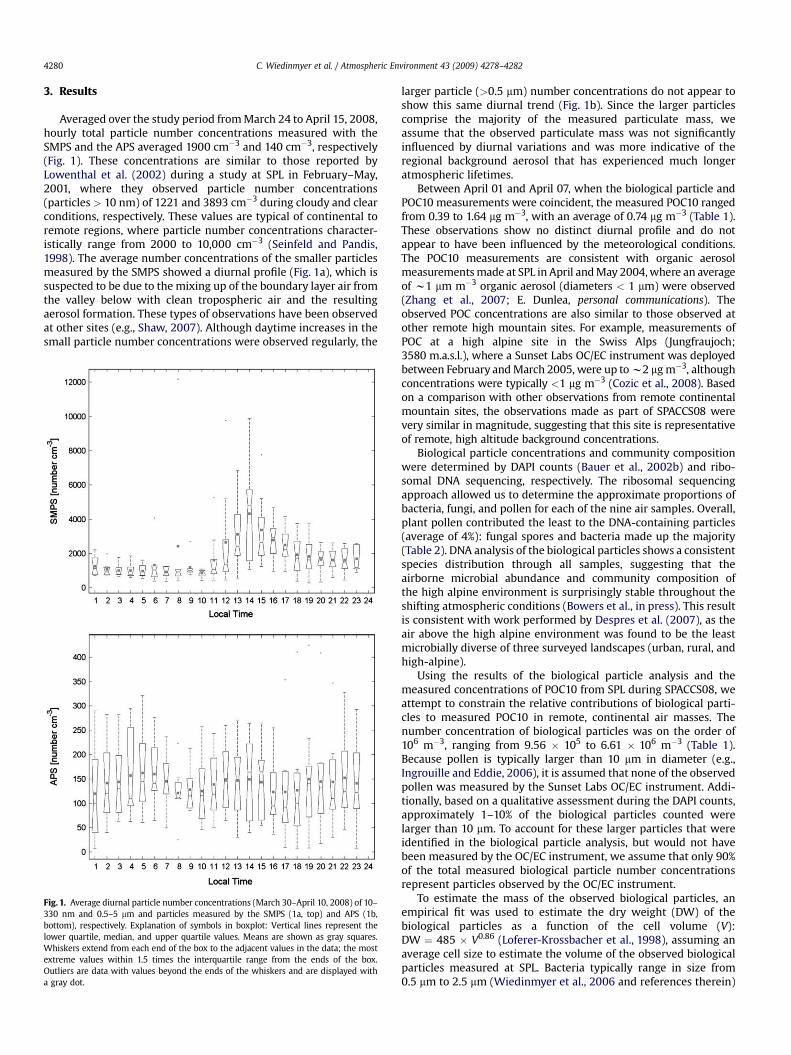
Table 1Measured number concentrations of total particles >0.5 mm, DAPI stained particles. Biological particle mass concentrations are calculated assuming a 1 mm diameter. POC10 isthe average coincident measurement.
Sample ID Date Description APS total particlecounts (# cm�3)
Total DAPI stained(# cm�3)
90% DAPI stained(# cm�3)
Estimated DAPImass (mg m�3)
POC10(mg m�3)
Percentbiological
3–23.CL.N 3/23/08 Clear, Night xxx 5.1 4.6 0.58 (0.1–3.5)3–24.CL.D 3/24/08 Clear, Day xxx 5.4 4.9 0.61 (0.1–3.6)4–1.CD.N 4/1/08 Cloudy, Night 87 1.5 1.4 0.17 (0.03–1.0) 1.06 16 (3–94)4–2.CD.N 4/2/08 Cloudy, Night 126 4.7 4.2 0.53 (0.09–3.2)4–3.CD.D 4/3/08 Cloudy, Day 127 6.6 5.9 0.74 (0.12–4.4)4–3.CL.N 4/3/08 Clear, Night 227 5.7 5.1 0.64 (0.11–3.8) 1.02 62 (11–370)4–4.CL.N 4/4/08 Clear, Night 148 2.2 2.0 0.24 (0.04–1.5) 0.69 35 (6–220)4–5.CD.D 4/5/08 Cloudy, Day 199 1.0 0.9 0.11 (0.02–0.64) 0.63 17 (3–102)4–6.CD.N 4/6/08 Cloudy, Night 82 3.1 2.8 0.35 (0.06–2.1) 0.54 64 (11–390)
Average 0.44 (0.07–2.6) 0.79 40
C. Wiedinmyer et al. / Atmospheric Environment 43 (2009) 4278–4282 4281
and Bauer et al. (2002a,b) suggest that the average size ofatmospheric fungal spores is 2 mm. For this analysis, the observedbiological particles are assumed to be spherical, with an averagediameter of 1 mm. Fifty percent of the calculated cell dry weight isassumed to be carbon (Bauer et al., 2002a, 2008). Using theseassumptions and the number concentration of biological particlesdetermined with the DAPI counts, the biological particle massconcentrations are estimated to range from 0.1 to 0.7 mg m�3 (for allsampling dates), with an average of 0.4 mg m�3. The result is highlysensitive to the assumptions made. For example, if an averagebiological diameter of 0.5 mm is assumed, the average massconcentration calculated from all samples is 0.07 mg m�3, and theaverage is 2.6 mg m�3 for an assumed diameter of 2 mm. The range ofPOC10 during the time period corresponding to the biologicalparticle measurements ranged from 0.32 to 1.64 mg m�3, with anaverage of 0.69 mg m�3. For the five coincident measurements, theestimated biological particle mass concentration (assuming a 1 mmdiameter) contributed from 16 to 64% of the measured POC10, withan average of 40% (Table 1).
The results of this analysis suggest that the contribution ofbiological particles to the POC mass concentrations at SPL could besubstantial. However, the results are highly uncertain. Because onlya limited number of the measurements of POC10 and biologicalparticles were coincident, there is added uncertainty associatedwith our attempt to correct for the different size cuts used for thetwo sampling techniques. Additionally, if many bacteria weredeposited to the biological particle collection filters while attachedto larger particles (e.g., dust), then this would lead to an over-estimation of the number of biological particles smaller than 10 mm.Assumed values of the carbon content of bacteria cells and fungalspores are variable and can produce varying estimates, as do theestimates of biological particle size. The measurements made
Table 2Fractional contribution of bacteria, fungal spores, and plant pollen to the total bio-logical particles. The fractional abundances were measured via ribosomalsequencing and microbial community characterization, while the total number ofbiological particles (90% DAPI stained) was estimated via DAPI staining andcounting.
Countedsample ID
90% DAPIstained (# cm�3)
Total numberof sequences
Bacteria Fungi Plantpollen
3–23.CL.N 4.6 39 0.36 0.56 0.083–24.CL.D 4.9 62 0.60 0.39 0.024–1.CD.N 1.4 79 0.19 0.76 0.054–2.CD.N 4.2 45 0.53 0.44 0.024–3.CD.D 5.9 51 0.53 0.47 0.004–3.CL.N 5.1 55 0.56 0.44 0.004–4.CL.N 2.0 63 0.60 0.25 0.144–5.CD.D 0.9 51 0.59 0.35 0.064–6.CD.N 2.8 54 0.65 0.35 0.00Average 3.5 55 0.51 0.45 0.04
during this campaign were limited in number and were only takenduring a short episode in the spring. These results may not berepresentative of other times during the year.
Despite the large uncertainties associated with the measure-ments and analysis, the results presented here suggest that bio-logical components can potentially contribute significantly toatmospheric POC in remote, continental sites and that future studyof this source is warranted. Even if the smallest diameter isassumed for the biological particles (500 nm), the contribution ofbiological material to the observed POC10 is estimated to be 3–10%.To better constrain estimates of the biological particle contributionto POC mass in the atmosphere, coincident measurements of POCmass and biological particles are needed, as are better estimates ofatmospheric biological particle size and carbon content. Further,genetic analysis of measured organisms is necessary to assess allatmospheric biological components. As highlighted by Pace (1997),culturable organisms represent only a small fraction of the bio-logical organisms that are identified in the atmosphere. Untilrecently, biological particles were not considered to contributesignificantly to atmospheric POC. One reason (among others) is thatculture-based estimates of bacterial and fungal cell numbersusually underestimate cell numbers by many orders of magnitudesince most microbial cells can not grow in culture. As more studiesadopt direct cell counting techniques as done in this study, insteadof relying on cultivation-based cell counts, the estimated signifi-cance of primary biological particles in the atmosphere is likely toincrease.
4. Conclusions
The results of this study suggest that biological particles maysignificantly contribute to the mass of organic carbon observed inatmospheric aerosols. This confirms some results suggested by C14
measurements. The observations presented here imply that, inorder to fully understand the sources of atmospheric POC, biolog-ical particles must be considered. This means that measurements ofthese components should be included in future field studies, andthat model studies need to include the emissions and transport ofbiological particles in the atmosphere. Because of the lack of data,a complete emissions inventory of biological particles has not beencompleted. However, to accurately simulate POC, both for realisticrepresentation of climate and air quality, this needs to be accom-plished. The results of this study highlight the need to integratebiological sciences with atmospheric sciences.
Acknowledgements
The authors thank Ed Dunlea for useful discussions and sharinghis data from the 2004 study. The National Center for AtmosphericResearch is sponsored by the National Science Foundation. The
C. Wiedinmyer et al. / Atmospheric Environment 43 (2009) 4278–42824282
Desert Research Institute is an equal opportunity service providerand employer. The Desert Research Institute is a permittee of theMedicine-Bow Routt National Forests. We appreciate the assistancefrom Steamboat Ski and Resort Corporation for continued supportof SPL and our research projects. Additional support was providedthrough NSF grant ATM0404790 and a CIRES IRP grant to N.F.
References
Angenent, L.T., Kelley, S.T., Amand, A.S., Pace, N.R., Hernandez, M.T., 2005. Molecularidentification of potential pathogens in water and air of a hospital therapy pool.Proceedings of the National Academies of Science USA 102, 4860–4865.
Arhami, M., Kuhn, T., Fine, P.M., Delfino, R.J., Sioutas, C., 2006. Effects of samplingartifacts and operating parameters on the performance of a semicontinuousparticulate elemental carbon/organic carbon monitor. Environmental Science &Technology 40, 945–954.
Bae, M.-S., Schauer, J.J., DeMinter, J.T., Turner, J.R., Smith, D., Cary, R.A., 2004. Validationof a semi-continuous instrument for elemental carbon and organic carbon usinga thermal-optical method. Atmospheric Environment 38, 2885–2893.
Bauer, H., Kasper-Giebl, A., Loflund, M., Giebl, H., Hitzenberger, R., Zibuschka, F.,Puxbaum, H., 2002a. The contribution of bacteria and fungal spores to theorganic carbon content of cloud water, precipitation and aerosols. AtmosphericResearch 64, 109–119.
Bauer, H., Kasper-Giebl, A., Zibuschka, F., Hitzenberger, R., Kraus, G.F., Puxbaum, H.,2002b. Determination of the carbon content of airborne fungal spores.Analytical Chemistry 74 (1), 91–95.
Bauer, H., Schueller, E., Weinke, G., Berger, A., Hitzenberger, R., Marr, I.L.,Puxbaum, H., 2008. Significant contributions of fungal spores to the organiccarbon and to the aerosol mass balance of the urban atmospheric aerosol.Atmospheric Environment 42 (22), 5542–5549.
Birch, M.E., Cary, R.A., 1996. Elemental carbon-based method for monitoringoccupational exposures to particulate diesel exhaust. Aerosol Science andTechnology 25 (3), 221–241.
Bowers, R.M., Lauber, C.L., Wiedinmyer, C., Hamady, M., Hallar, A.G., Fall, R., Knight,R., Fierer, N. Characterization of airborne microbial communities at a highelevation site and their potential to act as atmospheric ice nuclei. Applied andEnvironmental Microbiology, in press, doi:10.1128/AEM.00447-09.
Cozic, J., Verheggen, B., Weingartner, E., Crosier, J., Bower, K.N., Flynn, M., Coe, H.,Henning, S., Steinbacher, M., Henne, S., Coen, M.C., Petzold, A., Baltensperger, U.,2008. Chemical composition of free tropospheric aerosol for PM1 and coarsemode at the high alpine site Jungfraujoch. Atmospheric Chemistry and Physics 8(2), 407–423.
Despres, V.R., Nowoisky, J.F., Klose, M., Conrad, R., Andreae, M.O., Poschl, U., 2007.Characterization of primary biogenic aerosol particles in urban, rural, and high-alpine air by DNA sequence and restriction fragment analysis of ribosomal RNAgenes. Biogeosciences 4 (6), 1127–1141.
Elbert, W., Taylor, P.E., Andreae, M.O., Poschl, U., 2007. Contribution of fungi toprimary biogenic aerosols in the atmosphere: wet and dry discharged spores,carbohydrates, and inorganic ions. Atmospheric Chemistry and Physics 7 (17),4569–4588.
Fierer, N., Liu, Z.Z., Rodriguez-Hernandez, M., Knight, R., Henn, M., Hernandez, M.T.,2008. Short-term temporal variability in airborne bacterial and fungalpopulations. Applied and Environmental Microbiology 74 (1), 200–207.
Heald, C.L., Jacob, D.J., Park, R.J., Russell, L.M., Huebert, B.J., Seinfeld, J.H., Liao, H.,Weber, R.J., 2005. A large organic aerosol source in the free troposphere missingfrom current models. Geophysical Research Letters 32 (18), 4.
Henze, D.K., Seinfeld, J.H., 2006. Global secondary organic aerosol from isopreneoxidation. Geophysical Research Letters 33 (9), 4.
Hernandez, M., Miller, S.L., Landfear, D., Macher, J.M., 1999. A Combined fluoro-chrome method for quantitation of metabolocally active and inactive airbornebacteria. Aerosol Science & Technology 30, 145.
Ingrouille, M., Eddie, B., 2006. Plants: Evolution and Diversity. Cambridge Univ.Press, New York, 440 pp.
Ke, L., Ding, X., Tanner, R.L., Schauer, J.J., Zheng, M., 2007. Source contributions tocarbonaceous aerosols in the Tennessee Valley Region. Atmospheric Environ-ment 41 (39), 8898–8923.
Loferer-Krossbacher, M., Klima, J., Psenner, R., 1998. Determination of bacterial celldry mass by transmission electron microscopy and densitometric imageanalysis. Applied and Environmental Microbiology 64 (2), 688–694.
Lowenthal, D.H., Borys, R.D., Wetzel, M.A., 2002. Aerosol distributions and cloudinteractions at a mountaintop laboratory. Journal of Geophysical Research-Atmospheres 107 (D18).
NIOSH, 1996. In: Book Elemental Carbon (Diesel Particulate): Method 5040, fourthed. (1st supplement). NIOSH, Cincinnati.
Pace, N.R., 1997. A molecular view of microbial diversity and the biosphere. Science276 (5313), 734–740.
Sakulyanontvittaya, T., Guenther, A., Helmig, D., Milford, J., Wiedinmyer, C., 2008.Secondary organic aerosol from sesquiterpene and monoterpene emissions inthe United States. Environmental Science & Technology 42 (23), 8784–8790.
Seinfeld, J.H., Pandis, S.N., 1998. Atmospheric Chemistry and Physics, from AirPollution to Climate Change. John Wiley & Sons, Inc., New York, 435 pp.
Shaw, G.E., 2007. Aerosols at a mountaintop observatory in Arizona. Journal ofGeophysical Research 112, D07206. doi:10.1029/2005JD006893.
Tunved, P., Hansson, H.-C., Kerminen, V.-M., Strom, J., Dal Maso, M., Lihavainen, H.,Viisanen, Y., Aalto, P.P., Komppula, M., Kulmala, M., 2006. High natural aerosolloading over boreal forests. Science 312, 261–263. 2006.
Vali, G., 1971. Quantitative evaluation of experimental results on the heterogeneousfreezing nucleation of supercooled liquids. Journal Atmospheric Science 28,402–409.
Vali, G., 1996. Ice nucleation – a review. In: Kulmala, M., Wagner, P. (Eds.), Nucle-ation and Atmospheric Aerosols. Pergamon Press, Oxford, UK, pp. 271–279.
Wiedinmyer, C., et al., 2006. Global organic emissions from vegetation. In:Granier, C., Artaxo, P., Reeves, C.E. (Eds.), Emissions of Atmospheric TraceCompounds. Kluwer Academic Publishers, Boston, pp. 115–170.
Zhang, Q., Jimenez, J.L., Canagaratna, M.R., Allan, J.D., Coe, H., Ulbrich, I.,Alfarra, M.R., Takami, A., Middlebrook, A.M., Sun, Y.L., Dzepina, K., Dunlea, E.,Docherty, K., DeCarlo, P.F., Salcedo, D., Onasch, T., Jayne, J.T., Miyoshi, T.,Shimono, A., Hatakeyama, S., Takegawa, N., Kondo, Y., Schneider, J., Drewnick, F.,Borrmann, S., Weimer, S., Demerjian, K., Williams, P., Bower, K., Bahreini, R.,Cottrell, L., Griffin, R.J., Rautiainen, J., Sun, J.Y., Zhang, Y.M., Worsnop, D.R., 2007.Ubiquity and dominance of oxygenated species in organic aerosols in anthro-pogenically-influenced Northern Hemisphere midlatitudes. GeophysicalResearch Letters 34 (13), 6.