Embed Size (px)
Citation preview

Fig
hti
ng
Hu
ng
er W
orl
dw
ide
The Contribution of Food Assistance to Durable Solutions in Protracted Refugee Situations; its impact and role in Bangladesh: A Mixed Method Impact Evaluation
Vol.II – Statistical Annex December 2012 Commissioned by the
Office of Evaluation Measuring Results, Sharing Lessons
Prepared by :
Nicolai Steen Nielsen, Team Leader, Ferdous Jahan, Covadonga Canteli
With contributions from:
Kate Godden (nutrition), Gana Pati (field work), Md. Mamun-ur-Rashid (Development Research Initiative, Survey Team), Omar Faruque Siddiki (Development Research Initiative, Survey Team) OE/2012/013

Table of Contents Introduction ......................................................................................................................................... 1
Survey Sample, Weighting and Error Estimations .............................................................................. 2
Brief Exploratory Analysis ................................................................................................................... 6
Demographic Characteristics of Households by Population Type ................................................... 7
Economic Activities .......................................................................................................................... 11
Economic activities of individuals ............................................................................................... 11
Economic activities of households .............................................................................................. 19
Main Indicators Construction ............................................................................................................ 23
Food Consumption. Household Dietary Diversity Score ............................................................... 23
Food Security - Coping Strategies Index ........................................................................................ 28
The Mobility Indicator .................................................................................................................... 34
The Protection Indicator ................................................................................................................. 36
The Wealth Score ............................................................................................................................ 38
Statistical Method Applied Principal Components Analysis (PCA) .......................................... 38
Analysis of the wealth score ............................................................................................................ 44
Classification of Households According to their Economic Activities .............................................. 45
Household Characteristics by Group .............................................................................................. 47
Household Characteristics by Group and Registration Status ...................................................... 51
Regression Analyses of Household Indicators................................................................................... 62
Applied Methodology ...................................................................................................................... 64
Selected Models............................................................................................................................... 68
Verification of Hyphtheses ............................................................................................................. 83
Quantitative Approaches to the Estimation of Impact of Food Assistance ...................................... 96
Impact of Food Consumption ..................................................................................................... 97
Impact on Food Security ............................................................................................................. 98
Impact on Protection................................................................................................................. 100
Impact on Mobility ..................................................................................................................... 101

1
Introduction
The present annex contains all relevant information on the steps taken in the quantitative analysis of the
household survey conducted for the Mixed Methods Impact Evaluation of Food Assistance in the Protracted
Refugee Situation of the Rohingyas in Bangladesh.
In the first stage, a basic exploratory analysis on the demographic and socioeconomic characteristics of
Rohingya households in Bangladesh was undertaken. Tables of characteristics by type of household are
presented in chapter 3 of this document. The types of household are the following: Registered refugees in
Kutupalong, registered refugees in Nayapara, unregistered Rohingyas in Leda, unregistered Rohingyas in
Leda and unregistered Rohingyas in Nayapara. Results are also presented for the unregistered Rohingyas
living in local areas (Cox’s Bazar) and Bangladeshi poor households in villages near the refugee camps, but
the samples they are based on are not as representative (including 50 and 100 households respectively).
Then the construction of a set of indicators covering the following areas of interest in the evaluation was
presented. These are food consumption, food security, protection and mobility. One indicator is built for
each area. A fifth indicator, the Wealth Score, based on the assets owned by the household, was built to
measure capital held by households. The analysis of the indicators across the types of households presented
in the paragraph above concludes that significant differences between types exist for food consumption,
food security and mobility. Protection depends more on the geographical area.
Multidimensional statistical techniques have been applied in the construction of the Wealth Score (based
on a Principal Components Analysis), and also in the classification of households by the economic activities
they undertake (K-means cluster). The latter, leading to a four-group classification, is presented in chapter
5. The analysis of the indicators across the four groups and by registration status (section 5.2) leads to the
same conclusion as explained in the paragraph above: food consumption, food security and mobility depend
more on the registration status than on the economic activities of households. This is not true for
protection, as measured by the Protection Indicator.
Chapter 6 contains a set of regression models obtained for the four indicators covering the areas of interest
in the evaluation (as dependent variables). They have been thoroughly searched for, applying different
combinations of demographic and socioeconomic variables, and also of variables on registration status and
type of household (as explanatory variables). Combinations have been tested using the “stepwise” method
based on the AIC criteria. ANOVA tests and fitness indicators such as R² have also helped in the
determination of best fit models.
Regression models have served to explore the correlations existing among the different areas of interest and
the demographic and socioeconomic conditions of households, along with the type of household and its
registration status. Again, type of household and registration status appeared as relevant conditions for
food consumption, food security and mobility. But protection was more dependent on the geographical area
than on anything else.
2
Survey Sample, Weighting and Error Estimations
The present document contains most of the data analysis conducted on the survey data for the Impact
Evaluation of Food Assistance in Protracted Refugee Situation of Bangladesh. The quantitative survey was
conducted by Development Research Initiative during the months of May and June 2012. A total of 1069
households were surveyed. They can be divided into different types, on which data analysis will be based, as
showed in the below table
Table 1. Survey sample
Type of household (taking registration status into account)
Number of households
Number of individuals
Population size (real, in households)
Registered refugees
Kutupalong camp
174 973 1700
Nayapara camp 175 1058 2681
Unregistered Rohingyas
Leda site 262 1797 2048
Makeshift camp 150 795 150
Nayapara camp 132 777 371
Kutupalong camp
26* 135 209
Rohingyas living in local areas (Cox´s Bazar and Teknaf)
50 227 -
Host community in nearby villages - Most vulnerable
households 100 481 -
Total 1068 6243 -
*The sample for this group being too small, results for it, if ever presented, should be interpreted with
caution.
At the first design stage, the sample targeted 6 different population types (Leda Site refugees, registered
refugees in Nayapara camp, unregistered Rohingyas in the Nayapara camp, Rohingyas living in the
makeshift camp near Kutupalong, Rohingyas living in local areas (Cox’s Bazaar) and poorest households in
the host community villages nearby).
During the evaluation mission, the team decided to extend the sample to the Kutupalong refugee camp,
because due to the different location of camps (implying different work opportunities and prices),
significant differences in self-reliance strategies between Rohingyas from the different camps could be
expected. Due to the fact that the sample extension counted on 200 households only, and to the difficulties
faced by the enumerator team in Nayapara in finding the households of the unregistered that had been
selected separately (as a different stratum), households in Kutupalong were not sampled depending on their
registration status.
As a consequence, if we wanted to estimate indicators for Rohingyas living in the Nayapara Camp altogether
we would need to apply weights1 on the households; otherwise unregistered households would be
overrepresented (they would represent 43% of the Nayapara sample instead of 12%). However, if we wanted
to estimate indicators in Kutupalong, we wouldn’t need to apply any weighting, for due to random selection
of households the percentage of unregistered Rohingyas is already close to the real one.
1 Weights would be 1.56 for registered refugees in Nayapara and 0.26 for the non registered ones.

3
Throughout the analysis, significant differences between registered and unregistered households in
Nayapara have been detected, especially for variables other than demographic variables (i.e. on activities,
incomes, food consumption, etc). For this reason, we have confirmed the relevance of treating the
registered and unregistered households in Nayapara as different groups. And also in Kutupalong, registered
and unregistered households are treated as different groups, even though it is important to note that the
sample for unregistered households in Kutupalong is not big enough to be representative, thus when
comparing it to others we must be extremely careful.
Weighting
Through the various analyses presented on these pages, weighting is applied in order to assure that the
proportions of the different population types are close to those in reality.
Table 2. Sample weights for the estimation of indicators and percentages
TYPE
Total population - Number of households
Sample % in total pop
% in sample weight
Leda 2681 262 22.68% 29.34% 0.77
Nayapara registered refugees 2721 175 23.01% 19.60% 1.17
Nayapara unregistered Rohingyas
371 132 3.14% 14.78% 0.21
Makeshift camp 4350 150 36.79% 16.80% 2.19
Kutupalong registered refugees 1700 174 14.38% 19.48% 0.74
Weighting being uniform by type of household, it is not relevant when calculating estimators by household
type.
Sampling Error Estimations
TABLE 3 at the end of this subsection presents sampling error estimations by population group if results are given by household. For each population group, error calculations are based on the estimation of the variance of the dichotomous variables’ estimates from a single survey, i.e. the estimate of the proportion of the population that verifies a particular characteristic. The applied formula is the following:
√
Where,
e = sampling error
k = 1.96 = z-value for a confidence level of 95%
p = q= 0.5, which is most conservative value for the true proportion of the population that verifies a particular characteristic
N = population size
n = sample size
UNHCR provided the quantitative team with a full list of refugee households in both Nayapara and Kutupalong. Extracted from the ProGres database, it contained household member level information, such as registration status and occupation. This allowed the team to create a randomized selection algorithm, including two separate strata: Registered and unregistered households. The table in the following page presents sampling error calculation for both strata, based on the formula above.
4
Since it also included refugees’ occupation information, the ProGres database has also allowed for the calculation of the minimal size required for samples to be used for comparing means between different population groups/strata (registered and unregistered Rohingyas).
( √ √
)
Where,
, which means error is fixed to 5%
, for a statistical power of 80%
, where and are the proportion of male refugees (18 year olds and older) that have an
occupation, among registered and unregistered Rohingyas respectively. The percentage of occupied refugees can indicate refugees’ self reliance and therefore it is used in this estimation. It can indeed be expected that occupation is correlated with some of the variables that will be used as dependent variables in regression models, such as Household Dietary Diversity Score, Coping Strategies Index, Mobility Indicator and Protection Indicator. Females were excluded in this estimation because, for both strata, high percentages of them appear as occupied. However, the occupation of most of them is housewife, and that can’t be taken into account as a self-reliance measure, for it is not remunerated.
;
Therefore, n=114<125, which is sample size for unregistered refugees stratum. Thus, sizes are big enough for such a test for both strata.
TABLE 3: Sampling error estimations by population group
LOCATION TARGET
POPULATION POPULATION
SIZE
Population size
considered in sampling
SAMPLE SIZE
ERROR (+/-, %)
NAYAPARA REFUGEE CAMP
Registered refugees 2681 households 2681 175 7.19%
Unregistered Rohingyas
371 households 371 132 6.85%
TOTAL 3052 households 3052 307 5.26%
KUTUPALONG REFUGEE CAMP
Registered refugees 1700 households 1700 174 7.04%
Unregistered Rohingyas
209 households 209 26 18.0%
TOTAL 1909 households 1909 200 6.6%
MAKESHIFT CAMP
(KUTUPALONG)
Unregistered Rohingyas
4350 (estimate, assuming 6 members per household, as in Kutupalong refugee
camp)
4350 150 7.86%
LEDA CAMP Unregistered
Rohingyas
Aprox. 2300, assuming 6 members per household
2300 262 5.70%
COX’s BAZAR Unregistered
Rohingyas ?? 50
VILLAGES NEAR NAYAPARA
Locals living in poorest
households (identified through
PRA’s)
100
Total 1069

5
Aerial Sampling in Makeshit Camp near Kutapalong
Unlike in the case of the official camps, in which UNHCR ProGres refugee database was available for
sampling, or the case of the Leda site, in which houses were ordered in rows and systematic sampling could
be applied, sampling in the makeshift site near Kutupalong had to be done based on an aerial map.
The team based this exercise on an aerial map obtained from Google maps. Due to the difficulty of finding
the exact points drawn in the map in the makeshift camp (low definition of the images provided by google
maps), the team decided to not do a random selection of 25 coordinates within the camp, and survey 6
houses around each, but to manually divide the map of the camp into 4 parts (see red lines in FIGURE 1)
and proceed as described below.
FIGURE 1. Aerial sampling in makeshift site near Kutupalong
In each part, a “midpoint” was selected as follows:
Most northern corner is selected. A line is drawn to the opposite corner. Then a second line is
drawn, as perpendicular to the previous as possible, going from one corner of the part to the
opposite corner. The intersection between them is the midpoint. In case of part D of the map, since
it is almost a triangle, three lines are drawn from the three corners to the midpoint of the opposite
side of the triangle. A smaller triangle is therefore drawn in the middle of part D. The midpoint of it
is guessed in the camp.
The longest line drawn for each part in the previous step will be selected (in green in the map).
Households are selected from midpoint to the west, following that line.
One of every three households is selected. In case no more houses existed, then enumerators were to follow
the same line from the midpoint to the east. In case no more houses existed in that sense, enumerators were
to proceed equally with the other line in the part (the next longest line drawn in case of part D).

6
Part A seems to have more houses in it than the rest of parts. Therefore a total of 34
households will be surveyed in parts B, C and D, while 48 will be surveyed in part A.
FIGURE 2. Selected midpoints for areas A, B C and D
Brief Exploratory Analysis
Through these pages, the exploratory analysis is complemented with the results from the t-tests applied, to
determine the significant differences between those population groups for which sample is fairly
representative. These are Leda Site refugees, registered refugees in Nayapara camp. Unregistered
Rohingyas in the Nayapara camp, refugees living in the makeshift camp in Kutupalong and registered
refugees in the Kutupalong camp. Indeed, the analysis in the present document mainly consists
in the comparison of variables for the registered refugees in Nayapara to all the previously
mentioned population types.
It is very important to note that samples are not big enough as to conduct tests including the unregistered
Rohingyas in Kutupalong, the refugees living in the local areas or the host community. Moreover, all
indicators calculated for these populations must be interpreted with extreme caution.
The following subsections are included
- Demographic characteristics of households by population type
- Economic activities of individuals
- Economic activities of households
Data reliability
Data reliability has been assured by hiring very qualified staff (mainly BRAC University Master students on
social sciences), who went through an exhaustive enumerator training. Indeed, enumerators, many of them
having already participated in similar surveys, were trained during three days. Enumerators were carefully
7
explained the objectives of the survey and part of the training and the mock tests focused on the exhaustive
collection of all income sources of households.
Additionally, problems encountered during the data collection process were discussed on a daily basis with
the consultants from Development Research Initiative in charge of the survey and also with the consultant
from DARA, responsible of data analysis, and also present in the field during the survey period.
Subjectivity of data on incomes and expenditures has also been controlled:
- Data on incomes has been presented with caution, as it is the case in “Table 4. Incomes and working
hours. Variable distribution by type of household”, in which not just mean values but variable
distributions are presented (i.e. minimum, maximum, standard deviation statistics are included in
the table)
- During a field debriefing session enumerators reported that the data on household expenditures
they were collecting seemed reliable. They said that household expenditures are so scarce that
respondents’ answers were straight. Still, data on expenditures needs to be complemented with
qualitative research in order to undertake a relevant analysis.
- Wealth score (section 4.5) is based in the number of assets owned by the household instead of the
value of the assets
Demographic Characteristics of Households by Population Type
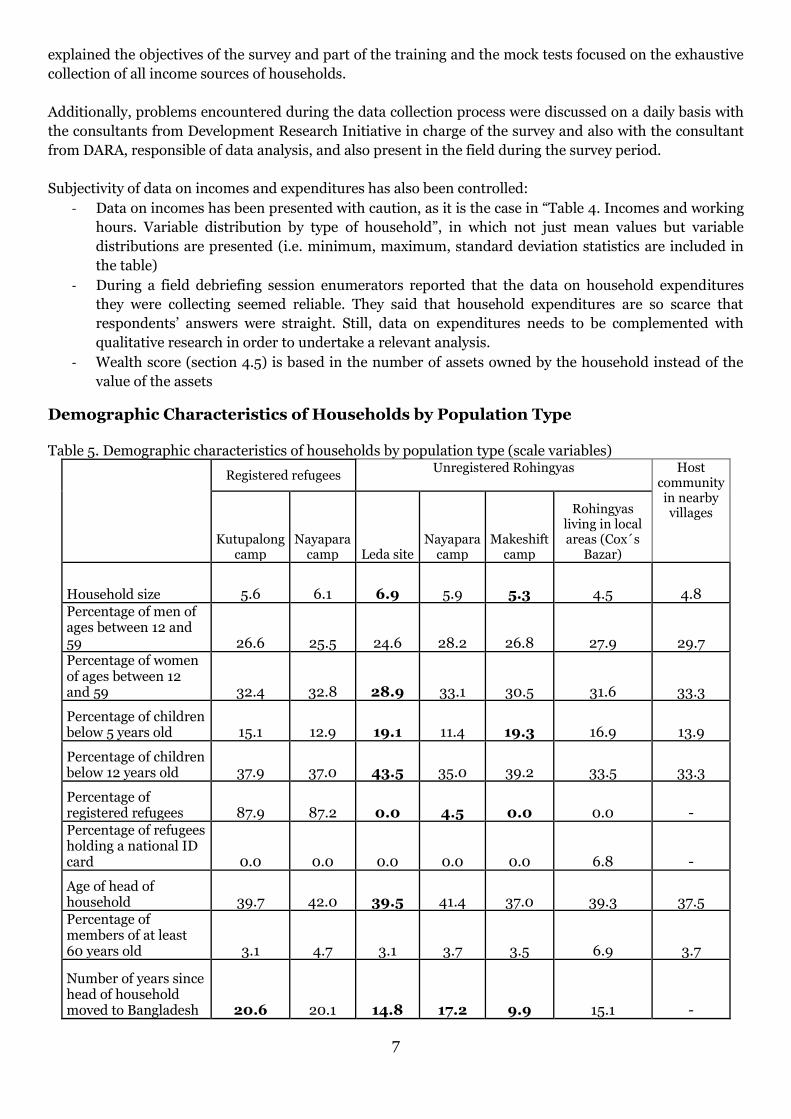
Table 5. Demographic characteristics of households by population type (scale variables)
Registered refugees Unregistered Rohingyas Host
community in nearby villages
Kutupalong camp
Nayapara camp Leda site
Nayapara camp
Makeshift camp
Rohingyas living in local areas (Cox´s
Bazar)
Household size 5.6 6.1 6.9 5.9 5.3 4.5 4.8 Percentage of men of ages between 12 and 59 26.6 25.5 24.6 28.2 26.8 27.9 29.7 Percentage of women of ages between 12 and 59 32.4 32.8 28.9 33.1 30.5 31.6 33.3
Percentage of children below 5 years old 15.1 12.9 19.1 11.4 19.3 16.9 13.9
Percentage of children below 12 years old 37.9 37.0 43.5 35.0 39.2 33.5 33.3
Percentage of registered refugees 87.9 87.2 0.0 4.5 0.0 0.0 - Percentage of refugees holding a national ID card 0.0 0.0 0.0 0.0 0.0 6.8 -
Age of head of household 39.7 42.0 39.5 41.4 37.0 39.3 37.5 Percentage of members of at least 60 years old 3.1 4.7 3.1 3.7 3.5 6.9 3.7
Number of years since head of household moved to Bangladesh 20.6 20.1 14.8 17.2 9.9 15.1 -

8
Households in Nayapara refugee camp, both registered and unregistered, and registered refugee
households in Kutupalong, are all very similar in terms of demographic characteristics. Indeed, the only
significant difference encountered between them is the number of years since the head of
household arrived to Bangladesh (unregistered Rohingyas arrived in Bangladesh three years
later than the others).
Nonetheless, households in Leda and the makeshift camp are quite different from them.
Households in Leda:
- have more members, closer to 7, instead of 6.
- present a lower percentage of women between the ages of 12 and 59 (some interviewed Rohingyas
in Nayapara claimed that if a family had several sons, when grown up they would leave the camp to find a
job outside, whereas several daughters could be in the same household and stay in the camp without feeling
that leaving is necessary).
- have a higher percentage of below 5 and below 12 year-olds among household members.
- household head is about two years younger, on average.
- household head arrived in Bangladesh later, about 5 years later, on average.
Households in the makeshift camp have a bigger size and a higher percentage of below 5 year-olds. Please
note that it could be due to the smaller size of the sample for the makeshift camp that not as many
characteristics appear as significantly different.
From observing the following tables2 it can be concluded that the Nayapara refugee camp3 (regardless of the
registration status) presents a higher percentage of female-headed households than Kutupalong and the
makeshift camp. This is in coherence with the higher percentage of separated and widow household heads
that can be found in Nayapara.
Therefore, a higher percentage of households are headed by women alone in the Nayapara camp, which
could mean a higher percentage of vulnerable households are found there.
Leda does present a percentage of female-headed households similar to that of Nayapara. However, the
percentage of separated and widows is lower.
Table 6. Percentage of female-headed households by type of household(%)
Percentage of female-headed households (%)
Leda site (unregistered Rohingyas) 31.7
Nayapara camp- Registered refugees 32.0
Nayapara camp- Unregistered Rohingyas 34.1
Makeshift camp (unregistered Rohingyas) 13.3
Kutupalong camp- Registered refugees 24.7
2 Significantly different figures are marked in red. For some of them there was not even a need to conduct a test of significance. 3 The Pearson chi-square tests undertaken show that there are no significant differences for marital status
of household head among registered and unregistered Rohingyas in Nayapara, but there is a significantly
higher percentage of married heads in Leda (around 80% against 70%). Divorced and separated heads of
households seem to be three times more frequent among Nayapara Rohingyas.

9
Rohingyas living in local areas (Cox´s Bazar) 10.0
Host community in nearby villages 11.0
Table 7. Marital status of head of household. Percentages by type of household (%)
Marital status of head of household (%)
Population type
Never married/unmarried
Married (living with spouse)
Divorced Widow/widower Separated
Leda site (unregistered Rohingyas) 0.8 80.9 0.4 14.5 3.4
Nayapara camp- Registered refugees 1.1 70.9 1.7 17.1 9.1
Nayapara camp- Unregistered Rohingyas
1.5 72.0 1.5 16.7 8.3
Makeshift camp (unregistered Rohingyas)
1.3 86.7 1.3 9.3 1.3
Kutupalong camp- Registered refugees
1.1 78.2 1.7 10.9 8.0
Rohingyas living in local areas (Cox´s Bazar)
2.0 88.0 8.0 2.0
Host community in nearby villages 4.0 88.0 8.0 Table 8. Level of education of head of household. Percentages by type of household (%)
Level of education of head of household (%)
Population type
Never enrolled/didn´t pass any class
Primary education
Secondary education4
Religious education
Don´t know
Leda site (unregistered Rohingyas) 66.8 9.2 4.2 19.8 0
Nayapara camp- Registered refugees 51.4 14.3 8.6 25.7 0
Nayapara camp- Unregistered Rohingyas 63.6 14.4 4.5 16.7 0.8
Makeshift camp (unregistered Rohingyas) 75.3 10.7 5.3 8.7 0
Kutupalong camp- Registered refugees 53.4 20.1 9.2 16.7 0.6
Rohingyas living in local areas (Cox´s Bazar)
56.0 20.0 4.0 20.0 0
Host community in nearby villages 65.0 21.0 4.0 10.0 0
The variable education level of household heads has also shown significant differences when comparing
different types of Rohingya population. However, in the case of unregistered Rohingyas in Nayapara, the
level of education is similar to that of Leda. Indeed similar percentages of the following categories are found
in Leda and unregistered household heads of Nayapara:
- never enrolled
- Junior/Secondary/Higher secondary education
- Religious education
In the meanwhile, the percentage of unregistered household heads in Nayapara that have a primary
education level is more similar to that of the registered refugees in the same camp (around 14% for both).
4 Junior/Secondary/Higher secondary education

10
It could therefore be concluded that unregistered Rohingyas in Nayapara profit from school
services in the camp just like registered refugees at the primary education level. But for
secondary school, food assistance allows some registered refugees to afford secondary
school, while it is harder for unregistered Rohingyas to afford.
In any case, the percentage of Rohingyas having access to secondary school is dramatically
low.
Note the high percentage of household heads having had a religious education among the Nayapara
registered refugees.
11
Economic Activities
Economic activities of individuals
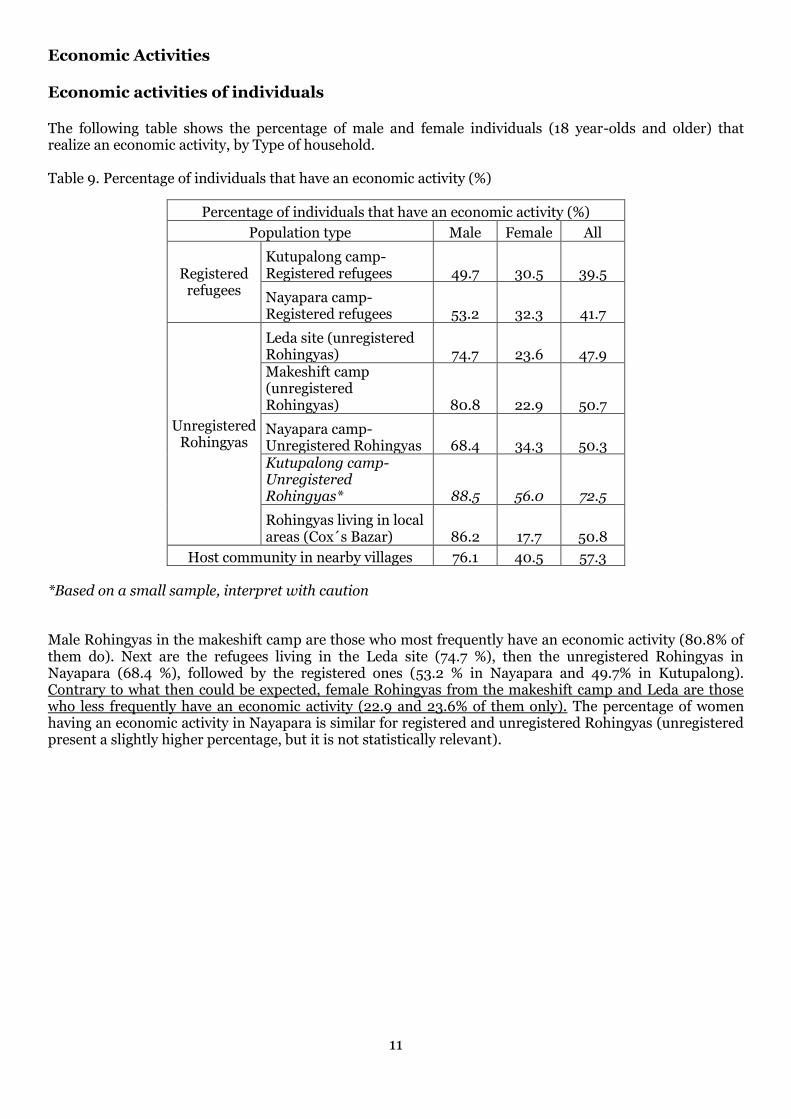
The following table shows the percentage of male and female individuals (18 year-olds and older) that realize an economic activity, by Type of household. Table 9. Percentage of individuals that have an economic activity (%)
Percentage of individuals that have an economic activity (%)
Population type Male Female All
Registered refugees
Kutupalong camp- Registered refugees 49.7 30.5 39.5
Nayapara camp- Registered refugees 53.2 32.3 41.7
Unregistered Rohingyas
Leda site (unregistered Rohingyas) 74.7 23.6 47.9 Makeshift camp (unregistered Rohingyas) 80.8 22.9 50.7
Nayapara camp- Unregistered Rohingyas 68.4 34.3 50.3 Kutupalong camp- Unregistered Rohingyas* 88.5 56.0 72.5
Rohingyas living in local areas (Cox´s Bazar) 86.2 17.7 50.8
Host community in nearby villages 76.1 40.5 57.3
*Based on a small sample, interpret with caution
Male Rohingyas in the makeshift camp are those who most frequently have an economic activity (80.8% of them do). Next are the refugees living in the Leda site (74.7 %), then the unregistered Rohingyas in Nayapara (68.4 %), followed by the registered ones (53.2 % in Nayapara and 49.7% in Kutupalong). Contrary to what then could be expected, female Rohingyas from the makeshift camp and Leda are those who less frequently have an economic activity (22.9 and 23.6% of them only). The percentage of women having an economic activity in Nayapara is similar for registered and unregistered Rohingyas (unregistered present a slightly higher percentage, but it is not statistically relevant).

12
Table 10. Economic activities for males (18 and older) by population type (%)
Economic activity (%)
Registered refugees Unregistered Rohingyas
Host community in nearby villages
Kutupalong camp
Nayapara camp
Leda site Makeshift
camp Nayapara
camp Kutupalong
camp
Rohingyas living in
local areas (Cox´s Bazar)
Sample size 195 203 368 177 155 26 58 113
No economic activity 50.3 46.8 25.3 19.2 31.6 11.5 13.8 23.9
Non Agro based day labour
11.3 16.7 33.2 26.0 22.6 15.4 29.3 32.7
Micro enterprise outside house
2.1 7.9 10.9 10.7 7.7 3.8 3.4 8.0
Agro based day labour (to other’s land)
6.7 3.9 6.0 16.4 6.5 19.2 0.0 8.8
Fisher /Fishery 2.6 3.9 3.5 2.8 3.9 11.5 19.0 9.7
NGO worker 9.7 3.9 0.5 1.1 1.3 3.8 5.2 0.0
Restaurant/Shop worker 2.1 3.0 2.4 5.1 7.7 0.0 1.7 0.0
Imam/religious person 2.6 3.0 0.5 1.1 1.3 0.0 0.0 0.9
Farming 0.5 2.5 0.3 2.8 0.6 3.8 0.0 1.8
Teacher 2.1 2.5 0.3 0.6 0.0 3.8 0.0 0.0
Various micro enterprise in own house
4.6 2.0 1.9 2.8 1.3 7.7 1.7 0.0
Sewing/ Handy craft/ cottage industry
0.5 1.5 0.3 0.0 0.0 0.0 0.0 0.9
Maid/Servant/work in other people’s house
0.0 0.5 0.3 1.7 0.6 0.0 0.0 0.0
Rickshaw/Van/Truck/Bus driver
2.6 0.5 9.2 6.2 9.7 11.5 24.1 8.0
Hawker/Mobile hawker 0.0 0.5 1.6 1.1 1.3 3.8 0.0 0.0
Skilled labour (Carpenter, Potter, Black smith…)
2.1 0.5 2.7 1.7 1.3 3.8 1.7 2.7
Beggar 0.0 0.5 0.8 0.6 2.6 0.0 0.0 0.9
Industrial labour 0.5 0.0 0.3 0.0 0.0 0.0 0.0 0.0
Livestock 0.0 0.0 0.0 0.0 0.0 0.0 0.0 1.8
TOTAL 100.0 100.0 100.0 100.0 100.0 100.0 100.0 100.0

13
Table 11. Economic activities for females (18 and older) by population type (%)
Economic activity (%)
Registered refugees Unregistered Rohingyas Host community
in nearby village
s
Kutupalong cam
Nayapara camp
Leda site Makeshif
t cam Nayapara camp
Kutupalong camp
Rohingyas living in local areas
(Cox´s Bazar)
Sample size 223 248 407 192 175 25 62 126
No economic activity 69.5 67.7 76.4 77.1 65.7 44.0 82.3 59.5
Poultry 11.7 13.3 4.7 4.2 4.6 12.0 1.6 23.0
Sewing/ Handy craft/ cottage industry (With payment)
13.0 8.5 2.0 2.1 6.9 16.0 6.5 4.0
NGO worker 2.2 2.8 0.7 0.0 2.9 0.0 0.0 1.6
Various micro enterprise in own house
0.9 1.6 1.0 3.1 0.6 16.0 1.6 0.8
Micro enterprise outside house
0.4 1.2 4.4 1.6 2.9 8.0 1.6 2.4
Livestock 0.0 1.2 0.0 0.0 0.6 0.0 0.0 0.8
Farming 0.9 0.8 0.2 0.0 0.6 0.0 0.0 0.0
Non Agro based day labour 0.0 0.8 0.5 0.0 1.1 0.0 4.8 1.6
Maid/Servant/work in other people’s house
1.3 0.8 3.2 5.7 7.4 4.0 1.6 4.0
Industrial labour 0.0 0.4 0.0 0.0 1.7 0.0 0.0 0.0
Hawker/Mobile hawker 0.0 0.4 0.5 0.0 1.1 0.0 0.0 0.0
Beggar 0.0 0.4 5.9 5.2 1.1 0.0 0.0 0.0
Agro based day labour (to other’s land)
0.0 0.0 0.0 0.0 1.7 0.0 0.0 1.6
Restaurant/Shop worker 0.0 0.0 0.5 0.0 1.1 0.0 0.0 0.0
Skilled labour (Carpenter, Potter, Black smith…)
0.0 0.0 0.0 0.5 0.0 0.0 0.0 0.8
Teacher 0.0 0.0 0.0 0.5 0.0 0.0 0.0 0.0
TOTAL 100.0 100.0 100.0 100.0 100.0 100.0 100.0 100.0

14
Table 12. Percentage of refugees having an economic activity by type and age group
Type of respondent (taking registration status into account)
Age group
Below 11 12 to 17 18 to 44 45 to 59 60 and older
Total
Leda site (unregistered Rohingyas)
Total Sample size 780 242 619 113 43 1797
% of respondents having an
economic activity 2.8% 26.4% 45.7% 61.9% 41.9% 25.4%
Nayapara camp- Registered
refugees
Total Sample size 406 201 355 60 36 1058
% of respondents having an
economic activity 0.7% 12.4% 43.1% 48.3% 16.7% 20.4%
Nayapara camp- Unregistered
Rohingyas
Total Sample size 287 160 259 50 21 777
% of respondents having an
economic activity 1.0% 21.3% 51.4% 50.0% 38.1% 26.1%
Makeshift camp (unregistered Rohingyas)
Total Sample size 325 101 294 52 23 795
% of respondents having an
economic activity 2.8% 23.8% 52.0% 46.2% 43.5% 27.7%
Kutupalong camp- Registered
refugees
Total Sample size 390 165 339 59 20 973
% of respondents having an
economic activity 0.0% 8.5% 42.5% 32.2% 10.0% 18.4%
Kutupalong camp-
Unregistered Rohingyas
Total Sample size 63 21 45 3 3 135
% of respondents having an
economic activity 0.0% 9.5% 73.3% 66.7% 66.7% 28.9%
Rohingyas living in local areas
(Cox´s Bazar and Teknaf)
Total Sample size 81 26 92 15 13 227
% of respondents having an
economic activity 2.5% 23.1% 52.2% 53.3% 38.5% 30.4%
Host community in nearby villages
Total Sample size 177 65 193 29 17 481
% of respondents having an
economic activity 1.1% 16.9% 58.0% 65.5% 35.3% 31.2%

15
GRAPH 1. Percentage of respondents having an economic activity by age group
Child labour is more frequent in Leda and the makeshift camp than in the rest of the locations. Adolescents
of ages 12 to 17 tend to work more if from Leda and also if they are unregistered. According to the survey
data, child labour is more frequent among boys than among girls (this is true for adolescents also).
0%
10%
20%
30%
40%
50%
60%
70%
Below 11 12 to 17 18 to 44 45 to 59 60 and older
Pe
rce
nta
ge
of
ind
ivid
ua
ls
Leda site (unregistered Rohingyas) Nayapara camp- Registered refugeesNayapara camp- unregistered Rohingyas Makeshift camp (unregistered Rohingyas)Kutupalong camp- Registered refugees Host community in nearby villages

16
The following table contains variables on time of work and earnings. Respondents below the age of 18 were
excluded from the calculations. No t-tests have been conducted at this point, for sampled individuals are
not randomly selected (selection is random at the household level). Tests will be conducted in the next
section.
Table 13. Incomes and working hours. Variable distribution by type of respondent
Type of respondent
Variables N Minimum Maximum Mean
Std. Deviation
Leda site (unregistered Rohingyas)
Total money earned in the last two weeks (Tk)
371 0.00 10500.00 1406.85 1193.78
Daily income (Tk) 371 0.00 750.00 171.31 97.42
Number of working days in the last two weeks
371 0.00 14.00 8.65 3.90
Hours of work per day 371 0.00 16.00 8.14 2.47
Number of hours of work in the last 2 weeks
371 0.00 224.00 69.07 39.51
Nayapara camp-
Registered refugees
Total money earned in the last two weeks (Tk)
188 0.00 7000.00 727.79 1039.14
Daily income (Tk) 188 0.00 1000.00 99.66 125.24
Number of working days in the last two weeks
188 1.00 14.00 9.62 4.79
Hours of work per day 188 0.00 16.00 5.88 3.66
Number of hours of work in the last 2 weeks
188 0.00 224.00 52.58 45.51
Nayapara camp-
Unregistered Rohingyas
Total money earned in the last two weeks (Tk)
166 0.00 10000.00 1250.97 1221.48
Daily income (Tk) 166 0.00 2000.00 141.68 174.33
Number of working days in the last two weeks
166 1.00 14.00 9.87 4.02
Hours of work per day 166 0.00 14.00 7.94 3.02
Number of hours of work in the last 2 weeks
166 0.00 182.00 77.73 45.21
Makeshift camp
(unregistered Rohingyas)
Total money earned in the last two weeks (Tk)
187 0.00 10640.00 1674.03 1328.07
Daily income (Tk) 187 0.00 900.00 199.50 143.92
Number of working days in the last two weeks
187 1.00 14.00 9.06 3.66
Hours of work per day 187 1.00 12.00 8.24 2.51
Number of hours of work in the last 2 weeks
187 7.00 168.00 73.70 38.61
Kutupalong camp-
Registered refugees
Total money earned in the last two weeks (Tk)
165 0.00 5600.00 755.58 905.11
Daily income (Tk) 164 0.00 800.00 102.07 120.11
Number of working days in the last two weeks
165 0.00 14.00 9.93 4.24
Hours of work per day 165 0.00 15.00 5.98 3.40
Number of hours of work in the last 2 weeks
165 0.00 210.00 55.79 40.04
Kutupalong camp-
Unregistered Rohingyas
Total money earned in the last two weeks (Tk)
37 0.00 2500.00 1015.68 769.62
Daily income (Tk) 37 0.00 300.00 131.12 99.46
Number of working days in the last two weeks
37 2.00 14.00 8.95 3.90
Hours of work per day 37 1.00 16.00 7.54 3.77
Number of hours of work in the last 2 37 5.00 168.00 63.59 39.35

17
weeks
Rohingyas living in local areas (Cox´s
Bazar and Teknaf)
Total money earned in the last two weeks (Tk)
61 0.00 28000.00 2120.74 3884.48
Daily income (Tk) 61 0.00 2000.00 222.46 269.04
Number of working days in the last two weeks
61 2.00 14.00 8.38 3.97
Hours of work per day 61 1.00 16.00 8.34 2.51
Number of hours of work in the last 2 weeks
61 12.00 168.00 69.48 41.20
Host community in nearby villages
Total money earned in the last two weeks (Tk)
137 0.00 5200.00 1042.81 1082.73
Daily income (Tk) 137 0.00 700.00 140.85 132.59
Number of working days in the last two weeks
137 2.00 14.00 9.08 4.08
Hours of work per day 137 1.00 12.00 6.41 3.19
Number of hours of work in the last 2 weeks
137 2.00 168.00 52.17 32.87
The table below on working places of refugees by population type includes above 18 year-old working
respondents only. It shows important differences in terms of working place of Rohingyas depending on
their site and registration status. Rohingyas living in Leda are those who most often work in the
villages near the camp (69% of working refugees), then unregistered Rohingyas in Nayapara
(54.2%).
Refugees from the makeshift camp are those who go to Cox’s Bazar or other parts of
Bangladesh the most (13.4% of those who have an economic activity).
Table 14. Distribution of working places by population type
Work Place (%)
Population type
Total of respondents having an economic activity
(sample size)
Inside the camp/own community
Nearby village/town
Cox´s Bazar
Other parts of Bangladesh
Leda site (unregistered Rohingyas) 371 19.9 69.0 6.7 4.3
Nayapara camp- Registered refugees 188 60.1 30.3 4.3 5.3
Nayapara camp- Unregistered Rohingyas 166 31.3 54.2 7.2 7.2
Makeshift camp (unregistered Rohingyas) 187 19.8 49.7 17.1 13.4
Kutupalong camp- Registered refugees 165 65.5 23.0 8.5 3.0
Kutupalong camp- Unregistered Rohingyas 37
48.6 35.1 13.5 2.7
Rohingyas living in local areas (Cox´s Bazar) 61
23.0 21.3 55.7 0
Host community in nearby villages 137 48.2 48.2 0.7 2.9
18
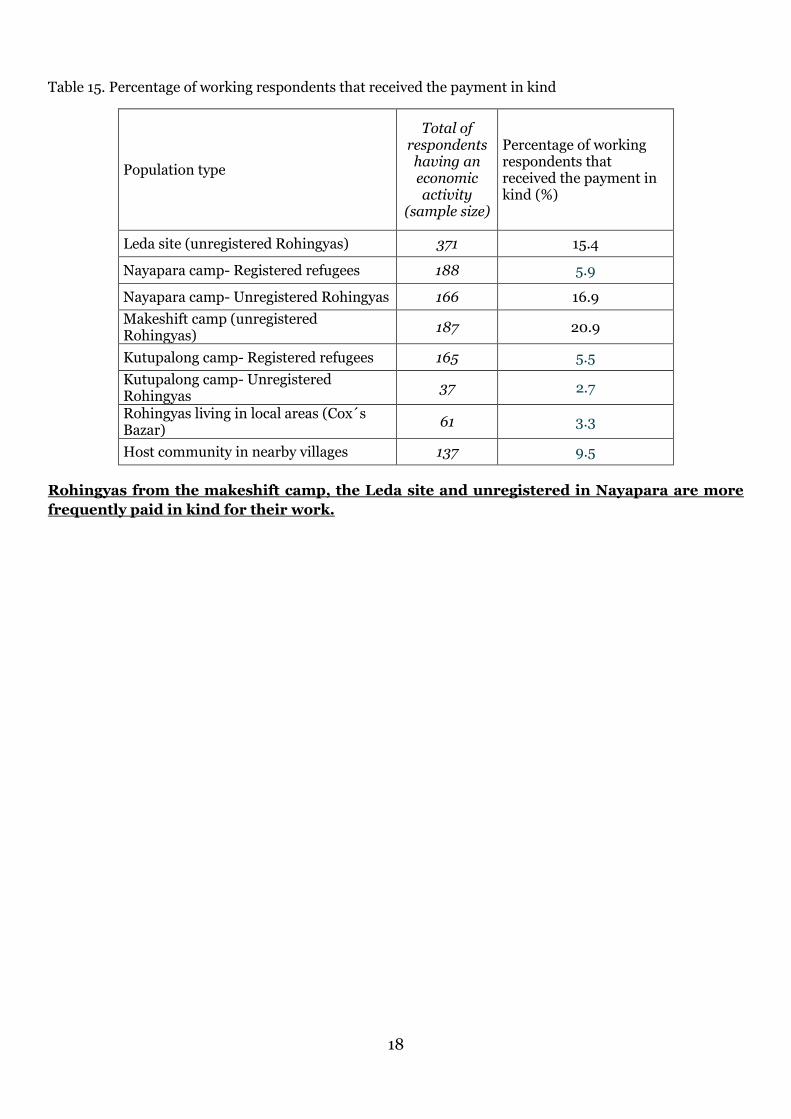
Table 15. Percentage of working respondents that received the payment in kind
Population type
Total of respondents having an economic activity
(sample size)
Percentage of working respondents that received the payment in kind (%)
Leda site (unregistered Rohingyas) 371 15.4
Nayapara camp- Registered refugees 188 5.9
Nayapara camp- Unregistered Rohingyas 166 16.9
Makeshift camp (unregistered Rohingyas)
187 20.9
Kutupalong camp- Registered refugees 165 5.5
Kutupalong camp- Unregistered Rohingyas
37 2.7
Rohingyas living in local areas (Cox´s Bazar)
61 3.3
Host community in nearby villages 137 9.5
Rohingyas from the makeshift camp, the Leda site and unregistered in Nayapara are more
frequently paid in kind for their work.

19
Economic activities of households
The table below shows that Leda households and Nayapara unregistered households are very similar in
terms of percentage of active members (about 27%) and earnings per member in the last two weeks (around
350 BTK). Nayapara registered refugee households present lower figures for both variables, and figures for
Kutupalong registered refugees are even lower.
The variable Last two weeks earnings per household member is calculated in two different manners:
1. Giving all those households in which no members have an activity a missing value, so we can explore
how much a household can aspire to as an income, and see if aspirations are different per site.
2. Giving all those households in which no members have an activity the value zero. So we can explore
how much is actually earned (which can serve as an estimation of what is needed) by households
from different sites.
The t-test on the variables in the table below have been applied to compare the Nayapara registered
refugees to the Rohingyas living in Leda, the unregistered in Nayapara, those in the makeshift camp and the
registered refugees in Kutupalong. The tests conclude significant differences in all sites compared
to the Nayapara registered refugees, except for the Kutupalong registered refugees.

20
Table 16. Earnings and working members. Variable distribution by type of household
Type of household
Variables N Min. Max. Mean Std.
Deviation
Leda site (unregistered Rohingyas)
Percentage of active members in the household 262 0.00 100.00 27.11 16.65
Two weeks earnings per household member (computed for households having an income only)
244 0.00 1468.75 349.75 217.19
Last two week earnings per household member (calculated for households without an activity also)
262 0.00 1468.75 325.73 227.54
Nayapara camp-
Registered refugees
Percentage of active members in the household 175 0.00 100.00 22.17 20.71
Last two week earnings per household member (computed for households having an income only)
124 0.00 1166.67 201.48 231.84
Last two week earnings per household member (calculated for households without an activity also)
175 0.00 1166.67 142.76 215.47
Nayapara camp-
Unregistered Rohingyas
Percentage of active members in the household 132 0.00 100.00 27.65 18.95
Last two week earnings per household member (computed for households having an income only)
118 0.00 1827.50 340.48 272.61
Last two week earnings per household member (calculated for households without an activity also)
132 0.00 1827.50 304.37 278.30
Makeshift camp
(unregistered Rohingyas)
Percentage of active members in the household 150 0.00 100.00 30.78 17.90
Last two week earnings per household member (computed for households having an income only)
142 0.00 1748.57 481.95 333.13
Last two week earnings per household member (calculated for households without an activity also)
150 0.00 1748.57 456.25 341.80
Kutupalong camp-
Registered refugees
Percentage of active members in the household 174 0.00 100.00 19.11 18.22
Last two week earnings per household member (computed for households having an income only)
120 0.00 762.50 189.89 187.62
Last two week earnings per household member (calculated for households without an activity also)
174 0.00 762.50 130.96 178.82
Rohingyas living in local areas (Cox´s
Bazar and Teknaf)
Percentage of active members in the household 50 0.00 100.00 34.18 20.07
Last two week earnings per household member (computed for households having an income only)
48 48.00 4666.67 580.91 711.71
Last two week earnings per household member (calculated for households without an activity also)
50 0.00 4666.67 557.68 706.46
Host community in nearby villages
Percentage of active members in the household 100 0.00 100.00 34.45 20.74
Last two week earnings per household member (computed for households having an income only)
94 0.00 1500.00 369.02 290.89
Last two week earnings per household member (calculated for households without an activity also)
100 0.00 1500.00 346.88 295.37

21
Table 17. Percentage of members who have an economic activity in the household
Type of household
Percentage of members who have an economic activity in the household (%)
No household members have an
economic activity
25% or less of
household members have an
economic activity
25 to 50% of
household members have an
economic activity
50 to 75% of
household members have an
economic activity
More than 75% of
household members have an
economic activity
Registered refugees
Kutupalong camp 31.0 42.5 21.8 4.0 0.6
Nayapara camp 29.1 37.7 26.9 5.1 1.1
Unregistered Rohingyas
Leda site 6.9 50.0 38.2 3.4 1.5
Makeshift camp 5.3 46.0 40.7 6.7 1.3
Nayapara camp 10.6 47.7 33.3 6.8 1.5
Kutupalong camp 3.8 38.5 42.3 11.5 3.8
Rohingyas living in local areas (Cox´s Bazar)
4.0 44.0 42.0 6.0 4.0
Host community in nearby villages 6.0 31.0 52.0 7.0 4.0
The chi-square tests applied (selecting only those types of households for which sample is big enough),
concluded that correlation exists between the percentages of members who have an economic activity and
the population type. The variable sex of head of household appears as correlated as well (see table below).

22
Table 18. Percentage of members who have an economic activity in the household (2) (%)
Percentage of members who have an economic activity in the household (%) (2)
Sex of household head
Type of household No household
members have an
economic activity
25% or less of household members have an
economic activity
25 to 50% of household members have an
economic activity
More than 50% of
household members have an
economic activity
Male Leda site (unregistered Rohingyas) 6.7 57.5 31.8 3.9
Nayapara camp- Registered refugees 26.1 43.7 27.7 2.5
Nayapara camp- Unregistered Rohingyas 11.5 57.5 26.4 4.6
Makeshift camp (unregistered Rohingyas) 5.4 48.5 40.0 6.2
Kutupalong camp- Registered refugees 29.8 44.3 23.7 2.3
Rohingyas living in local areas (Cox´s Bazar)
46.7 44.4 8.9
Host community in nearby villages 6.7 32.6 53.9 6.7
Female Leda site (unregistered Rohingyas) 7.2 33.7 51.8 7.2
Nayapara camp- Registered refugees 35.7 25.0 25.0 14.3
Nayapara camp- Unregistered Rohingyas 8.9 28.9 46.7 15.6
Makeshift camp (unregistered Rohingyas) 5.0 30.0 45.0 20.0
Kutupalong camp- Registered refugees 34.9 37.2 16.3 11.6
Rohingyas living in local areas (Cox´s Bazar)
40.0 20.0 20.0 20.0
Host community in nearby villages 18.2 36.4 45.5

23
Main Indicators Construction
This chapter presents the set of household indicators constructed based on survey data and how they are distributed by type of population. This will allow
comparing the levels of food consumption, food security, mobility, protection and wealth among the Rohingya population living in Bangladesh. Regression
models presented in the last chapter of this document will serve to explore the interrelations existing between these indicators.
Food Consumption. Household Dietary Diversity Score
Table 19. Percentage of households in which the following food groups were consumed the day before the survey, by type of household (%)
Cereals White roots and tubers
Vegetables Fruits Meat, poultry, offal
Eggs
Fish and seafood
Legumes, nuts and seeds
Milk and dairy products
Oils and fats
Sugar and honey
Misc.
Registered refugees
Kutupalong camp 100.0 21.3 82.8 14.4 0.6 1.7 37.4 42.5 1.1 70.7 29.9 98.3
Nayapara camp 100.0 26.3 81.7 10.3 1.1 2.9 39.4 32.6 0.6 76.0 36.6 84.0
Unregistered Rohingyas
Leda site 100.0 35.9 82.4 12.2 1.1 1.1 45.8 18.7 0.4 43.5 9.2 93.5
Makeshift camp 99.3 22.0 72.0 6.0 0.7 1.3 41.3 14.0 0.7 33.3 4.7 94.7
Nayapara camp 100.0 30.3 76.5 7.6 1.5 3.0 43.2 14.4 0.0 34.1 6.1 84.8
Rohingyas living in local areas
100.0 36.0 84.0 24.0 10.0 10.0 56.0 34.0 2.0 80.0 22.0 100.
0
Host community in nearby villages 100.0 32.0 80.0 28.0 6.0 4.0 72.0 8.0 3.0 81.0 12.0 98.0

24
The Pearson test of chi-square concluded that the following food groups are consumed in a
significantly different manner by the different types of Rohingyas:
- Fruits
- Meat, poultry, offal (in fact it is consumed significantly more often by unregistered
Rohingyas living in local areas and host communities)
- Fish and sea food
- Legumes, nuts and seeds
- Oils and fats
- Sugar and honey
- Miscellaneous
For the rest, consumption is not significantly different from one type of Rohingya household to the other.
Household Dietary Diversity Score
The Household Dietary Diversity Score (HDDS) was calculated as usual, grouping the different types of
food into 12 groups and counting the number of different food groups that had been consumed by the
household the day before. Thus, HDDS ranges from 0 to 12. However in this case, surveyed households had
consumed a maximum of 9 different types of food (see histogram below).
GRAPH 2. Histogram: HDDS

25
Table 20. HDDS distribution (5 main population groups)
Statistics
Sample size 893
Mean 4.42
Std Dev. 1.46
Median 4.0
Percentiles 33.3 4.0
66.7 5.0
Table 21. Categorisaton of variable HDDS
Categories HDDS values % of refugee population
Low diversity 1, 2, 3 29.7 % of population
Mid-range diversity 4, 5 48.5 % of population
High diversity 6, 7, 8, 9 21.8 % of population
Categorisation of HDDS variable (see above) is based on HDDS distribution on the main five population
groups, taking their relative weight into account.
Table 22. Distribution of HDDS (categorical variable)
HDDS - 3 categories
Total 1- Low
diversity 2- Mid
diversity 3- High diversity
Registered refugees
Kutupalong camp 8.6 59.4 32.0 100.0
Nayapara camp 20.0 46.3 33.7 100.0
Unregistered Rohingyas
Leda site 32.5 44.3 23.2 100.0
Makeshift camp 41.9 48.0 10.0 100.0
Nayapara camp- Unregistered Rohingyas 34.5 51.7 13.8 100.0
Rohingyas living in local areas 4.0 46.0 50.0 100.0
Host community in nearby villages 7.0 56.0 37.0 100.0
Table 23. Percentage of households having consumed 4 or more food groups the day before the survey
Percentage of households having consumed 4 or more food groups the day
before the survey(%)
Registered refugees Kutupalong camp 91.4
Nayapara camp 80.0
Unregistered Rohingyas
Leda site 67.5
Makeshift camp 58.1
Nayapara camp 65.5 Rohingyas living in local areas 96.0
Host community in nearby villages 93.0

26
*The % of households having consumed 4 or more food groups is equal to the sum of HDDS categories 2 and 3. Table 24. HDDS level distribution, by distance (%)
HDDS - 3 categories Total
1- Low diversity
2- Mid diversity
3- High diversity
DISTANCE
0 15.6 51.2 33.2 100.0
1 34.5 51.7 13.8 100.0
2 41.9 48.0 10.0 100.0
3 32.5 44.3 23.2 100.0
Total 29.7 48.5 21.8 100.0 Table above includes refugees from five main groups and cases are weighted as explained earlier. Variable on distance from food aid distribution points was constructed as follows:
0- Registered refugees from Nayapara and Kutupalong 1- Unregistered Rohingyas from Nayapara 2- Unregistered Rohingyas from makeshift camp near Kutupalong 3- Unregistered Rohingyas from Leda
For distances up to 2, the larger the distance, the lower the HDDS score. But the HDDS in Leda
(distance=3) is better than that of unregistered Rohingyas living in the official camp.
The table below shows descriptive statistics by type of population for scale variables: Household Dietary
Diversity Score; Weekly household expenditure on food; Weekly household expenditure on food per
member. The t-test of difference of means shows that differences are relevant for the three
variables when comparing the registered refugees in Nayapara to the unregisterd Rohingyas
in Nayapara, and also to the unregistered in Leda and the makeshift camp (in all cases
HDDS is higher in Nayapara refugee households, while food expenditure is lower).

27
When comparing registered refugees in Nayapara to those of Kutupalong, no relevant differences emerge for the HDDS, but food
expenditure, particularly when computed per household member is relevantly different from one camp to the other (expenditure is
higher in Kutupalong).
When comparing registered refugees in Nayapara to host communities nearby HDDS is relevantly higher in the host community
(although confidence level is not 95% but around 92%). Food expenditure is relevantly different, being much lower (less than a half) in
Nayapara.
Table 25. HDDS and expenditures. Variable distribution by type of household
Type of household (taking registration status into account) N Minimum
value Maximum
value Average Std dev.
Registered refugees
Kutupalong camp
Household Dietary Diversity Score 174 2.0 9.0 5.0 1.3
Weekly household expenditure on food 174 0.0 1900.0 588.4 346.6
Weekly household expenditure on food per member
174 0.0 350.0 114.1 68.8
Nayapara camp
Household Dietary Diversity Score 175 2.0 8.0 4.9 1.6
Weekly household expenditure on food 175 20.0 2000.0 512.0 354.8
Weekly household expenditure on food per member
175 5.0 500.0 92.9 69.9
Unregistered Rohingyas
Leda site
Household Dietary Diversity Score 262 1.0 8.0 4.4 1.5
Weekly household expenditure on food 262 0.0 3500.0 1245.6 566.0
Weekly household expenditure on food per member
262 0.0 525.0 196.3 94.2
Makeshift camp
Household Dietary Diversity Score 150 0.0 7.0 3.9 1.2
Weekly household expenditure on food 150 0.0 2500.0 930.4 426.2
Weekly household expenditure on food per member
150 0.0 433.0 188.8 75.6
Nayapara camp
Household Dietary Diversity Score 132 2.0 9.0 4.0 1.3
Weekly household expenditure on food 132 50.0 2500.0 796.8 459.4
Weekly household expenditure on food per member
132 4.2 400.0 142.9 80.1
Rohingyas living in local areas (Cox´s
Household Dietary Diversity Score 50 3.0 9.0 5.6 1.3
Weekly household expenditure on food 50 300.0 2500.0 1213.4 446.1
28
Bazar and Teknaf) Weekly household expenditure on food per member
50 150.0 1000.0 296.0 147.8
Host community in nearby villages
Household Dietary Diversity Score 100 2.0 9.0 5.2 1.3
Weekly household expenditure on food 100 30.0 2800.0 1138.6 497.7
Weekly household expenditure on food per member
100 6.0 700.0 260.0 117.4
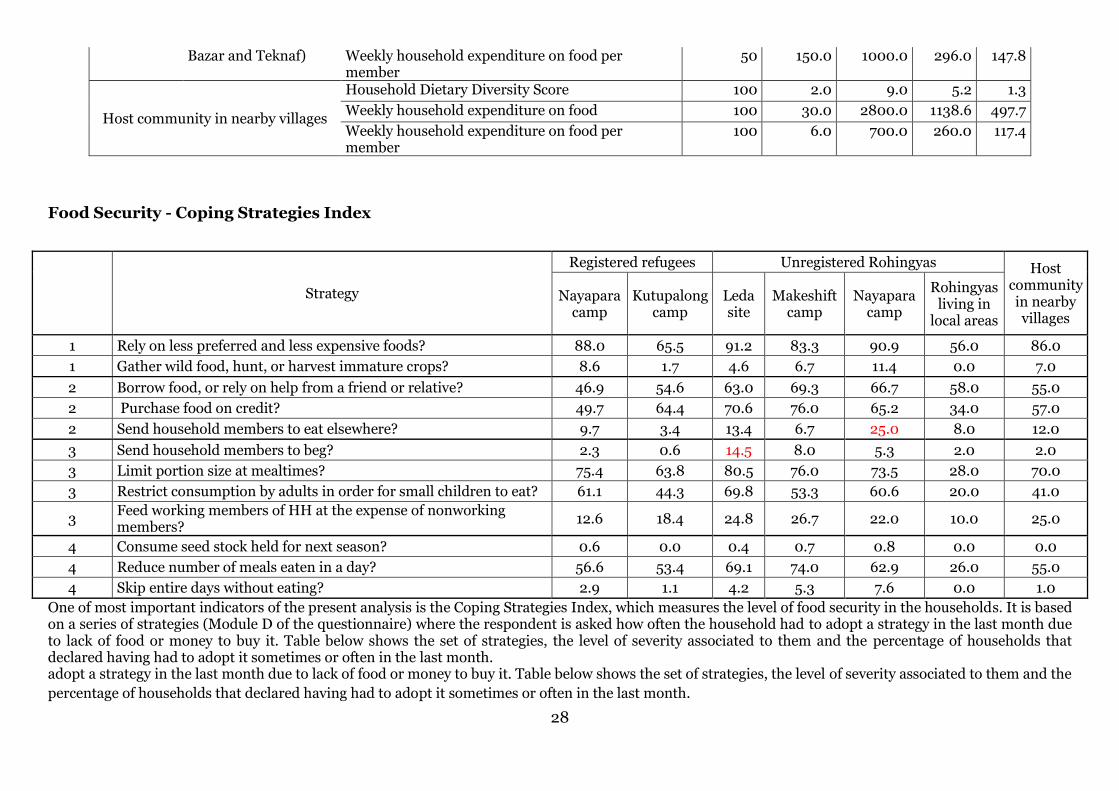
Food Security - Coping Strategies Index
One of most important indicators of the present analysis is the Coping Strategies Index, which measures the level of food security in the households. It is based on a series of strategies (Module D of the questionnaire) where the respondent is asked how often the household had to adopt a strategy in the last month due to lack of food or money to buy it. Table below shows the set of strategies, the level of severity associated to them and the percentage of households that declared having had to adopt it sometimes or often in the last month. adopt a strategy in the last month due to lack of food or money to buy it. Table below shows the set of strategies, the level of severity associated to them and the
percentage of households that declared having had to adopt it sometimes or often in the last month.
Strategy
Registered refugees Unregistered Rohingyas Host community in nearby villages
Nayapara camp
Kutupalong camp
Leda site
Makeshift camp
Nayapara camp
Rohingyas living in
local areas
1 Rely on less preferred and less expensive foods? 88.0 65.5 91.2 83.3 90.9 56.0 86.0
1 Gather wild food, hunt, or harvest immature crops? 8.6 1.7 4.6 6.7 11.4 0.0 7.0
2 Borrow food, or rely on help from a friend or relative? 46.9 54.6 63.0 69.3 66.7 58.0 55.0
2 Purchase food on credit? 49.7 64.4 70.6 76.0 65.2 34.0 57.0
2 Send household members to eat elsewhere? 9.7 3.4 13.4 6.7 25.0 8.0 12.0
3 Send household members to beg? 2.3 0.6 14.5 8.0 5.3 2.0 2.0
3 Limit portion size at mealtimes? 75.4 63.8 80.5 76.0 73.5 28.0 70.0
3 Restrict consumption by adults in order for small children to eat? 61.1 44.3 69.8 53.3 60.6 20.0 41.0
3 Feed working members of HH at the expense of nonworking members?
12.6 18.4 24.8 26.7 22.0 10.0 25.0
4 Consume seed stock held for next season? 0.6 0.0 0.4 0.7 0.8 0.0 0.0
4 Reduce number of meals eaten in a day? 56.6 53.4 69.1 74.0 62.9 26.0 55.0
4 Skip entire days without eating? 2.9 1.1 4.2 5.3 7.6 0.0 1.0
29
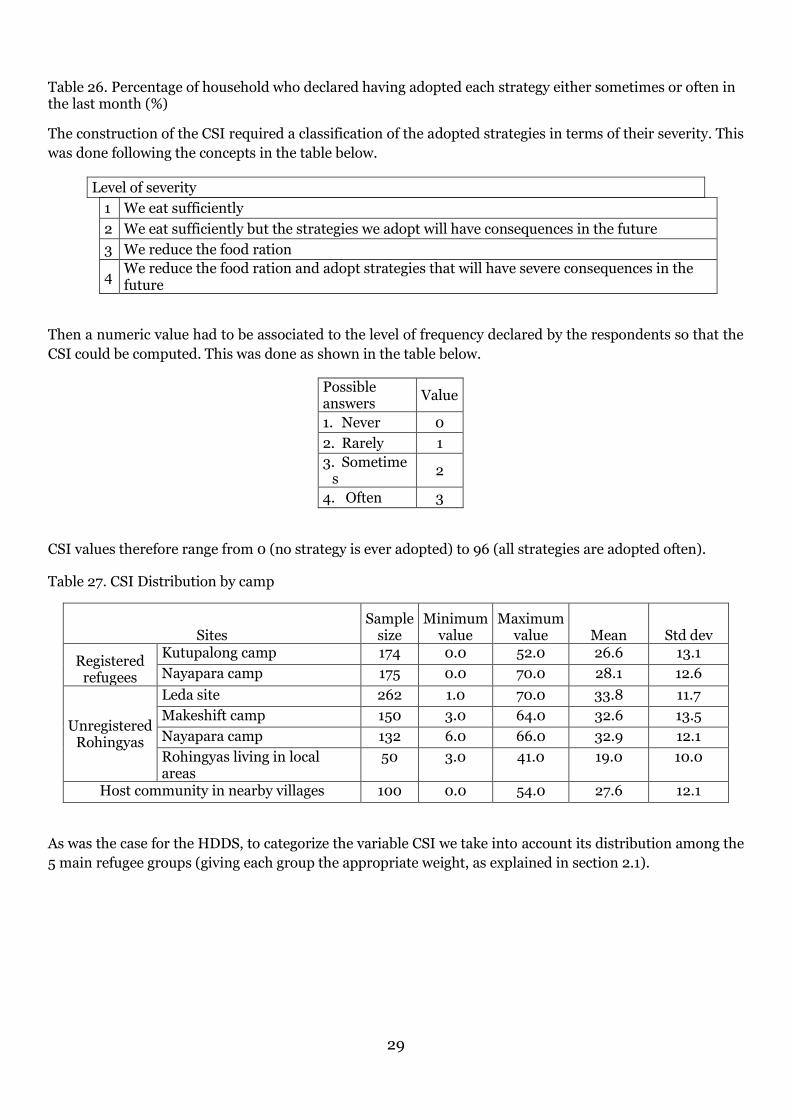
Table 26. Percentage of household who declared having adopted each strategy either sometimes or often in the last month (%)
The construction of the CSI required a classification of the adopted strategies in terms of their severity. This
was done following the concepts in the table below.
Level of severity
1 We eat sufficiently
2 We eat sufficiently but the strategies we adopt will have consequences in the future
3 We reduce the food ration
4 We reduce the food ration and adopt strategies that will have severe consequences in the future
Then a numeric value had to be associated to the level of frequency declared by the respondents so that the
CSI could be computed. This was done as shown in the table below.
Possible answers
Value
1. Never 0
2. Rarely 1
3. Sometimes
2
4. Often 3
CSI values therefore range from 0 (no strategy is ever adopted) to 96 (all strategies are adopted often).
Table 27. CSI Distribution by camp
Sites Sample
size Minimum
value Maximum
value Mean Std dev
Registered refugees
Kutupalong camp 174 0.0 52.0 26.6 13.1
Nayapara camp 175 0.0 70.0 28.1 12.6
Unregistered Rohingyas
Leda site 262 1.0 70.0 33.8 11.7
Makeshift camp 150 3.0 64.0 32.6 13.5
Nayapara camp 132 6.0 66.0 32.9 12.1
Rohingyas living in local areas
50 3.0 41.0 19.0 10.0
Host community in nearby villages 100 0.0 54.0 27.6 12.1
As was the case for the HDDS, to categorize the variable CSI we take into account its distribution among the
5 main refugee groups (giving each group the appropriate weight, as explained in section 2.1).

30
Table 28. CSI distribution (5 main refugee groups)
Statistics
Sample size 893
Mean 31.0
Std Dev. 13.1
Median 32.0
Percentiles 33.3 26.0
66.7 38.0
Table 29. Categorisaton of variable CSI
Categories CSI values % of refugee population
Severe [38-70] 33.5 %
Mid-range [26-37] 33.6 %
Gentle [0-25] 32.9 %

31
Table 30. CSI levels by population group (%)
Coping Strategies Index – Categories
Total Gentle
Mid-range
Severe
Registered refugees Kutupalong camp 45.3 32.0 22.7 100.0
Nayapara camp 41.7 35.9 22.3 100.0
Unregistered Rohingyas
Leda site 23.2 37.9 38.9 100.0
Makeshift camp 28.6 30.7 40.7 100.0
Nayapara camp 28.6 28.6 42.9 100.0
Rohingyas living in local areas (Cox´s Bazar)
74.0 22.0 4.0 100.0
Host community in nearby villages 48.0 24.0 28.0 100.0
CSI and HDDS present a negative correlation (-0.3)
Table 31. Distribution of CSI categories in terms of HDDS categories
HDDS categories
Coping Strategies Index categories
Total Gentle Mid-range Severe 1- Low
diversity 13.4 34.8 51.7 100.0 2- Mid
diversity 37.2 34.8 28.0 100.0 3- High diversity 49.9 29.4 20.7 100.0
Total general 32.9 33.6 33.5 100.0 * 5 main population groups included only. Weighting applied.

32
Coping Strategies to Face Consequences of an Unexpected Crisis
Table 32. Frequency of use of different strategies to cope with crises that meant an important loss within last year, by type of household
Type of household (taking registration status into account)
Leda site (unregistere
d Rohingyas)
Nayapara camp-
Registered
refugees
Nayapara camp-
Unregistered
Rohingyas
Makeshift camp
(unregistered
Rohingyas)
Kutupalong camp-
Registered refugees
Kutupalong camp-
Unregistered
Rohingyas
Rohingyas living in
local areas
(Cox´s Bazar)
Host communit
y in nearby villages
Did nothing 29% 38% 29% 22% 34% 43% 13% 26%
Borrowing 45% 37% 29% 53% 29% 29% 43% 37%
Reduce Consumption Expenditure
21% 16% 32% 19% 29% 25% 31% 26%
Asset sale 1% 3% 1% 0% 0% 0% 1% 2%
Transfer from friend/ relative
2% 2% 4% 2% 3% 0% 10% 4%
Relief Aid 0% 2% 2% 0% 1% 0% 0% 0%
Other 0% 1% 1% 0% 3% 0% 1% 4%
Sending child to other household
0% 0% 1% 0% 0% 0% 0% 0%
Begging 1% 0% 0% 1% 0% 0% 1% 0%
Sending child (less than 14) to work
0% 0% 0% 0% 0% 0% 0% 0%
Sending previously non-working adult HH member to work
0% 0% 0% 1% 0% 2% 0% 0%
Sell Advance Labour
1% 0% 0% 1% 1% 0% 0% 1%
Total number of used strategies (sample size)
682 338 234 316 278 51 72 217
100% 100% 100% 100% 100% 100% 100% 100%
It is important to note that the most used strategy to cope with crises in Nayapara and
Kutupalong among the registered refugees is “to do nothing”, which leads one to think that
these populations could be somewhat more dependent.
33
Borrowing is the most frequent strategy used by Rohingyas in Leda, the makeshift camp and local areas,
and also by the host community in the nearby villages.
The most frequently used strategy among the unregistered Rohingyas in Nayapara is to reduce the
consumption expenditure (though borrowing or doing nothing are used almost as frequently).

34
The Mobility Indicator
The Mobility Indicator is based on answers to the following question of module B3 of the household
questionnaire:
“Do you or any member of your family usually go to
- Nearby village/town?
- Teknaf?
- Cox’s Bazar?
- Other parts of Bangladesh?
- Other countries?”
The Mobility Indicator is the number of items in the list above that are usually visited by at least one household member, ranging from 0 (none of the places is ever visited by any of household members) to 5 (all of the places are usually visited by one of household member).
A preliminary analysis indicated that those households that report visiting places far from their camp or
site, report that they go to nearby places too (see table below). This is why weighting depending on distance
of places is considered unnecessary and the indicator is kept in its simplest form.
Table 33. Perc. of households having reported visiting each place by mobility indicator value
Nearby village/town Teknaf
Cox’s Bazar
Other parts of Bangladesh
Other countries
0 0.0% 0.0% 0.0% 0.0% 0.0%
1 92.3% 7.4% 0.0% 0.3% 0.0%
2 96.4% 71.3% 28.5% 3.9% 0.0%
3 100.0% 89.9% 99.4% 10.4% 0.3%
4 100.0% 100.0% 100.0% 97.5% 2.5%
5 100.0% 100.0% 100.0% 100.0% 100.0%
GRAPH 3. Mobility Indicator distribution by type of Rohingya

35
Graph 4. Boxplots: Mobility Indicator by registration status, area and sex of household head
Statistic All
Rohingya population
Registered refugees
Unregistered rohingyas
Kutupalong area
Nayapara area
Female Male
No. of observations 960 392 568 399 561 256 704
No. of missing values 0 0 0 0 0 0 0
Minimum 0.00 0.00 0.00 0.00 0.00 0.00 0.00
Maximum 5.00 5.00 5.00 5.00 5.00 5.00 5.00
Mean 2.69 2.42 2.86 2.81 2.54 2.15 2.86
Standard deviation (n-1) 1.09 1.25 0.93 1.06 1.12 1.21 0.99
Lower bound on mean (95%) 2.62 2.29 2.79 2.70 2.45 2.00 2.78
Upper bound on mean (95%) 2.76 2.54 2.94 2.91 2.64 2.30 2.93
ALL POPULA
TION
Registered
refugees
Non-register
ed Rohing
ya
0
1
2
3
4
5
6
MO
BIL
ITY
MOBILITY by registration status
ALL POPULA
TION
Kutupalong area
Nayapara area 0
1
2
3
4
5
6
MOBILITY by area
ALL POPULA
TION
Female Male
0
1
2
3
4
5
6
MOBILITY by sex of household head

36
The Protection Indicator
The Protection Indicator is based on answers to questions of module J of the household
questionnaire, on Rohingyas’ perceptions about the following items:
“Describe how you perceive
1 Your own or family members’ safety when need to move outside from where you live?
2 The local community’s perception of refugees?
3 Refugees’ relationship with local communities?
4 Refugees’ relationship with local authorities?
5 Refugees’ opportunities to attain self-reliance?
6 That the basic needs of your family are met (e.g. health/sanitation, education and
livelihood opportunities)?
7 How would you characterize your family’s safety since 2009?”
For each question, answer is codified into a dummy variable taking the value 1 when the
respondent’s answer is “Positive/favorable”. Answers to the seven questions are added up into the
Protection Indicator, ranging from 0 to 7.
Protection, or at least how it is perceived by Rohinygas, depends more on the geographical
location of refugees than on their status. Rohingyas living in the Kutupalong area (the
official refugee camp and the makeshift camp) are more likely to report a satisfactory
protection level than those living in the Nayapara area. The table below confirms this. Differences
in means are more significant when refugees are grouped by area than by registration status. This will also
be confirmed by regression models, in which the geographical location appeared as a more relevant variable
than the Type of household (See chapter 6).
0.0
10.0
20.0
30.0
40.0
50.0
60.0
70.0
80.0
90.0
0-2 3-4 5-7
% o
f h
ou
seh
old
s
Protection indicator values
Kutupalong registered refugees
Nayapara registered refugees
Leda
Makeshift camp
Nayapara unregisteredRohyingyas

37
Protection indicator
Protection indicator
(not weighted) (weighted)
Protection indicator scores by registration status Average Std. Dev. Average Std. Dev.
Registered refugee 2.02 2.08 0.75 0.90
Unregistered Rohingya 1.84 2.09 0.79 0.99
Protection indicator scores by area Average Std. Dev. Average Std. Dev.
Kutupalong area 2.65 2.21 0.91 0.99
Nayapara area 1.48 1.89 0.62 0.91
Grand Total 1.90 2.09 0.78 0.96
Difference registered/nonregistered 0.18
-0.04
Difference Kutupalong/Nayapara areas 1.17 0.29

38
The Wealth Score
The wealth score is computed to measure the capital that surveyed households count on. This capital either
assures their life quality and allows them to realize income earning activities nowadays, or could be used,
exchanged or sold in case an unexpected event happened in the future. Indeed, the wealth score is based on
household assets and the overall condition of the house. The type of ownership of each asset is not taken
into account, for we consider that as long as an asset can be used by the household members, then it is part
of the household’s capital.
The use of the amount of units of each asset instead of the value of the asset to compute the wealth score
was preferred for two reasons:
- It reduces the subjectivity on the price of assets.
- There are assets that have little value (Agricultural land appears as being of value 0 sometimes), but
their use allows families to increase their life quality or earn income.
Statistical Method Applied Principal Components Analysis (PCA)
The calculation of the wealth score is based on a Principal Components Analysis (PCA) on variables on the
quantity of assets owned by the household, number of rooms in the house, and overall household condition.
PCA is one of the simplest and most robust ways of analyzing multidimensional data, using the dependencies between the variables to represent it in a more tractable, lower-dimensional form, losing the least information. The concise insight in the structure of data it provides makes the PCA an ideal preliminary step in indicators construction (see subsection “GRAPHS”). At the end of this section, households’ factor scores will be weighted by factor eigenvalues to compute each household’s wealth score. The analysis of how the wealth score is distributed is presented at the end of this section.
Included Variables
The included variables are, for assets listed in module F of the quantitative questionnaire, the amount of
units owned/used by the household. However, all variables for which all values are equal to zero are
excluded from the analysis. Also, last three variables on “others” are erased from the analysis, due to their
lack of precision. A total of 24 asset variables are considered.
Table 34. Excluded variables measuring the quantity of certain assets in the household
EXCLUDED VARIABLES 1. Bull/Buffalo/horse 15. engine driven boat 24. Plough 38. VCD/DVD
5. Dairy cow 17. Cycle rickshaw/van 25. Joal 39. Refrigerator
9. Pond 18. auto rickshaw 26. Irrigation pump
45. Others (Specify)
11. pickup/vehicle 19. CNG 32. Roar pump 46. Others (Specify)
12. motor bike 20. buffalo cart 33. Paddle thresher
47. Others (Specify)
13. bicycle 23. power tiller 35. Electric fan
Additionally, variables on number of rooms in the house, and overall household condition are included in
the analysis as active. The variable on house condition is inverted as shown in the table below.

39
Table 35. Recodification of variable "Overall condition of the house"
Former code New code
1 – Good 3 2 - Partial renovation required 2 3 - Major renovation required 1
4 – Terrible 0
Included Observations
To assure robustness of the analysis, only those households coming from population types for which a
representative sample was designed are included in the analysis as active observations. These are
households from Leda site, the Makeshift camp, Nayapara and Kutupalong registered refugees and
Nayapara unregistered Rohingyas.
Households from the rest of populations in the sample (Kutupalong unregistered Rohingyas, Rohingyas
living in local areas and host community) are included as supplementary observations. They will therefore
be represented (projected) in the PCA space and the wealth score will be calculated for them, but
they won’t participate in the determination of the PCA factor loadings or the determination
of the PCA space5, i.e. wealth score will be adapted to the wealth levels of the Rohingya
households in official and unofficial camps of Bangladesh.
Outliers
Outliers have been searched for and excluded.
Assets are grouped into 6 variables according to the types of assets they represent, as classified in the
questionnaire. For each asset group (Livestock, Land, Transport, Productive assets, Agricultural tools and
Appliances), the sum of the assets of that type is computed. Sums are analyzed and outliers for them are
excluded from this analysis.
Observations are considered as outliers when they are far from the average value, in more than 5 standard
deviations. Weighting is not taken into account at this stage of the process.
5 Variable weight in the wealth score calculation will depend on the frequency of the possession of each asset for the Rohingya
households in official and unofficial camps (Leda site, the Makeshift camp, Nayapara and Kutupalong registered refugees and Nayapara unregistered Rohingyas). Thus, wealth score will be adapted to the wealth levels of that population.

40
Table 36. Sample outliers
Outliers by variable
Upper
Limit
DARA_ID
LIVESTOCK
LAND
PRODUCTIVE
AGRICULTURAL
TOOLS
FURNITURE
SITES_labelled
LIVESTOCK
14 15 20 1 0 1 5 2. Nayapara registered
refugees
14 84 20 1 0 1 20 2. Nayapara registered
refugees
14 153 24 3 0 1 7 2. Nayapara registered
refugees
14 163 18 1 0 0 28 2. Nayapara registered
refugees
14 830 23 1 0 0 12 5. Kutupalong
registered refugees
14 962 15 1 0 0 7 5. Kutupalong
registered refugees
LAND 14 104 6 79 0 1 10 2. Nayapara registered
refugees
AGRICULTURAL TOOLS
4 723 12 1 0 9 29 4. Makeshift camp
FURNITURE
25 497 0 1 0 2 30 1. Leda
25 163 18 1 0 0 28 2. Nayapara registered
refugees
25 199 10 1 0 3 30 2. Nayapara registered
refugees
25 249 0 1 0 1 44 2. Nayapara registered
refugees
25 723 12 1 0 9 29 4. Makeshift camp
A total of 11 observations (outliers) are excluded.
Weighting is taken into account as explained in section 2.1.
Principal Component Analysis Results
Data cloud shows a high variability, not summarized in a few factors.
0
20
40
60
80
100
0
0.5
1
1.5
2
2.5
F1
F2
F3
F4
F5
F6
F7
F8
F9
F1
0
F1
1
F1
2
F1
3
F1
4
F1
5
F1
6
F1
7
F1
8
F1
9
F2
0
F2
1
F2
2
F2
3
F2
4
F2
5
F2
6
Cu
mu
lati
ve
va
ria
bil
ity
(%
)
Eig
en
va
lue
axis
Scree plot
Eigenvalue Cumulative %

41
Table 37. Factor loadings and contributions
F1
F2
Contribution to factor (%)
Factor loading
Contribution to factor (%)
Factor loading
40. Ornaments (gold/silver) 15.848 0.583 34. Radio/cassette player 33.602 0.682
42. Mosquito net 13.201 0.532 41. Almirah (wardrobe) 20.562 0.533
36. Mobile phone 10.068 0.465 44. Bench 8.050 -0.334
29. Kodal (Spade) 8.491 0.427 16. Fishing net 6.820 0.307
Number of rooms 7.858 0.410 31. insecticide Spray machine 5.233 -0.269
30. Shabol (Shovel) 6.953 0.386 40. Ornaments (gold/silver) 4.478 0.249
House condition 6.240 0.366 Number of rooms 4.476 -0.249
3. Poultry 5.515 0.344 30. Shabol(Shovel) 4.281 0.243
21. Sewing machine 5.209 0.334 29. Kodal( Spade) 3.808 -0.230
34. Radio/cassette player 3.905 0.289 42. Mosquito net 3.691 -0.226
4. Duck 3.775 0.285 22. Carom board 1.859 -0.160
6. pigeon/Koel 2.844 0.247 4. Duck 0.903 -0.112
28. Axe 2.473 0.230 21. Sewing machine 0.613 -0.092
44. Bench 2.316 0.223 House condition 0.465 -0.080
16. Fishing net 2.025 0.208 2. Goat /sheep 0.361 -0.071
2. Goat /sheep 1.021 0.148 7. agricultural land 0.192 -0.052
7. agricultural land 0.634 0.117 3. Poultry 0.169 0.048 31. insecticide Spray machine 0.469 0.100 8. homestead land 0.139 -0.044
10. other land 0.332 -0.084 6. pigeon/Koel 0.095 0.036
22. Carom board 0.317 0.082 43. Cot 0.082 0.034
43. Cot 0.293 -0.079 37. Television 0.068 -0.031
8. homestead land 0.164 0.059 36. Mobile phone 0.025 0.019
41. Almirah (wardrobe) 0.038 0.029 10. other land 0.022 0.017
14. local boat 0.009 -0.014 27. L L P (Irrigation machine) 0.003 -0.006
37. Television 0.003 0.008 14. local boat 0.002 0.005 27. L L P (Irrigation machine) 0.001 0.005 28. Axe 0.000 0.002
Three assets have an inverted effect (negative loading on factor 1), i.e. they are a symbol of poverty more than a symbol of wealth. However, their factor loading value is very close to zero. The assets are “other land” (other than agricultural or homestead), a local boat and a cot.
Graphs
In coherence with the above tables, PCA graph in the next page shows all assets have a positive effect on the first factor (except for the three assets having a negative Factor 1 loading), and therefore in the construction of the wealth score. Thus, the wealth score increases from left to right of the plane.
GRAPH 6 shows the interrelation of the wealth score and the type of household. The different positions of
the projected modalities of the variable on type of household, in relation to the first factor, imply differences
in the wealth score value. Poorer wealth score values are positioned to the left of the axis, while higher are
positioned to the right. Indeed, population types are sorted from poorer to wealthier: unregistered
Rohingyas in the makeshift camp, in Leda, in Nayapara, and then registered refugees in Kutupalong and
Nayapara (which present the same position in relation to factor 1, i.e. present same wealth score, on
average).

42
GRAPH 5. PCA plane. Active variables
2. Goat /sheep
3. Poultry
4. Duck
6. pigeon/Koel
7. agricultural land 8. homestead land
10. other land 14. local boat
16. Fishing net
21. Sewing machine
22. Carom board
27. L L P (Irrigation machine) 28. Axe
29. Kodal( Spade)
30. Shabol(Shovel)
31. insecticide Spray machine
34. Radio/cassette player
36. Mobile phone 37. Television
40. Ornaments (gold/silver)
41. Almirah (wardrobe)
42. Mosquito net
43. Cot
44. Bench Number of rooms
housecondition LIVESTOCK
LAND
PRODUCTIVE
AGRICULTURALTOOLS FURNITURE
-1
-0.75
-0.5
-0.25
0
0.25
0.5
0.75
1
-1 -0.75 -0.5 -0.25 0 0.25 0.5 0.75 1
F2
(5
.32
%)
F1 (8.25 %)
Variables (axes F1 and F2: 13.57 %)
Active variables Supplementary variables

43
GRAPH 6. PCA plane. Supplementary variable. Type of population
1. Leda
2. Nayapara registered refugees 3. Nayapara unregistered Rohingyas
4. Makeshift camp 5. Kutupalong registered refugees
-5
-5
F2
(5
.32
%)
F1 (8.25 %)
Observations (axes F1 and F2: 13.57 %)
Centroids
Wealth score
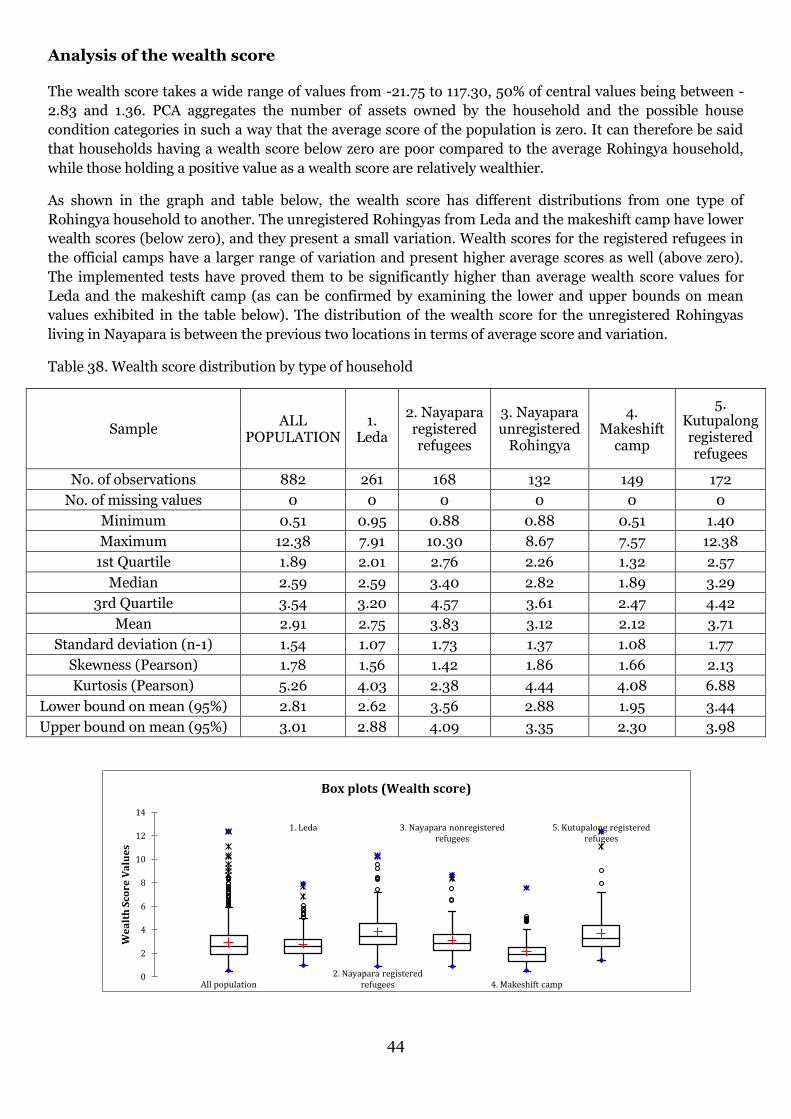
44
Analysis of the wealth score
The wealth score takes a wide range of values from -21.75 to 117.30, 50% of central values being between -
2.83 and 1.36. PCA aggregates the number of assets owned by the household and the possible house
condition categories in such a way that the average score of the population is zero. It can therefore be said
that households having a wealth score below zero are poor compared to the average Rohingya household,
while those holding a positive value as a wealth score are relatively wealthier.
As shown in the graph and table below, the wealth score has different distributions from one type of
Rohingya household to another. The unregistered Rohingyas from Leda and the makeshift camp have lower
wealth scores (below zero), and they present a small variation. Wealth scores for the registered refugees in
the official camps have a larger range of variation and present higher average scores as well (above zero).
The implemented tests have proved them to be significantly higher than average wealth score values for
Leda and the makeshift camp (as can be confirmed by examining the lower and upper bounds on mean
values exhibited in the table below). The distribution of the wealth score for the unregistered Rohingyas
living in Nayapara is between the previous two locations in terms of average score and variation.
Table 38. Wealth score distribution by type of household
Sample ALL
POPULATION 1.
Leda
2. Nayapara registered refugees
3. Nayapara unregistered
Rohingya
4. Makeshift
camp
5. Kutupalong registered refugees
No. of observations 882 261 168 132 149 172
No. of missing values 0 0 0 0 0 0
Minimum 0.51 0.95 0.88 0.88 0.51 1.40
Maximum 12.38 7.91 10.30 8.67 7.57 12.38
1st Quartile 1.89 2.01 2.76 2.26 1.32 2.57
Median 2.59 2.59 3.40 2.82 1.89 3.29
3rd Quartile 3.54 3.20 4.57 3.61 2.47 4.42
Mean 2.91 2.75 3.83 3.12 2.12 3.71
Standard deviation (n-1) 1.54 1.07 1.73 1.37 1.08 1.77
Skewness (Pearson) 1.78 1.56 1.42 1.86 1.66 2.13
Kurtosis (Pearson) 5.26 4.03 2.38 4.44 4.08 6.88
Lower bound on mean (95%) 2.81 2.62 3.56 2.88 1.95 3.44
Upper bound on mean (95%) 3.01 2.88 4.09 3.35 2.30 3.98
All population
1. Leda
2. Nayapara registered refugees
3. Nayapara nonregistered refugees
4. Makeshift camp
5. Kutupalong registered refugees
0
2
4
6
8
10
12
14
We
alt
h S
core
Va
lue
s
Box plots (Wealth score)

45
Classification of Households According to their Economic Activities
A clustering technique6 has been applied to the refugee population groups for which a representative
sample of households was surveyed7. The purpose was to classify refugee households depending on the
economic activities they undertake. Indeed, the clustering technique automatically creates the classification
for which households within groups are as similar as possible and households from different groups are as
different as possible, always in terms of households’ economic activities8. In other words, most
homogeneous groups in terms of economic activities emerge automatically from data, without the potential
influence of analysts’ prejudices on the existing groups. A simplified but useful picture of the Rohingya
population living in official and unofficial camps in Bangladesh is therefore produced.
The application of the clustering technique on the variables9 has lead to a classification of refugee
households into four different groups, as presented in the following page. Then a set of tables in section 5.1
presents how different indicators are distributed in the different household groups obtained through the
classification. All significant differences between groups are summarized in FIGURE 3 at the end of the
section. Then tables in section 5.2 show that these indicators behave differently within groups when the
registration status is taken into account. Again, at the end of the section, all significant differences between
registered and unregistered within group 2 are summarized in Table 58.
Table 39. Cluster variables
Variables included in the MCA (Households reported whether any of its
members participated in any of the following)
Perc. of Rohingya households who declare the item is one of
its economic activities (%)
Non agro based/industrial day labor 30.8
Poultry/Farming/Livestock 14.1
Micro enterprise outside house 14.0
Agro based day labour 13.0
Rickshaw 8.2
Sewing 7.7
Restaurant 6.6
Micro enterprise in own house 6.4
Maid 6.0
Beggar 5.4
NGO/govt worker 5.1
Fisher 4.7
Teacher/Imam/Religious person 4.1
Hawker 2.7
Skilled labour 2.0
6 A k-means cluster on the principal coordinates issued from a Multiple Correspondence Analysis of the variables on economic activities of the household. 7 These are the registered refugees in Kutupalong and Nayapara official refugee camps, and the unregistered Rohingyas in Leda, the makeshift camp of Kutupalong and the Nayapara official camp. Weighting is taken into account as presented in section 2.1. 8 Most homogeneous groups in terms of economic activities emerge directly from data, without the potential influence of analysts’ prejudices on the existing groups. 9 Issued from module B2 of the household questionnaire

46
TABLE 40. Rohingya household classification in terms of economic activities
GROUPS % of
refugee population
Estimate number of
households in real refugee population
Number of working members in the household
Characteristic activities
Refugee types
Perc. of registered
refugee households
Perc. of female headed
households
Perc. of households
in which children below 14
work
Perc. of households
in which no
members work
GROUP 1
One to three members work.
20.6% 2440
All households have at least one working member. About 93% of these households have 1 to 3 working members and and 95% undertake 1 to 3 economic activities.
Micro enterprise outside the house, rickshaw/van driving, hawkers, servers in restaurants.
This group is characterized by including an important percentage of refugees from Leda and the makeshift camp
15.1% 26.4% 58.8% 0.0%
GROUP 2
Zero to two household members work. Lower diversity of economic activities.
42.9% 5067 29% of households have no working members. 97% of households have 0 to 2 working members.
Farming, agro based day labor, NGO workers
This group is characterized by including a relatively important percentage of registered refugees Nayapara and Kutupalong official camps (although it presents a high percentage of unregistered Rohingyas too)
49.1% 23.9% 23.6% 28.5%
GROUP 3
Zero to two household members work.
18.7% 2212
22% of households have no working members. 92% of households have 0 to 2 working members. (this group has slightly more working members/activities than group 2)
Agro based and non agro based day labor, begging, skilled labor.
This group is characterized by including an important percentage of refugees from Leda and the makeshift camp
22.0% 23.9% 26.5% 20.9%
GROUP 4
One to three members work. Higher diversity of economic activities.
17.8% 2105
All households have at least one working member. About 95% of these households have 1 to 3 working members and 98% undertake 1 to 3 economic activities (this group has slightly less working members/activities than group 1)
Fishing, industrial labor, maids, servants, micro enterprise inside the house, religious persons, teachers, servers in restaurants.
This group is more mixed. It includes important percentages of refugees from the makeshift camp, the Nayapara official refugee camp, and also from Kutupalong official camp and Leda
32.4% 23.6% 56.7% 0.0%

47
Household Characteristics by Group
This section presents how different indicators are distributed in the different household groups obtained
through the classification (as categorical variables first, and then as scale variables). All significant
differences between groups are summarized in FIGURE 3 at the end of the section.
Table 41. Household distribution by group and type of Rohingya
Groups
Kutupalong registered refugees
Nayapara registered refugees Leda
Makeshift camp
Nayapara unregistered Rohingyas
Grand Total
1 4.1% 11.7% 36.8% 43.7% 3.8% 100.0%
2 23.4% 30.8% 14.0% 28.8% 3.0% 100.0%
3 7.5% 16.1% 31.7% 41.7% 3.0% 100.0%
4 12.9% 21.9% 18.6% 43.5% 3.1% 100.0% Grand Total 14.4% 22.4% 22.9% 37.1% 3.2% 100.0% Table 42. Household distribution by group and food consumption level
Household Dietary Diversity Score (HDDS)
Groups 1- Low diversity
2- Mid diversity
3- High diversity
Grand Total
1 28.2% 55.5% 16.3% 100.0%
2 26.6% 52.7% 20.7% 100.0%
3 30.2% 43.1% 26.7% 100.0%
4 40.1% 37.8% 22.0% 100.0%
Total 30.2% 48.6% 21.2% 100.0% Table 43. Household distribution by group and food security level
Coping Strategies Index (CSI)
Goups Gentle Mid-range Severe Grand Total
1 32.4% 39.0% 28.7% 100.0%
2 37.3% 33.5% 29.3% 100.0%
3 28.9% 29.3% 41.8% 100.0%
4 23.6% 34.3% 42.1% 100.0%
Total 32.1% 34.0% 34.0% 100.0% Table 44. Household distribution by group and wealth level
Wealth score
Groups Poorer Mid-range Wealthier Grand Total
1 33.1% 36.5% 30.4% 100.0%
2 31.0% 34.9% 34.1% 100.0%
3 36.9% 31.8% 31.3% 100.0%
4 35.9% 26.9% 37.1% 100.0%
Total 33.5% 33.1% 33.4% 100.0% Table 45. Household distribution by group and total earnings per household member
Groups No activities 0-100 100-200 200-300 400-500
500 or more
Grand Total
1 0.0% 6.8% 19.5% 19.4% 11.4% 42.9% 100.0%
2 27.2% 18.0% 12.1% 8.9% 9.9% 23.8% 100.0%

48
3 20.5% 5.9% 14.1% 18.2% 11.0% 30.4% 100.0%
4 0.1% 22.1% 16.9% 16.7% 13.0% 31.2% 100.0%
Total 15.2% 14.2% 14.9% 14.3% 11.0% 30.4% 100.0% Table 46. Indicator distribution by group (as scale variables)
Sample
No. of
obs.
No. Of missing
val. Min. Max. Mean Std dev.
Lower bound
on mean (95%)
Upper bound
on mean (95%)
FO
OD
CO
NS
UM
PT
ION
HDDS 882 0 0 9 4.4 1.5 4.3 4.5
HDDS | 1 182 0 1 9 4.3 1.4 4.1 4.5
HDDS | 2 378 0 2 9 4.5 1.4 4.3 4.6
HDDS | 3 165 0 0 9 4.5 1.6 4.3 4.8
HDDS | 4 157 0 2 9 4.2 1.5 4 4.5
Weekly food expenditure per member 882 0 0 525 155.9 89 150 161.8
Weekly food expenditure per member | 1 182 0 12.5 525 174.2 86.7 161.5 186.8
Weekly food expenditure per member | 2 378 0 0 500 144.4 93 135 153.8
Weekly food expenditure per member | 3 165 0 7.5 500 178 95.1 163.4 192.7
Weekly food expenditure per member | 4 157 0 0 300 138.9 65.9 128.5 149.3
FO
OD
S
EC
UR
ITY
CSI 882 0 0 70 31.2 13 30.3 32
CSI | 1 182 0 1 56 30.5 10.5 28.9 32 (1)
CSI | 2 378 0 2 70 29.4 14 28 30.8 (2)
CSI | 3 165 0 2 64 32.9 12.9 30.9 34.8 (2)
CSI | 4 157 0 0 66 34.2 12.6 32.2 36.1 (1)(2)
MO
BIL
ITY
MOBILITY 882 0 0 5 2.7 1.1 2.6 2.7
MOBILITY | 1 182 0 1 5 3 0.9 2.8 3.1
MOBILITY | 2 378 0 0 5 2.4 1.2 2.3 2.6
MOBILITY | 3 165 0 0 5 2.8 1 2.6 2.9
MOBILITY | 4 157 0 0 5 2.7 1.2 2.6 2.9
PR
OT
EC
TIO
N
Protection 882 0 0 7 2 2.1 1.9 2.2
Protection | 1 182 0 0 7 2.6 2.4 2.2 2.9
Protection | 2 378 0 0 7 1.7 1.9 1.5 1.9
Protection | 3 165 0 0 7 1.9 2.2 1.6 2.3
Protection | 4 157 0 0 7 2.2 2.1 1.8 2.5
CA
PIT
AL
Wealth score 882 0 0.5 12.4 2.9 1.5 2.8 3
Wealth score | 1 182 0 1.1 8.7 2.8 1.3 2.6 3
Wealth score | 2 378 0 0.9 12.4 2.9 1.5 2.8 3.1
Wealth score | 3 165 0 1 12.3 2.8 1.5 2.6 3
Wealth score | 4 157 0 0.5 10.3 3 1.8 2.7 3.3
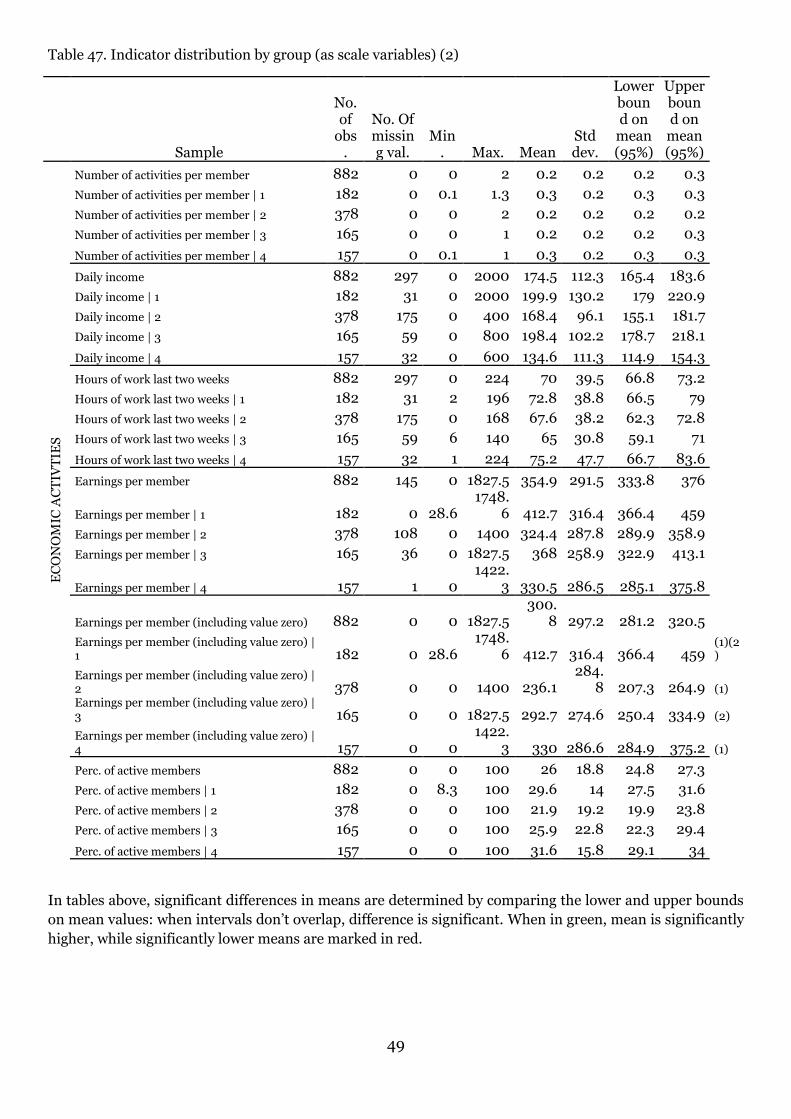
49
Table 47. Indicator distribution by group (as scale variables) (2) Sample
No. of
obs.
No. Of missing val.
Min. Max. Mean
Std dev.
Lower bound on
mean (95%)
Upper bound on
mean (95%)
EC
ON
OM
IC A
CT
IVT
IES
Number of activities per member 882 0 0 2 0.2 0.2 0.2 0.3
Number of activities per member | 1 182 0 0.1 1.3 0.3 0.2 0.3 0.3
Number of activities per member | 2 378 0 0 2 0.2 0.2 0.2 0.2
Number of activities per member | 3 165 0 0 1 0.2 0.2 0.2 0.3
Number of activities per member | 4 157 0 0.1 1 0.3 0.2 0.3 0.3
Daily income 882 297 0 2000 174.5 112.3 165.4 183.6
Daily income | 1 182 31 0 2000 199.9 130.2 179 220.9
Daily income | 2 378 175 0 400 168.4 96.1 155.1 181.7
Daily income | 3 165 59 0 800 198.4 102.2 178.7 218.1
Daily income | 4 157 32 0 600 134.6 111.3 114.9 154.3
Hours of work last two weeks 882 297 0 224 70 39.5 66.8 73.2
Hours of work last two weeks | 1 182 31 2 196 72.8 38.8 66.5 79
Hours of work last two weeks | 2 378 175 0 168 67.6 38.2 62.3 72.8
Hours of work last two weeks | 3 165 59 6 140 65 30.8 59.1 71
Hours of work last two weeks | 4 157 32 1 224 75.2 47.7 66.7 83.6
Earnings per member 882 145 0 1827.5 354.9 291.5 333.8 376
Earnings per member | 1 182 0 28.6 1748.
6 412.7 316.4 366.4 459
Earnings per member | 2 378 108 0 1400 324.4 287.8 289.9 358.9
Earnings per member | 3 165 36 0 1827.5 368 258.9 322.9 413.1
Earnings per member | 4 157 1 0 1422.
3 330.5 286.5 285.1 375.8
Earnings per member (including value zero) 882 0 0 1827.5 300.
8 297.2 281.2 320.5
Earnings per member (including value zero) | 1 182 0 28.6
1748.6 412.7 316.4 366.4 459
(1)(2)
Earnings per member (including value zero) | 2 378 0 0 1400 236.1
284.8 207.3 264.9 (1)
Earnings per member (including value zero) | 3 165 0 0 1827.5 292.7 274.6 250.4 334.9 (2)
Earnings per member (including value zero) | 4 157 0 0
1422.3 330 286.6 284.9 375.2 (1)
Perc. of active members 882 0 0 100 26 18.8 24.8 27.3
Perc. of active members | 1 182 0 8.3 100 29.6 14 27.5 31.6
Perc. of active members | 2 378 0 0 100 21.9 19.2 19.9 23.8
Perc. of active members | 3 165 0 0 100 25.9 22.8 22.3 29.4
Perc. of active members | 4 157 0 0 100 31.6 15.8 29.1 34
In tables above, significant differences in means are determined by comparing the lower and upper bounds
on mean values: when intervals don’t overlap, difference is significant. When in green, mean is significantly
higher, while significantly lower means are marked in red.

50
FIGURE 3. Summary of significant differences between groups Group
1 Group 2 Group 3 Group 4
Gr
ou
p 1
Weekly food expenditure (2↓); Mobility (2↓); Protection (2↓); Earnings per member (2↓); Earnings per member (including value zero) (2↓); Percentage of active members (2↓); Number of activities per member (2↓)
Earnings per member (including value zero) (3↓)
Weekly food expenditure (4↓); CSI (4↓); Daily income (4↓)
Gr
ou
p 2
Weekly food expenditure (2↓); CSI (3↓); Mobility (2↓); Number of activities per member (2↓)
CSI (4↓); Mobility (2↓); Daily income (4↓); Number of activities per member (2↓); Earnings per member (2↓)
Gr
ou
p 3
Weekly food expenditure (4↓); Daily income (4↓); Percentage of active members (2↓)
Gr
ou
p
4
* Scores for CSI are labelled as "↓" when higher, because that implies more severe strategies are adopted
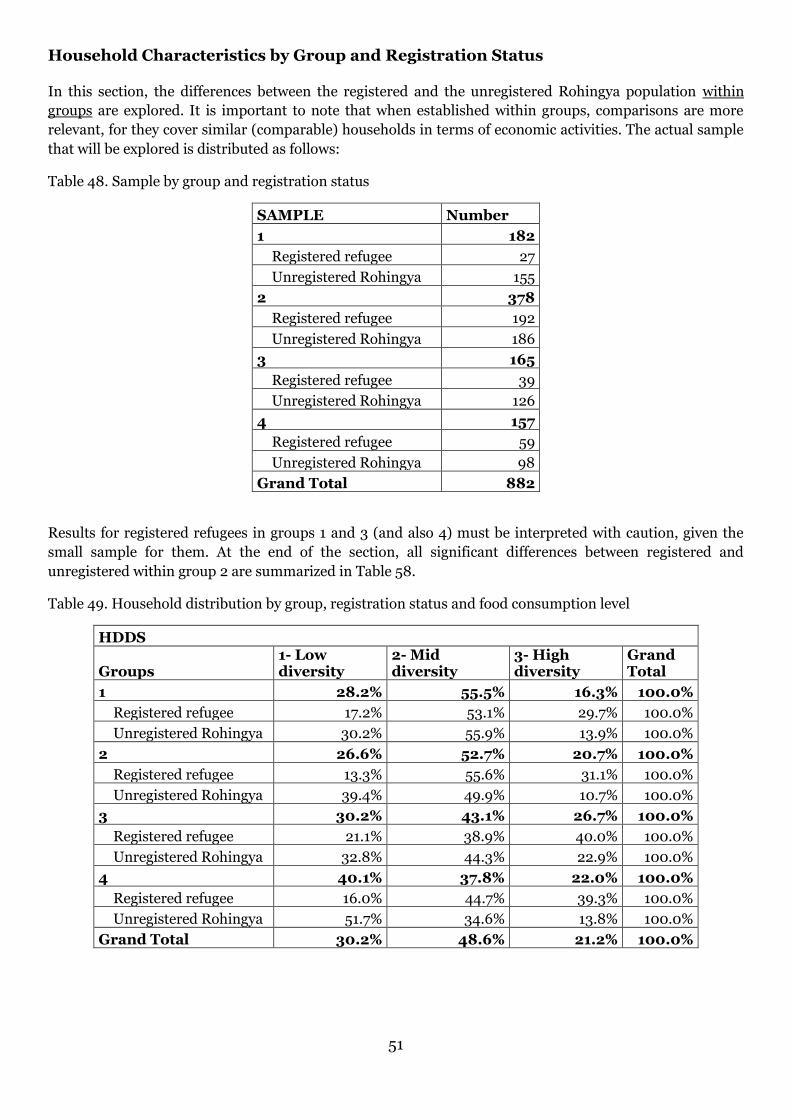
51
Household Characteristics by Group and Registration Status
In this section, the differences between the registered and the unregistered Rohingya population within
groups are explored. It is important to note that when established within groups, comparisons are more
relevant, for they cover similar (comparable) households in terms of economic activities. The actual sample
that will be explored is distributed as follows:
Table 48. Sample by group and registration status
SAMPLE Number
1 182
Registered refugee 27
Unregistered Rohingya 155
2 378
Registered refugee 192
Unregistered Rohingya 186
3 165
Registered refugee 39
Unregistered Rohingya 126
4 157
Registered refugee 59
Unregistered Rohingya 98
Grand Total 882
Results for registered refugees in groups 1 and 3 (and also 4) must be interpreted with caution, given the
small sample for them. At the end of the section, all significant differences between registered and
unregistered within group 2 are summarized in Table 58.
Table 49. Household distribution by group, registration status and food consumption level
HDDS
Groups 1- Low diversity
2- Mid diversity
3- High diversity
Grand Total
1 28.2% 55.5% 16.3% 100.0%
Registered refugee 17.2% 53.1% 29.7% 100.0%
Unregistered Rohingya 30.2% 55.9% 13.9% 100.0%
2 26.6% 52.7% 20.7% 100.0%
Registered refugee 13.3% 55.6% 31.1% 100.0%
Unregistered Rohingya 39.4% 49.9% 10.7% 100.0%
3 30.2% 43.1% 26.7% 100.0%
Registered refugee 21.1% 38.9% 40.0% 100.0%
Unregistered Rohingya 32.8% 44.3% 22.9% 100.0%
4 40.1% 37.8% 22.0% 100.0%
Registered refugee 16.0% 44.7% 39.3% 100.0%
Unregistered Rohingya 51.7% 34.6% 13.8% 100.0%
Grand Total 30.2% 48.6% 21.2% 100.0%

52
Table 50. Household distribution by group, registration status and food security level (%)
CSI
Groups Gentle Mid-range Severe Grand Total
1 32.4 39.0 28.7 100.0
Registered refugee 53.9 41.8 4.3 100.0
Unregistered Rohingya 28.5 38.5 33.0 100.0
2 37.3 33.5 29.3 100.0
Registered refugee 40.6 40.7 18.7 100.0
Unregistered Rohingya 34.0 26.5 39.5 100.0
3 28.9 29.3 41.8 100.0
Registered refugee 47.0 18.7 34.3 100.0
Unregistered Rohingya 23.8 32.3 43.9 100.0
4 23.6 34.3 42.1 100.0
Registered refugee 41.7 30.6 27.7 100.0
Unregistered Rohingya 14.9 36.0 49.1 100.0
Table 51. Household distribution by group, registration status and wealth level (%)
Wealth score
Groups Poorer Mid-range Wealthier Grand Total
1 33.1 36.5 30.4 100.0
Registered refugee 7.0 29.3 63.6 100.0
Unregistered Rohingya 37.7 37.8 24.5 100.0
2 31.0 34.9 34.1 100.0
Registered refugee 12.8 34.5 52.7 100.0
Unregistered Rohingya 48.6 35.3 16.1 100.0
3 36.9 31.8 31.3 100.0
Registered refugee 2.0 36.0 62.0 100.0
Unregistered Rohingya 46.7 30.6 22.7 100.0
4 35.9 26.9 37.1 100.0
Registered refugee 2.7 19.4 77.9 100.0
Unregistered Rohingya 51.8 30.6 17.7 100.0
Table 52. Household distribution by group, registration status and earnings per member (%)
Last two weeks household earnings per member
Groups No activities 0-100
100-200
200-300
400-500
500 or more
Grand Total
1 0.0 6.8 19.5 19.4 11.4 42.9 100.0
Registered refugee 0.0 28.6 35.6 10.5 0.0 25.4 100.0
Unregistered Rohingya 0.0 2.9 16.6 21.0 13.5 46.0 100.0
2 27.2 18.0 12.1 8.9 9.9 23.8 100.0
Registered refugee 41.0 27.7 14.2 6.1 2.5 8.5 100.0
Unregistered Rohingya 13.9 8.6 10.2 11.7 17.0 38.6 100.0
3 20.5 5.9 14.1 18.2 11.0 30.4 100.0
Registered refugee 42.6 15.6 14.4 16.5 0.0 10.9 100.0
Unregistered Rohingya 14.2 3.1 14.0 18.6 14.1 35.9 100.0
4 0.1 22.1 16.9 16.7 13.0 31.2 100.0
Registered refugee 0.0 40.0 29.4 8.1 7.1 15.4 100.0

53
Unregistered Rohingya 0.2 13.6 10.9 20.8 15.8 38.7 100.0 Grand Total 15.2% 14.2% 14.9% 14.3% 11.0% 30.4% 100.0%
Table 53. Household distribution by group, registration status and number of working hours per day
Hours of work per day
Groups Less than 4 hours
4 to 8 hours
9 to 12 hours
13 to 16 hours
Grand Total
1 6.5% 46.0% 47.1% 0.5% 100.0%
Registered refugee 39.0% 29.7% 31.4% 0.0% 100.0%
Unregistered Rohingya 0.6% 48.9% 49.9% 0.6% 100.0%
2 9.1% 43.8% 47.1% 0.0% 100.0%
Registered refugee 19.7% 55.1% 25.1% 0.0% 100.0%
Unregistered Rohingya 3.6% 37.9% 58.5% 0.0% 100.0%
3 4.4% 47.9% 47.7% 0.0% 100.0%
Registered refugee 7.6% 52.9% 39.5% 0.0% 100.0%
Unregistered Rohingya 4.0% 47.1% 48.9% 0.0% 100.0%
4 11.2% 50.1% 34.3% 4.4% 100.0%
Registered refugee 17.3% 50.4% 25.0% 7.3% 100.0%
Unregistered Rohingya 8.4% 50.0% 38.6% 3.0% 100.0%
Grand Total 8.0% 46.5% 44.4% 1.1% 100.0%
Group 2 households share a low number of working members (0 to 1), undertaking a variety of economic
activities. Table below shows that these activities are highly dependent on the registration status of
Rohingyas. Registered refugee households are significantly more involved in sewing, working in NGOs,
teaching, religious positions and poultry rearing, while unregistered households work more as day
labourers, shop or restaurant workers, maids, servants, rickshaw pullers, street vendors (hawkers), skilled
laborers, beggars…
Table 54. Percentage of households that practice each of the economic activities (%)
Note that one household may undertake several economic activities
GROUPS Farming
Day labour
Non Agro based day labour Fisher
Industrial labour
Restaurant Maid
1 0.0 9.7 24.3 2.7 0.4 8.7 5.2
Registered refugee 0.0 4.3 9.7 0.8 0.0 4.3 0.0
Unregistered Rohingya 0.0 10.7 26.9 3.1 0.5 9.5 6.2
2 3.2 19.1 30.2 0.0 0.9 4.7 0.0
Registered refugee 3.4 8.3 17.0 0.0 0.4 2.8 0.0
Unregistered Rohingya 3.0 29.6 42.9 0.0 1.3 6.5 0.0
3 2.5 13.3 43.3 0.0 0.0 6.7 0.0
Registered refugee 3.2 8.4 20.5 0.0 0.0 8.4 0.0
Unregistered Rohingya 2.3 14.6 49.7 0.0 0.0 6.2 0.0
4 0.5 2.6 24.7 22.1 1.3 8.4 26.2
Registered refugee 0.0 0.4 12.3 25.9 2.2 3.6 7.1
Unregistered Rohingya 0.7 3.7 30.6 20.2 0.9 10.7 35.3

54
GROUPS Sewing Rickshaw Hawker
Micro enterprise in own house
Micro enterprise outside house
Skilled labour
NGO worker
1 6.6 38.7 3.9 0.0 66.0 0.4 1.6
Registered refugee 25.4 19.4 0.0 0.0 80.6 0.0 7.0
Unregistered Rohingya 3.2 42.1 4.5 0.0 63.4 0.5 0.6
2 8.6 0.0 3.2 0.0 0.0 0.0 7.5
Registered refugee 14.1 0.0 0.7 0.0 0.0 0.0 13.0
Unregistered Rohingya 3.3 0.0 5.7 0.0 0.0 0.0 2.2
3 6.0 0.0 1.0 0.0 0.9 10.1 6.3
Registered refugee 19.9 0.0 0.0 0.0 0.0 8.6 15.6
Unregistered Rohingya 2.1 0.0 1.3 0.0 1.2 10.5 3.8
4 8.7 1.4 2.1 33.8 1.7 0.0 1.4
Registered refugee 16.3 0.0 2.2 32.2 1.4 0.0 1.4
Unregistered Rohingya 5.1 2.1 2.1 34.6 1.9 0.0 1.4
GROUPS
Governmental organization worker
Religious person Beggar Live stock Poultry Teacher
1 0.0 0.0 5.8 0.0 13.0 0.0
Registered refugee 0.0 0.0 4.3 0.0 25.4 0.0
Unregistered Rohingya 0.0 0.0 6.0 0.0 10.8 0.0
2 0.0 0.0 4.6 0.3 12.1 0.0
Registered refugee 0.0 0.0 0.7 0.7 18.4 0.0
Unregistered Rohingya 0.0 0.0 8.4 0.0 6.0 0.0
3 0.0 0.0 8.7 0.1 12.9 0.0
Registered refugee 0.0 0.0 0.0 0.6 18.1 0.0
Unregistered Rohingya 0.0 0.0 11.2 0.0 11.5 0.0
4 0.7 10.3 3.3 0.7 10.8 12.9
Registered refugee 2.2 20.0 0.0 2.2 22.2 19.2
Unregistered Rohingya 0.0 5.7 4.9 0.0 5.3 9.9
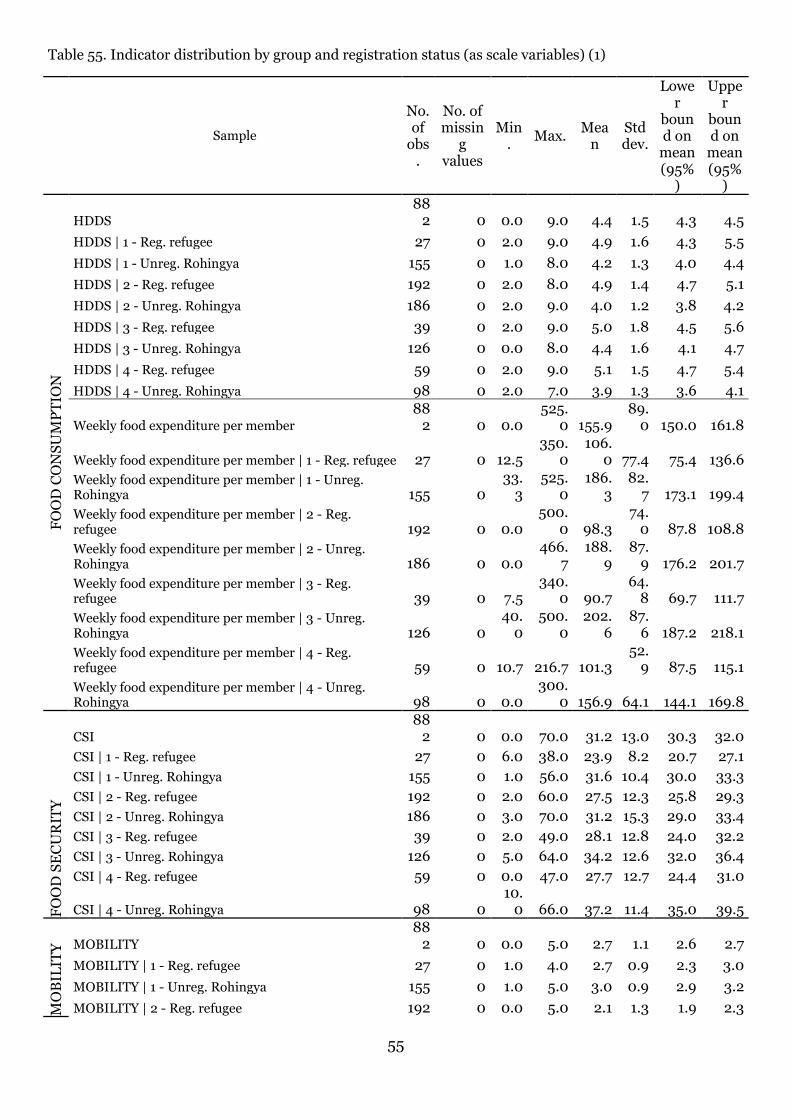
55
Table 55. Indicator distribution by group and registration status (as scale variables) (1)
Sample
No. of
obs.
No. of missin
g values
Min.
Max. Mea
n Std dev.
Lower
bound on
mean (95%
)
Upper
bound on
mean (95%
)
FO
OD
CO
NS
UM
PT
ION
HDDS
882 0 0.0 9.0 4.4 1.5 4.3 4.5
HDDS | 1 - Reg. refugee 27 0 2.0 9.0 4.9 1.6 4.3 5.5
HDDS | 1 - Unreg. Rohingya 155 0 1.0 8.0 4.2 1.3 4.0 4.4
HDDS | 2 - Reg. refugee 192 0 2.0 8.0 4.9 1.4 4.7 5.1
HDDS | 2 - Unreg. Rohingya 186 0 2.0 9.0 4.0 1.2 3.8 4.2
HDDS | 3 - Reg. refugee 39 0 2.0 9.0 5.0 1.8 4.5 5.6
HDDS | 3 - Unreg. Rohingya 126 0 0.0 8.0 4.4 1.6 4.1 4.7
HDDS | 4 - Reg. refugee 59 0 2.0 9.0 5.1 1.5 4.7 5.4
HDDS | 4 - Unreg. Rohingya 98 0 2.0 7.0 3.9 1.3 3.6 4.1
Weekly food expenditure per member
882 0 0.0
525.0 155.9
89.0 150.0 161.8
Weekly food expenditure per member | 1 - Reg. refugee 27 0 12.5 350.
0 106.
0 77.4 75.4 136.6
Weekly food expenditure per member | 1 - Unreg. Rohingya 155 0
33.3
525.0
186.3
82.7 173.1 199.4
Weekly food expenditure per member | 2 - Reg. refugee 192 0 0.0
500.0 98.3
74.0 87.8 108.8
Weekly food expenditure per member | 2 - Unreg. Rohingya 186 0 0.0
466.7
188.9
87.9 176.2 201.7
Weekly food expenditure per member | 3 - Reg. refugee 39 0 7.5
340.0 90.7
64.8 69.7 111.7
Weekly food expenditure per member | 3 - Unreg. Rohingya 126 0
40.0
500.0
202.6
87.6 187.2 218.1
Weekly food expenditure per member | 4 - Reg. refugee 59 0 10.7 216.7 101.3
52.9 87.5 115.1
Weekly food expenditure per member | 4 - Unreg. Rohingya 98 0 0.0
300.0 156.9 64.1 144.1 169.8
FO
OD
SE
CU
RIT
Y
CSI
882 0 0.0 70.0 31.2 13.0 30.3 32.0
CSI | 1 - Reg. refugee 27 0 6.0 38.0 23.9 8.2 20.7 27.1
CSI | 1 - Unreg. Rohingya 155 0 1.0 56.0 31.6 10.4 30.0 33.3
CSI | 2 - Reg. refugee 192 0 2.0 60.0 27.5 12.3 25.8 29.3
CSI | 2 - Unreg. Rohingya 186 0 3.0 70.0 31.2 15.3 29.0 33.4
CSI | 3 - Reg. refugee 39 0 2.0 49.0 28.1 12.8 24.0 32.2
CSI | 3 - Unreg. Rohingya 126 0 5.0 64.0 34.2 12.6 32.0 36.4
CSI | 4 - Reg. refugee 59 0 0.0 47.0 27.7 12.7 24.4 31.0
CSI | 4 - Unreg. Rohingya 98 0 10.
0 66.0 37.2 11.4 35.0 39.5
MO
BIL
ITY
MOBILITY
882 0 0.0 5.0 2.7 1.1 2.6 2.7
MOBILITY | 1 - Reg. refugee 27 0 1.0 4.0 2.7 0.9 2.3 3.0
MOBILITY | 1 - Unreg. Rohingya 155 0 1.0 5.0 3.0 0.9 2.9 3.2
MOBILITY | 2 - Reg. refugee 192 0 0.0 5.0 2.1 1.3 1.9 2.3

56
MOBILITY | 2 - Unreg. Rohingya 186 0 0.0 5.0 2.8 0.9 2.6 2.9
MOBILITY | 3 - Reg. refugee 39 0 0.0 4.0 2.3 1.3 1.9 2.7
MOBILITY | 3 - Unreg. Rohingya 126 0 0.0 5.0 2.9 0.8 2.8 3.0
MOBILITY | 4 - Reg. refugee 59 0 0.0 4.0 2.6 1.1 2.3 2.9
MOBILITY | 4 - Unreg. Rohingya 98 0 0.0 5.0 2.8 1.2 2.6 3.0

57
Table 56. Indicator distribution by group and registration status (as scale variables) (2)
Sample
No. of
obs.
No. of missin
g values
Min.
Max. Mea
n Std dev.
Lower
bound on
mean (95%)
Upper
bound on
mean (95%)
PR
OT
EC
TIO
N
Protection
882 0 0.0 7.0 2.0 2.1 1.9 2.2
Protection | 1 - Reg. refugee 27 0 0.0 6.0 2.1 2.1 1.3 2.9
Protection | 1 - Unreg. Rohingya 155 0 0.0 7.0 2.7 2.4 2.3 3.0
Protection | 2 - Reg. refugee 192 0 0.0 7.0 1.8 2.0 1.5 2.0
Protection | 2 - Unreg. Rohingya 186 0 0.0 7.0 1.7 1.9 1.4 2.0
Protection | 3 - Reg. refugee 39 0 0.0 7.0 1.5 2.1 0.8 2.1
Protection | 3 - Unreg. Rohingya 126 0 0.0 7.0 2.1 2.3 1.7 2.5
Protection | 4 - Reg. refugee 59 0 0.0 7.0 2.2 2.0 1.7 2.7
Protection | 4 - Unreg. Rohingya 98 0 0.0 7.0 2.1 2.1 1.7 2.6
CA
PIT
AL
Wealth score
882 0 0.5 12.4 2.9 1.5 2.8 3.0
Wealth score | 1 - Reg. refugee 27 0 1.9 6.9 3.9 1.4 3.3 4.4
Wealth score | 1 - Unreg. Rohingya 155 0 1.1 8.7 2.7 1.3 2.5 2.9
Wealth score | 2 - Reg. refugee 192 0 1.3 12.4 3.6 1.6 3.3 3.8
Wealth score | 2 - Unreg. Rohingya 186 0 0.9 7.6 2.3 1.1 2.2 2.5
Wealth score | 3 - Reg. refugee 39 0 1.4 12.3 4.1 2.1 3.4 4.8
Wealth score | 3 - Unreg. Rohingya 126 0 1.0 8.3 2.4 1.1 2.3 2.6
Wealth score | 4 - Reg. refugee 59 0 1.4 10.3 4.5 1.9 4.0 5.0
Wealth score | 4 - Unreg. Rohingya 98 0 0.5 7.2 2.3 1.3 2.0 2.5
EC
ON
OM
IC A
CT
IVIT
IES
Number of activities per member
882 0 0.0 2.0 0.2 0.2 0.2 0.3
Number of activities per member | 1 - Reg. refugee 27 0 0.1 0.8 0.3 0.2 0.3 0.4 Number of activities per member | 1 - Unreg. Rohingya 155 0 0.1 1.3 0.3 0.2 0.3 0.3
Number of activities per member | 2 - Reg. refugee 192 0 0.0 2.0 0.2 0.2 0.1 0.2 Number of activities per member | 2 - Unreg. Rohingya 186 0 0.0 1.0 0.2 0.2 0.2 0.3
Number of activities per member | 3 - Reg. refugee 39 0 0.0 0.8 0.2 0.2 0.1 0.2 Number of activities per member | 3 - Unreg. Rohingya 126 0 0.0 1.0 0.3 0.2 0.2 0.3
Number of activities per member | 4 - Reg. refugee 59 0 0.1 0.5 0.3 0.1 0.2 0.3 Number of activities per member | 4 - Unreg. Rohingya 98 0 0.1 1.0 0.3 0.2 0.3 0.4
Daily income
882 297 0.0
2000.0 174.5
112.3 165.4 183.6
Daily income | 1 - Reg. refugee 27 4 0.0 500.0 145.7 159.
7 76.7 214.8
Daily income | 1 - Unreg. Rohingya 155 27 0.0 2000.
0 209.
7 122.
3 188.3 231.1
Daily income | 2 - Reg. refugee 192 113 0.0 350.0 108.
8 110.
6 84.0 133.6
Daily income | 2 - Unreg. Rohingya 186 62 0.0 400.0 199.
6 69.9 187.1 212.0
Daily income | 3 - Reg. refugee 39 22 0.0 800.0 167.
8 178.
6 76.0 259.6
Daily income | 3 - Unreg. Rohingya 126 37 0.0 475.0 203. 84.9 185.2 221.0

58
1
Daily income | 4 - Reg. refugee 59 12 0.0 600.0 103.
3 103.
7 72.8 133.7
Daily income | 4 - Unreg. Rohingya 98 20 0.0 550.0 149.
3 112.
3 124.0 174.7

59
Table 57. Indicator distribution by group and registration status (as scale variables) (3)
Sample
No. of
obs.
No. of missing val.
Min.
Max. Mean Std dev.
Lower
bound on
mean (95%
)
Upper
bound on
mean (95%
)
EC
ON
OM
IC A
CT
IVIT
IES
Hours of work last two weeks
882 297 0.0 224.0 70.0 39.5 66.8 73.2
Hours of work last two weeks | 1 - Reg. refugee 27 4 2.0 168.0 60.9 46.4 40.9 81.0
Hours of work last two weeks | 1 - Unreg. Rohingya 155 27 9.0 196.0 74.9 37.0 68.4 81.4
Hours of work last two weeks | 2 - Reg. refugee
192 113 0.0 144.0 54.7 38.1 46.2 63.2
Hours of work last two weeks | 2 - Unreg. Rohingya
186 62 8.0 168.0 74.3 36.7 67.7 80.8
Hours of work last two weeks | 3 - Reg. refugee 39 22 6.0 112.0 56.7 31.1 40.7 72.7
Hours of work last two weeks | 3 - Unreg. Rohingya
126 37 8.0 140.0 66.3 30.7 59.8 72.8
Hours of work last two weeks | 4 - Reg. refugee 59 12 1.0 210.0 72.9 53.6 57.2 88.7
Hours of work last two weeks | 4 - Unreg. Rohingya 98 20 6.0 224.0 76.2 44.9 66.1 86.4
Earnings per member
882 145 0.0
1827.5
354.9
291.5
333.8
376.0
Earnings per member | 1 - Reg. refugee 27 0 28.
6 1166.
7 288.
7 321.1 161.7 415.
7
Earnings per member | 1 - Unreg. Rohingya 155 0 44.
3 1748.
6 434.
7 311.5 385.
3 484.
2
Earnings per member | 2 - Reg. refugee
192 78 0.0 900.0
168.0
194.0
132.0
204.0
Earnings per member | 2 - Unreg. Rohingya
186 30 0.0
1400.0
427.9
293.4
381.5
474.3
Earnings per member | 3 - Reg. refugee 39 16 0.0 1050.
0 252.
0 264.
1 137.
8 366.
2
Earnings per member | 3 - Unreg. Rohingya
126 20 0.0
1827.5
389.9
253.1
341.1
438.6
Earnings per member | 4 - Reg. refugee 59 0 0.0 750.0 187.
0 179.
6 140.
2 233.
8
Earnings per member | 4 - Unreg. Rohingya 98 1 0.0 1422.
3 399.
2 303.
0 338.
2 460.
3
Earnings per member (including value zero)
882 0 0.0
1827.5
300.8
297.2
281.2
320.5
Earnings per member (including value zero) | 1 - Reg. refugee 27 0
28.6
1166.7
288.7 321.1 161.7
415.7
Earnings per member (including value zero) | 1 - Unreg. Rohingya 155 0
44.3
1748.6
434.7 311.5
385.3
484.2
Earnings per member (including value zero) | 2 - Reg. refugee
192 0 0.0 900.0 99.1
170.2 74.8
123.3
Earnings per member (including value zero) | 2 - Unreg. Rohingya
186 0 0.0
1400.0
368.5
309.9
323.6
413.3
Earnings per member (including value zero) | 3 - Reg. refugee 39 0 0.0
1050.0
144.5
235.0 68.4
220.7
Earnings per member (including value zero) | 3 - Unreg. Rohingya
126 0 0.0
1827.5
334.3
271.2
286.5
382.1
Earnings per member (including value zero) | 4 - Reg. refugee 59 0 0.0 750.0
187.0
179.6
140.2
233.8

60
Earnings per member (including value zero) | 4 - Unreg. Rohingya 98 0 0.0
1422.3
398.5
303.2
337.7
459.2
Perc. of active members
882 0 0.0 100.0 26.0 18.8 24.8 27.3
Perc. of active members | 1 - Reg. refugee 27 0 14.
3 75.0 33.9 18.1 26.7 41.1
Perc. of active members | 1 - Unreg. Rohingya 155 0 8.3 100.0 28.8 13.1 26.7 30.9
Perc. of active members | 2 - Reg. refugee
192 0 0.0 100.0 18.1 21.0 15.1 21.1
Perc. of active members | 2 - Unreg. Rohingya
186 0 0.0 100.0 25.6 16.5 23.2 28.0
Perc. of active members | 3 - Reg. refugee 39 0 0.0 75.0 17.1 19.3 10.8 23.3
Perc. of active members | 3 - Unreg. Rohingya
126 0 0.0 100.0 28.3 23.2 24.2 32.4
Perc. of active members | 4 - Reg. refugee 59 0 7.1 55.6 25.4 11.5 22.4 28.4
Perc. of active members | 4 - Unreg. Rohingya 98 0 0.0 100.0 34.5 16.7 31.1 37.8
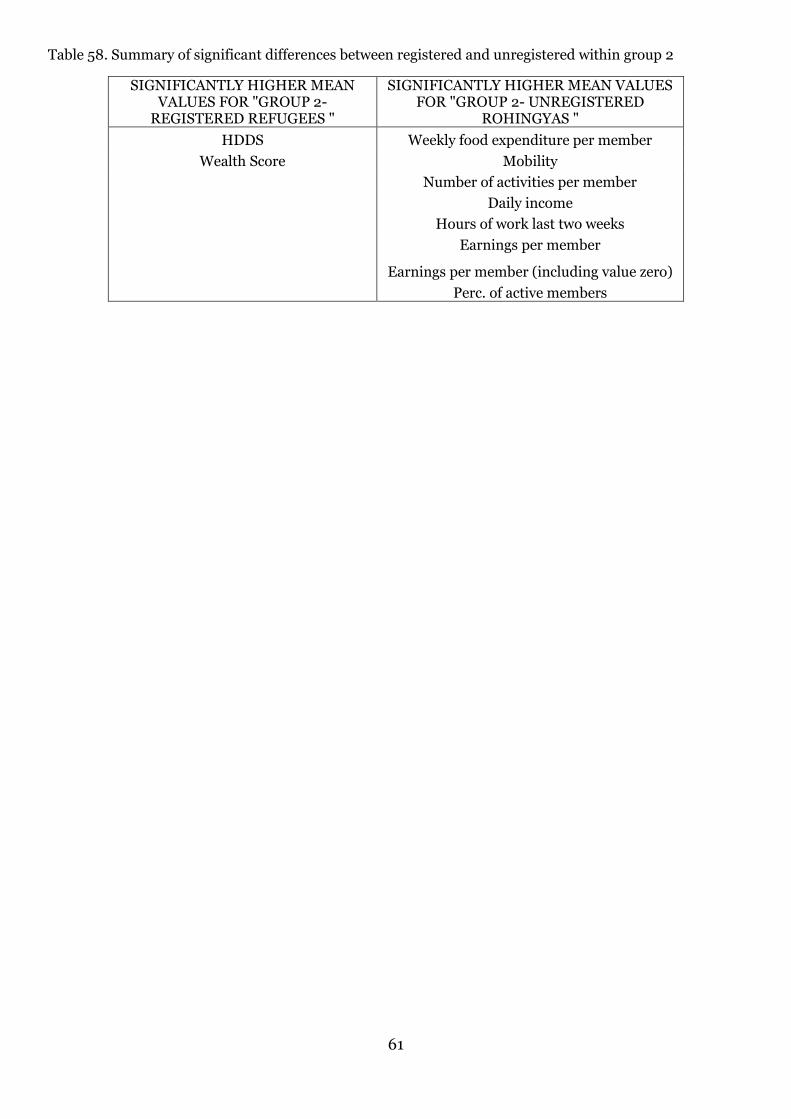
61
Table 58. Summary of significant differences between registered and unregistered within group 2
SIGNIFICANTLY HIGHER MEAN VALUES FOR "GROUP 2-
REGISTERED REFUGEES "
SIGNIFICANTLY HIGHER MEAN VALUES FOR "GROUP 2- UNREGISTERED
ROHINGYAS "
HDDS Weekly food expenditure per member
Wealth Score Mobility
Number of activities per member
Daily income
Hours of work last two weeks
Earnings per member
Earnings per member (including value zero)
Perc. of active members

62
Regression Analyses of Household Indicators
Multiple linear regression models of indicators on food consumption, food security,
protection and mobility
The construction of multiple linear regression models in which indicators of protection, food
consumption, food security, mobility and expenditures are regressed on demographic and
socioeconomic variables for households, as well as on aid received, registration status and area of
location, aimed to help us determine to what level the latter have an impact on refugees’ lives in
terms of the first set of indicators.
Moreover, regression models aimed to contribute in the answer to the following questions:
- To what point does food aid have an impact on protection, food consumption, food security
and mobility?
- What is the importance of each of the explanatory demographic and socioeconomic
variables compared to others in the estimation of the indicators (i.e. which has a greater
influence on the indicator value)?
The following indicators are to be explained through multiple linear regression models:
CONCEPT INDICATOR Food consumption Household Dietary Diversity Score (HDDS) Food security Coping Strategies Index (CSI) Protection Protection indicator (based on module J of the household questionnaire) Mobility Mobility indicator (based on module B3 of the household questionnaire)
Conclusions
The conclusions of the various models obtained are the following:
1. The Type of household (the camp where it’s located and the registration status of its
members, so therefore presumably the type of assistance received) has a great impact on the
food consumption levels of the household, as measured by the Household Dietary
Diversity Score (HDDS), but not really on the protection indicator.
o Indeed, given equal socioeconomic and conditions, official camps, that is registered
refugee households in Nayapara, and specially Kutupalong, present significantly
higher HDDS values (above 4) than the makeshift and the Nayapara unregistered
households (around 3.5). Leda, which receives some sort of assistance, is placed in
between the first and the latter (around 3.7).
o Other socioeconomic characteristics leading to variations in the HDDS values are the
wealth score, the education level, the marital status, the number of activities and the
activity group.
2. Not so much the Type of household, but just the registration status of its members, has an
impact on the food security and the mobility levels of them. Indeed, given similar
socioeconomic and demographic conditions the Coping Strategies Index shows an almost
five point difference between registered and unregistered Rohingyas (27.5 and 32.2 points
respectively).
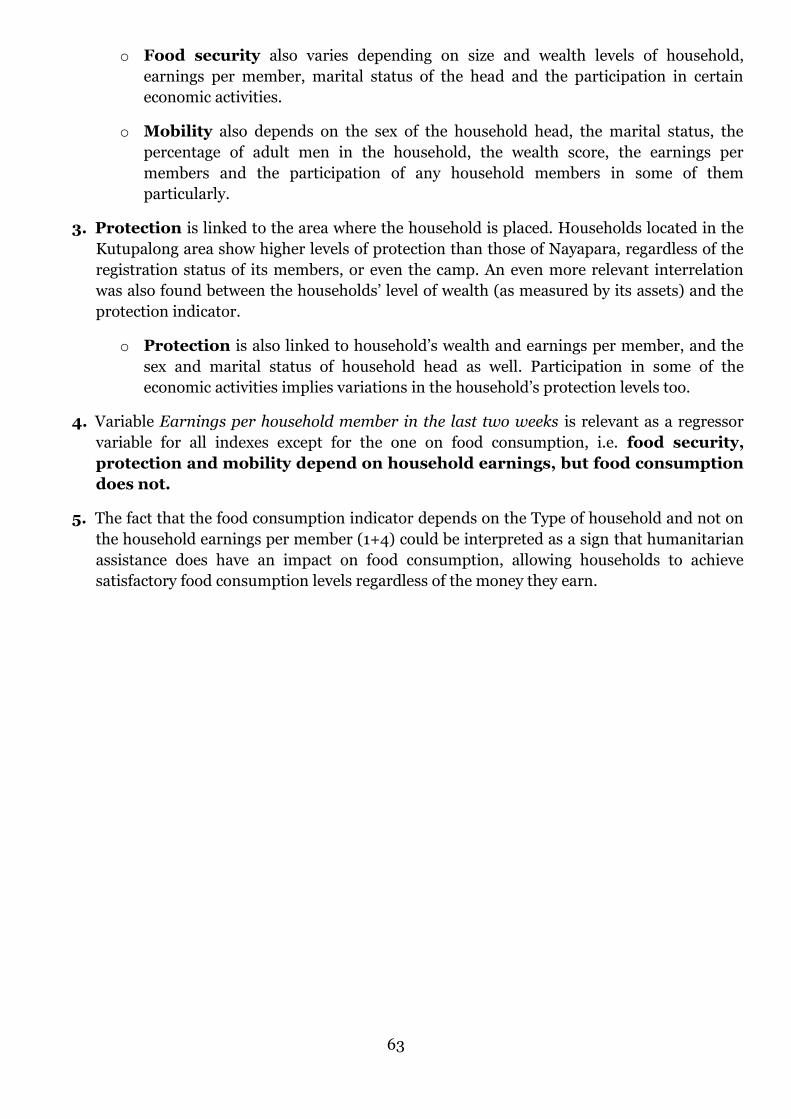
63
o Food security also varies depending on size and wealth levels of household,
earnings per member, marital status of the head and the participation in certain
economic activities.
o Mobility also depends on the sex of the household head, the marital status, the
percentage of adult men in the household, the wealth score, the earnings per
members and the participation of any household members in some of them
particularly.
3. Protection is linked to the area where the household is placed. Households located in the
Kutupalong area show higher levels of protection than those of Nayapara, regardless of the
registration status of its members, or even the camp. An even more relevant interrelation
was also found between the households’ level of wealth (as measured by its assets) and the
protection indicator.
o Protection is also linked to household’s wealth and earnings per member, and the
sex and marital status of household head as well. Participation in some of the
economic activities implies variations in the household’s protection levels too.
4. Variable Earnings per household member in the last two weeks is relevant as a regressor
variable for all indexes except for the one on food consumption, i.e. food security,
protection and mobility depend on household earnings, but food consumption
does not.
5. The fact that the food consumption indicator depends on the Type of household and not on
the household earnings per member (1+4) could be interpreted as a sign that humanitarian
assistance does have an impact on food consumption, allowing households to achieve
satisfactory food consumption levels regardless of the money they earn.

64
Applied Methodology
The construction of multiple linear regression models in which indicators of protection, food
consumption, food security and mobility are regressed on demographic and socioeconomic
variables for households, as well as on aid received, registration status and area of location, aimed
to help determine to what extent the latter have an impact on refugees’ lives in terms of the first set
of indicators.
All variables presented in the table below have been tested in different combinations as
explanatory variables of the dependent indicators, in the search for most relevant ones. Indeed, the
search for the best models was performed with the free software R10, using the "stepwise" and
"backward" methods based on the AIC criterion, and also by comparing different combinations of
independent variables using the ANOVA function and the R ² indicator. A revision of existing
correlations between variables was a requisite step in this process (See Table 59).
Initially, different combinations of explanatory variables were tested, assuming no joint effect
existed between them. At a second stage, the relevance of joint effects (of most relevant variable in
column 3 and variables in columns 1 and 2) was tested as well.
DEMOGRAPHIC CHARACTERISICS OF HOUSEHOLDS
SOCIO ECONOMIC CHARACTERISICS OF HOUSEHOLDS
CHARACTERISICS OF AID RECEIVED
- Sex of household head - Age and age group of
household head - Marital status of household
head - Level of education of
household head - Household size - Percentage of
women/men/children/elder
- Years of residence in Bangladesh of household head
- Wealth score - Economic activity of household
head - Economic activity of household
head (dummy) - Percentage of household members
who have an economic activity
- Income per member - Activities (activities will be tested
in the models one by one, to see if they have particular effects, but also as the cluster variable constructed during the classification of households in terms of economic activities)
- Percentage of registered refugees
- Type of household (camp/site where the household is located and registration status)
- Registration status - Area of location
Models were tested on the groups of refugee population for which we have a representative
sample. These are registered refugees of Nayapara and Kutupalong official camps, and
unregistered Rohingyas from Leda, the makeshift camp near Kutupalong and the Nayapara official
camp. Weighting was taken into account in all models.
Thus the study of the relevance and the size of the coefficients of the regressor variables was used
to complement the qualitative research which aimed to determine the extent to which food aid has
an impact on protection, food consumption, food security and mobility. Error! Reference
ource not found. summarizes all the models obtained for the different dependent variables. For
each model, in addition to the socioeconomic and demographic variables, one variable on
10
www.r-project.org

65
characteristic of aid received by the household (column 3) came up as highly relevant. This
variable was chosen as the “principal” regression variable (in bold in table below) and results are
expressed in terms of them in column 5.
More information on each obtained model is presented in the following pages. Finally, the
verification of hypotheses is explained.

66
Table 59. Variable correlations
Age of household
head
Years in
Bangladesh
Perc. of below 5 years
old members
Perc. of
below 12
years old members
Perc. of above 60 years old
members
Perc. Of regis tered
members
Household
s ize
Earnings per
member
Perc. Of Active
membersHDDS
Weekly food
expenditure
Expenditure
per memberCSI Wealth score
Number of
activities
Number of activities per
member
Protection
Age of
household
head
1.00
Years in Bangladesh 0.00 1.00
Perc. of below 5 years
old members
-0.39 -0.13 1.00
Perc. of
below 12
years old members
-0.40 -0.05 0.53 1.00
Perc. of above 60 years old
members
0.47 0.03 -0.18 -0.34 1.00
Perc. Of regis tered members
0.07 0.36 -0.14 -0.09 0.03 1.00
Household
s ize 0.17 -0.02 -0.01 0.17 -0.20 -0.06 1.00
Earnings per
member-0.06 -0.22 0.07 -0.09 0.03 -0.40 -0.03 1.00
Perc. Of Active
members
0.03 -0.13 -0.12 -0.23 0.09 -0.20 -0.21 0.46 1.00
HDDS -0.02 0.09 0.04 0.05 -0.01 0.26 0.01 0.04 0.11 1.00Weekly food
expenditure0.03 -0.18 0.10 0.09 -0.10 -0.46 0.40 0.27 0.02 0.05 1.00
Expenditure
per member-0.07 -0.19 0.11 -0.07 0.08 -0.43 -0.26 0.33 0.16 0.03 0.69 1.00
CSI 0.01 -0.09 -0.03 0.03 -0.05 -0.23 0.10 -0.12 -0.05 -0.31 -0.01 -0.10 1.00
Wealth score 0.13 0.16 -0.14 -0.09 -0.07 0.36 0.29 -0.03 0.03 0.37 -0.01 -0.20 -0.21 1.00Number of
activities0.04 -0.12 -0.03 -0.05 -0.08 -0.23 0.29 0.41 0.62 0.15 0.28 0.08 -0.01 0.22 1.00
Number of
activities per
member
-0.04 -0.13 -0.04 -0.19 0.07 -0.19 -0.28 0.40 0.81 0.10 0.00 0.21 -0.05 0.00 0.71 1.00
Protection -0.07 -0.01 0.04 0.04 -0.08 0.05 -0.01 0.12 0.06 0.28 -0.02 0.01 -0.07 0.21 0.08 0.07 1.00

67
Table 60. Best fit models
*i.o.o.h.i.g.a’s =is one of household’s income generating activities
Concept/indicator Model Main regressor variables
Other regressor variables Results depending on “principal” regression variables
Goodness of fit indicators
Food consumption: Household Dietary Diversity Score (HDDS) Ranging from 0 to 12
M1. Multiple linear regression model without joint effects
Type of household Wealth score
Economic activity of HHH (dummy variable) Marital status of HHH Level of education of HHH Economic activity group Number of activities
Type of household: Unregistered in makeshift camp 3.48 Unregistered in Leda 3.79 Unregistered in Nayapara camp 3.37 Registered in Nayapara camp 4.03 Registered in Kutupalong camp 4.24
Adjusted R-squared: 0.926
M2. Multiple linear regression model with joint effects
Type of household Wealth score Economic activity of HHH (dummy variable)
Type of household * Economic activity of HHH (dummy) Marital status of HHH Number of activities Type of household *Percentage of HH members older than 60 Level of education of HHH Type of household *Poultry i.o.o.h.i.g.a’s* Economic activity group
Adjusted R-squared: 0.928
Food Security : Coping Strategies Index (CSI) Ranging from 0 (no strategy is ever adopted) to 96 (all strategies are adopted often)
M3. Multiple linear regression model without joint effects
Registration status Household size Earnings per HH member
Economic activity group Marital status of HHH
Registration status: Unregistered 32.18 Registered 27.51
Adjusted R-squared: 0.8749
M4. Multiple linear regression model with joint effects
Registration status Earnings per HH member Beggar i.o.o.h.i.g.a’s Wealth score Day labor i.o.o.h.i.g.a’s
Poultry i.o.o.h.i.g.a’s Fisher i.o.o.h.i.g.a’s Sewing i.o.o.h.i.g.a’s Refugee status*Sewing Refugee status*Fisher
Adjusted R-squared: 0.8804
Protection: Indicator based on module J of the household questionnaire Ranging from 0 to
M5. Multiple linear regression model without joint effects
Wealth score Location Marital status of HHH Earnings per HH member
Maid i.o.o.h.i.g.a’s Beggar i.o.o.h.i.g.a’s Micro enterprise in own house i.o.o.h.i.g.a’s Sex of HHH Micro enterprise outside house i.o.o.h.i.g.a’s Rickshaw i.o.o.h.i.g.a’s
Location: Kutupalong 0.73 Nayapara 0.28
Adjusted R-squared: 0.4979
Mobility: Indicator based on module B3 of the household questionnaire Ranging from 0 to 5
M6. Multiple linear regression model without joint effects
Registration status Sex of HHH
Day labor i.o.o.h.i.g.a’s Earnings per HH member Other i.o.o.h.i.g.a’s Maid i.o.o.h.i.g.a’s Non agro based day labour Economic activity group Beggar i.o.o.h.i.g.a’s
Registration status: Unregistered 2.05 Registered 1.61
Adjusted R-squared: 0.9013

68
Selected Models
Food consumption: Household Dietary Diversity Score (HDDS) M1. Multiple linear regression model without joint effects
Variables/categories Estimate Std. Error t-value Pr(>|t|)
Residual standard error: 1.258
on 866 degrees of freedom
Multiple R-squared: 0.9273,
Adjusted R-squared: 0.926
F-statistic: 690.8 on 16 and 866
DF, p-value: < 2.2e-16
Signification codes:
0 ‘***’ 0.001 ‘**’ 0.01 ‘*’ 0.05
‘.’ 0.1 ‘ ’ 1
Type of household: Unregistered in makeshift camp 3.475 0.237 14.677 < 2e-16 ***
Type of household: Unregistered in Leda 3.788 0.251 15.095 < 2e-16 ***
Type of household: Unregistered in Nayapara camp 3.365 0.338 9.944 < 2e-16 ***
Type of household: Registered in Nayapara camp 4.030 0.268 15.019 < 2e-16 ***
Type of household: Registered in Kutupalong camp 4.236 0.275 15.391 < 2e-16 ***
Wealth score 0.287 0.033 8.601 < 2e-16 ***
Economic activity of HHH: No economic activity -0.325 0.108 -2.997 0.00280 **
Marital status of HHH: Widow/widower -0.356 0.133 -2.675 0.00762 ** Level of education of HHH: Never enrolled/didn't pass any class -0.456 0.180 -2.533 0.01150 *
Economic activity group: 3 0.347 0.142 2.448 0.01458 *
Number of activities 0.138 0.059 2.338 0.01963 *
Level of education of HHH: Primary education -0.389 0.209 -1.859 0.06343 .
Marital status of HHH: Separated -0.265 0.170 -1.557 0.11983
Economic activity group:4 -0.192 0.138 -1.388 0.16546
Economic activity group:2 0.163 0.129 1.262 0.20732
Level of education of HHH: Religious education 0.101 0.204 0.494 0.62150
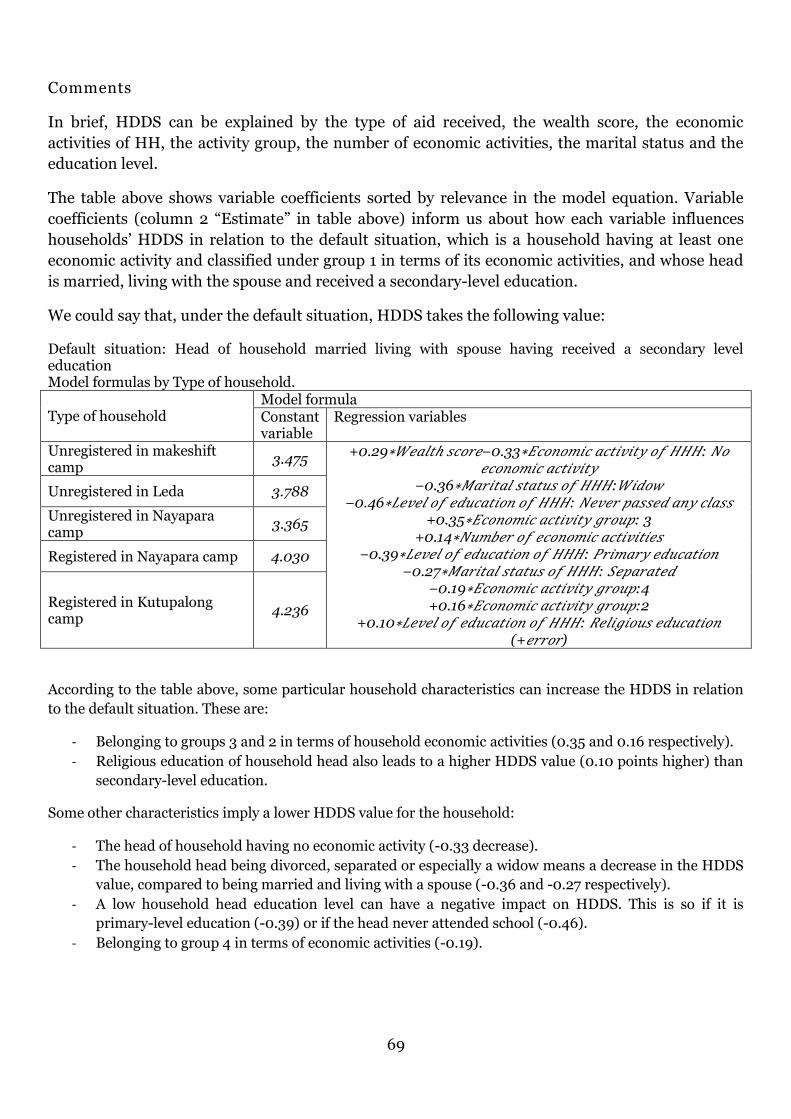
69
Comments
In brief, HDDS can be explained by the type of aid received, the wealth score, the economic
activities of HH, the activity group, the number of economic activities, the marital status and the
education level.
The table above shows variable coefficients sorted by relevance in the model equation. Variable
coefficients (column 2 “Estimate” in table above) inform us about how each variable influences
households’ HDDS in relation to the default situation, which is a household having at least one
economic activity and classified under group 1 in terms of its economic activities, and whose head
is married, living with the spouse and received a secondary-level education.
We could say that, under the default situation, HDDS takes the following value:
Default situation: Head of household married living with spouse having received a secondary level education Model formulas by Type of household. Type of household
Model formula Constant variable
Regression variables
Unregistered in makeshift camp
3.475 +0.29 𝑊 𝑎𝑙𝑡ℎ 𝑠𝑐𝑜𝑟 −0.33 𝐸𝑐𝑜 𝑜𝑚𝑖𝑐 𝑎𝑐𝑡𝑖𝑣𝑖𝑡𝑦 𝑜𝑓 𝐻𝐻𝐻: 𝑜
𝑐𝑜 𝑜𝑚𝑖𝑐 𝑎𝑐𝑡𝑖𝑣𝑖𝑡𝑦 −0.36 𝑀𝑎𝑟𝑖𝑡𝑎𝑙 𝑠𝑡𝑎𝑡𝑢𝑠 𝑜𝑓 𝐻𝐻𝐻:𝑊𝑖𝑑𝑜𝑤
−0.46 𝐿 𝑣 𝑙 𝑜𝑓 𝑑𝑢𝑐𝑎𝑡𝑖𝑜 𝑜𝑓 𝐻𝐻𝐻: 𝑣 𝑟 𝑎𝑠𝑠 𝑑 𝑎 𝑦 𝑐𝑙𝑎𝑠𝑠 +0.35 𝐸𝑐𝑜 𝑜𝑚𝑖𝑐 𝑎𝑐𝑡𝑖𝑣𝑖𝑡𝑦 𝑔𝑟𝑜𝑢 : 3
+0.14 𝑢𝑚𝑏 𝑟 𝑜𝑓 𝑐𝑜 𝑜𝑚𝑖𝑐 𝑎𝑐𝑡𝑖𝑣𝑖𝑡𝑖 𝑠 −0.39 𝐿 𝑣 𝑙 𝑜𝑓 𝑑𝑢𝑐𝑎𝑡𝑖𝑜 𝑜𝑓 𝐻𝐻𝐻: 𝑃𝑟𝑖𝑚𝑎𝑟𝑦 𝑑𝑢𝑐𝑎𝑡𝑖𝑜
−0.27 𝑀𝑎𝑟𝑖𝑡𝑎𝑙 𝑠𝑡𝑎𝑡𝑢𝑠 𝑜𝑓 𝐻𝐻𝐻: 𝑆 𝑎𝑟𝑎𝑡 𝑑 −0.19 𝐸𝑐𝑜 𝑜𝑚𝑖𝑐 𝑎𝑐𝑡𝑖𝑣𝑖𝑡𝑦 𝑔𝑟𝑜𝑢 :4 +0.16 𝐸𝑐𝑜 𝑜𝑚𝑖𝑐 𝑎𝑐𝑡𝑖𝑣𝑖𝑡𝑦 𝑔𝑟𝑜𝑢 :2
+0.10 𝐿 𝑣 𝑙 𝑜𝑓 𝑑𝑢𝑐𝑎𝑡𝑖𝑜 𝑜𝑓 𝐻𝐻𝐻: 𝑅 𝑙𝑖𝑔𝑖𝑜𝑢𝑠 𝑑𝑢𝑐𝑎𝑡𝑖𝑜 (+ 𝑟𝑟𝑜𝑟)
Unregistered in Leda 3.788
Unregistered in Nayapara camp
3.365
Registered in Nayapara camp 4.030
Registered in Kutupalong camp
4.236
According to the table above, some particular household characteristics can increase the HDDS in relation
to the default situation. These are:
- Belonging to groups 3 and 2 in terms of household economic activities (0.35 and 0.16 respectively).
- Religious education of household head also leads to a higher HDDS value (0.10 points higher) than
secondary-level education.
Some other characteristics imply a lower HDDS value for the household:
- The head of household having no economic activity (-0.33 decrease).
- The household head being divorced, separated or especially a widow means a decrease in the HDDS
value, compared to being married and living with a spouse (-0.36 and -0.27 respectively).
- A low household head education level can have a negative impact on HDDS. This is so if it is
primary-level education (-0.39) or if the head never attended school (-0.46).
- Belonging to group 4 in terms of economic activities (-0.19).

70
Food consumption: Household Dietary Diversity Score (HDDS) M2. Multiple linear regression model with joint effects
Variables/categories Estimate Std. Error t value Pr(>|t|)
Type of household: Registered in Nayapara camp 3.531 0.329 10.726 < 2e-16 ***
Type of household: Registered in Kutupalong camp 4.336 0.374 11.597 < 2e-16 ***
Type of household: Unregistered in makeshift camp 3.379 0.278 12.146 < 2e-16 ***
Type of household: Unregistered in Leda 3.938 0.342 11.514 < 2e-16 ***
Type of household: Unregistered in Nayapara camp 3.933 0.673 5.847 7.14E-09 ***
Wealth score 0.391 0.072 5.395 8.89E-08 ***
Economic activity of HHH: No economic activity -0.890 0.198 -4.504 7.61E-06 *** Type of household: Registered in Kutupalong camp*Economic activity of HHH: No economic activity 1.039 0.301 3.450 0.00059 *** Type of household: Registered in Nayapara camp* Economic activity of HHH: No economic activity 0.919 0.272 3.380 0.00076 ***
Marital status of HHH: Widow/widower -0.399 0.136 -2.930 0.00348 **
Number of activities 0.202 0.069 2.905 0.00377 **
Type of household: Unregistered in Leda*Percentage of HH members older than 60 0.026 0.009 2.791 0.00537 **
Level of education of HHH: Never enrolled/didn't pass any class -0.488 0.180 -2.714 0.00679 **
Type of household: Unregistered in makeshift camp*Poultry -0.887 0.340 -2.607 0.00931 **
Economic activity group:3 0.362 0.145 2.500 0.01260 *
Type of household: Unregistered in Leda*Economic activity of HHH: No economic activity 0.610 0.281 2.167 0.03049 *
Type of household: Registered in Kutupalong camp*Wealth score -0.196 0.100 -1.964 0.04982 *
Level of education of HHH: Primary education -0.395 0.208 -1.900 0.05776 .
Type of household: Unregistered in Leda*Wealth score -0.216 0.116 -1.857 0.06361 .
Daylabour -0.242 0.139 -1.739 0.08243 .
Marital status of HHH: Separated -0.296 0.171 -1.729 0.08410 .
Economic activity group:2 0.200 0.135 1.477 0.14018
Type of household: Unregistered in Nayapara camp*Wealth score -0.246 0.192 -1.278 0.20155
Economic activity group:4 -0.164 0.139 -1.183 0.23714 Type of household: Registered in Kutupalong camp*Percentage of HH members older than 60 -0.006 0.010 -0.610 0.54224

71
Type of household: Registered in Nayapara camp*Poultry 0.138 0.243 0.569 0.56972
Type of household: Unregistered in Leda*Poultry 0.145 0.327 0.444 0.65729
Type of household: Registered in Nayapara camp*Wealth score -0.035 0.091 -0.380 0.70425 Type of household: Unregistered in makeshift camp*Percentage of HH members older than 60 -0.002 0.006 -0.279 0.77998
Type of household: Unregistered in Nayapara camp*Poultry -0.224 0.938 -0.239 0.81108 Type of household: Unregistered in Nayapara camp*Percentage of HH members older than 60 0.005 0.020 0.238 0.81219
Type of household: Registered in Nayapara camp*Percentage of HH members older than 60 -0.002 0.007 -0.205 0.83777
Level of education of HHH: Religious education 0.036 0.204 0.175 0.86147 Type of household: Unregistered in Nayapara camp*Economic activity of HHH: No economic activity 0.061 0.552 0.111 0.91144
Type of household: Registered in Kutupalong camp*Poultry -0.010 0.341 -0.030 0.97632

72
Comments
The introduction of joint effects in the regression model formula aims to see if certain variables
have different effects on the HDDS value, depending on the camp or site where the household is
placed and its registration status (i.e. the type of aid received).
The table above shows variable coefficients sorted by relevance in the model equation. Theerader
must take into account that the default situation is a refugee household having at least one
economic activity and classified under group 1 in terms of its economic activities, and whose head
is married, living with the spouse and received a secondary-level education. Variable coefficients
inform us about how each variable influences households’ HDDS in relation to the default
situation.
Joint effects show that the wealth score is positively correlated with the HDDS as stated in the
formula above, but the strength of this correlation varies from one Type of household (i.e. type of
aid received) to another. The same happens with variables “Percentage of HH members above 60
years old”, “Poultry is one of HH’s IGAs” and the category “Economic Activity of household head:
No activity.” Graphs below show variable coefficients depending on the refugee camp/site. The
following conclusions can be drawn from them:
- Higher values of the wealth score imply higher values in the HDDS for all refugee types, but
some of them experience bigger increases than others. These are the registered refugees in
Nayapara and the unregistered in the makeshift camp.
- Households in which the household head doesn’t have an economic activity
have a lower HDDS value. However this is not true for the registered refugees
in the official camps, for whom the lack of activity of the head of household
does not imply a decrease in the HDDS.
- Refugee households in Leda (who do receive some kind of assistance) do not
experience such an important decrease in the HDDS value when their
household head lacks an economic activity as do unregistered households in
Nayapara and the makeshift camp (-0.28 for Leda against -0.89 and -0.83 for
the unregistered Rohingyas in the makeshift camp and Nayapara respectively)
- Two other variables seem to have different effects on the HDDS value depending on the camp or site
the household is in. These are “poultry” being a household economic activity and the percentage of
household members above age 60.
o Poultry has a positive effect on HDDS when present among registered refugees in Nayapara
or unregistered Rohingyas in Leda. However, its effect is significantly negative when present
among unregistered Rohingyas in the makeshift camp.
o The percentage of above 60 year-old members presents a higher and positive correlation
with the HDDS only in Leda.

73
0.20
0.36
0.17
0.39
0.15
0 0.05 0.1 0.15 0.2 0.25 0.3 0.35 0.4 0.45
Registered in Kutupalong camp*Wealth score
Registered in Nayapara camp*Wealth score
Unregistered in Leda*Wealth score
Unregistered in makeshift camp*Wealthscore
Unregistered in Nayapara camp*Wealth score
Reg
iste
red
Ref
uge
esU
nre
gist
ered
Ro
hin
gya
Joint effect of "Type of household" and "Wealth score" on the HDDS
0.15
0.03
-0.28
-0.89
-0.83
-1.0 -0.8 -0.6 -0.4 -0.2 0.0 0.2 0.4
Registered in Kutupalong camp*Economicactivity of HHH: No activity
Registered in Nayapara camp* Economicactivity of HHH: No activity
Unregistered in Leda*Economic activity ofHHH: No activity
Unregistered in makeshift camp*Economicactivity of HHH: No activity
Unregistered in Nayapara camp*Economicactivity of HHH: No activity
Reg
iste
red
Ref
uge
esU
nre
gist
ered
Ro
hin
gya
Joint effect of "Type of household" and "Economic activity of HHH: No activity" on the HDDS
-0.006
-0.002
0.026
-0.002
0.005
-0.01 0.00 0.01 0.02 0.03
Registered in Kutupalong camp*Perc. of HHmembers older than 60
Registered in Nayapara camp*Perc. of HHmembers older than 60
Unregistered in Leda*Perc. of HH membersolder than 60
Unregistered in makeshift camp*Perc. of HHmembers older than 60
Unregistered in Nayapara camp*Perc. of HHmembers older than 60
Reg
iste
red
Ref
uge
esU
nre
gist
ered
Ro
hin
gya
Joint effect of "Type of household" and "Perc. of above 60 year old members" on the HDDS
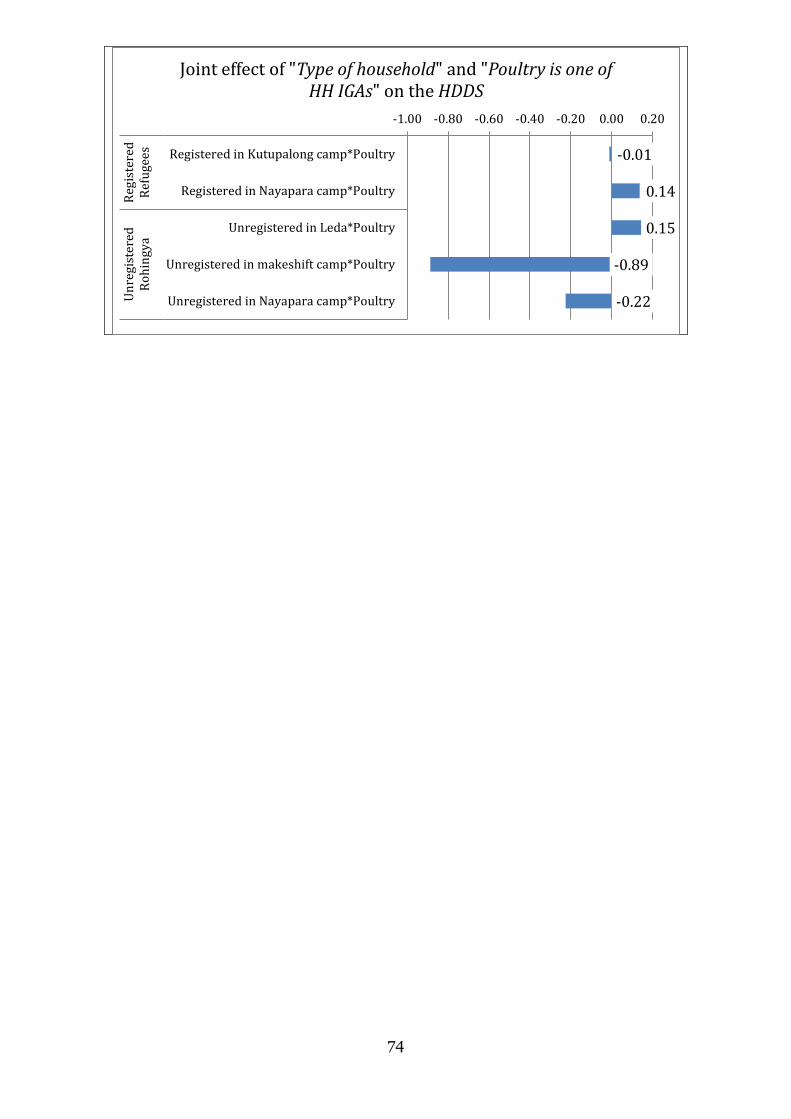
74
-0.01
0.14
0.15
-0.89
-0.22
-1.00 -0.80 -0.60 -0.40 -0.20 0.00 0.20
Registered in Kutupalong camp*Poultry
Registered in Nayapara camp*Poultry
Unregistered in Leda*Poultry
Unregistered in makeshift camp*Poultry
Unregistered in Nayapara camp*Poultry
Reg
iste
red
Ref
uge
esU
nre
gist
ered
Ro
hin
gya
Joint effect of "Type of household" and "Poultry is one of HH IGAs" on the HDDS

75
Default situation: Head of household married, living with spouse, having received a secondary-level education Model formulas by Type of household.
Type of household
Model formula Constant variable
Regression variables
Unregistered in makeshift camp
3.38
−0.40 𝑀𝑎𝑟𝑖𝑡𝑎𝑙 𝑠𝑡𝑎𝑡𝑢𝑠 𝑜𝑓 𝐻𝐻𝐻:𝑊𝑖𝑑𝑜𝑤 +0.20 𝑢𝑚𝑏 𝑟 𝑜𝑓 𝑐𝑜 𝑜𝑚𝑖𝑐 𝑎𝑐𝑡𝑖𝑣𝑖𝑡𝑖 𝑠
−0.49 𝐿 𝑣 𝑙 𝑜𝑓 𝑑𝑢𝑐𝑎𝑡𝑖𝑜 𝑜𝑓 𝐻𝐻𝐻: 𝑣 𝑟 𝑎𝑠𝑠 𝑑 𝑎 𝑦 𝑐𝑙𝑎𝑠𝑠 +0.36 𝐸𝑐𝑜 𝑜𝑚𝑖𝑐 𝑎𝑐𝑡𝑖𝑣𝑖𝑡𝑦 𝑔𝑟𝑜𝑢 : 3
−0.40 𝐿 𝑣 𝑙 𝑜𝑓 𝑑𝑢𝑐𝑎𝑡𝑖𝑜 𝑜𝑓 𝐻𝐻𝐻: 𝑃𝑟𝑖𝑚𝑎𝑟𝑦 𝑑𝑢𝑐𝑎𝑡𝑖𝑜 −0.24 𝐷𝑎𝑦 𝑙𝑎𝑏𝑜𝑟
−0.30 𝑀𝑎𝑟𝑖𝑡𝑎𝑙 𝑠𝑡𝑎𝑡𝑢𝑠 𝑜𝑓 𝐻𝐻𝐻: 𝑆 𝑎𝑟𝑎𝑡 𝑑 −0.16 𝐸𝑐𝑜 𝑜𝑚𝑖𝑐 𝑎𝑐𝑡𝑖𝑣𝑖𝑡𝑦 𝑔𝑟𝑜𝑢 :4 +0.20 𝐸𝑐𝑜 𝑜𝑚𝑖𝑐 𝑎𝑐𝑡𝑖𝑣𝑖𝑡𝑦 𝑔𝑟𝑜𝑢 :2
+0.04 𝐿 𝑣 𝑙 𝑜𝑓 𝑑𝑢𝑐𝑎𝑡𝑖𝑜 𝑜𝑓 𝐻𝐻𝐻: 𝑅 𝑙𝑖𝑔𝑖𝑜𝑢𝑠 𝑑𝑢𝑐𝑎𝑡𝑖𝑜 (+ 𝑟𝑟𝑜𝑟)
−0.89 𝐸𝑐𝑜 𝑜𝑚𝑖𝑐 𝑎𝑐𝑡𝑖𝑣𝑖𝑡𝑦 𝑜𝑓 𝐻𝐻𝐻: 𝑜 𝑎𝑐𝑡𝑖𝑣𝑖𝑡𝑦−0.002 Percentage of HH members older
than 60−0.89 Poultry+0.39 𝑊 𝑎𝑙𝑡ℎ 𝑠𝑐𝑜𝑟
Unregistered in Leda 3.94 −0.28 𝐸𝑐𝑜 𝑜𝑚𝑖𝑐 𝑎𝑐𝑡𝑖𝑣𝑖𝑡𝑦 𝑜𝑓 𝐻𝐻𝐻: 𝑜
𝑎𝑐𝑡𝑖𝑣𝑖𝑡𝑦+0.03 Percentage of HH members older than 60+0.15 Poultry+0.17 𝑊 𝑎𝑙𝑡ℎ 𝑠𝑐𝑜𝑟
Unregistered in Nayapara camp
3.93 −0.83 𝐸𝑐𝑜 𝑜𝑚𝑖𝑐 𝑎𝑐𝑡𝑖𝑣𝑖𝑡𝑦 𝑜𝑓 𝐻𝐻𝐻: 𝑜 𝑎𝑐𝑡𝑖𝑣𝑖𝑡𝑦 −0.005 Percentage of HH members older than
60−0.22 Poultry+0.15 𝑊 𝑎𝑙𝑡ℎ 𝑠𝑐𝑜𝑟
Registered in Nayapara camp
3.53
0.03 𝐸𝑐𝑜 𝑜𝑚𝑖𝑐 𝑎𝑐𝑡𝑖𝑣𝑖𝑡𝑦 𝑜𝑓 𝐻𝐻𝐻: 𝑜 𝑎𝑐𝑡𝑖𝑣𝑖𝑡𝑦−0.002 Percentage of HH members older
than 60 +0.14 Poultry+0.36 𝑊 𝑎𝑙𝑡ℎ 𝑠𝑐𝑜𝑟
Registered in Kutupalong camp
4.34 0.15 𝐸𝑐𝑜 𝑜𝑚𝑖𝑐 𝑎𝑐𝑡𝑖𝑣𝑖𝑡𝑦 𝑜𝑓 𝐻𝐻𝐻: 𝑜 𝑎𝑐𝑡𝑖𝑣𝑖𝑡𝑦
−0.006 Percentage of HH members older than 60−0.01 Poultry+0.20 𝑊 𝑎𝑙𝑡ℎ 𝑠𝑐𝑜𝑟

76
Food security: Coping Strategies Index (CSI) M3. Multiple linear regression model without joint effects
Default situation
Variables/categories Estimate Std. Error t value Pr(>|t|)
Residual standard error: 11.94 on 868
degrees of freedom
Multiple R-squared: 0.8769, Adjusted
R-squared: 0.8749
F-statistic: 441.5 on 14 and 868 DF, p-
value: < 2.2e-16
Signification codes:
0 ‘***’ 0.001 ‘**’ 0.01 ‘*’ 0.05 ‘.’ 0.1 ‘ ’ 1
Refugee status: Unregistered 32.177044 2.538304 12.677 < 2e-16 ***
Refugee status: Registered 27.508803 2.668254 10.31 < 2e-16 ***
Wealth score -1.757016 0.315388 -5.571 3.38E-
08 ***
Household size 1.003795 0.189071 5.309 1.40E-
07 ***
Earnings per HH member -0.006772 0.001615 -4.193 3.04E-
05 ***
Economic activity group:4 4.456732 1.305047 3.415 0.00067 ***
Marital status of HHH: Widow/widower 4.039953 1.310843 3.082 0.00212 **
Economic activity group:3 3.143366 1.313776 2.393 0.01694 *
Marital status of HHH: Separated 2.943581 1.677974 1.754 0.07974 .
Level of education of HHH: Primary education -2.981094 1.9863 -1.501 0.13376
Percentage of male members of ages 18-59 in HH -0.048703 0.035662 -1.366 0.17239
Economic activity group:2 0.99471 1.173496 0.848 0.39687 Level of education of HHH: Never enrolled/didnït pass any class 0.845806 1.707188 0.495 0.62042
Level of education of HHH: Religious education 0.822116 1.923268 0.427 0.66915

77
Comments
In brief, CSI can be explained by the registration status of its members (i.e. the type of aid
received), the wealth score, the household size, the household earnings, the economic activity
group to which the household belongs and the marital status and education level of the household
head. The percentage of male members between the ages of 18 and 59 is also explanatory of the
model.
The previous table shows variable coefficients sorted by relevance in the model equation. The
reader must take into account that the default situation is a group 1 household (in terms of
economic activities) whose head has secondary education. Variable coefficients inform us about
how each variable influences households’ CSI in relation to the default situation.
The following conclusions can be drawn from the model:
- Registration status leads to 5 points difference in the CSI value. Indeed,
unregistered Rohingyas’ CSI is 5 points higher than that of registered ones,
given equal socioeconomic and demographic conditions11.
- The higher the wealth score, the lower the CSI. This also happens for the earnings per member and
for the percentage of male members between the ages of 18 to 59 in the household (although the
latter is not as relevant).
- Some particular household characteristics can increase the CSI in relation to the default situation
(be aware that higher CSI values translate into more severe coping strategies adopted by the
household). These are:
o The household head having religious education or no education (+0.82 and 0.84 points
respectively, while HH head having primary education reduces the CSI values).
o Also in terms of economic activities, CSI increases for households in groups 2, 3 or 4 in terms
of economic activities (+0.99, +3.14 and +4.46 respectively).
11 The model with joint effects also concludes a 5 point CSI difference depending on the registration status.

78
Food security: Coping Strategies Index (CSI) M4. Multiple linear regression model with joint effects
Variables/categories Estimate Std. Error t value Pr(>|t|)
Residual standard error: 11.67 on 864
degrees of freedom
Multiple R-squared: 0.8828,
Adjusted R-squared: 0.8804
F-statistic: 361.7 on 18 and 864 DF, p-
value: < 2.2e-16
Signification codes:
0 ‘***’ 0.001 ‘**’ 0.01 ‘*’ 0.05 ‘.’ 0.1 ‘ ’ 1
Refugee status: Unregistered 39.780 2.429 16.379 < 2e-16 ***
Refugee status: Registered 34.651 2.625 13.199 < 2e-16 ***
Earnings per HH member -0.009 0.002 -5.642 2.27E-08 ***
Beggar 9.446 1.802 5.243 1.99E-07 ***
Wealth score -1.511 0.312 -4.845 1.50E-06 ***
Daylabour -5.637 1.248 -4.517 7.15E-06 ***
Poultry 3.904 1.324 2.949 0.00327 **
Fisher 7.268 2.492 2.917 0.00363 **
Sewing -8.256 2.877 -2.870 0.00421 **
Refugee status: Registered*Sewing 8.373 3.384 2.474 0.01355 *
Refugee status: Registered*Fisher -7.909 3.865 -2.046 0.04105 *
Micro enterprise outside house -3.301 1.747 -1.889 0.05924 .
Level of education of HHH: Primary education -2.524 1.945 -1.298 0.19462
Economic activity group:2 -1.611 1.645 -0.979 0.32778 Level of education of HHH: Never enrolled/didn't pass any class 1.470 1.660 0.886 0.37608
Economic activity group:4 1.429 1.754 0.815 0.41541
Level of education of HHH: Religious education 1.206 1.845 0.654 0.51345
Economic activity group:3 -0.113 1.712 -0.066 0.94732
The following aspects should be underlined about this model in relation to the model without joint effects:
- The estimation of 5 points difference in CSI values depending on refugee status (all other socioeconomic conditions equal) continues to be relevant.
- The coefficient sign of the economic activity groups are quite different, due to the inclusion of particular household economic activities in the formula.
It is, however, relevant to mention the joint effects of the activities Fishing and Sewing and the registration status:

79
o Fishing being an economic activity of the household usually implies a 7.27 point increase in the CSI value. However, for registered refugees, this
is not true. In those cases fishing implies a -0.64 decrease in the CSI value (negligible): Fishing implies the adoption of more severe
adaptation strategies for all refugee households except the registered ones.
o Sewing being an economic activity of the household usually implies a -8.26 point decrease in the CSI value. However, for registered refugees,
this is not true. In those cases sewing implies a 0.11 increase in the CSI value (negligible): Sewing implies the adoption of less severe
adaptation strategies for all refugee households except the registered ones, for whom sewing doesn’t keep them from
having to assume strategies that can have severe consequences in the future.

80
Protection: Protection indicator (based on module J of the household questionnaire) M5. Multiple linear regression model without joint effects
Variables/categories Estimate Std. Error t value Pr(>|t|)
Residual standard error: 0.8765 on 867 degrees of freedom
Multiple R-squared: 0.5065, Adjusted R-squared: 0.4979
F-statistic: 59.32 on 15 and 867 DF, p-value: < 2.2e-16
Signification codes:
0 ‘***’ 0.001 ‘**’ 0.01 ‘*’ 0.05 ‘.’ 0.1 ‘ ’ 1
Location: Kutupalong 2.2932 0.2694 8.5140 < 2e-16 ***
Wealth score 0.0030 0.0005 6.1860 9.50E-10 ***
Location: Nayapara 0.9529 0.2563 3.7170 0.000214 ***
Earnings per member 0.0022 0.0007 3.2640 0.00114 ** Marital status of HHH: Widow/widower -0.8404 0.2689 -3.1250 0.001838 **
Maid 0.8849 0.2909 3.0420 0.002424 **
Beggar 0.7078 0.2993 2.3650 0.018234 *
Micro enterprise in own house -0.6538 0.2804 -2.3320 0.019936 *
Sex of HHH: Male -0.5291 0.2274 -2.3270 0.020211 *
Micro enterprise outside house 0.4179 0.1906 2.1930 0.028598 *
Marital status of HHH: Separated -0.5502 0.3010 -1.8280 0.067899 .
Rickshaw 0.3985 0.2404 1.6570 0.09781 .
Comments
The perception of protection of refugees depends on the area of location of the household (Kutupalong or Nayapara), the wealth score, earnings per member,
the marital status and sex of the head of household and the participation in certain economic activities.
The table above shows variable coefficients sorted by relevance in the model equation. Variable coefficients (column 2 “Estimate”, on table above)
inform us about how each variable influences households’ HDDS in relation to the default situation, which is a refugee household in which the
household head is a married woman living with the spouse (which is very rare).
The main conclusion that can be drawn from this model is the lack of relevance of the type of aid received or the registration status to
determine the perception of protection that refugee households have.

81
Mobility: Mobility indicator (based on module B3 of the household questionnaire) M6. Multiple
linear regression model without joint effects
Variables/categories Estimate Std. Error t value Pr(>|t|)
Refugee status: Unregistered 2.140 0.196 10949.000 < 2e-16 ***
Refugee status: Registered 1.730 0.205 8439.000 < 2e-16 ***
Earnings per member 0.001 0.000 4474.000 8.71E-06 ***
Wealth score 0.105 0.024 4385.000 1.30E-05 ***
Maid 0.459 0.144 3179.000 0.00153 **
Marital status of HHH: Separated -0.479 0.156 -3077.000 0.00216 **
Marital status of HHH: Widow/widower -0.429 0.139 -3077.000 0.00216 **
Day labour 0.279 0.101 2763.000 0.00585 **
Sex of HHH: Male 0.258 0.120 2159.000 0.03112 *
Sewing -0.268 0.126 -2120.000 0.03433 *
Percentage of adult male in household members 0.006 0.003 2105.000 0.03557 * Level of education of HHH: Never enrolled/didnït pass any class -0.140 0.137 -1018.000 0.30878
Level of education of HHH: Primary education 0.095 0.156 0.609 0.54248
Level of education of HHH: Religious education 0.046 0.160 0.289 0.77296 Residual standard error: 0.9566 on 865 degrees of freedom Multiple R-squared: 0.8918, Adjusted R-squared: 0.8896 F-statistic: 419.2 on 17 and 865 DF, p-value: < 2.2e-16 Signification codes:
0 ‘***’ 0.001 ‘**’ 0.01 ‘*’ 0.05 ‘.’ 0.1 ‘ ’ 1
Comments
In brief, the Mobility Indicator can be explained by the registration status of its members, the wealth
score, the household earnings, the sex, marital status and education level of the household head and
certain economic activities.
The previous table shows variable coefficients sorted by relevance in the model equation. The reader
must take into account that the default situation is a household whose head is a married woman who
has secondary-level education. Variable coefficients inform us about how each variable influences
households’ Mobility Indicator in relation to the default situation.
The following conclusions can be drawn from the model:
- Registration status leads to almost 0.5 points difference in the Mobility Indicator
value. Indeed, unregistered Rohingyas’ Mobility Indicator is 0.5 points higher

82
than that of registered ones, given equal socioeconomic and demographic
conditions12.
- The higher the wealth score and the earnings per member, the higher the value of the Mobility
Indicator.
- Some particular household characteristics can increase the Mobility Indicator value in relation to the
default situation. These are:
o The household head attended primary or religious education.
o The household head being a male.
o Day labour or being a maid are among households’ economic activities.
- However, some particular household characteristics can decrease the Mobility Indicator value in
relation to the default situation. These are:
o The household head being separated or widow.
o The household head didn’t receive any education.
o Sewing is one of the household’s activities.
12 The model with joint effects also concludes a 5 point CSI difference depending on the registration status.

83
Verification of Hyphtheses
The multiple linear regression model is based on the following hypotheses of the residuals:
Hyp1. Nullity of residuals’ mean
Tested through the “One Sample t-test”, for which the null hypothesis is “mean is equal to zero”
Hyp 2. Homoscedasticity of residuals
Tested through the “Levene's Test for Homogeneity of Variance”, for which the null hypothesis is “variances are
equal”
Hyp 3. Independence of residuals
Tested through the “DurbinWatsonTest”, for which the null hypothesis is “covariance is equal to zero”
The following “hard” hypothesis is not a requisite for the validity of the model, but enhances it:
Hyp 4. Normality of residuals
Tested through the “Shapiro-Wilk normality test”, for which the null hypothesis is “distribution is normal”.
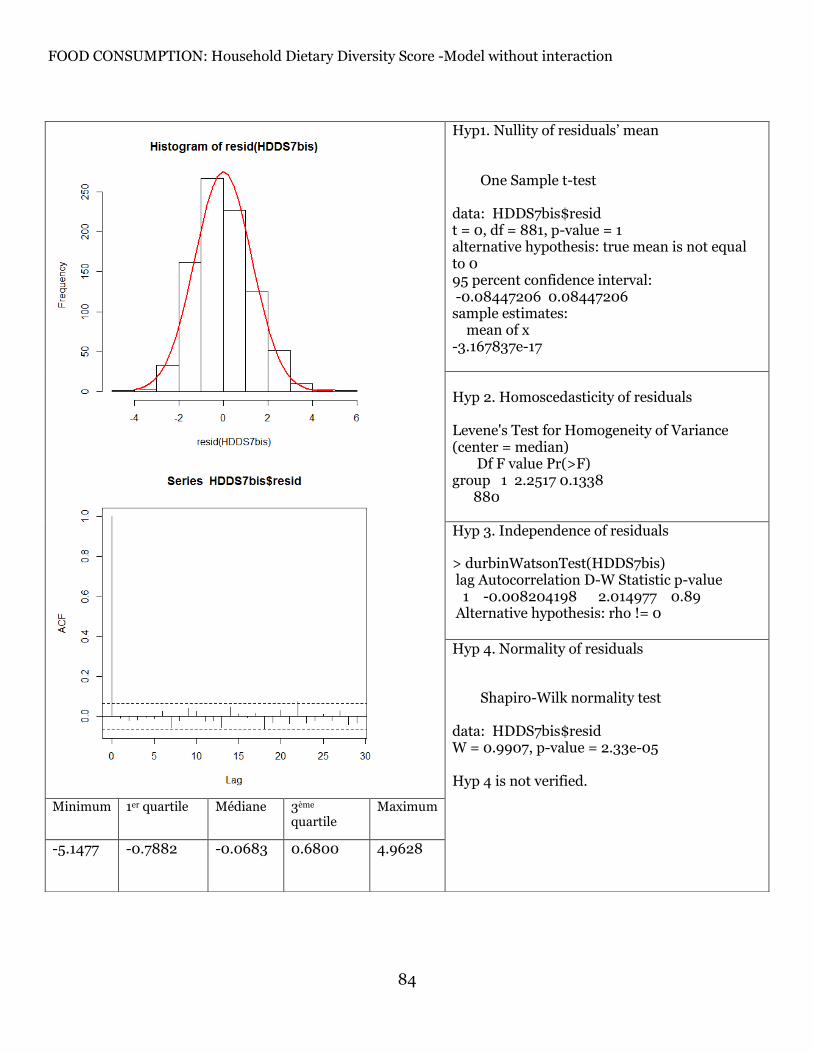
84
FOOD CONSUMPTION: Household Dietary Diversity Score -Model without interaction
Hyp1. Nullity of residuals’ mean One Sample t-test data: HDDS7bis$resid t = 0, df = 881, p-value = 1 alternative hypothesis: true mean is not equal to 0 95 percent confidence interval: -0.08447206 0.08447206 sample estimates: mean of x -3.167837e-17 Hyp 2. Homoscedasticity of residuals Levene's Test for Homogeneity of Variance (center = median) Df F value Pr(>F) group 1 2.2517 0.1338 880 Hyp 3. Independence of residuals
> durbinWatsonTest(HDDS7bis) lag Autocorrelation D-W Statistic p-value 1 -0.008204198 2.014977 0.89 Alternative hypothesis: rho != 0
Hyp 4. Normality of residuals
Shapiro-Wilk normality test data: HDDS7bis$resid W = 0.9907, p-value = 2.33e-05 Hyp 4 is not verified.
Minimum 1er quartile Médiane 3ème quartile
Maximum
-5.1477
-0.7882 -0.0683 0.6800 4.9628

85
Figure 4. FOOD CONSUMPTION: Household Dietary Diversity Score -Model without interaction. Residuals

86
FOOD CONSUMPTION: Household Dietary Diversity Score -Model with interaction
Hyp1. Nullity of residuals’ mean One Sample t-test data: HDDS9bis$resid t = 0, df = 881, p-value = 1 alternative hypothesis: true mean is not equal to 0 95 percent confidence interval: -0.08242623 0.08242623 sample estimates: mean of x 1.288996e-17
Hyp 2. Homoscedasticity of residuals Levene's Test for Homogeneity of Variance (center = median) Df F value Pr(>F) group 1 2.2948 0.1302 880 Hyp 3. Independence of residuals
lag Autocorrelation D-W Statistic p-value 1 -0.009555906 2.017979 0.754 Alternative hypothesis: rho != 0
Hyp 4. Normality of residuals
Shapiro-Wilk normality test data: HDDS9bis$resid W = 0.9916, p-value = 6.191e-05 Hyp 4 is not verified.
Minimum 1er quartile Médiane 3ème quartile
Maximum
-4.3800 -0.7624 -0.0818 0.6563 4.6300
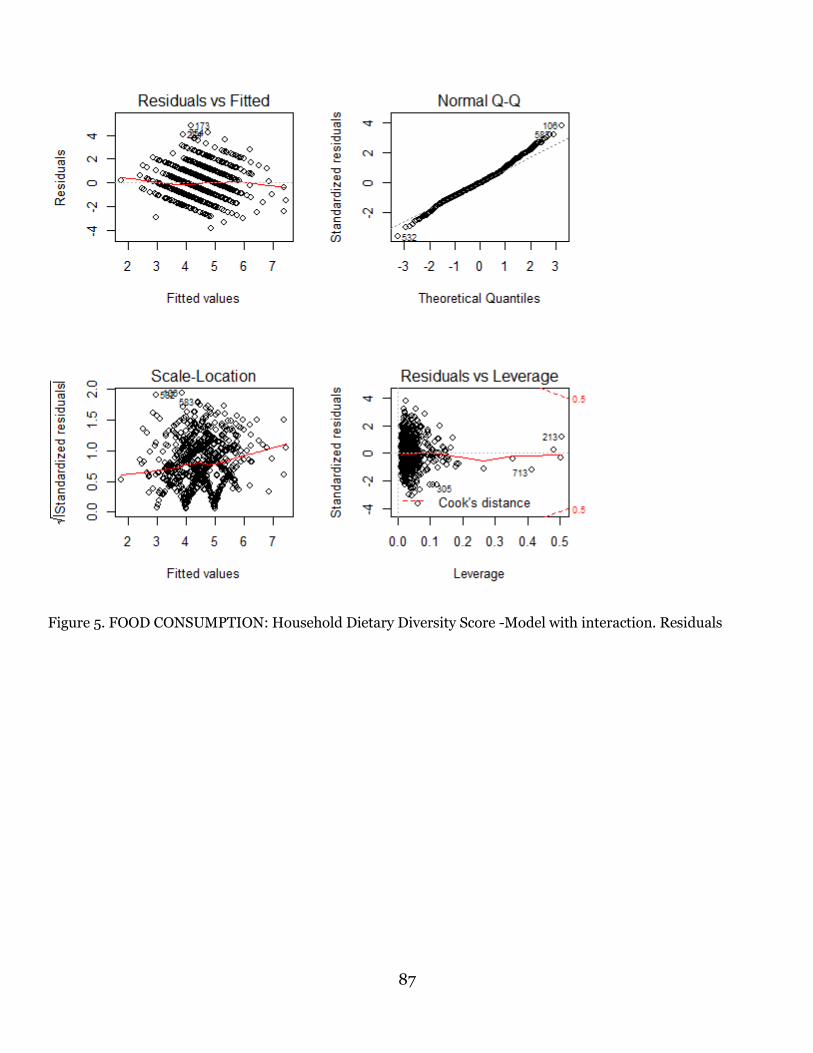
87
Figure 5. FOOD CONSUMPTION: Household Dietary Diversity Score -Model with interaction. Residuals
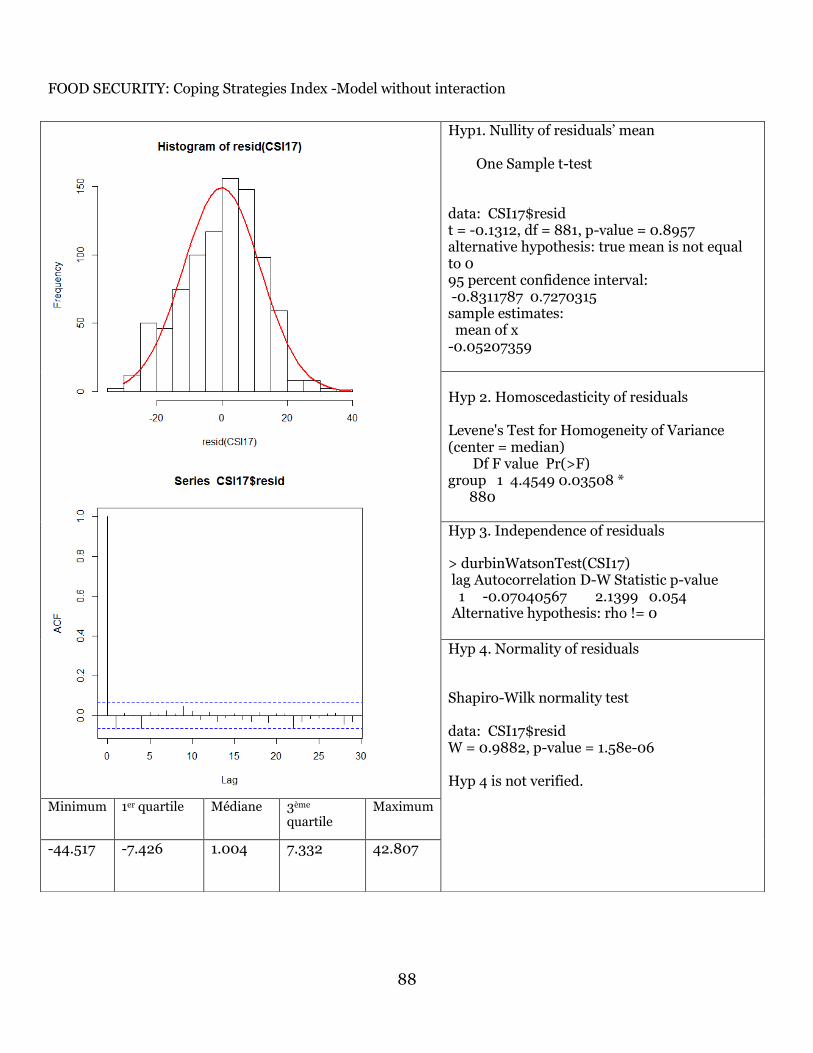
88
FOOD SECURITY: Coping Strategies Index -Model without interaction
Hyp1. Nullity of residuals’ mean One Sample t-test data: CSI17$resid t = -0.1312, df = 881, p-value = 0.8957 alternative hypothesis: true mean is not equal to 0 95 percent confidence interval: -0.8311787 0.7270315 sample estimates: mean of x -0.05207359 Hyp 2. Homoscedasticity of residuals Levene's Test for Homogeneity of Variance (center = median) Df F value Pr(>F) group 1 4.4549 0.03508 * 880 Hyp 3. Independence of residuals
> durbinWatsonTest(CSI17) lag Autocorrelation D-W Statistic p-value 1 -0.07040567 2.1399 0.054 Alternative hypothesis: rho != 0
Hyp 4. Normality of residuals
Shapiro-Wilk normality test data: CSI17$resid W = 0.9882, p-value = 1.58e-06 Hyp 4 is not verified.
Minimum 1er quartile Médiane 3ème quartile
Maximum
-44.517
-7.426 1.004 7.332 42.807
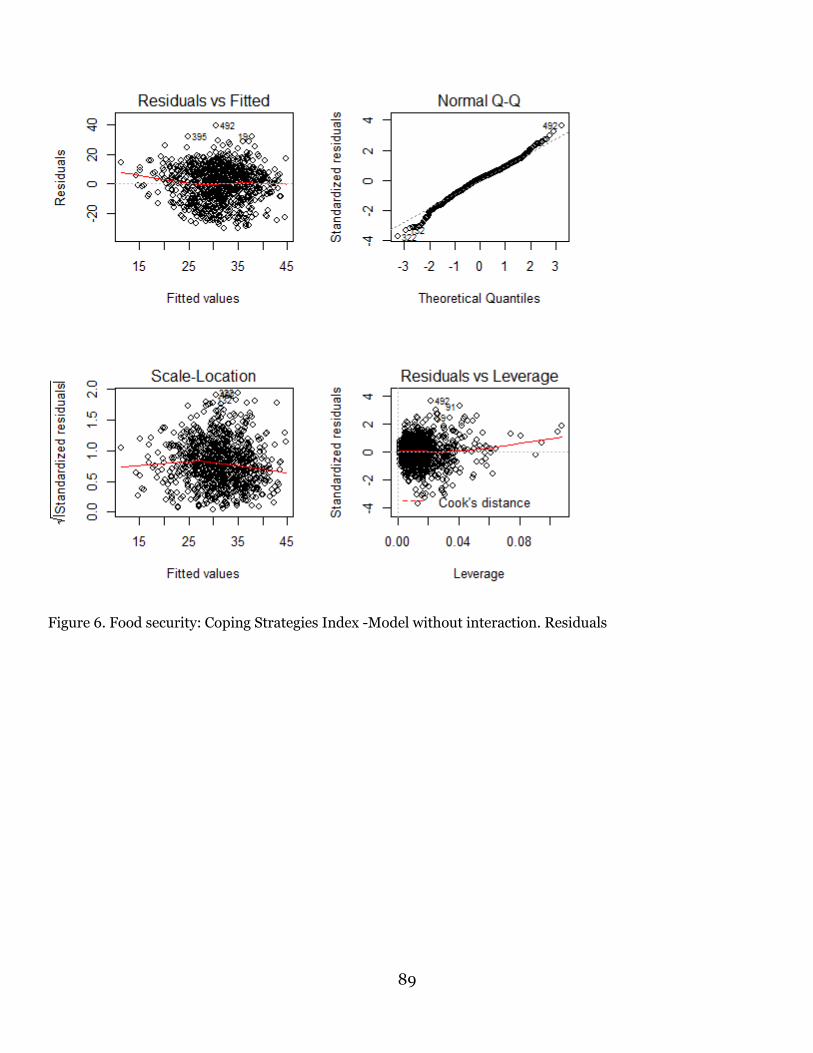
89
Figure 6. Food security: Coping Strategies Index -Model without interaction. Residuals
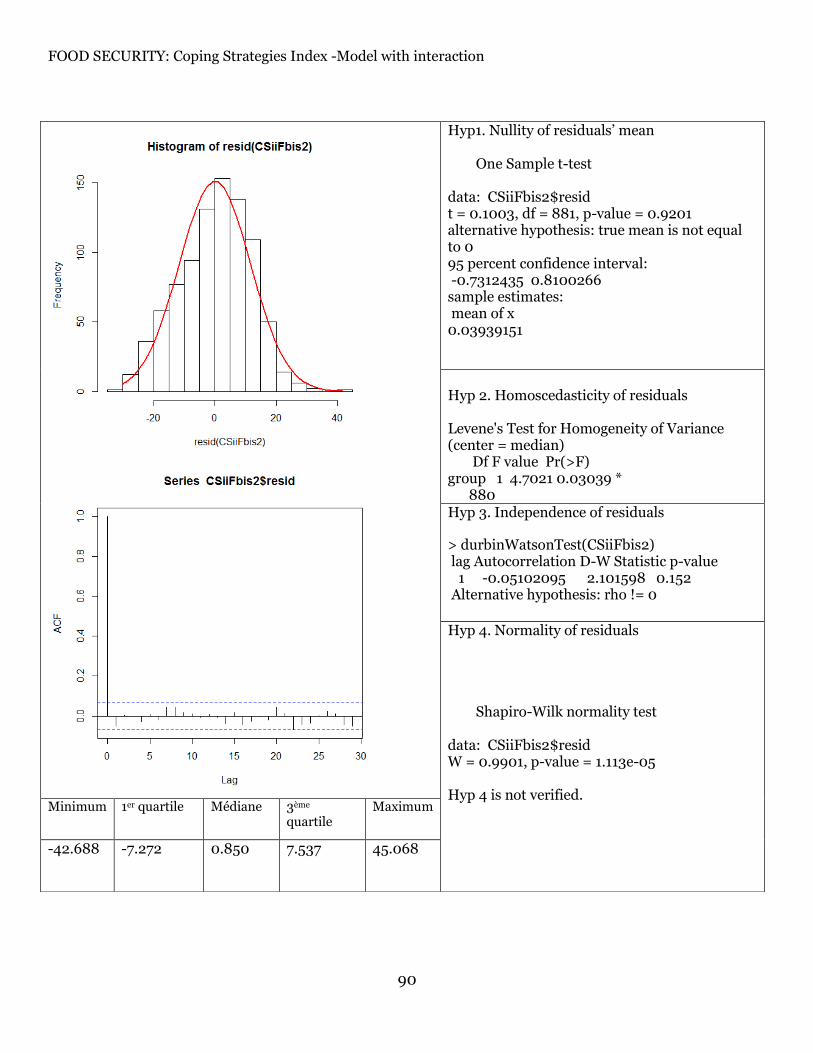
90
FOOD SECURITY: Coping Strategies Index -Model with interaction
Hyp1. Nullity of residuals’ mean One Sample t-test data: CSiiFbis2$resid t = 0.1003, df = 881, p-value = 0.9201 alternative hypothesis: true mean is not equal to 0 95 percent confidence interval: -0.7312435 0.8100266 sample estimates: mean of x 0.03939151
Hyp 2. Homoscedasticity of residuals Levene's Test for Homogeneity of Variance (center = median) Df F value Pr(>F) group 1 4.7021 0.03039 * 880 Hyp 3. Independence of residuals
> durbinWatsonTest(CSiiFbis2) lag Autocorrelation D-W Statistic p-value 1 -0.05102095 2.101598 0.152 Alternative hypothesis: rho != 0
Hyp 4. Normality of residuals
Shapiro-Wilk normality test data: CSiiFbis2$resid W = 0.9901, p-value = 1.113e-05 Hyp 4 is not verified.
Minimum 1er quartile Médiane 3ème quartile
Maximum
-42.688 -7.272 0.850 7.537 45.068

91
Figure 7. Food security: Coping Strategies Index -Model with interaction. Residuals

92
PROTECTION : Indicator based on module J -Model without interaction
Hyp1. Nullity of residuals’ mean One Sample t-test data: Prot7$resid t = 0.4766, df = 881, p-value = 0.6338 alternative hypothesis: true mean is not equal to 0 95 percent confidence interval: -0.0971308 0.1594286 sample estimates: mean of x 0.0311489 Hyp 2. Homoscedasticity of residuals Levene's Test for Homogeneity of Variance (center = median) Df F value Pr(>F) group 1 0.0122 0.912 880 Hyp 3. Independence of residuals
> durbinWatsonTest(Prot7) lag Autocorrelation D-W Statistic p-value 1 -0.06727463 2.133891 0.068 Alternative hypothesis: rho != 0
Hyp 4. Normality of residuals
Shapiro-Wilk normality test data: Prot7$resid W = 0.9426, p-value < 2.2e-16 Hyp 4 is not verified.
Minimum 1er quartile Médiane 3ème quartile
Maximum
-7.3887 -2.3476 -0.6409 1.7976 10.6288

93
Figure 8.Protection. Indicator based on module J of household questionnaire -Model without interaction. Residuals

94
MOBILITY : Indicator based on module B3 -Model without interaction
Hyp1. Nullity of residuals’ mean One Sample t-test data: MOB9$resid t = 0.0182, df = 881, p-value = 0.9855 alternative hypothesis: true mean is not equal to 0 95 percent confidence interval: -0.06399185 0.06518654 sample estimates: mean of x 0.000597347
Hyp 2. Homoscedasticity of residuals Levene's Test for Homogeneity of Variance (center = median) Df F value Pr(>F) group 1 2.4666 0.1166 880 Hyp 3. Independence of residuals
lag Autocorrelation D-W Statistic p-value 1 0.01259334 1.97478 0.696 Alternative hypothesis: rho != 0
Hyp 4. Normality of residuals
Shapiro-Wilk normality test Shapiro-Wilk normality test data: MOB9$resid W = 0.9852, p-value = 9.213e-08 Hyp 4 is therefore not verified.
Minimum 1er quartile Médiane 3ème quartile
Maximum
-3.5153 -0.5294 0.0305 0.5879 3.1434

95
Figure 9. Mobility. Indicator based on module B3 of household questionnaire -Model without interaction. Residuals

96
Quantitative Approaches to the Estimation of Impact of Food Assistance
The impact of food assistance in food consumption, food security, mobility and protection is quantitatively
approached in the present analysis in three different ways:
1. Comparing the registered and unregistered households that live inside the official camp of Nayapara for
which representative samples are available, so as to implement tests of differences in means. Registered
and unregistered households in Nayapara receive the same non-food aid and are provided with shelter
and the same WASH, education, health and leisure facilities, however the registered receive food aid
and the unregistered do not.
2. Comparing the registered and unregistered Rohingyas within the household groups based on economic
activities.
a. This approach assumes that food aid impact can be different on Rohingya households
depending on the economic activities they undertake (i.e. the existence of differential impact is
taken into consideration).
b. This approach assumes that if registered households didn’t receive any aid, they would behave
as unregistered households that undertake similar economic activities (i.e. unregistered
households within the same group).
3. Comparing regression coefficients
Comparing regression coefficients of main regressor variables (see TABLE 40) allows for an
estimation of the impact of the registration status or the camp where the household is located, given
similar socioeconomic conditions for households.
Through these three approaches, estimations of the impact of food assistance on the different areas of interest
in the evaluation are presented in this chapter. They must be taken with caution, for their coherence with the
qualitative research conducted needs to be verified.

97
Impact of Food Consumption
Comparing the registered and unregistered Rohingyas in the Nayapara camp:
Table 61. Food consumption and expenditure indicator statistics for Rohingyas living in the official camp of Nayapara, by registration status
VARIABLE Registration status
N Mean Std.
Deviation
Std. Error Mean
Household Dietary Diversity Score
Registered 175 4.91 1.57 0.12
Unregistered 132 4.02 1.30 0.11
Weekly household expenditure on food per member
Registered 175 92.90 69.87 5.28
Unregistered 132 142.86 80.06 6.97
The implemented t-tests have shown significant differences for food consumption and expenditure among the
Rohingyas living in the official camp of Nayapara, depending on their registration status. Food consumption, as
measured by the Household Dietary Diversity Score (HDDS), is better for the registered and expenditure is
higher for the unregistered.
Registered Rohingyas’ HDDS value is almost one point higher than that of the unregistered. That means that,
on average, registered s consume one food group more than the unregistered, on a daily basis.
Unregistered households spend 50 extra BTK per week per household member, on average, compared to
registered ones.
Comparing the registered and unregistered Rohingyas within the household groups based on their economic
activities:
As the graph below shows, for all groups HDDS is lower for the unregistered Rohingyas. The greatest difference
is found within group 4, for which HDDS drops from 5.1 to 3.9 for Rohingyas who don’t have an MRC card.
This could be interpreted as follows: If food assistance was taken out, all registered refugees would have poorer
nutrition levels, regardless of their economic activities, but special attention should be given to those in group
413, for their HDDS would be more significantly reduced. The next priority group would be group 214 (for its
HDDS would drop from 4.9 for registered refugees to 4.0 for the unregistered).
13 Group 4 households are those in which at least one member works and the following activities are practiced: Fishing, industrial labour, maids, servants, micro enterprise inside the house, religious persons, teachers and servers in restaurants. This group contains an estimate of 682 registered households. 14 Group 2 households are involved in farming, agro based day labour and NGO workers. This group contains an estimate of 2,200 registered households.

98
Comparing regression coefficients:
According to the regression models, HDDS can be explained by the type of aid received, the wealth score, the
economic activities of HH, the activity group, the number of economic activities, the marital status and the
education level.
Regression model M1 indicates that given similar socioeconomic conditions, it is not just the registration status
that is relevant, but the type of aid received, for significant coefficients for every different type of household
were found, taking the values presented in the table below.
Type of household Regression coefficient
of the HDDS score
Unregistered in makeshift camp 3.475
Unregistered in Leda 3.788
Unregistered in Nayapara camp 3.365
Registered in Nayapara camp 4.030
Registered in Kutupalong camp 4.236
Other regression models that include joint effects of variables indicate that the lack of economic activity of the
household does not imply a decrease in the HDDS for the registered refugees, while it does for the unregistered
Rohingyas.
Impact on Food Security
Comparing the registered and unregistered Rohingyas in the Nayapara camp:
As shown in table below, the difference in means of the CSI depending on registration status is significant15.
The unregistered Rohingyas present an almost 5 points higher CSI, this could be interpreted as one of three
possibilities:
- the unregistered assume two mid-range severe strategies more than the registered sometimes (in the
last 30 days to be able to eat enough).
- the unregistered assume a mild strategy more than the registered often (in the last 30 days to be able to
eat enough).
15 The upper bound on mean for the registered is lower than the lower bound on mean for the registered.

99
- the unregistered assume a severe strategy more than the registered, but rarely (in the last 30 days to be
able to eat enough).
Table 62. CSI distribution statistics for Rohingyas living in the official camp of Nayapara, by registration status
Statistic Registere
d Unregistere
d
No. of observations 175 132
Minimum 0.00 6.00
Maximum 70.00 66.00
1st Quartile 20.00 24.00
Median 27.00 34.00
3rd Quartile 35.00 42.00
Mean 28.08 32.86
Standard deviation (n-1) 12.55 12.12
Lower bound on mean (95%) 26.21 30.77
Upper bound on mean (95%) 29.95 34.94
Comparing the registered and unregistered Rohingyas within the household groups based on their economic
activities:
As can be observed in the graph below, for all groups CSI is higher for the unregistered Rohingyas. The greatest
difference is found within group 4, for which CSI increases from 27.7 to 37.2 for Rohingyas who don’t have an
MRC card.
This could be interpreted as follows: If food assistance was removed, all registered refugees would adopt more
severe strategies, but special attention should be given to those in group 416, for their CSI would be dramatically
increased. The next priority groups would be groups 1 and 3, for which the CSI increases in 8 points for
unregistered Rohingyas.
16 Group 4 households are those in which at least one member works and the following activities are practiced: Fishing, industrial labour, maids, servants, micro enterprise inside the house, religious persons, teachers and servers in restaurants. This group contains an estimate of 682 registered households.
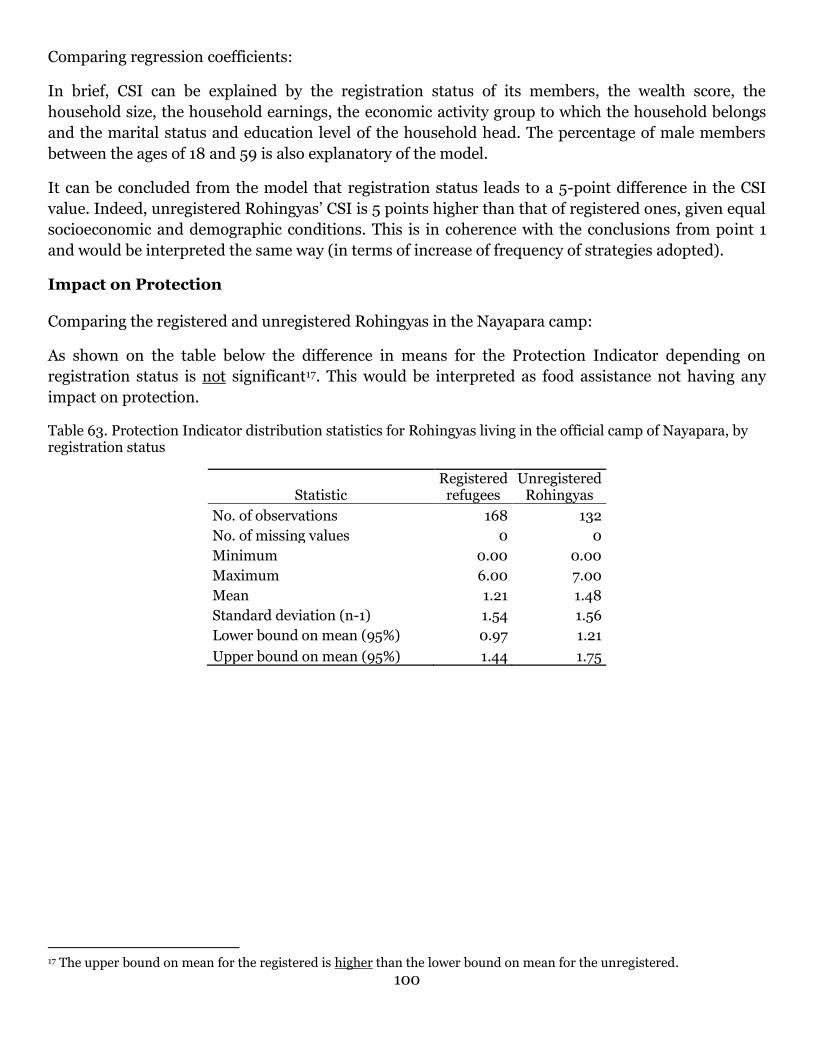
100
Comparing regression coefficients:
In brief, CSI can be explained by the registration status of its members, the wealth score, the
household size, the household earnings, the economic activity group to which the household belongs
and the marital status and education level of the household head. The percentage of male members
between the ages of 18 and 59 is also explanatory of the model.
It can be concluded from the model that registration status leads to a 5-point difference in the CSI
value. Indeed, unregistered Rohingyas’ CSI is 5 points higher than that of registered ones, given equal
socioeconomic and demographic conditions. This is in coherence with the conclusions from point 1
and would be interpreted the same way (in terms of increase of frequency of strategies adopted).
Impact on Protection
Comparing the registered and unregistered Rohingyas in the Nayapara camp:
As shown on the table below the difference in means for the Protection Indicator depending on
registration status is not significant17. This would be interpreted as food assistance not having any
impact on protection.
Table 63. Protection Indicator distribution statistics for Rohingyas living in the official camp of Nayapara, by registration status
Statistic Registered
refugees Unregistered
Rohingyas
No. of observations 168 132
No. of missing values 0 0
Minimum 0.00 0.00
Maximum 6.00 7.00
Mean 1.21 1.48
Standard deviation (n-1) 1.54 1.56
Lower bound on mean (95%) 0.97 1.21
Upper bound on mean (95%) 1.44 1.75
17 The upper bound on mean for the registered is higher than the lower bound on mean for the unregistered.

101
Comparing the registered and unregistered Rohingyas within the household groups based on their
economic activities:
Graph shows similar tendencies for registered refugees and unregistered Rohingyas. For groups 1, 3
and 4, unregistered Rohingya households present higher values for the Protection Indicator. This is
not true for group 2, under which the most important part of registered refugees were classified.
Comparing regression coefficients:
The variable on type of household or registration status did not emerge as a relevant explanatory
variable of the Protection Indicator. The area of location of the household (Kutupalong versus
Nayapara) resulted as more relevant than the previously mentioned, with Kutupalong being a more
protective environment.
Impact on Mobility
Comparing the registered and unregistered Rohingyas that live inside the official camp of Nayapara:
As shown on table below, the difference in means for the Mobility Indicator depending on registration
status is significant18: Unregistered Rohingyas have higher mobility levels than the registered (2.59
against 2.19 in the 0 to 5 range of the Mobility Indicator).
Table 64. Mobility Indicator distribution statistics for Rohingyas living in the official camp of Nayapara, by registration status
Statistic Registered Unregistered
No. of observations 168 132
No. of missing values 0 0
Minimum 0.00 0.00
Maximum 5.00 5.00
Mean 2.19 2.59
Standard deviation (n-1) 1.27 1.12
Lower bound on mean (95%)
2.00 2.40
Upper bound on mean (95%)
2.38 2.78
18 The upper bound on mean for the registered is lower than the lower bound on mean for the unregistered.

102
Comparing the registered and unregistered Rohingyas within the household groups based on
economic activities:
As shown in the graph below, mobility is more frequent among the unregistered than the registered
for all groups.
40 to 50% of registered Rohingya in groups 1 and 4 move as far as “To Cox’s Bazar”. If we assume that
once food assistance was taken out they would behave as the unregistered of their groups, then we
could expect that an important part of them would go further than Cox’s Bazar, into “other parts of
Bangladesh” (as we can see for the unregistered in groups 1 and 4, around 35% go as far as “Cox’s
Bazar” and another 35% of them go to “other parts of Bangladesh”).
If Group 2 registered Rohingyas became unregistered then about 30% of them who go nowhere or to
the nearby towns, would have to go to Cox’s Bazar and Teknaf (as we can see in the graph below, for
group 2, the Mobility Indicator distribution for the unregistered is more concentrated around the
average value 3, while more dispersed for the registered).
If aid was taken out, group 3 registered Rohingyas would more often travel to Cox’s Bazar, Teknaf and
even other parts of Bangladesh.
Comparing regression coefficients:
In brief, the Mobility Indicator can be explained by the registration status of its members, the wealth
score, the household earnings, the sex, marital status and education level of the household head and
certain economic activities.
Registration status leads to almost 0.5 points difference in the Mobility Indicator value.
Indeed, unregistered Rohingyas’ Mobility Indicator is 0.5 points higher than that of
registered ones, given equal socioeconomic and demographic conditions19.
19 The model with joint effects also concludes a 5 point CSI difference depending on the registration status.

103
Office of Evaluation
www.wfp.org/evaluation
Ro
me
, De
ce
mb
er
20
12
, OE
/20
12
/013