Embed Size (px)
Citation preview
1
The Contribution of Major Export Commodities of Ethiopia to the
Instability of the Country’s Export Earnings
Fitsum Zewdu Mulugeta1
Abstract
Ethiopian export, like many other developing countries, is limited to few primary products, which
are mainly agricultural. Studies show that such commodity concentration could result in
instability of export earnings, which in turn will affect capital formation and growth. This is due
to high dependence of developing countries on earnings from the export sector to satisfy their
import requirements. It is argued that instability of such proceeds will significantly influence
output by constraining input and production planning. The present study analyzes Ethiopia’s
export earnings instability by employing country-specific models which will take advantage of the
sufficiently large sample period, from 1962 to 2008. The study identifies the contributions of
major agricultural export commodities, namely coffee, hides and skins, oilseeds, pulses and fruits
and vegetables. Attempts have also been made to make comparisons between the sub-periods of
the Imperial, Derg and Post-Derg periods, since these sub-periods experienced distinct trade and
foreign policies. The study finds that the post-Derg period is characterized by higher level of
instability and diversification of exports. This calls for the reconsideration of the direction of the
diversification policy towards commodities that are negatively correlated with the traditional
export commodities of the country.
1 Junior Research Fellow, Ethiopian Economics Association – Ethiopian Economic Policy Research Institute
(EEA/EEPRI), E-mail: [email protected], Tel: +251-91-114-7253
2
I. Introduction
Like many other developing countries, Ethiopia‟s export is limited to few primary products,
which are mainly agricultural. Besides commodity, the export is also geographically concentrated
into few destination countries as well. According to Abebe (1991) there has been a widely held
view that such commodity and geographic concentrations are the major cause for instability in
the export earnings. Belay (1998) noted that the problem caused by instability of earnings from
commodity export has received considerable attention, especially in the North-South dialog.
According to him, instability in export earnings has been major concern for policy-makers in
many developing countries.
Heavy and sudden fluctuations in quantity and price of exports could create a serious problem in
balance-of-payments (BOP), national income, investment as well as the overall growth of less
developed countries. The severe consequences of export instability at the various fronts of the
economy have ratchet effect on wages and manufactured products in industrialized countries,
especially during the period after boom, and the higher import prices, hence inflationary
consequences on least developed countries (LDCs), (Devkota 2004).
According to Gyimah-Brempong (1991), empirical researches on the relationship between export
earnings instability and economic growth in less developed countries have yielded mixed results.
Some studies found positive relationship while others found a negative one. There is also a third
group which found non-significant relationships to exist between export earnings instability and
economic growth. These groups gave their own explanation for their respective results. The
“negative impact” groups explained their findings using the uncertainties caused by the
instability, which makes planning and production decisions of the export sector difficult. In
addition, the instability will also constrain the country‟s ability to import goods that are deemed
essential for the growth of the country.
On the other hand those who obtained positive relation between fluctuations of export earnings
and economic growth used uncertainty itself to explain their findings. They argue that uncertainty
among the stakeholders of the export sector will encourage more saving. This saving, which is
made with the intention of mitigating the impacts of earnings fluctuations, will then becomes
investment in the subsequent periods. This in turn contributes to the growth of the economy
(Gyimah-Brempong, 1991).
The present study extends the work of Belay (1998) with the objective of identifying the
contributions of major export commodities to the instability of the Ethiopian export proceeds.
The results are expected to help policy-makers in making decisions regarding export
diversification or any other policy interventions. The sample time period for this study is from
3
1962 to 2008, which is sub-divided into three different sub-periods, i.e. the Imperial (1962-1973),
the Derg2 (1974-1991) and post-Derg (1991-2008) periods.
The methodology we are using to address the above-mentioned objectives is first to identify the
most appropriate measure of instability index with respect to the three sub-periods and as well as
the entire period (1962-2008). The analysis of these periods separately is important since each
has distinct characteristics with respect to their political, economic and foreign relation policies.
The other comparisons to be made are between the relative contributions of commodities in the
instability. How important a commodity is to the overall instability will be assessed by comparing
its share in the instability with its share in the total export earnings.
This study attempts to identify the stability and instability of five major export commodities,
namely coffee, oilseeds, hides and skins, pulses, and fruits and vegetables based on secondary
data. Other export commodities than the ones mentioned here are taken as one commodity under
the name „others‟. This is done due to the fact that these five commodities contribute to the larger
share (about 80% on average) of the export income of the country.
Due to considerable number of very unusual outliers we found in price and volume of exports,
the study has been limited to the analysis of earnings instability only. We felt that making
analysis based on such unreliable data could be misleading and inappropriate. Therefore, we took
the analysis of price and volume instability out of this study
The rest of the paper is organized as follows: The literatures reviewed are summarized in section
II. Section III describes the export sector of the country. This will be followed by Section IV,
which presents the analytical framework and the discussion of the main findings of the study.
Finally Section V will conclude the study by summary of the main conclusions, policy-
implication, and listing some issues for further studies.
II. Literature Review
2.1. Theoretical Literature:
Adam Smith proposes that two nations trade with each other voluntarily if both nations gain. This
gain is possible based on the theory of absolute advantage, i.e. one nation is more efficient than
(or has absolute advantage over) another in the production of one commodity but is less efficient
(or has absolute disadvantage with respect to) the other nation in producing a second commodity.
If that is the case both nations gain by each specializing in the production of the commodity of its
absolute advantage, under the assumptions of classical trade theory (Salvatore 1998).
2The Derg (or Dergue) was a communist military junta that came to power in Ethiopia, following the ousting
of Haile Selassie I (From Wikipedia, the free encyclopedia). This period is named after this committee that ruled the
country during the years 1974 to 1991.

4
According to David Ricardo‟s law of comparative advantage, a country should specialize in the
production and export of the commodity in which its absolute disadvantage is smaller (this is the
commodity of its comparative advantage) and import the commodity in which its absolute
disadvantage is greater (this is the commodity of its comparative disadvantage) than the foreign
country in order for both countries to gain from trade. In this case one country could have
absolute advantage in the production of both goods but it could benefit if it produce the one in
which it is most efficient and import the other good from the foreign source, hence a base for
trade (Salvatore 1998).
Mulugeta (2007) argues that most underdeveloped countries ought to concentrate in exporting
raw materials because it is here that they have comparative advantage over developed nations.
Developed nations on the other hand are apt to have greater comparative advantage in
manufactured goods.
There is also another reason for developing countries to concentrate on the export of few
unprocessed products, which is explained by the Heckscher-Ohlin (HO) theorem. The theorem
states that a nation exports the commodity whose production requires intensive use of the
nation‟s relatively abundant and cheep factors and imports the commodity that is produced by
intensive use of a nations relatively scares and expensive factors (Salvatore 1998).
Now let us apply the above theorem to Ethiopia3, where its large rural population provides the
„abundant‟ supply of labor for the agricultural production. Since most farmers and farm workers
in Ethiopia work in their own and/or their families‟ farm, and farm employment doesn‟t pay
much due to the large supply of labor, it is reasonable to consider that labor is a cheep and
abundant factor. According to the HO theorem, the Ethiopian „specialization‟ in exporting
agricultural products and importing more capital intensive manufactured goods is in line with the
theory. This is because Ethiopia is capital scarce and labor abundant and agriculture is labor
intensive in developing countries unlike that of developed where it is rather capital intensive.
Accordingly less developed countries are expected to specialize in the production of more labor
intensive primary products. In line with this argument Ethiopia has „specialized‟ on few
agricultural commodities. But this commodity concentration could have consequences in terms of
earnings instability according to the empirical arguments in section 2.3 below.
2.2. Measurement of Export Instability:
Naya (1973) defined export earnings as the receipts from several products that the country
exports. These products have a varying composition in the export of the country and may face
different prices based on demand, supply and market conditions. Fluctuations in export proceeds
3 Ethiopia has one of the largest populations in Africa (about 74 million according to the 2007 national population
and housing census) of which about 83.83 percent is living in rural area

5
are thus induced by changes in individual products‟ proceeds and by the interaction of such
changes among the different export commodities. Such variations could be caused by economic,
natural and other forces which could be internal or external. Some examples of such shocks are
crop failure, cyclical decline in economic conditions, and changes in commercial policies.
The general agreement in defining instability is that it is the deviation of the observed outcome
from its natural (expected) value. In the context of export earnings, export is expected to grow
positively, negatively or stay flat following some pattern. The instability is then the deviation of
the actual outcomes of the earnings from this expected pattern, commonly called the trend. To
measure this fluctuation several authors developed and used several indices.
Massell (1964) and Massell (1970) stressed that the measurement of instability chosen will be
influenced by the type of trend fitted. He chose to use linear trend in the former and exponential
trends in the latter, due to their best fit to their respective dataset. He specified the instability
index using the formula:
N
yI
y
ym
2
_
)log(log
log
1 (2.1)
Where the fitted value is estimated using either tbtay or tbtay loglog .
Cuddy and Valle (1978) criticizes the above approach for its ad hoc nature, reasonable but not
founded on any clear theoretical foundation. They suggested what they called “A General
Approach”, which was based on the coefficient of multiple determination to give it a solid
statistical foundation. Following some mathematical manipulation they arrived at:
kN
NRCV
y
SSEICV
1)1(100 2
_ (2.2)
WherekN
yySSE
2
2)(
is the Sum of Squares of deviation of the estimated from the actual
value, and k being the number of independent explanatory variables, including the constant, in
the model. ICV is a corrected coefficient of variation (CV)4 bounded by zero and CV.
4
X
eSCV
. , i.e. the ratio of the standard error to the mean.

6
Love (1985) measured instability as the percentage deviation of export earnings from its trend,
which could be expressed as:
_
_
t
tt
t
x
xx
u
(2.3)
Where tx is total earnings and tx_
is the trend value. The choice of the appropriate trend
correction is central for the estimation of tu . Among the available choices of trend are moving
averages, linear, and exponential5 trends.
Glezakos (1973), Savvides (1984) and Glezakos (1984) used the arithmetic mean of the absolute
value of the yearly changes in a time series corrected for the trend and expressed as percentage of
the average of all observations. The above definition is expressed symbolically as:
1
||100 2
1
_
N
byy
y
I
N
t
tt
G (2.4)
Where, b is the slope of the linear trend tt btay fitted by ordinary least square (OLS)
method. The logical economic explanation of this index is that part of the change in earnings
could be expected on the basis of the positive or negative trend experienced in the past while the
remaining part, byy tt 1 , being the unexpected change.
The methods used by Murray (1978) to measure instability were MacBean Index (MBI) and the
Log Trend Index (LTI). The MBI measures deviations from a 5-year moving average of the
observed values having the form:
2
34
100 n
t
ttt MAMAxn
MBI (2.5)
Where, MAt is the five year moving average of the earnings, xt. The LTI, which measures
deviation from a constant growth rate trend line, has the form:
n
t
bt
t xaexn
LTI1
_2
1001
(2.6)
5 The preference of the study was the moving average one, as it is assumed to be more likely by the author.
7
Where, a and b are estimates derived from the least square fitting of tt btax loglog ,
where tx is the export proceed.
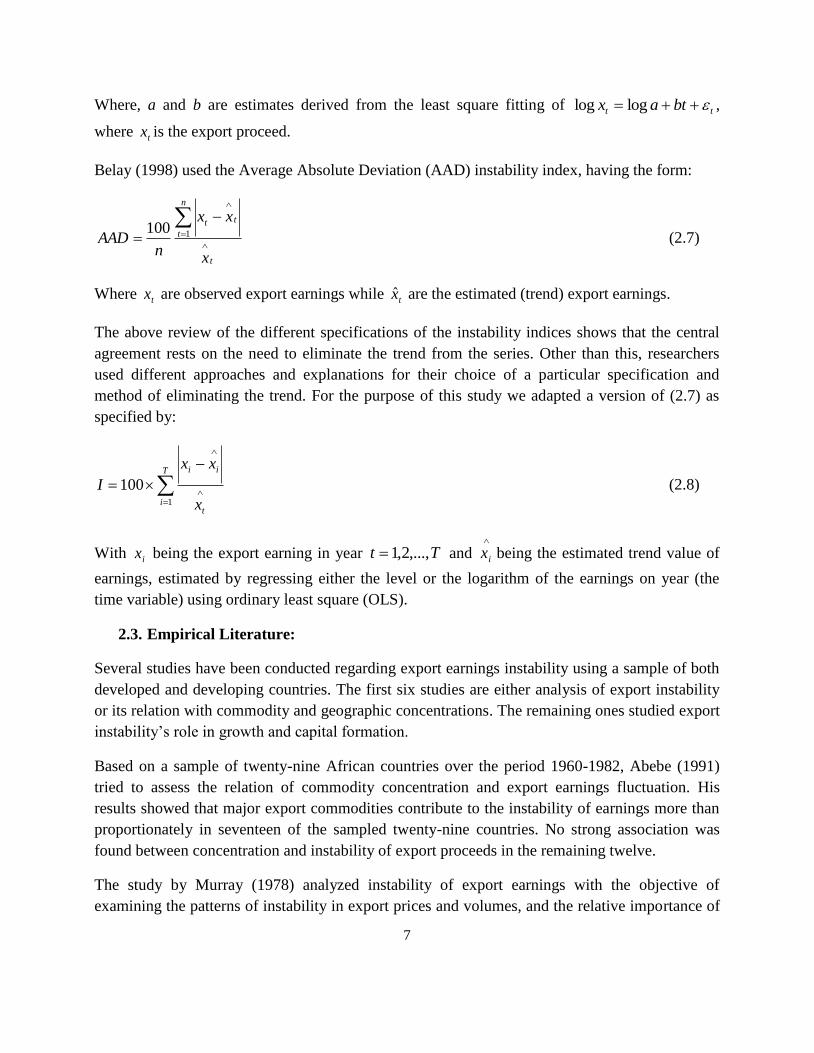
Belay (1998) used the Average Absolute Deviation (AAD) instability index, having the form:
t
n
t
tt
x
xx
nAAD
1100 (2.7)
Where tx are observed export earnings while tx̂ are the estimated (trend) export earnings.
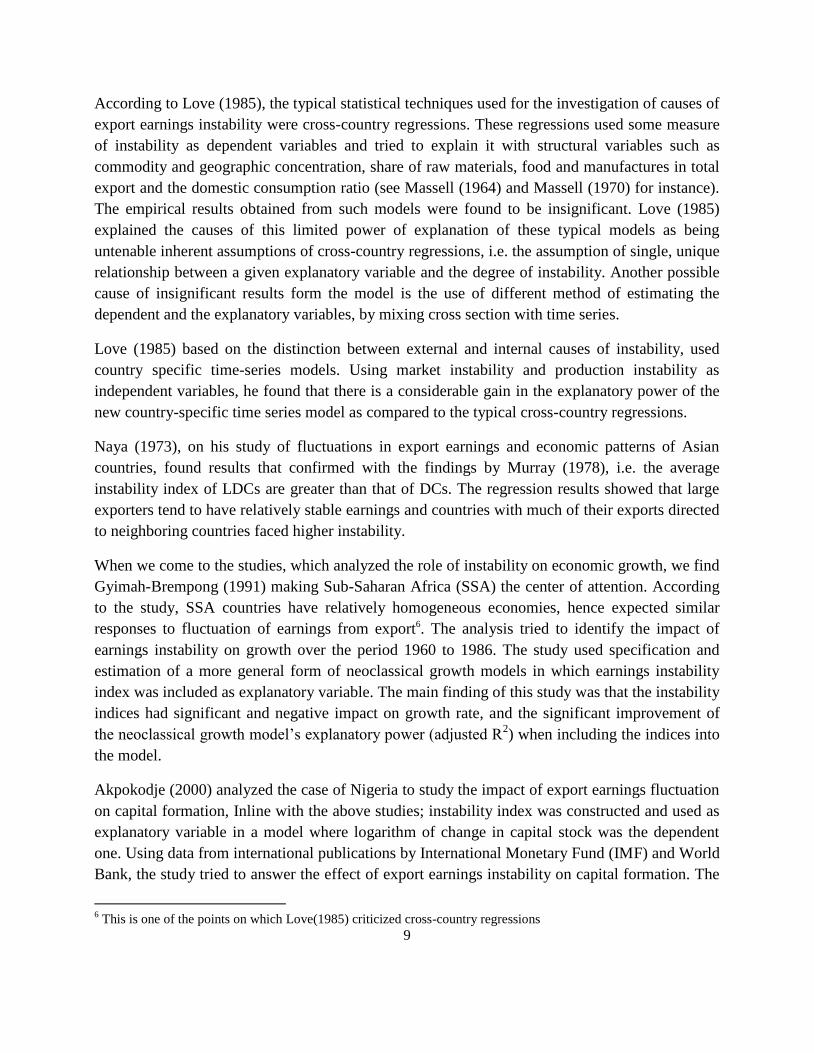
The above review of the different specifications of the instability indices shows that the central
agreement rests on the need to eliminate the trend from the series. Other than this, researchers
used different approaches and explanations for their choice of a particular specification and
method of eliminating the trend. For the purpose of this study we adapted a version of (2.7) as
specified by:
T
it
ii
x
xx
I1
100 (2.8)
With ix being the export earning in year Tt ,...,2,1 and
ix being the estimated trend value of
earnings, estimated by regressing either the level or the logarithm of the earnings on year (the
time variable) using ordinary least square (OLS).
2.3. Empirical Literature:
Several studies have been conducted regarding export earnings instability using a sample of both
developed and developing countries. The first six studies are either analysis of export instability
or its relation with commodity and geographic concentrations. The remaining ones studied export
instability‟s role in growth and capital formation.
Based on a sample of twenty-nine African countries over the period 1960-1982, Abebe (1991)
tried to assess the relation of commodity concentration and export earnings fluctuation. His
results showed that major export commodities contribute to the instability of earnings more than
proportionately in seventeen of the sampled twenty-nine countries. No strong association was
found between concentration and instability of export proceeds in the remaining twelve.
The study by Murray (1978) analyzed instability of export earnings with the objective of
examining the patterns of instability in export prices and volumes, and the relative importance of

8
supply and demand fluctuations in determining earnings instability. It considered a large number
of countries from both developed and underdeveloped over the period 1952-1971. The results
showed that instability of export earnings, prices and quantities are higher for underdeveloped
countries than developed. The findings also showed that earnings instability in the case of
developing countries is strongly associated with quantity instability than price.
Belay‟s (1998) analysis of the contributions of agricultural commodities on the Ethiopian export
earnings fluctuation used a twenty-nine year time-series data covering the period 1962 to 1990.
The major agricultural commodities the study considered were coffee, hides and skin, vegetables
and fruits, and oilseeds.
The statistical results of Belay (1998) are as follows. Hides and skins and coffee contributed to
the instability less than their share in the total export earnings. On the other hand the contribution
of vegetables and fruits, and oilseeds to the instability were greater than their share in total export
proceeds. In analyzing the contribution of price and quantity fluctuations on the instability of
export revenue, the study found that with the exception of coffee, fluctuations in export quantities
were the dominant causes of instability in export earnings. This means that the supply factors are
more important in causing the fluctuations of the proceeds. The study tried to explain this by the
fact that, Ethiopia heavily depends on few agricultural products for its export earnings and
agricultural products in turn heavily depend on weather conditions. Another supply factor is
domestic consumption. In the case of coffee, whose fluctuation has significant impact due to its
share in total export earnings, it suffers wide fluctuation in earnings owing mostly to instability in
the world market price where Ethiopia has no control.
Massell (1964) used a sample of thirty-six countries when estimating his linear regression model
in which export instability, the dependent variable, was function of commodity concentration and
geographic concentration of exports. The results gave significant results for both commodity and
geographic concentration of exports. Regarding the sign, the former was positively related to
instability while the latter being negatively. The study suggested the insulating effect of strong
bilateral trade relations for the negative sign of geographic concentration on instability.
In another, more extensive study of fifty-five countries over the period 1950-66, Massell (1970)
fit exponential model to control for trend effects on instability. The cross-country regression
resulted in significant result for commodity concentration and food share of exports in explaining
instability in earnings of export. A second model, which was the same model after deleting
geographic concentration, per capital income, export market share and raw material share,
resulted in the improvement of the power of the model (R2) and the significance of the variables;
concentration index, food ratio of export and value of total export. In both estimations
commodity concentration was positive while food ratio and export volume were negative in terms
of their direction of impact on instability of proceeds.
9
According to Love (1985), the typical statistical techniques used for the investigation of causes of
export earnings instability were cross-country regressions. These regressions used some measure
of instability as dependent variables and tried to explain it with structural variables such as
commodity and geographic concentration, share of raw materials, food and manufactures in total
export and the domestic consumption ratio (see Massell (1964) and Massell (1970) for instance).
The empirical results obtained from such models were found to be insignificant. Love (1985)
explained the causes of this limited power of explanation of these typical models as being
untenable inherent assumptions of cross-country regressions, i.e. the assumption of single, unique
relationship between a given explanatory variable and the degree of instability. Another possible
cause of insignificant results form the model is the use of different method of estimating the
dependent and the explanatory variables, by mixing cross section with time series.
Love (1985) based on the distinction between external and internal causes of instability, used
country specific time-series models. Using market instability and production instability as
independent variables, he found that there is a considerable gain in the explanatory power of the
new country-specific time series model as compared to the typical cross-country regressions.
Naya (1973), on his study of fluctuations in export earnings and economic patterns of Asian
countries, found results that confirmed with the findings by Murray (1978), i.e. the average
instability index of LDCs are greater than that of DCs. The regression results showed that large
exporters tend to have relatively stable earnings and countries with much of their exports directed
to neighboring countries faced higher instability.
When we come to the studies, which analyzed the role of instability on economic growth, we find
Gyimah-Brempong (1991) making Sub-Saharan Africa (SSA) the center of attention. According
to the study, SSA countries have relatively homogeneous economies, hence expected similar
responses to fluctuation of earnings from export6. The analysis tried to identify the impact of
earnings instability on growth over the period 1960 to 1986. The study used specification and
estimation of a more general form of neoclassical growth models in which earnings instability
index was included as explanatory variable. The main finding of this study was that the instability
indices had significant and negative impact on growth rate, and the significant improvement of
the neoclassical growth model‟s explanatory power (adjusted R2) when including the indices into
the model.
Akpokodje (2000) analyzed the case of Nigeria to study the impact of export earnings fluctuation
on capital formation, Inline with the above studies; instability index was constructed and used as
explanatory variable in a model where logarithm of change in capital stock was the dependent
one. Using data from international publications by International Monetary Fund (IMF) and World
Bank, the study tried to answer the effect of export earnings instability on capital formation. The
6 This is one of the points on which Love(1985) criticized cross-country regressions
10
short run models confirmed the hypotheses that export earnings instability and logarithm of
changes in capital stock are significantly and inversely related.
Sinha (1999) looked at the relationship between export stability, investment and economic
growth in nine Asian countries using time series data. The study particularly paid attention to
stationarity and cointegration issues, on which previous time series studies in this area have not.
The study found that, in most cases, the variables are non-stationary in their levels and not
cointegrated. These findings raise serious doubts about the results of the previous studies. The
results were not uniform across countries; casting doubts about the validity of the numerous
cross-section studies. For Japan, Malaysia, Philippines and Sri Lanka, it was found that a
negative relationship between export instability and economic growth to exist. For (South) Korea,
Myanmar, Pakistan and Thailand, a positive relationship between the two variables was found.
For India, the results were mixed.
Glezakos (1973) covered the period 1953-66 and both least developed (LDCs) and developed
ones countries (DCs) were included in the sample. Basically the study used a cross-country
regression but relied on time series analysis to compute the indices. One of the findings of the
study was that the average export earnings instability for LDCs was twice as much as that of
DCs. The regression results of income growth rate on export instability showed that instability to
have a significantly negative impact on real per capital income growth rate in the case of LDCs.
Savvides (1984) tried to test Glezakos‟s (1973) hypothesis that export instability is a factor
detrimental to the growth of LDCs. The study used identical method of estimation as Glezakos
(1973) by extending the study to take account of recent data, 1967-77. Surprisingly, it was found
that the cross-section regressions do not confirm the hypothesis in question; in fact these results
directly contradicted that of Glezakos (1973), given the application of identical technique in both
cases. Omission of important variables, measurement errors and endogenity of export instability
and growth were suggested as possible cause for this contradiction.
In a response study (Glezakos 1984), Constantine Glezakos agreed with Savvies‟s remark on the
insufficiency of single equation cross-country models. The first critique this study identified on
Savvies‟s (1984) was that the relatively high per capital growth rate, despite the economic
downturn of the early 1970s following the first oil shock. Another point of critique was the trend
elimination technique. The study argues that the data 1953-66 exhibited either a liner or no-trend
in export proceeds, while that of 1967-77 showed exponential trends. Savvides (1984) ignored
this fact in order to make his analysis using identical method like that of Glezakos (1973). The
Glezakos (1984) regressions were run by giving considerations for the above critiques, after
correcting per capital incomes and choosing the „best‟ index, linear or exponential based on
goodness of fit. Export instability in Glezakos (1984) has still shown to have a significant
negative impact on income growth of LDCs like that of Glezakos (1973). It was also found that
11
export growth is more significant factor in determining the income growth of LDCs than DCs
based on the regression coefficients, which is in direct contrast with Savvides‟s (1984).
The literatures above show that countries like Ethiopia have comparative advantage in production
and export of commodities which are labor (which is the country‟s abundant resource) intensive
than capital (which is the country‟s scares resource) intensive. It is theoretically reasonable to
expect for such countries to specialize in primary sectors like agriculture, one of the most labor
intensive sectors in a developing country context. Empirical results on the other hand suggest that
export concentration on few products has a danger of earnings instability. Therefore, each
developing country should study the impact of commodity concentration on instability while
making-policy decisions
The knowledge gap this study is anticipating to fill is to make a country specific analysis of the
issue, using more comprehensive dataset of forty-five years. Analyzing the current situation will
inform policy-makers where the country stand with regard to the research question.
III. Performance of the Ethiopian Export Sector
3.1. Data
The data on export earnings, price and quantity of Ethiopia used in this study is gathered from
various issues of the annual reports of the National Bank of Ethiopia (NBE). The period under
consideration is between the years 1963 to 20087. Of the forty-five years under consideration, the
years 1963 to 1974 is the imperial sub-period under the rule of Hailesilasie I8, followed by the
period 1974 to 1991,which is the period of the Derg while the remaining period of 1991 to 2008
is the post-Derg period. The previous two periods included Eritrean data as it was part of
Ethiopia. Eritrea became an independent state since 1993, but this change has been ignored in this
study since the contribution of the Eritrean products to total export earnings of Ethiopia are
insignificant.
The first annual report of NBE was published in 1964 with data from the year 1963 where
detailed export earnings were reported only for coffee, hides and skins, oilseeds and pulses. The
remaining components of Ethiopian export commodities were reported in aggregate form as „all
others‟. Since the data for the years 1964 to 1970 was reported in the Gregorian calendar, we took
the average of the two consecutive years to make it compatible with the rest of the series, which
is in Ethiopian/Julian calendar9.
7 For the purpose of the descriptive statistics we used the period 1963 to 2007 only.
8 Emperor Hailesilasie I ruled Ethiopia from 1930 to 1974 (Beharu 2002). The imperial rule was then replaced by the
military council of Derg, which over throw the king in a military coup. 9 In this calendar a year starts on September 11 (and 12 in every leap year) and the Ethiopian fiscal year starts on 8
th
of July.
12
Several issues of Ethiopian Statistical Abstracts of the Central Statistical Agency (CSA) are used
to obtain data on Gross Domestic Product (GDP) at current market prices to represent national
production, gross capital formation (investment) and forecasts of population size. Such data is
available since 1961 as the publication of these abstracts has started in 1963.
3.2. Performance of the Export Sector During the Imperial Period
According to Berhanu (2005), this period is characterized by relatively free market oriented
policies with the private, mainly foreign capital, taking the lion‟s share of both import and export
trade. The dominant trade strategy of the time was import substitution even though export
diversification was explicitly stated on the First-Five-Year Development plan (Berhanu 2005).
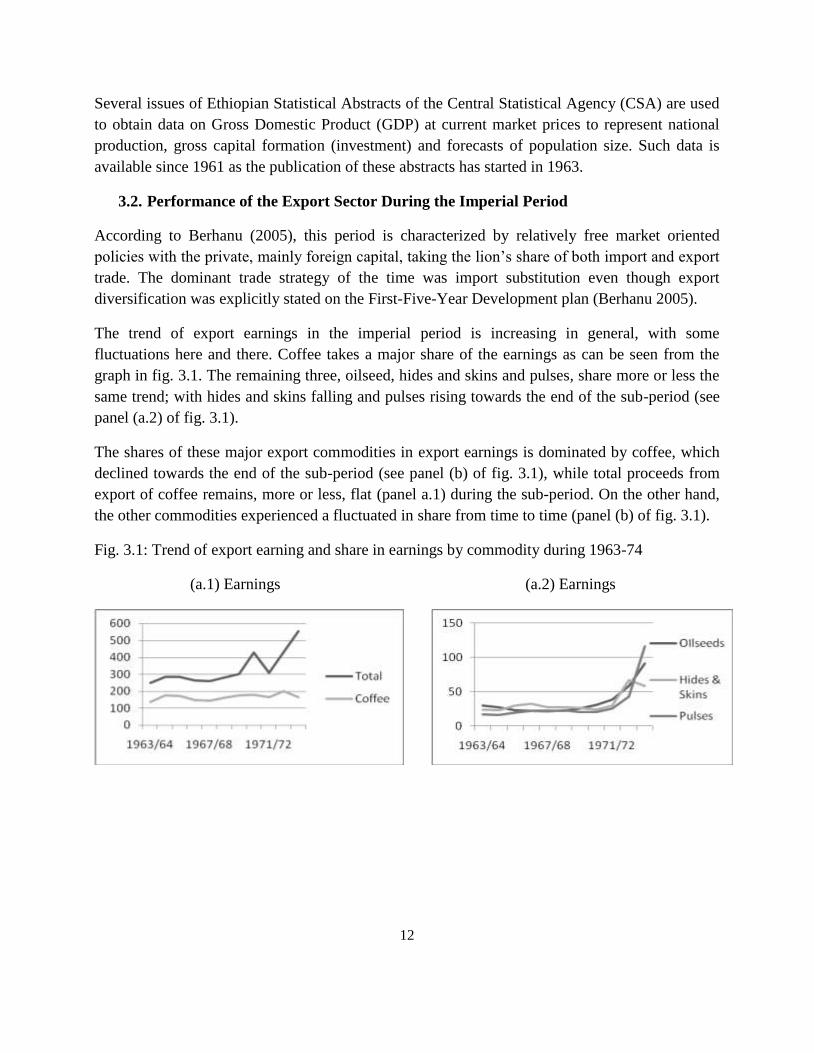
The trend of export earnings in the imperial period is increasing in general, with some
fluctuations here and there. Coffee takes a major share of the earnings as can be seen from the
graph in fig. 3.1. The remaining three, oilseed, hides and skins and pulses, share more or less the
same trend; with hides and skins falling and pulses rising towards the end of the sub-period (see
panel (a.2) of fig. 3.1).
The shares of these major export commodities in export earnings is dominated by coffee, which
declined towards the end of the sub-period (see panel (b) of fig. 3.1), while total proceeds from
export of coffee remains, more or less, flat (panel a.1) during the sub-period. On the other hand,
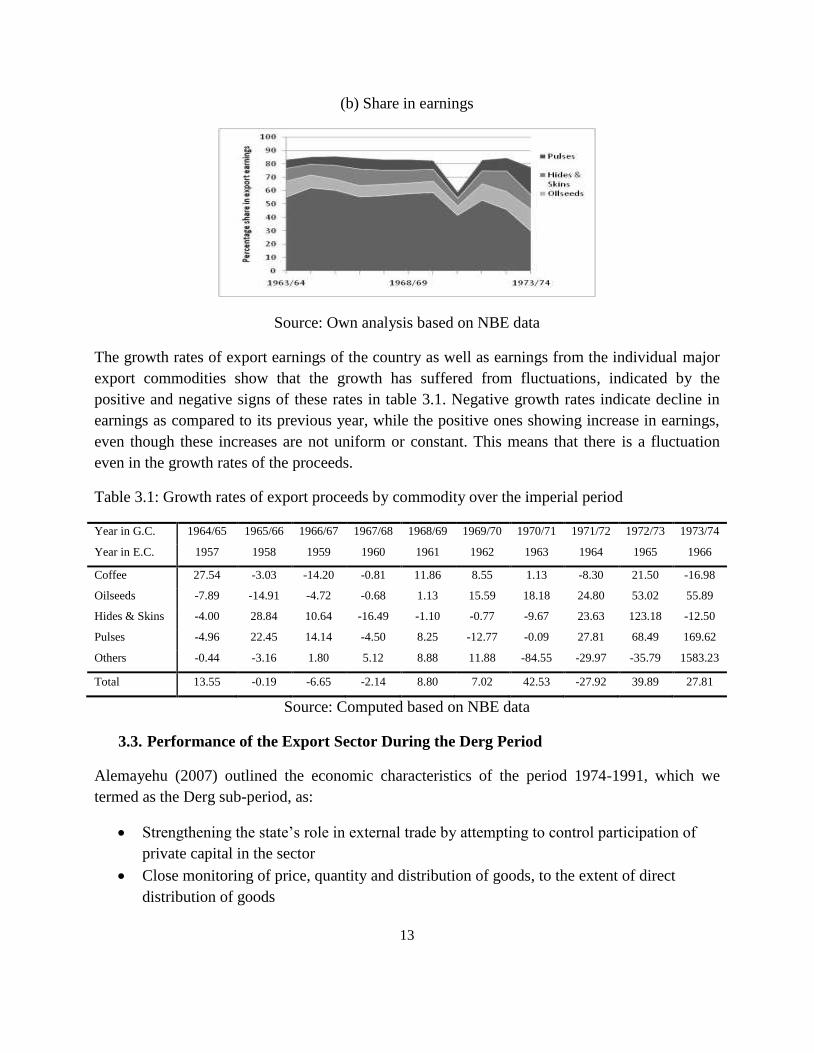
the other commodities experienced a fluctuated in share from time to time (panel (b) of fig. 3.1).
Fig. 3.1: Trend of export earning and share in earnings by commodity during 1963-74
(a.1) Earnings (a.2) Earnings
13
(b) Share in earnings
Source: Own analysis based on NBE data
The growth rates of export earnings of the country as well as earnings from the individual major
export commodities show that the growth has suffered from fluctuations, indicated by the
positive and negative signs of these rates in table 3.1. Negative growth rates indicate decline in
earnings as compared to its previous year, while the positive ones showing increase in earnings,
even though these increases are not uniform or constant. This means that there is a fluctuation
even in the growth rates of the proceeds.
Table 3.1: Growth rates of export proceeds by commodity over the imperial period
Year in G.C. 1964/65 1965/66 1966/67 1967/68 1968/69 1969/70 1970/71 1971/72 1972/73 1973/74
Year in E.C. 1957 1958 1959 1960 1961 1962 1963 1964 1965 1966
Coffee 27.54 -3.03 -14.20 -0.81 11.86 8.55 1.13 -8.30 21.50 -16.98
Oilseeds -7.89 -14.91 -4.72 -0.68 1.13 15.59 18.18 24.80 53.02 55.89
Hides & Skins -4.00 28.84 10.64 -16.49 -1.10 -0.77 -9.67 23.63 123.18 -12.50
Pulses -4.96 22.45 14.14 -4.50 8.25 -12.77 -0.09 27.81 68.49 169.62
Others -0.44 -3.16 1.80 5.12 8.88 11.88 -84.55 -29.97 -35.79 1583.23
Total 13.55 -0.19 -6.65 -2.14 8.80 7.02 42.53 -27.92 39.89 27.81
Source: Computed based on NBE data
3.3. Performance of the Export Sector During the Derg Period
Alemayehu (2007) outlined the economic characteristics of the period 1974-1991, which we
termed as the Derg sub-period, as:
Strengthening the state‟s role in external trade by attempting to control participation of
private capital in the sector
Close monitoring of price, quantity and distribution of goods, to the extent of direct
distribution of goods
14
Especial emphasis was given to external trade sectors deemed essential for economic
growth and in the trading of medical equipment and goods that ensure the health and
security of the population
Diversification attempts were also made in terms of commodity and destination of
exports, especially to divert trade towards its socialist partners.
The share of export10 as defined by the ratio of exports to gross domestic product11 (GDP)
averaged at 10.36% for the years 1974 to 1991. On the other hand the share of imports in
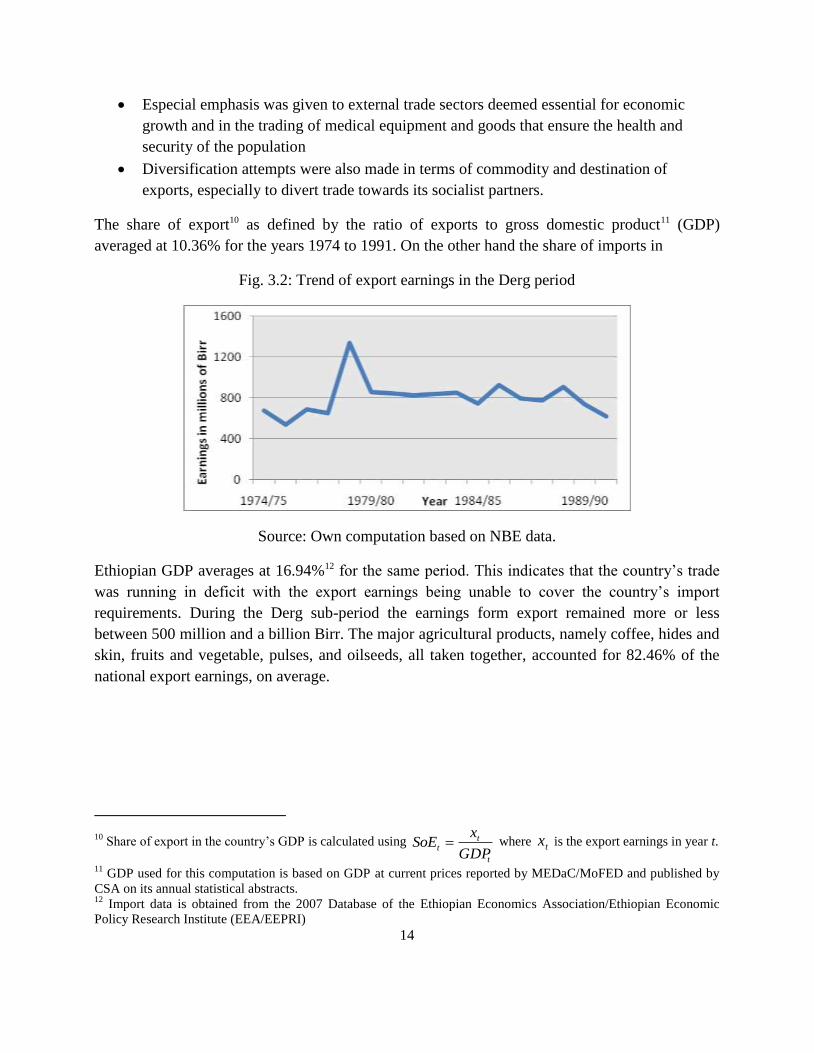
Fig. 3.2: Trend of export earnings in the Derg period
Source: Own computation based on NBE data.
Ethiopian GDP averages at 16.94%12 for the same period. This indicates that the country‟s trade
was running in deficit with the export earnings being unable to cover the country‟s import
requirements. During the Derg sub-period the earnings form export remained more or less
between 500 million and a billion Birr. The major agricultural products, namely coffee, hides and
skin, fruits and vegetable, pulses, and oilseeds, all taken together, accounted for 82.46% of the
national export earnings, on average.
10 Share of export in the country‟s GDP is calculated using
t
tt
GDP
xSoE where tx is the export earnings in year t.
11 GDP used for this computation is based on GDP at current prices reported by MEDaC/MoFED and published by
CSA on its annual statistical abstracts. 12
Import data is obtained from the 2007 Database of the Ethiopian Economics Association/Ethiopian Economic
Policy Research Institute (EEA/EEPRI)

15
Table 3.2: Percentage share of agricultural products in total export earnings in the Derg period
Average share Minimum Maximum S.D. of shares
Coffee 61.47 17.51 87.90 15.26
Hides & Skins 11.87 5.55 18.19 3.60
Fruits & Vegetables 0.98 0.20 1.95 0.47
Pulses 3.87 1.07 10.96 2.90
Oilseeds 2.89 0.59 13.23 3.05
Live Animals 2.35 0.00 7.62 2.30
Chat 1.60 0.49 3.61 1.16
Source: Own computation based on NBE data
In this period coffee alone took 61.47% of the earnings followed by hides and skin with 11.87%,
pulses with 3.87% oilseeds with 2.89%, and fruits and vegetables with 0.98%.
The pattern of the shares in earnings of the major export commodities of the country remained
being dominated by coffee in the Derg period as well. The share of coffee started to rise from its
decline towards the end of the imperial period and suffered several mild ups and downs during
the course of the Derg period.
Fig. 3.3: Share of the major agricultural commodities in export earnings in the Derg period
Source: Own computation based on NBE data
16
3.4. Performance of the Export Sector During the Post-Derg Period
Following the fall of the Derg, the objectives of the government changed towards ensuring
participation of the private sector, promoting export by providing incentives, replacing
quantitative trade restrictions with ad valorem rates, increase diversification, minimize illicit
trade and restructuring state owned trade enterprises (Alemayehu 2007).
According to Alemayahu (2007) and the Ethiopian investment and licensing policies and
procedures of the Ethiopian Investment Agency, the government took the following measures to
meet the above objectives:
Liberalize the foreign exchange market into an auction system between banks, in order to
provide foreign currency for both public and private sectors
Devaluation of the Birr in order to make Ethiopian products cheaper in the world market
versus the products of the rest of the world
Simplification of licensing procedure
Supportive services to private exporters were designed in areas of transport, packaging
training, overseas market research, etc.
Introduction of simple tariff structure and foreign exchange retention schemes
According to the Ethiopian investment and licensing policies and procedures of the Ethiopian
Investment Agency, exporters are totally exempted from import duties of capital goods. Such
privileges also extend to raw materials used as an input for export commodities. Ethiopian
products and services destined for export are exempted from the payment of any export tax and
other taxes levied on exports. The sector also enjoys other incentive privileges extended to
private investors, including income tax holidays, loss carry forward and investment guarantees, in
order to encourage their active participation in the economy.
As per the present study, the Post-Derg period covers the period 1991 to 2008. In this period the
five major export commodities, coffee, hides and skins, fruits and vegetable, oilseeds and pulses,
account for about 71.91% of the total export earnings on average. The one product which gained
importance in terms of average share in earnings, as compared to the previous two periods, is
chat with a share of 0.84%, 1.78% and 9.26% in the imperial, Derg and post-Derg periods
respectively.
The share of oilseeds increased with significant amount in this period from nearly 2% to about
20%. This increase in share is mainly attributed by the increase in export volume of the
commodity, from nearly 176 metric tones in 1992 to 234,976 metric tone in 2007, while its price
increased from nearly 2 Birr/kg to 7 Birr/kg, which is not much as compared to its increase in
volume. Coffee‟s share dropped dramatically despite increase in its export volume and a net
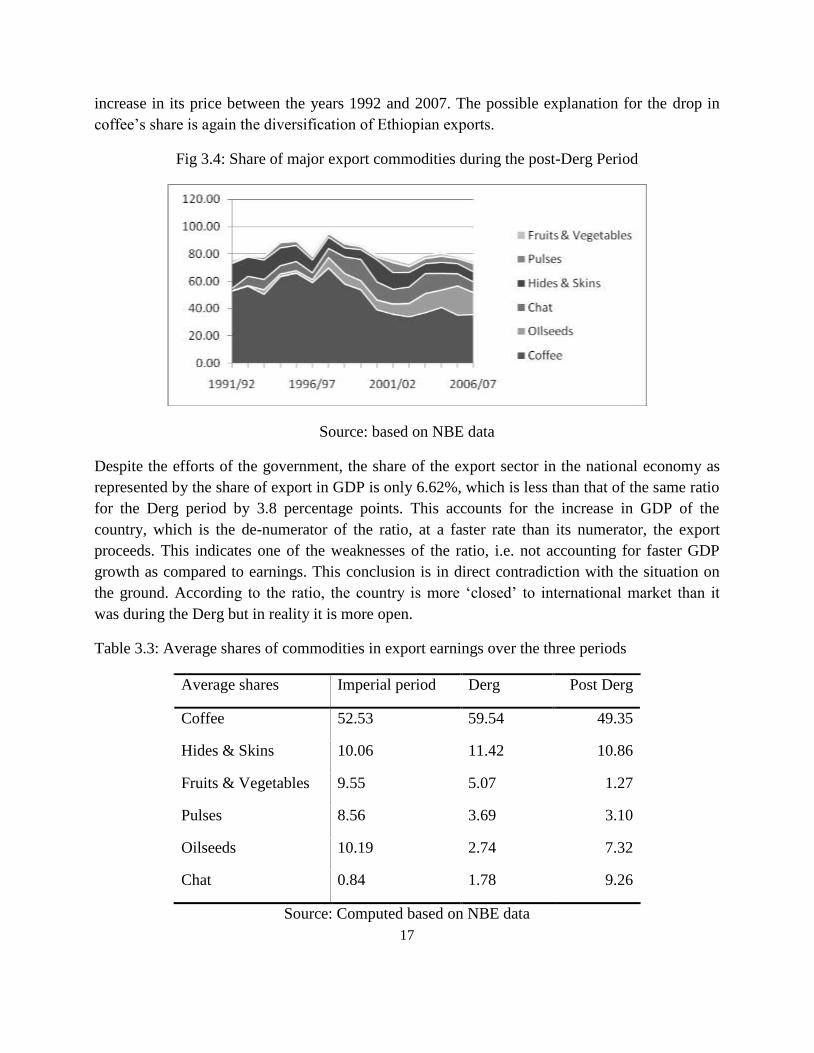
17
increase in its price between the years 1992 and 2007. The possible explanation for the drop in
coffee‟s share is again the diversification of Ethiopian exports.
Fig 3.4: Share of major export commodities during the post-Derg Period
Source: based on NBE data
Despite the efforts of the government, the share of the export sector in the national economy as
represented by the share of export in GDP is only 6.62%, which is less than that of the same ratio
for the Derg period by 3.8 percentage points. This accounts for the increase in GDP of the
country, which is the de-numerator of the ratio, at a faster rate than its numerator, the export
proceeds. This indicates one of the weaknesses of the ratio, i.e. not accounting for faster GDP
growth as compared to earnings. This conclusion is in direct contradiction with the situation on
the ground. According to the ratio, the country is more „closed‟ to international market than it
was during the Derg but in reality it is more open.
Table 3.3: Average shares of commodities in export earnings over the three periods
Average shares Imperial period Derg Post Derg
Coffee 52.53 59.54 49.35
Hides & Skins 10.06 11.42 10.86
Fruits & Vegetables 9.55 5.07 1.27
Pulses 8.56 3.69 3.10
Oilseeds 10.19 2.74 7.32
Chat 0.84 1.78 9.26
Source: Computed based on NBE data

18
With the exception of chat and oilseeds, all the other commodities listed on Table 3.3
experienced declined from their relative share in the Derg period, as compared to their shares in
the post-Derg period. This could be an indicator for either shrink in volume and/or price of the
commodities, or diversification away from these commodities.
IV. Empirical Analysis
In this section we try to present the empirical approach employed to address the thesis of the
study. Prior to the discussion of the results of the study, the framework with which the analysis is
conducted is outlined. In addition to the description of the framework, we also presented them
using their symbolic representations or formulas. Following the outline of the analysis, there is a
section dedicated to discuss the major findings of the study.
4.1. Specification of Instability Indices
A number of indicators have been developed to measure instability. The present study has also
attempted to review some of them in the literature review section. As can be seen from the
indices used by several authors (see for example Massell 1964 and 1970, Murray 1978, Love
1985), the only consensus in defining instability indices is the need for the elimination of the
trend in export growth. This study follows the average absolute deviation instability index as
outlined by Xin and Liu (2007)13. This specification of instability index is chosen due to its ease
of computation, for it does not impose the condition of the same trend, and due to its similarity
with the one used by Belay (1998); so that comparisons could be made by incorporating the data
for the seventeen years period that followed his analysis.
Following Xin and Liu (2007), the instability index can be specified as:
t
tt
t
x
xx
I 100 (4.1)
Where tx is the actual export earnings from time t , tx
is the trend value of earnings and tI being
the value of the instability index for time t . tx
in equation (4.1) is estimated using the regression
of export earnings on time, as specified by (4.2) and (4.3) below14, to define the trend growth of
export earnings.
tt tx . (4.2)
13
Xin and Liu (2007) studied the impact of geographic concentration on instability of China‟s agricultural export
earnings 14
Please see table 4.1 for estimated results
19
Or
tt tx .loglog (4.3)
Where tx is the export earnings, t being the time variable and t is the stochastic error term.
We made the choice between the linear and the exponential models of (4.2) and (4.3) using the
regression specification test (RESET)15, adapted from Wooldridge (2000). We first estimated
(4.2) and (4.3) to obtain
x and
xlog . Then we computed the differences
xexd log
1 (4.4)
and
xxd log)log(2 (4.5)
Then we estimated:
tt dtx 1.. (4.6)
tt dtx 2..loglog (4.7)
If we accept the hypothesis of 0 from equation (4.6), then we chose the linear model. On the
other hand the acceptance of the hypothesis 0 from (4.7) will accept the exponential model.
In the cases where both models are acceptable, we choose the one with the highest power of
acceptance. Significance of the trend is also considered as a criterion of choosing a model in the
event when both specifications are acceptable. In the few cases where both models were rejected
by the RESET test, we base our choice on significance of the trend and graphical inspection of
the earnings. We used the Newy-West standard error at appropriate lag to correct for autocorrelation of
the error terms.
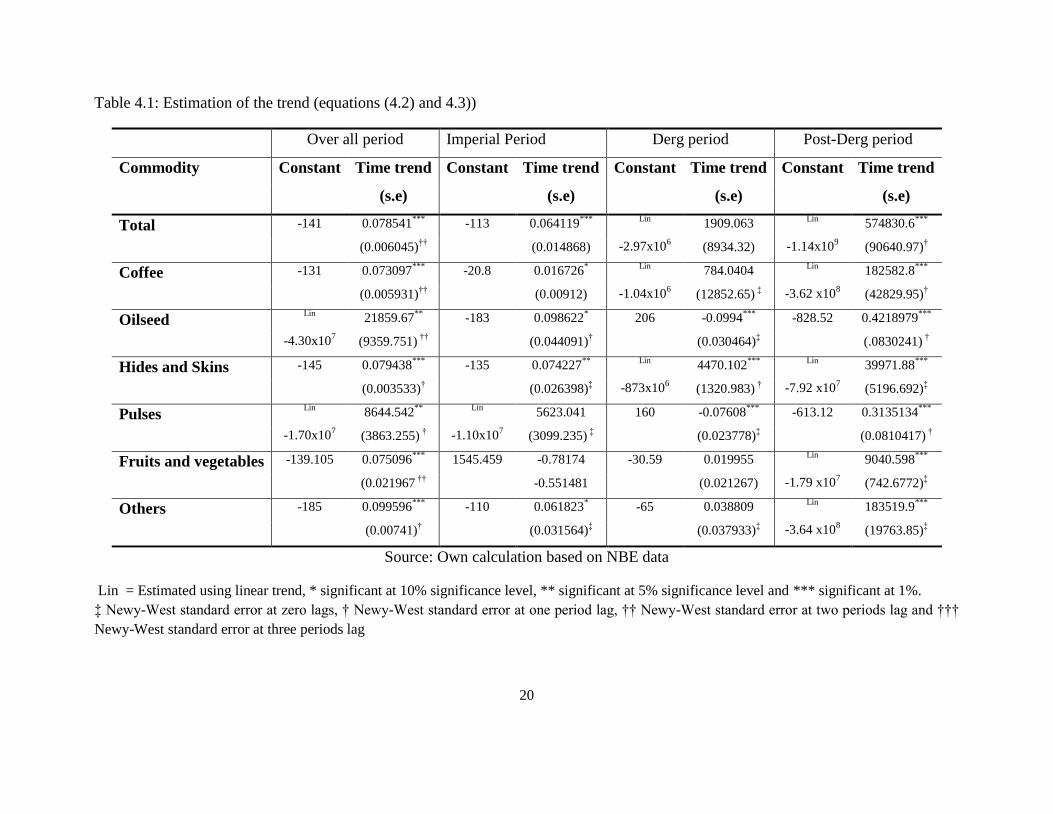
In case of the overall period, from 1963 to 2008, all the models16 with the exception of the one for
oilseeds and pulses turned out to be best fitted by the exponential trend of equation (4.3). The
models for total earnings, fruits and vegetable, and other exports were chosen by graphical
inspection of the trends. Those earnings that increase at a faster rate over time are fitted using
exponential trend. To avoid the bias of using linear and logarithmic scales, we transformed the
estimates from the linear model by taking their natural logarithm in all cases of our analysis.
15
Davidson and MacKinnon called this method the J-test as it estimates and or (for (4.6) or (4.7)
respectively) jointly (Maddala 1992) 16
Model for total export earnings includes earnings from Coffee, Oilseeds, Hides and Skins, Pulses, Fruits and
Vegetables, and Other exports.
20
Table 4.1: Estimation of the trend (equations (4.2) and 4.3))
Over all period Imperial Period Derg period Post-Derg period
Commodity Constant Time trend Constant Time trend Constant Time trend Constant Time trend
(s.e) (s.e) (s.e) (s.e)
Total -141 0.078541***
-113 0.064119***
Lin
-2.97x10⁶
1909.063 Lin
-1.14x10⁹
574830.6***
(0.006045)††
(0.014868) (8934.32) (90640.97)†
Coffee -131 0.073097***
-20.8 0.016726*
Lin
-1.04x10⁶
784.0404 Lin
-3.62 x10⁸
182582.8***
(0.005931)††
(0.00912) (12852.65) ‡ (42829.95)
†
Oilseed
Lin
-4.30x10⁷
21859.67**
-183 0.098622* 206 -0.0994
*** -828.52 0.4218979
***
(9359.751) ††
(0.044091)† (0.030464)
‡ (.0830241)
†
Hides and Skins -145 0.079438***
-135 0.074227**
Lin
-873x106
4470.102***
Lin
-7.92 x10⁷
39971.88***
(0.003533)† (0.026398)
‡ (1320.983)
† (5196.692)
‡
Pulses Lin
-1.70x10⁷
8644.542**
Lin
-1.10x10⁷
5623.041 160 -0.07608***
-613.12 0.3135134***
(3863.255) † (3099.235)
‡ (0.023778)
‡ (0.0810417)
†
Fruits and vegetables -139.105 0.075096***
1545.459 -0.78174 -30.59 0.019955 Lin
-1.79 x10⁷
9040.598***
(0.021967 ††
-0.551481 (0.021267) (742.6772)‡
Others -185 0.099596***
-110 0.061823* -65 0.038809
Lin
-3.64 x10⁸
183519.9***
(0.00741)† (0.031564)
‡ (0.037933)
‡ (19763.85)
‡
Source: Own calculation based on NBE data
Lin = Estimated using linear trend, * significant at 10% significance level, ** significant at 5% significance level and *** significant at 1%.
‡ Newy-West standard error at zero lags, † Newy-West standard error at one period lag, †† Newy-West standard error at two periods lag and †††
Newy-West standard error at three periods lag
21
During the imperial sub-period, the exponential model performed well in representing the data,
with the exception of the case for pulses. The exceptions from exponential trend during the Derg
period are total earnings, coffee and hides and skins.
When it comes to the Post-Derg period, linear trend dominates exponential with the exception of
the case for oilseeds and pulses.
Following the fitting of the appropriate trend for each time period, we computed shares of each
agricultural commodity in the instability. The first step is to summarize the instability indices by
commodity, using arithmetic mean of the index computed using (4.1):
T
I
I
T
t
t
i
1 (4.8)
Where iI is the average instability index of commodity i in the time period [1, T]. Following
this, we computed the weighted instability index of each commodity in the sample. To do so we
multiplied the average instability indices ( iI ) of each commodity by their share in the export
earnings (i.e. their weights), which is symbolically represented as:
i
ii ISI (4.9)
Where, iS stand for commodity i ‟s ( i = Coffee, Oilseeds, Hides and Skins, Pulses, Fruits and
Vegetable and Others) share in export earnings and iI being the average instability index as given
by equation 4.8 for commodity i . Then the weighted share in the instability of commodity i is
computed using:
ISIIsh iii (4.10)
4.2. Findings of the Study
The results of this analysis are summarized on Table 4.2 below. The reported total instability
indices on the table are the average non-weighted indices, computed using equation (4.8). The
commodity wise shares are generated by (4.10) using shares in export earnings as weights. In
doing so the exponential model of (4.3) and the linear model of (4.2) are used, based on the
results of the J-test (RESET-test), to estimate the trend growth of export earnings. To make the
periods comparable with each other, we transformed the index values computed using level
values (linear models) to natural logarithms and reported them in Table 4.2.
22
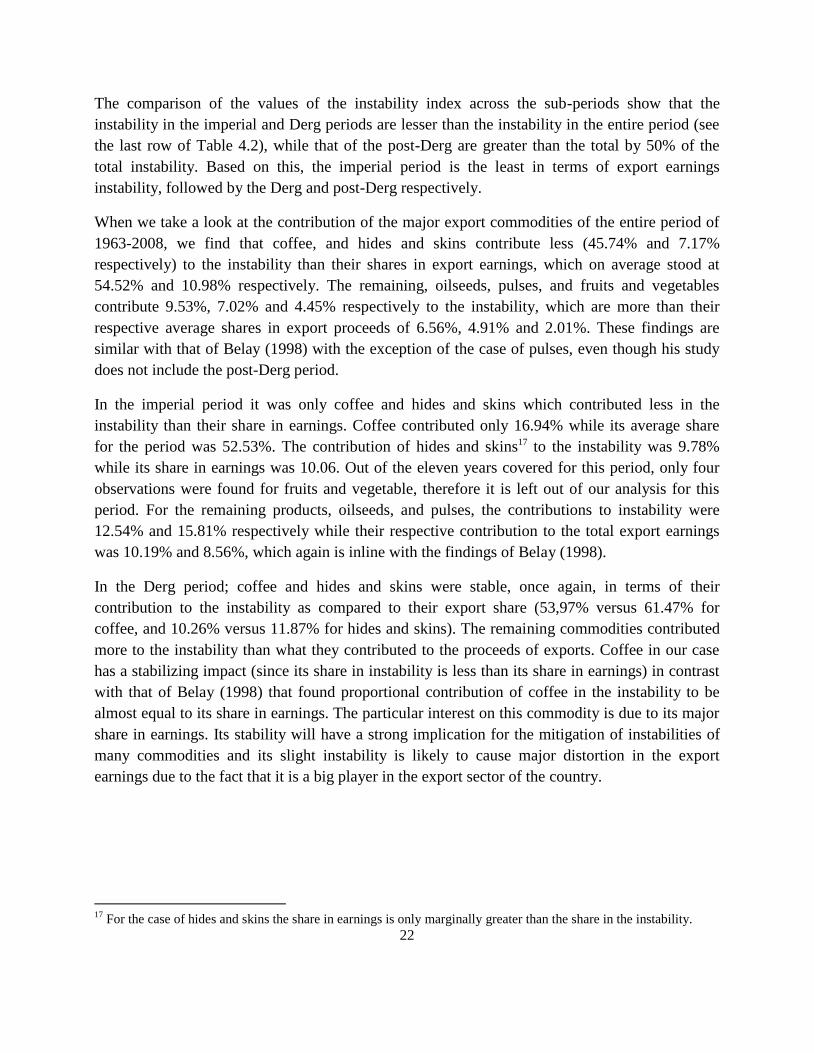
The comparison of the values of the instability index across the sub-periods show that the
instability in the imperial and Derg periods are lesser than the instability in the entire period (see
the last row of Table 4.2), while that of the post-Derg are greater than the total by 50% of the
total instability. Based on this, the imperial period is the least in terms of export earnings
instability, followed by the Derg and post-Derg respectively.
When we take a look at the contribution of the major export commodities of the entire period of
1963-2008, we find that coffee, and hides and skins contribute less (45.74% and 7.17%
respectively) to the instability than their shares in export earnings, which on average stood at
54.52% and 10.98% respectively. The remaining, oilseeds, pulses, and fruits and vegetables
contribute 9.53%, 7.02% and 4.45% respectively to the instability, which are more than their
respective average shares in export proceeds of 6.56%, 4.91% and 2.01%. These findings are
similar with that of Belay (1998) with the exception of the case of pulses, even though his study
does not include the post-Derg period.
In the imperial period it was only coffee and hides and skins which contributed less in the
instability than their share in earnings. Coffee contributed only 16.94% while its average share
for the period was 52.53%. The contribution of hides and skins17 to the instability was 9.78%
while its share in earnings was 10.06. Out of the eleven years covered for this period, only four
observations were found for fruits and vegetable, therefore it is left out of our analysis for this
period. For the remaining products, oilseeds, and pulses, the contributions to instability were
12.54% and 15.81% respectively while their respective contribution to the total export earnings
was 10.19% and 8.56%, which again is inline with the findings of Belay (1998).
In the Derg period; coffee and hides and skins were stable, once again, in terms of their
contribution to the instability as compared to their export share (53,97% versus 61.47% for
coffee, and 10.26% versus 11.87% for hides and skins). The remaining commodities contributed
more to the instability than what they contributed to the proceeds of exports. Coffee in our case
has a stabilizing impact (since its share in instability is less than its share in earnings) in contrast
with that of Belay (1998) that found proportional contribution of coffee in the instability to be
almost equal to its share in earnings. The particular interest on this commodity is due to its major
share in earnings. Its stability will have a strong implication for the mitigation of instabilities of
many commodities and its slight instability is likely to cause major distortion in the export
earnings due to the fact that it is a big player in the export sector of the country.
17
For the case of hides and skins the share in earnings is only marginally greater than the share in the instability.
23
Table 4.2: Estimation Results for Instability Indices
Total 1963-1991 Imperial 1963-1974 Derg 1974-1991 Post Derg 1991-200818
Instability
index
Share in
instability
Share in
earnings
Instability
index
Share in
instability
Share in
earnings
Instability
index
Share in
instability
Share in
earnings
Instability
index
Share in
instability
Share in
earnings
Coffee 2.64 45.74 54.52 0.66 16.94 52.53 2.56 53.97 61.47 3.11 42.31 48.87
Oilseeds 4.58 9.53 6.56 2.53 12.54 10.19 4.24 4.19 2.89 7.67 16.88 7.90
Hides and Skins 2.06 7.17 10.98 2.00 9.78 10.06 2.52 10.26 11.87 2.67 7.96 10.68
Pulses 4.51 7.02 4.91 3.80 15.81 8.56 2.99 3.96 3.87 7.34 7.33 3.58
Fruits and Vegetables 7.00 4.45 2.01 7.48 34.69 9.55 3.90 1.31 0.98 2.77 0.97 1.26
Others 3.86 26.09 21.33 1.39 10.24 15.19 4.06 26.31 18.93 3.18 24.55 27.71
Total19
2.16 1.00 2.26 3.24
Source: Own analysis based on NBE data
18
The estimation for this period is based on fitting of linear trend 19
This index stand for the instability index of the total export earnings computed using (4.8)

24
The post-Derg period is facing higher shares of coffee, hides and skins, and fruits and vegetable
in earnings as compared to their share in causing the instability. The shares in earnings of these
commodities are 48.87%, 10.68% and 1.26%, while their shares in the fluctuation are 42.31%,
7.96% and 0.97% respectively. During the same period oilseeds and pulses contributed more to
the instability than they do to the proceeds from their export.
In summary coffee and hides and skins consistently contributed to the stability of the earnings in
all the four cases, the entire period, imperial, Derg and post-Derg periods. Oilseeds and pulses
mostly contributed to the instability more than what they are contributing to the earnings while
fruits and vegetables marginally improve in the case of the post-Derg period.
Table 4.3 below shows the total instability index and the weighted total instability index for each
period. The total instability index is computed using the formula (4.8) following the regression of
the total export earnings on time and the computation of the index tI of equation (4.1) for the
total export earning. On the other hand the weighted total index is the sum of the instability
indexes of the constituent commodities of the export earnings weighted by their share in the total
export earnings.
Table 4.3: Total and weighted total instability indexes
Period Total Instability
Index
Weighted Total
Instability Index
Imperial 1.00 2.06
Derg 1.04 2.92
Post-Derg 3.24 3.59
Total 2.16 3.15
Source: Own computation based on NBE data
The weighted total index is greater than that of the simple total index in periods. The weighted
total‟s being greater is an expected result as it is the sum of the instability from the individual
commodities. The instability index of total export earnings on the other hand does not reflect the
fluctuation of individual commodities, rather the net-fluctuation of the total export earnings of the
country. Since instability of one commodity could be offset by the stability of the other, the index
of the total earnings is expected to be lesser than that of the weighted. In the case of Ethiopia,
25
even if most of the commodities fluctuate more wildly, the relative stability of the major
commodity, i.e. coffee, offsets the impact of the fluctuation of the total earnings.
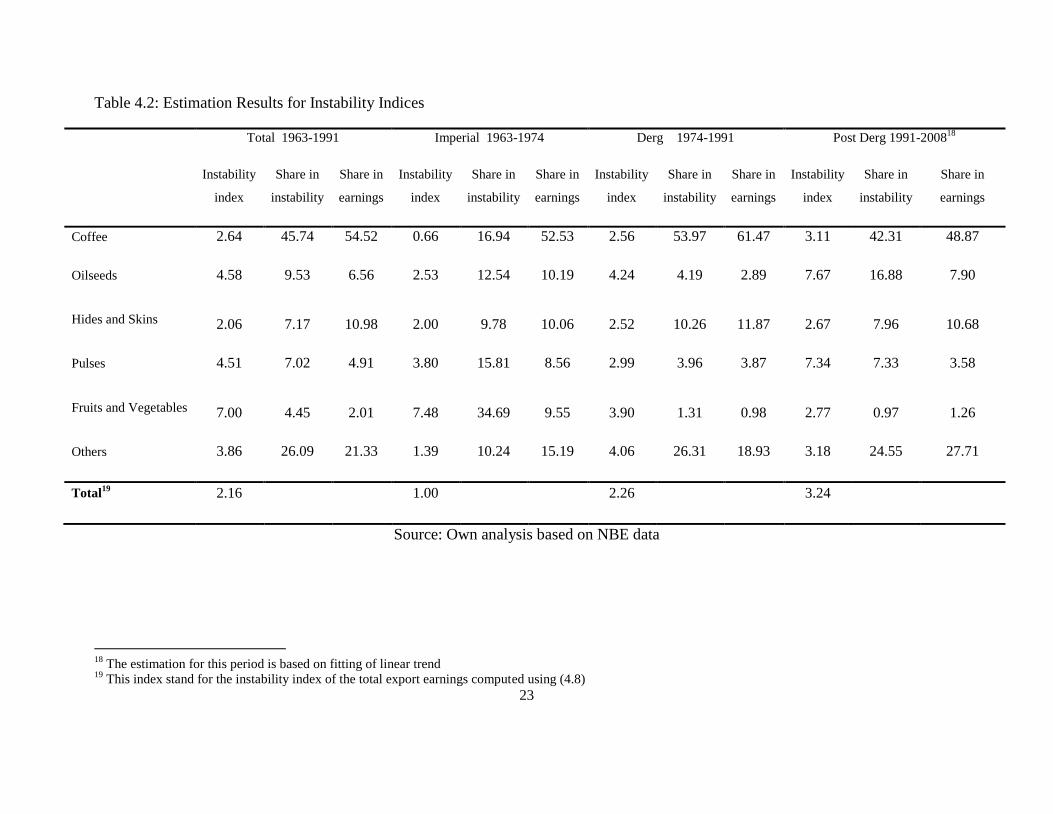
In order to explain the higher instability index for the post-Derg period, we took a look at the
difference between the share of coffee in earnings and its share in the instability over the periods
under consideration. In doing so it is found that the gap between coffee‟s share in earnings and its
share in the instability of earnings range from around 36 percentage points in the imperial era to
6.5 in the post-Derg period.
This means that the share of coffee in export proceeds was much higher than its share in the
instability during the imperial period and it is the least now. Following this we can suggest that
the coffee has lost its power to stabilize the fluctuation in earnings caused by the other
commodities since it only marginally qualifies for stabilization.
According to the framework of Abebe (1991), the instability of each export commodity is a
function of its share in earnings and the correlation between the trend-corrected export earnings
of the commodities. Negative correlation indicates the offsetting movements of the major (coffee
in our case) and the minor (the remaining) export commodities. On the other hand positive
correlations indicate that the major and the minor commodities are moving in phase, i.e. in a way
that reinforces their impact on the instability.
Taking coffee as major export and the remaining as minor, we computed the correlations between
the trend-corrected (de-trended)20 earnings of the major the minor commodities. The findings
suggest that the movement of coffee in the three periods, over-all, imperial and Derg is offsetting.
On the other hand the movement of the „major‟ and the „minor‟ export commodities in the period
that followed the Derg is in phases as indicated by the positive correlation on Table 4.4 below.
Table 4.4: Correlation between de-trended major and minor commodities
Period Total Imperial Derg Post-Derg
Correlation -0.6364 -0.3041 -0.9259 0.5550
Source: Own computation on NBE data
The reason for coffee to move from its role as stabilizer of the export earnings to marginally
qualify as stable could be due to the fact that its share dropped at a faster rate than its share in the
instability. One of attributes to the loss in share of the coffee is the diversification of the
country‟s export into other products. For example flower, which was never on the list of
20
We computed the de-trend series by taking the difference between the observed value of the export earnings and
that of the estimated trend (i.e. the de-trended series= ii xx ˆ , where ix̂ is as estimated by either equation 4.2 or 4.3)

26
Ethiopian export balance few years back, is gaining increasing share in the export earnings
account of the country. Another immerging commodity is Chat, whose share increased from
below one percent in the imperial and below 2% in the Derg to more than 9% during the post-
Derg period.
In order to test the hypothesis that the post-Derg period is the most diversified than the others, we
computed the Gini-Hirschman concentration index as employed by Abebe (1991), Xin and Liu
(2007), Malik (2007) and others.
The formula used to generate the Gini-Hirschman concentration index in above mentioned
studies as well as in the present study is:
n
it
itt X
XG
1
2
100 (4.11)
Where itX represent the export earnings from commodity i in year t while tX represent the
total export proceeds of the year t . We then computed the mean values for each period to find a
summary statistic that best describe the period in terms of its export diversification/concentration.
Table 4.5: Average Index of Export Concentration/Diversification
Period Total Imperial Derg Post-Derg
Gini-Hirschman index 57.29 56.69 63.34 51.62
Source: Own computation using NBE data
The likely values of this index are between 0 and 100. According to Malik (2007) the highest
likely value, i.e. 100, indicates that the total agricultural exports are comprised of only one
commodity. When the number, and value of goods exported increases, the value of tG will
decline. This means that when the value of tG gets lower, it indicates that export diversification
has increased.
Based on this definition, the Derg is the period where export is concentrated into fewer
commodities. The imperial period is the second, following the Derg, in terms of high export
commodity concentration. The post-Derg period is the least, among the three, with regard to
export commodity concentration. In other words, the post-Derg period faced the highest degree of
export commodity diversification as compared to the remaining two. When compared to the level
of concentration over the total period, that of the imperial and post-Derg sub-periods performed
better than the over all period wile that of the Derg is below the entire period. Even in some years
27
in the Derg sub-period, the values of tG reached as high as 88%, meaning that this much percent
of the export income is generated by a single commodity.
V. Conclusion and Policy Implication
5.1. Conclusion:
Based on our findings we conclude that the market-economy‟s economic policies performed well
in attaining export diversification, which is one of the recommended remedial of export earnings
instability, as the imperial and the post-Derg periods performed better than that of the Derg in this
regard. Despite the fact that the post-Derg period is the most diversified as compared to the
remaining two, it performed badly when it comes to stabilizing the fluctuations from the export
income. This is in direct contradiction with the policy recommendation by most literatures to
attain stability.
The source of this contradiction could be the positive correlation between the traditional exports,
i.e. coffee, oilseeds, hides and skins, pulses, and fruits and vegetable, with the newly emerging
export commodities, such as flower and chat. This means that all the major export commodities
fluctuate in a similar manner, in terms of their export proceeds. This could be explained by the
fact that most of these commodities are agricultural, and it is a known fact that agricultural
outputs in Ethiopia are highly dependent on the level of rainfall. Therefore, when output
(volume) falls due to climatic conditions, earnings from export will also fall since earning is a
function of both supply (volume) and price of export commodities.
The above analysis shows that for export to be stable, diversification should be directed towards
commodities that could be negatively correlated with the traditional exports. In other words,
diversification efforts should give attention to diversifying into non-agricultural exports, such as
manufactured goods and other non-traditional sectors as hydro-electric power.
5.2. Policy Implication:
The policy lessons to be taken from this study is that diversification by itself does not solve the
problem of export earnings instability. Diversification should be a means not an end. And when
diversifying, if we diversify with more unstable commodities or into commodities that fluctuate
in the same direction as the traditional exports, this may result in more distortion than otherwise.
The country should consider to diversifying into commodities on which it has comparative
advantage and a sustainable demand. Production of commodities that have domestic demand is
advantageous, especially to sustain production at early stages and motivate investors to enter that
particular industry. Eventually it could increase its foreign market and grow through time.

28
The policy conclusion of this study is to supplement the diversification efforts of the export
commodities with an effort to reduce the instability. And most importantly to diversify into
sectors that does not rely on rainfall, such as manufacturing and service sectors.
Stability in earnings is a function of stability of both price and volume of exports. Since Ethiopia
is a „small open economy‟, which does not have influence in the world commodity price, our
primary focus should be in stabilizing export volume, i.e. sustainable, weather independent
production. Another risk minimizing factor is geographic diversification, which insulates the
export market from fluctuations caused by shifts and/or fluctuation in demand for our exports in a
particular country or group of countries.
One additional solution to reduce the fluctuation in earnings is to enter into trading agreements
(regional trading agreements (RTA), free trade areas (FTA), custom unions etc) with countries
with which the country is trade compatible. This means to remove trade barriers through a
mutually negotiated agreement with countries that are not producing and exporting similar
products as Ethiopia. This is because trade compatible countries have demand for each others‟
products and the RTAs facilitate freer trade among the partners.
Joining the World Trade Organization (WTO) could also have similar advantage as a multilateral
trading platform, if Ethiopia manages to negotiate and inter the organization without having to
give up much of its advantages at the current status quo. But joining only is not a solution by
itself; the country should be able to increase its trading partners in the WTO for its exports.
5.3. Important Issues for Further Studies:
The present study attempted to identify which and by how much important export commodities
contribute to the instability. Determinants of the instability are beyond the scope of this study.
Other issues such as the impacts of instability on the economic growth of the country, its capital
formation and future investments, the pressure it puts on the foreign currency reserve, the nations
ability to import both capital and consumption goods, etc. are left for other parallel and future
studies.
References:
Abebe T. (1991), “Commodity Concentration and Export Earnings Instability: Evidence from
African Countries,” Center for Economic Research on Africa, Montclair State University
Akpokodje, G. (2000), “The Effect of Export Earnings Fluctuations on Capital Formation in
Nigeria,” African Economic Research Consortium, RP 103
Alemayehu Geda, (2007), “Readings on the Ethiopian Economy” Department of Economics,
Addis Ababa University, (Unprocessed).
29
Bahru Zewde, (2002), “A History of Modern Ethiopia 1855-1991”, James Currey Ltd, Oxford,
Ohio University Press, Athens and Addis Ababa University Press, Addis Ababa.
Belay K. (1998), “Instability of Ethiopia‟s Export Earnings: The Contribution of Major
Agricultural commodities,” Ethiopian Journal of Agricultural Economics 2(1) pp. 27-54
Berhanu Lakew, (2005), “Determinants of Ethiopia‟s Export Performance: An Econometric
Investigation”, Alemayehu et. al (eds). EEA/Proceedings of the Second International Conference
on Ethiopian Economy June 3-5, 2005. Ethiopia, pp 347-373
Cuddy, J.D.A. and Valle, P.A.D. (1978), “Measuring the Instability of Time Series Data,” Oxford
Bulletin of Economics and Statistics. 40: pp. 79-85
CSA (Central Statistical Agency). “Ethiopia, Statistical Abstracts” (various issues from 1963 to
2007)
CSA (2008), “Preliminary Results of the Ethiopian Population and Housing Census,”
unpublished
Devkota, S. C. (2004), “Causes of Export Instability in Nepal,” Published on
http://ideas.repec.org/p/wpa/wuwpit/0410002.html, accessed on November 19, 2009
Glezakos, C. (1973), “Export Instability and Economic Growth: A Statistical Verification,”
Economic Development and Cultural Change, 21(4), Part 1, pp. 670-678
Glezakos, C. (1984), “Export Instability and Economic Growth: Reply,” Economic Development
and Cultural Change, 32(3), pp. 615-623
Greene, W.H. (2003), “Econometric Analysis,” Upper Saddle River, New Jersey, 5th edi.
Gyimah-Brempong, K. (1991), “Export Instability and Economic Growth in Sub-Saharan
Africa,” Economic Development and Cultural Change, 39(4) pp. 815-828
http://www.ethiomarket.com/eic/ : “Ethiopian Investment Policies and Procedures”, Accessed on
December 5, 2009
Love, J. (1985), “Export instability: an alternative analysis of causes”, Journal of Development
Studies, 21, pp. 244-252.
Malik, N. (2007), “Pakistan Agricultural Export Performance in the Light of Trade Liberalization
and Economic Reforms”, University of Balochistan Quetta, Department of Commerce, Working
paper series 2007:4

30
Maddala, G.S. (2005), “Introduction to Econometrics,” John Willey & Sons, LTD, Singapore,
3rd edi.
Massell, B. F. (1964), “Export Concentration and Fluctuation in Export Earnings: A Cross-
Section Analysis,” American Economic Review, 54(2), Part 1, pp 47-63
Massell, B. F. (1970), “Export Instability and Economic Structure,” American Economic Review,
60(4), pp 618-630
Mulugeta, A. (2007), “The Effect of Export Earnings Fluctuation on Economic Growth in
Ethiopia,” M. Sc. Theses, Addis Ababa University.
Murray, D. (1978), “Export Earnings Instability: Price, Quantity, Demand?” Economic
Development and Cultural Change, 27 (1), pp. 61-73
NBE (National Bank of Ethiopia). Annual Report (various issues from 1964 to 2007)
Naya, S. (1973), “Fluctuations in Export Earnings and Economic Patterns of Asian Countries,”
Economic Development and Cultural Change, 21 (4), Part 1, pp 629-641
Salvatore, D. (1998), “International Economics,” Prentice Hall International, Inc. 6th ed.
Savvides, A. (1984), “Export Instability and Economic Growth: Some New Evidence,” Economic
Development and Cultural Change, 32(3), pp. 607-614
Sinha D, (1999), "Export Instability, Investment and Economic Growth in Asian Countries: A
Time Series Analysis," Working Papers 799, Economic Growth Center, Yale University.
Verbeek, M. (2002), “A Guide to Modern Econometrics”, John Wiley & Sons Ltd.
Wooldridge J.M. (2000) “Introductory Econometrics: A Modern Approach South-Western,”
Cincinnati.
From Wikipedia, the free encyclopedia: http://en.wikipedia.org/wiki/Derg, Accessed on April 10,
2009
Xin, X. and Liu, J. (2007), “Geographic Concentration and China‟s Agricultural Export
Instability”, Journal of World Economy, 31(2), pp. 275-285