Embed Size (px)
Citation preview

TheContributionof theUniversityof Hawai‘itoHawai‘i’sEconomyin2003
Kaua‘i Community College,University of Hawai‘i Center, Kaua‘i
University of Hawai‘i at ManoaUniversity of Hawai‘i-West O‘ahuKapi‘olani Community CollegeHonolulu Community CollegeLeeward Community College,LCC Wai‘anae Ed. CenterWindard Community CollegeEmployment Training Center
MCC Moloka‘i Ed. Center
MCC Lana‘i Ed. Center
Maui Community College,University of Hawai‘i Center, MauiMCC Hana Ed. Center
University of Hawai‘i at HiloHawai‘i Community College,
University of Hawai‘i Center, West Hawai‘i
The University of Hawai‘i System

The Contribution of the University of Hawai‘i to Hawai‘i’s Economy in 2003
Prepared by:
University of Hawai�i: Economic Research Organization
(UHERO)
March 2004
Principal investigators: James Mak and PingSun Leung
Student assistant: Michel H. L. Chan
This study was funded by the University of Hawai�i, Office of Planning and Policy and the UH Foundation.

1
The Contribution of the University of Hawai‘i to Hawai‘i’s Economy in 2003
University of Hawai‘i: A Brief History
The University of Hawai�i had its beginnings in 1907 as a college of agriculture
and mechanical arts and became the territory�s Land Grant College, a designation that
remains today. With the establishment of the College of Arts and Sciences in 1920, the
College of Hawai�i became a University. Enrollment growth in the early years was slow,
but the close of World War II and increased educational demand fueled by returning GI�s
increased the University�s enrollment to over 5,000 students in the 1950s. Statehood and
the establishment of the University of Hawai�i as the �state university� marked the
beginning of a period of accelerating enrollment that resulted in the formation of a large
diverse system. In 1965, the State Legislature created a statewide system of community
colleges and placed it within the University of Hawai�i. In 1970, the University of
Hawai�i at Hilo was founded. In 1989, West O�ahu College, an upper division institution
opened in 1976, was renamed the University of Hawai�i-West O�ahu. The flagship
Mānoa campus became the University of Hawai�i at Mānoa.
The University was designated a Sea Grant College in 1972 and a Space Grant
College in 1989, and currently is one of only twelve universities in the United States to
have received all three designations. In the decade after statehood, the University of
Hawai�i at Mānoa achieved national recognition both in graduate education and research.
It shares distinction among 70 American institutions designated Carnegie I Research
University by the Carnegie Foundation for the Advancement of Teaching. Striving for
economic development was an important reason why the State of Hawai�i wanted a

2
Carnegie I Research University.1 As the economic development of the state has become
increasingly dependent on knowledge and technology, government and industry have
increasingly looked to the University as an essential partner to conduct basic and applied
research in numerous key areas, such as agriculture, aquaculture, astronomy, medicine,
biotechnology, ocean resources, renewable energy, travel industry management, and
others. Research brings extramural money into the economy.
Today, the University of Hawai�i system is comprised of 10 campuses�seven
community colleges (four on O�ahu and one each on Kaua�i, Maui, and Hawai�i),
University of Hawai�i at Mānoa, University of Hawai�i at Hilo, and the University of
Hawai�i at West O�ahu. In Fall 2002, enrollment of credit students totaled 48,173,
distributed by campus as follows:
Campus Number of Students Mānoa 18,706 Hilo 3,040
West O�ahu 834 Community Colleges: 25,593
Honolulu 4,478 Kapi�olani 7,041 Leeward 5,918 Windward 1,761 Hawai�i 2,182 Maui 2,989
Kaua�i 1,224
Eighty-seven percent of the credit students were undergraduates; the remaining 13
percent were graduate students. Hawai�i residents comprised nearly 82 percent of all
credit students enrolled at the University of Hawai�i campuses. The community colleges
enrolled more than half (53 percent) of all the students in the system.
1 In 2000, the Carnegie Foundation for the Advancement of Teaching designation for this category of universities changed to �Doctoral/Research Universities�Extensive.�

3
The University of Hawai�i serves a large percentage of college-bound Hawai�i
high school graduates. In 2000, the most recent data available, 59 percent of that year�s
high school graduates went to college right after graduation, and 60 percent of them went
to one of the ten campuses of the University of Hawai�i. Among Hawai�i colleges and
universities, UH was the choice of 87 percent of the college-bound graduates who
remained in Hawai�i. While UH may not be the only higher education �game in town�, as
often claimed, it is by far the biggest higher education game in town.
In addition to educating the 48,000 regular session credit students, in FY 2003
more than 20,000 students enrolled in the University of Hawai�i summer sessions.2 The
Mānoa campus led all campuses in summer session enrollment with nearly 60 percent of
the total. As well, each year thousands of students take credit and non-credit continuing
education courses offered by the University�s various campuses for personal growth and
enjoyment. The task of teaching thousands of students each year, to conduct research at
the knowledge frontier, and to serve the needs of the community are assigned to nearly
15,000 University employees including lecturers, graduate assistants and other student
employees; about 3,300 are faculty. The UH system generated more than $1.4 billion
worth of spending in FY2003.
UH: A Major Economic Sector in Hawai‘i
Indeed, one can think of the UH system as if it were one of many businesses or
industries in Hawai�i. It produces education and research services as its primary outputs.
In addition, it produces entertainment and sports services, consulting services, health
care, housing, and food services. Its customers include students, visitors, private 2 A summer session student was counted twice if he/she was enrolled in both Manoa summer sessions.
4
businesses, governments, and the general public. Significant portions of its services are
exported worldwide to students, businesses, governments, and individuals abroad. It buys
goods and services locally and abroad. In FY 2003, student spending (system-wide) for
tuition, room and board, and other expenses; state and federal government-funded UH
spending for goods and services; out-of-state visitor spending while attending UH
sporting events and UH-sponsored conferences and professional meetings, totaled $1.403
billion. UH is approaching a billion and a half dollar business!
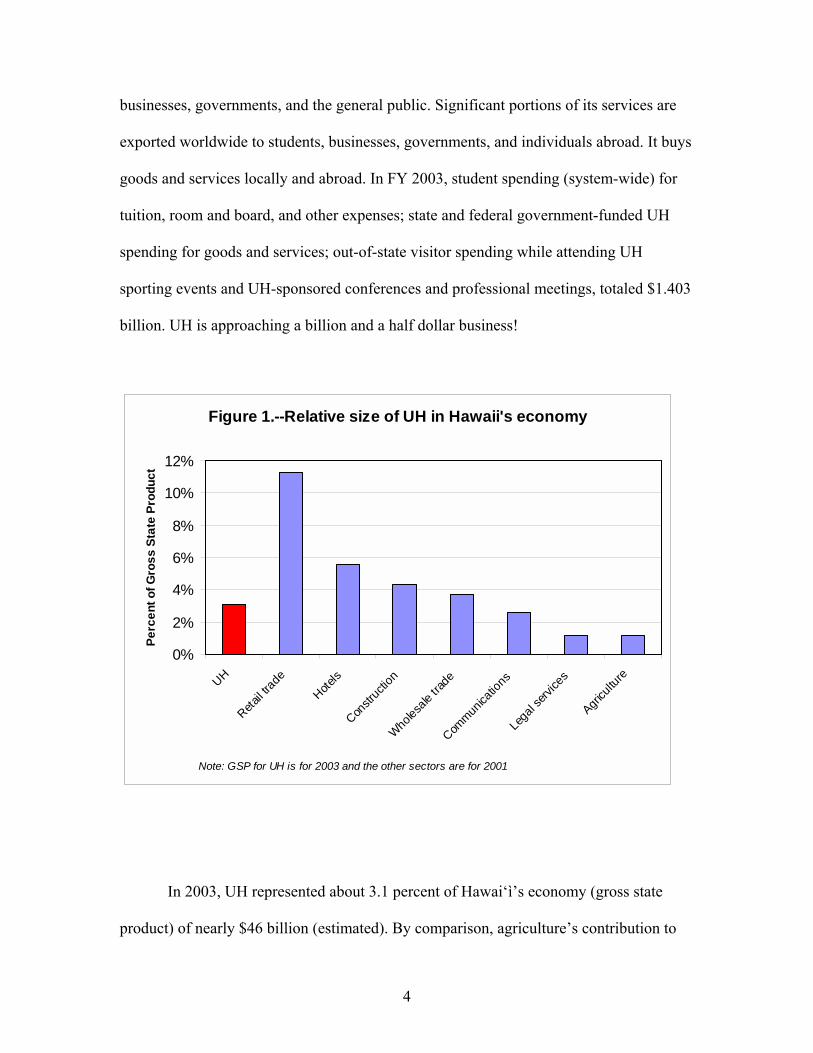
Figure 1.--Relative size of UH in Hawaii's economy
0%
2%
4%
6%
8%
10%
12%
UH
Retail t
rade
Hotels
Constr
uctio
n
Wholes
ale tra
de
Commun
icatio
ns
Lega
l serv
ices
Agricu
lture
Perc
ent o
f Gro
ss S
tate
Pro
duct
Note: GSP for UH is for 2003 and the other sectors are for 2001
In 2003, UH represented about 3.1 percent of Hawai�ì�s economy (gross state
product) of nearly $46 billion (estimated). By comparison, agriculture�s contribution to

5
Hawai�i gross state product was only 1.2 percent; the communications industry, 2.6
percent; hotels, 5.6 percent; legal services, 1.2 percent; wholesale trade, 3.7 percent; retail
trade, 11.2 percent; and construction, 4.3 percent. Thus, the University of Hawai�i is a
major economic sector in Hawai�i.
Creating Jobs and Generating Income
An important difference between the University of Hawai�i and a private business
is that the University gets a substantial part of its funding from taxpayers. In FY 2003, the
University of Hawai�i system spent $989 million, net of spending and internal accounting
transfers between units within the University, in support of its educational mission; the
State General Fund paid $454 million of the total. The difference between what the State
General Fund paid for and the total amount spent by the University ($989 million - $454
million = $535 million) was paid for by government research and training grants,
revolving funds (e.g., bookstore revenues), special funds (e.g., tuition and fees), and
federal matching grants (e.g., U.S. Department of Agriculture Hatch and Smith-Lever
funds). Adding money spent by the privately funded University of Hawai�i Foundation,
the Research Corporation of the University of Hawai�i (RCUH), spending by students on
items other than tuition, fees, dorm fees, and books3, out-of-town visitor spending on UH
athletic events (e.g., football, baseball, basketball, volleyball games, etc.) and
UH-sponsored professional meetings and conferences, and University employee retiree
benefits brings total UH-related expenditures to $1.403 billion in FY2003. Thus, for
every dollar of taxpayer money spent on UH, the University was able to generate an
3 Money spent by students for tuition, fees, dorm fees, and books were received and spent by the University and show up in the UH system expenditure data. They were excluded to avoid double counting.

6
additional $2.09 (=[($1.403 billion/$.454 billion) � 1] ) of spending for a total of $3.09.
In sum, the University is a generator of spending and economic activity in and of itself.
The University of Hawai�i generates economic activity in the community through
its purchases from local businesses, its payment to its employees and retirees, and
spending by its students and visitors. The total amount of economic activity generated in
Hawai�i can be estimated using the state�s 1997 input-output (I-O) model of Hawai�i�s
economy. The model is able to quantify the economic activity impacts of UH
expenditures on 20 industries. We first distributed the $1.403 billion spending among the
20 I-O sectors; then we multiplied the expenditures by their respective type II
�multipliers� to arrive at their total sales, employment, and earnings impacts. The type II
multipliers capture the direct, indirect, and induced effects per dollar of spending in each
of the 20 sectors of Hawai�i�s economy.4
4 To illustrate the relationship between �direct,� �indirect,� and �induced� effects, consider the following example. I spend $10 at a local grocery store; the �direct effect� of my expenditure on business sales in the economy is the $10 received by the grocery store. In turn, the grocery store purchases $5 worth of goods from its wholesaler. The �indirect� effect of my grocery purchase is the additional sale in the economy by the wholesaler to the grocery store. Both the grocery store and the wholesaler pay their employees, and with their pay the employees purchase goods and services in the economy. These are the �induced� effects. Similarly, the grocer and wholesaler pay rent, interest on loans, and take home profits; those incomes are eventually spent in the economy as well. Type II multipliers capture the �multiplier,� or sometimes referred to as the �ripple,� effects of any initial spending.

7
Table 1: Multiplier Effects Per Dollar of UH-Related Expenditures
Note: Due to unavailability of updated information, visitor spending and retiree benefits in FY 2003 are assumed to be the same as in FY1999, except for an adjustment for inflation.
Table 1 shows that each educational dollar spent generates $1.41 of total business
sales, $.89 of employee earnings, and 9 cents of state revenues in Hawai�i in FY 2003;
and each million dollars of spending generates 26 jobs in Hawai�i. Not all the dollars
spent have the same impact on the economy. For instance, Table 1 shows that dollars
spent by organized research units have higher employment effects (per dollar of
spending) than dollars spent by the instructional units, but instructional units have larger
household earnings effects.
Overall, the $1.403 billion of education-related expenditures attributable to
the UH system generated $1.973 billion in local business sales, $1.243 billion in
employee earnings, $132 million in state tax revenues, and 35,800 jobs in Hawai‘i in
FY 2003. They represented approximately 4.6 percent of total jobs, 3.2 percent of
Amount (�000$)
Business Sales per
$ of Spending
Jobs per Million $
of Spending
Earnings per $ of
Spending
State Taxes per
$ of Spending
Total Expenditures 1,403,436 1.41 26 .89 0.09
Organized Research (ORS)
309,427 1.51 32 1.01 0.10
Instructional Units (Non-ORS)
679,925 1.31 28 1.06 0.10
UH Foundation 17,982 1.19 17 .69 0.08 RCUH 3,898 1.39 26 .95 0.10 Student Spending 255,285 1.45 15 .34 0.08 Visitor Spending 76,291 1.60 18 .46 0.10 Retiree Benefits 60,628 1.56 17 1.22 0.12

8
worker earnings, and 3.8 percent of total state tax revenues in the economy of
Hawai‘i.
These numbers can also be used to illustrate the leverage effects of State General
Fund higher education spending on the local economy (Figure 2).
Figure 2.--$454 Million General Fund Expenditures Generates $950 Million Additional Direct Spending
General Fund Spending$ 454 million
Additional UH Related Spending $950 million
Total Spending $1,403 million
In FY 2003, UH was able to parlay $454 million in General Fund expenditures into $950
(= $1,403 million � $454 million [rounded]) million dollars of related educational
expenditures.

9
In Table 2, every dollar of general fund spending on UH translates into $4.35 of
total business sales, $2.74 of employee earnings, and 29 cents of state taxes in Hawai�i.5
Every $1 million of general funds spent on UH generates 79 jobs in the economy.
Table 2 .-- Economic Impacts of the UH System & Related Expenditures, FY 2003
Source of Expenditure Direct
Expenditures ('000 $)
Business Sales
('000$)
Employment
(jobs)
Income ('000 $)
State Tax ('000 $)
UH System 989,352 1,358,437 29,202 1,031,945 99,375 UH Foundation 17,982 21,444 310 12,408 1,357 RCUH 3,898 5,417 102 3,717 383 Student Spending 255,285 370,956 3,785 85,676 16,797 Visitor Spending 76,291 121,882 1,398 35,112 7,409 Retiree Benefits 60,628 94,469 1,018 73,841 6,990 TOTAL 1,403,436 1,972,605 35,814 1,242,699 132,310
Impact per $ of General Fund 3.09 4.35 79 2.74 0.29 Impact as a % of State Total 4.59 3.19 3.83
5 $4.35 is calculated by dividing $1.972billion of total business sales by $454 million appropriated from the State General Fund. Similarly, $2.74 of employee earnings and $0.29 of state tax revenues are calculated by dividing $1.243 billion in employee earnings and $132 million in tax revenues, respectively, by $454 million appropriated from the State General Fund.
10
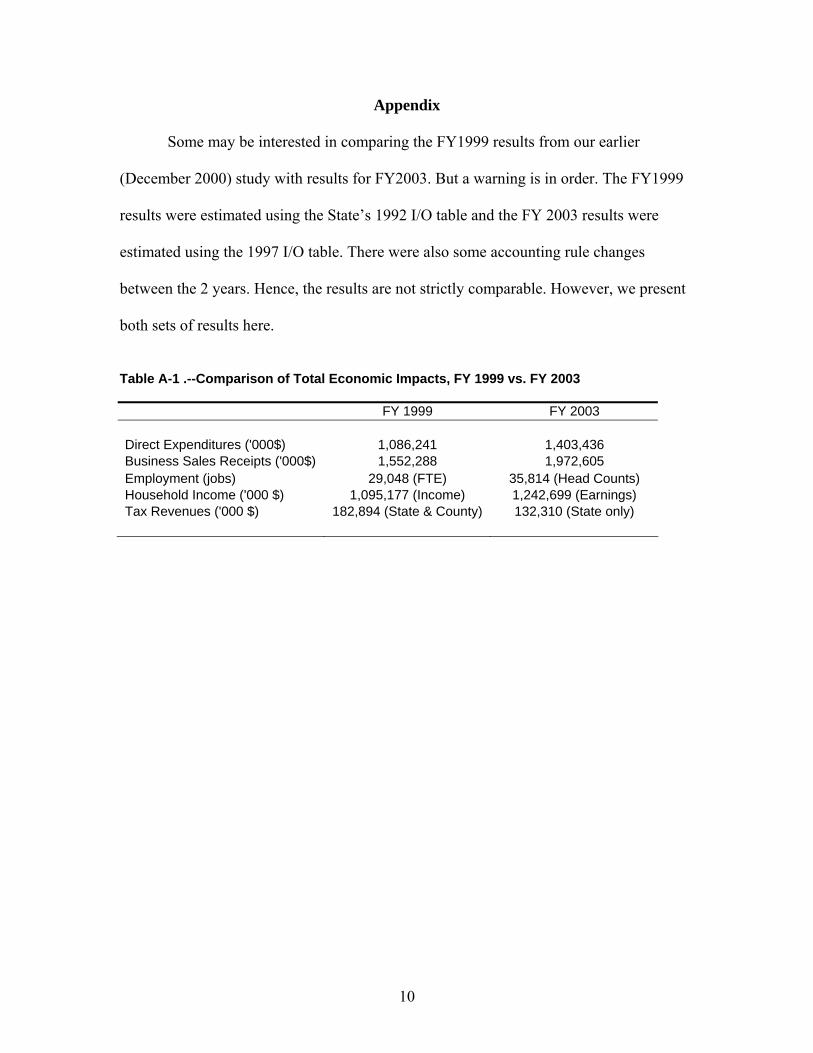
Appendix
Some may be interested in comparing the FY1999 results from our earlier
(December 2000) study with results for FY2003. But a warning is in order. The FY1999
results were estimated using the State�s 1992 I/O table and the FY 2003 results were
estimated using the 1997 I/O table. There were also some accounting rule changes
between the 2 years. Hence, the results are not strictly comparable. However, we present
both sets of results here.
Table A-1 .--Comparison of Total Economic Impacts, FY 1999 vs. FY 2003
FY 1999 FY 2003
Direct Expenditures ('000$) 1,086,241 1,403,436 Business Sales Receipts ('000$) 1,552,288 1,972,605 Employment (jobs) 29,048 (FTE) 35,814 (Head Counts) Household Income ('000 $) 1,095,177 (Income) 1,242,699 (Earnings) Tax Revenues ('000 $) 182,894 (State & County) 132,310 (State only)