Embed Size (px)
Citation preview

WINDSOR UNIVERSITYSCHOOL OF MEDICINE
Cardio Vascular Physiology
Electrical activity
& Electrocardiography
Dr. Samuel Taiwo AlawodeVishal Surender.MD.
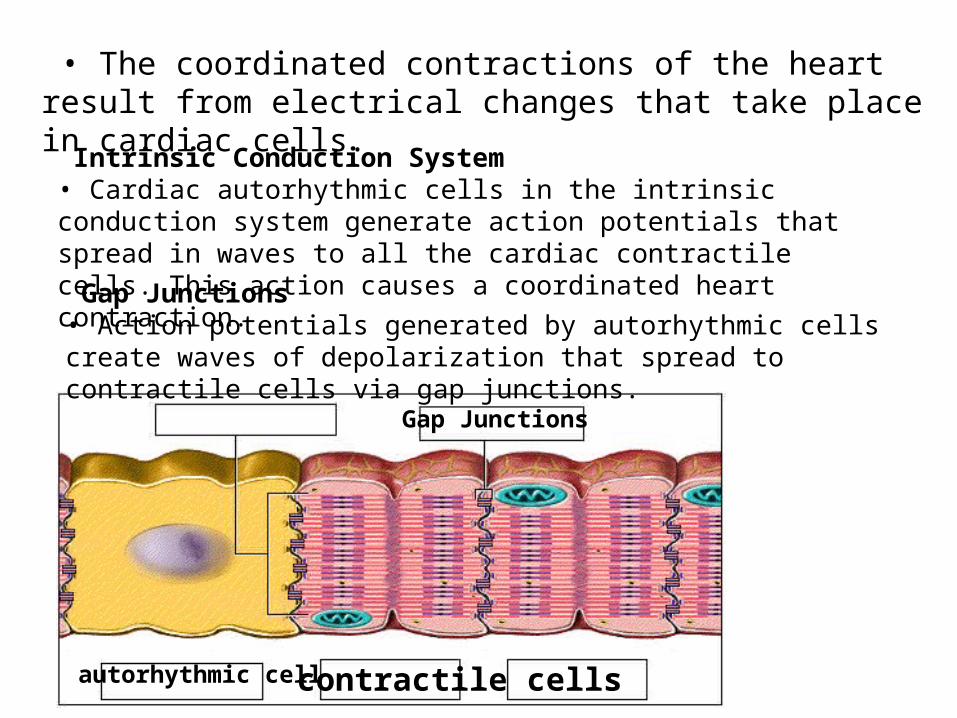
• The coordinated contractions of the heart result from electrical changes that take place in cardiac cells.
Intrinsic Conduction System • Cardiac autorhythmic cells in the intrinsic conduction system generate action potentials that spread in waves to all the cardiac contractile cells. This action causes a coordinated heart contraction.
Gap Junctions • Action potentials generated by autorhythmic cells create waves of depolarization that spread to contractile cells via gap junctions.
autorhythmic cell contractile cells
Gap Junctions
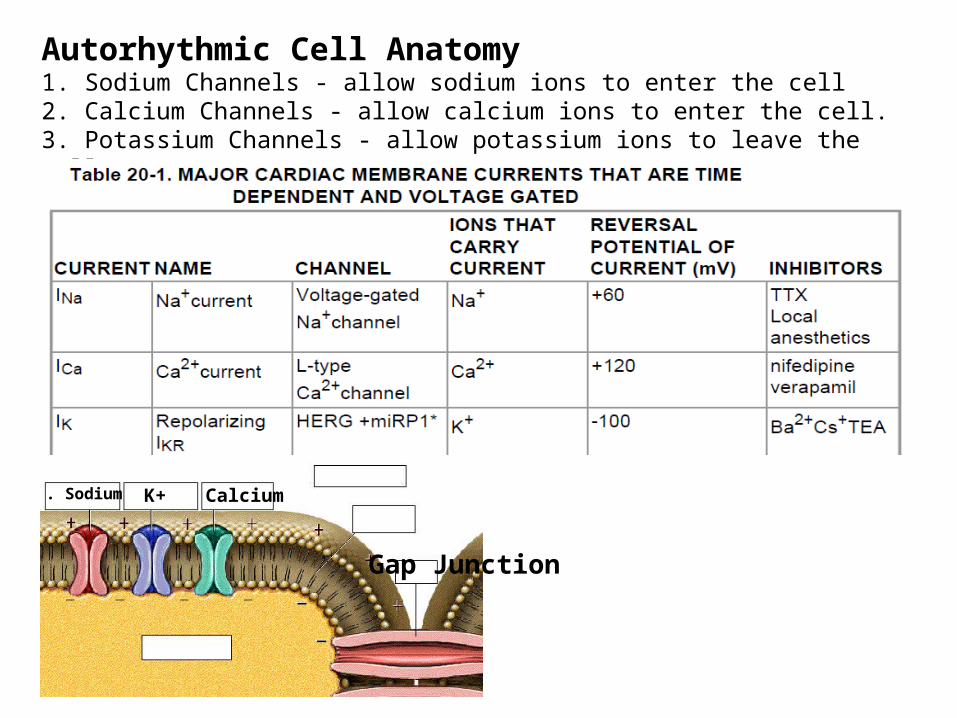
Autorhythmic Cell Anatomy 1. Sodium Channels - allow sodium ions to enter the cell 2. Calcium Channels - allow calcium ions to enter the cell. 3. Potassium Channels - allow potassium ions to leave the cell.
. Sodium K+ Calcium
Gap Junction
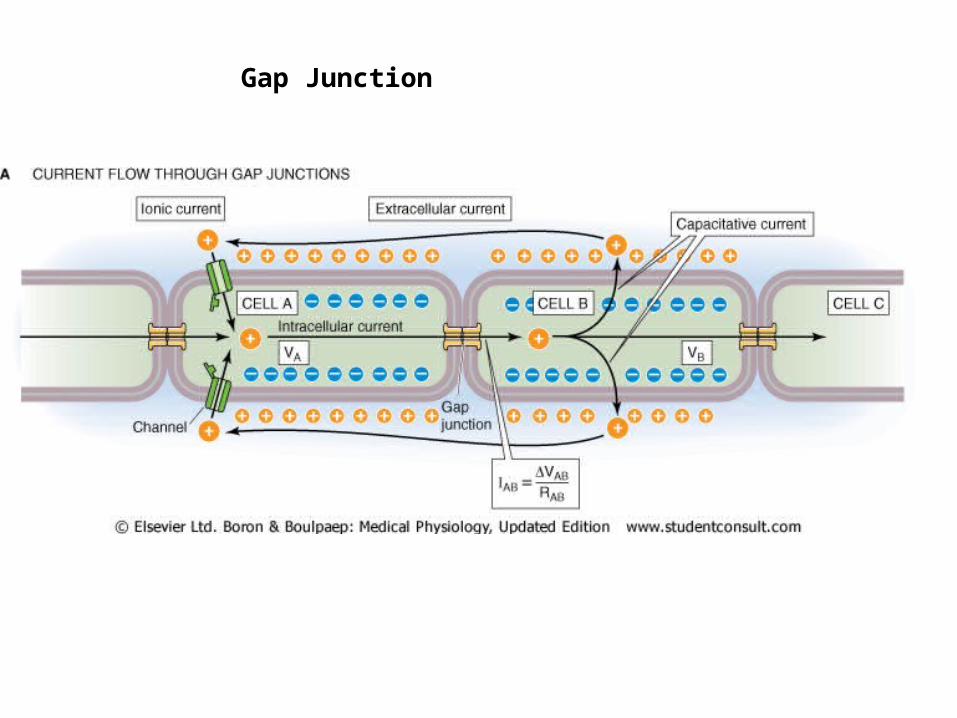
Gap Junction

Action Potentials in Cardiac Autorhythmic Cells(ex:-SA node)
Myocardial Autorhythmic Cells Generate action potentials spontaneously in the absence of input from the nervous system. This ability results from their unstable membrane potential, which starts at -60 mV and slowly drifts upward toward threshold. This unstable membrane potential is called a pacemaker potential rather than a resting membrane potential because it never "rests" at a constant value. Whenever a pacemaker potential depolarizes to threshold, the autorhythmic cell fires an action potential.

The speed with which pacemaker cells depolarize determines the rate at which the heart contracts (the heart rate),SA node-Pacemaker.
The effects of the autonomic nervous system on heart rate are called chronotropic effects.
Regulation of the Heart RateHR is controlled by the ANS: both parasympathetic (PS) and sympathetic nerves.

Contractile Cell Anatomy • The cardiac contractile cell relies on the autorhythmic cell to generate an action potential and pass the impulse down the line before the cell can contract. • Like the autorhythmic cell, it has ion transport channels, but they are slightly different. • Gap junctions link autorhythmic and contractile cells, and link contractile cells with each other. • Notice the sarcoplasmic reticulum (SR), which is a storage site for calcium. Channels within the SR membrane allow calcium ions to be released within the cell. • The myofilaments are the contractile units of the cardiac muscle cell.
Fast Na+ K+ Slow Ca+
SR

Myocardial Contractile CellsAction potential of a cardiac contractile cell
Phase Membrane channels
PX = Permeability to ion X
+20
-20
-40
-60
-80
-100Mem
bran
e po
tenti
al (m
V) 0
0 100 200 300Time (msec)
PK and PCa
PNa
PK and PCa
PNa
Na+ channels openNa+ channels close Ca2+ channels open; fast K+ channels closeCa2+ channels close; slow K+ channels openResting potential
12
30
4 4
01234
The action potentials ofmyocardial contractile cells are similar in several ways to those of neurons and skeletal muscle.
The main difference between the action potential of the myocardial contractile cell and that of a skeletal muscle fiber or a neuron is that in the myocardial cell, there is a longer action potential due to Ca2+ entry.

Myocardial Contractile CellsPhase 4: resting membrane potential. Myocardial contractile cells have a stable resting potential of about -90 mV.
Phase 0: depolarization. When a wave of depolarization moves into a contractile cell the membrane potential becomes more positive. Voltage-gated Na+ channels open, Na+ enter the cell and rapidly depolarize it. The membrane potential reaches about +20 mV before the Na1 channels close.
Phase Membrane channels
PX = Permeability to ion X
+20
-20
-40
-60
-80
-100Mem
bran
e po
tenti
al (m
V)
0
0 100 200 300Time (msec)
PNa
PNa
Na+ channels openNa+ channels close
1
0
01

Myocardial Contractile Cells
Phase Membrane channels
PX = Permeability to ion X
+20
-20
-40
-60
-80
-100Mem
bran
e po
tenti
al (m
V) 0
0 100 200 300Time (msec)
PK and PCa
PNa
PNa
Na+ channels openNa+ channels close Ca2+ channels open; fast K+ channels close
12
0
012
Phase 1 Initial Rapid Repolarization
The opening of the voltage gatedK + channels causes K + to flow out of the cell through the outward rectifier channel. This outward current starts to repolarize the cell. The membrane potential is partiallyrepolarized to just above zero.

Myocardial Contractile Cells
Phase Membrane channels
PX = Permeability to ion X+20
-20
-40
-60
-80
-100
Mem
bran
e po
tenti
al (m
V) 0
0 100 200 300Time (msec)
PK and PCa
PNa
PK and PCa
PNa
Na+ channels openNa+ channels close
Ca2+ channels open; fast K+ channels closeCa2+ channels close; slow K+ channels open
12
30
0123
Phase 2: the plateau.Due to result of two events: 1)a decrease in K+ permeability and 2)an increase in Ca2t permeability.
The combination of Ca2+ influx and decreased K+ efflux causes the action potential to flatten out into a plateau

Phase Membrane channels
PX = Permeability to ion X+20
-20
-40
-60
-80
-100Mem
bran
e po
tenti
al (m
V) 0
0 100 200 300Time (msec)
PK and PCa
PNa
PK and PCa
PNa
Na+ channels openNa+ channels close
Ca2+ channels open; fast K+ channels closeCa2+ channels close; slow K+ channels openResting potential
12
30
4 4
01234
Phase 3: rapid repolarization. The plateau ends when Ca2+ channels close and K+ permeability increases once more. The "slow" K1 channels responsible for this phase are similar to those in the neuron.
When the slow K+ channels open, K+ exits rapidly, returning the cell to its resting potential (phase 4).

The longer myocardial action potential helps pre vent the sustained contraction called tetanus

Figure 14-17
Electrical Conduction in Myocardial Cells

Electrical Conduction in Heart
THE CONDUCTING SYSTEMOF THE HEART
SA nodeAV node
Purkinjefibers
Bundle branches
A-V bundle
AV node
Internodalpathways
SA node
SA node depolarizes.
Electrical activity goesrapidly to AV node viainternodal pathways.
Depolarization spreadsmore slowly acrossatria. Conduction slowsthrough AV node.
Depolarization movesrapidly through ventricularconducting system to theapex of the heart.
Depolarization wavespreads upward fromthe apex.
1
4
5
3
2
1
4
5
3
2
1
Purple shading in steps 2–5 represents depolarization.
Why is it necessary to direct the electrical signals through the AV node? Why not allow them to spread downward from the atria?
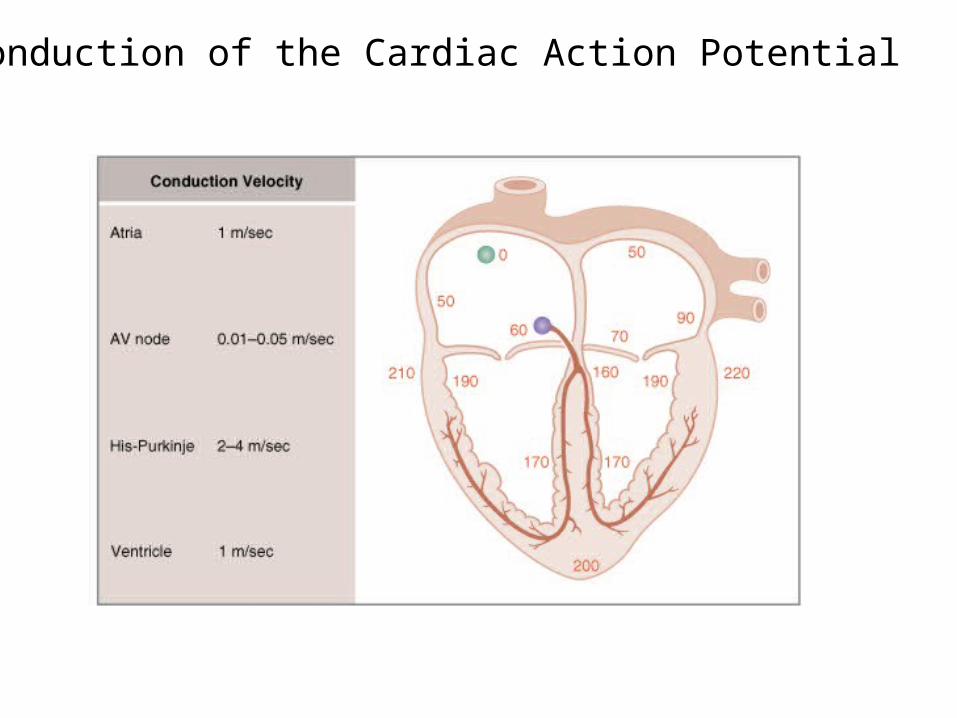
Conduction of the Cardiac Action Potential

FIBRILLATION If myocardial cells contract in a disorganized manner-fibrillation results. Atrial fibrillation –Not a immediate emergency condition.Ventricular fibrillation,- is an immediately life-threatening emergency.*Treatement-electrical shock to the heart. The shock creates a depolarization that triggers action potentials in all cells simultaneously, coordinating them again.

Electrical Conduction
• AV node– Direction of electrical signals – Delay the transmission of action potentials
• SA node– Set the pace of the heartbeat at 70 bpm– AV node (50 bpm) and Purkinje fibers (25-
40 bpm) can act as pacemakers under some conditions

Complete heart block-The conduction of electrical signals
from the atria to the ventricles through the AV node is disrupted. The SA node fires at its rate of 70 beats per minute, but those signals never reach the ventricles. So the ventricles coordinate with their fastest pacemaker. Because ventricular autorhythmic cells discharge only about 35 times a minute, the rate at which the ventricles contract is much slower than the rate at which the atria contract.
If ventricular contraction is too slow to maintain adequate blood flow, it may be necessary for the heart's rhythm to be set artificially by a surgically implanted mechanical pacemaker. These battery-powered devices artificially stimulate the heart at a pre determined rate.

Electrocardiography-ECG/EKG
Is a transthoracic interpretation of the electrical activity of the heart over time captured and externally recorded by skin electrodes. It is a noninvasive recording produced by an electrocardiographic device

Electrocardiography: Introduction • Body fluids are good conductors (the body is a volume conductor) Fluctuations in potential (action potentials of myocardial fibers) can be recorded extracellularly with surface electrodesplaced on the skin
• The record of these potential fluctuations during the cardiac cycle is the electrocardiogram (ECG).
• The ECG provides information on: -
- Heart rate and rhythm - The pattern of electrical activation of the atria and ventricles - The approximate mass of tissue being activated - Possible damage of the heart muscle - Possible changes in the body’s electrolyte composition

Electrocardiography:
-ECG is a complex recording representing the overall spread of activity throughout the heart during depolarization and repolarization.
- The recording represents comparisons in voltage detected by electrodes at two different points on body surface, not the actual potential.

ECG graph paper• Paper moves at a speed of 25mm/second• At this speed• Each horizontal small cube represents 0.04 seconds• Each vertical small- 0.1 mv• Large cube- horizontal- 0.2 seconds• Large cube- vertically- 0.5 mv


•Important features of the ECG are the P wave, the QRS complex and T wave.•Relevant intervals and segments are the PR interval, the RR interval, the QT segment and the ST segment.

P wave: Atrial depolarization as recorded from the surface of thebodyP – R interval: Time taken for the wave of depolarization to move throughthe atria, AV node, bundle of His, Purkinje fibres to theventricular myocardium.QRS complex: Depolarization of the ventricles.ST segment: Marks the end of the QRS complex and the beginning ofthe T wave. It occurs when the ventricular cells are in theplateau phase of the action potential (i.e. there is no changein potential occurring and so the ECG baseline is at zeropotential)T wave: Repolarization of the ventricles (due to potential changesoccurring during phase 3 of the cardiac action potential)Q – T interval: Period during which ventricular systole occursR – R interval: This time is usually used to calculate the heart rate.

Waves and normal values
• P wave- Atrial depolarization 0.1 seconds 0.25 milli volts• PR interval- AV nodal delay 0.12 seconds- 0.2 seconds• QRS complex- ventricular depolarization 0.1-0.11 seconds

ECG intervalsIntervals Normal Duration(s)
Average RangeEvents on the heart during intervals
PR interval1 0.182 0.12-0.20 Atrial depolarization and conduction through AV node
QRS duration 0.08 to 0.10 Ventricular depolarization and atrial repolarization
QT interval 0.40 to 0.43 Ventricular depolarization plus ventricular repolarization
ST interval (QT-QRS)
0.32 … Ventricular repolarization
1Measured from the beginning of the P wave to the beginning of the QRS complex 2Shortens as heart rate increases from average of 0.18 at a rate of 70 beats/min to 0.14 at a rate of 130 beats/min

Fig. 2. Principles of the bipolar recording of an action potential

Recording the Electrocardiogram. Basic concept
When the wave of depolarization moves toward the positive electrode, an upward deflection is recorded, whereas depolarization moving in the opposite direction produces a negative deflection
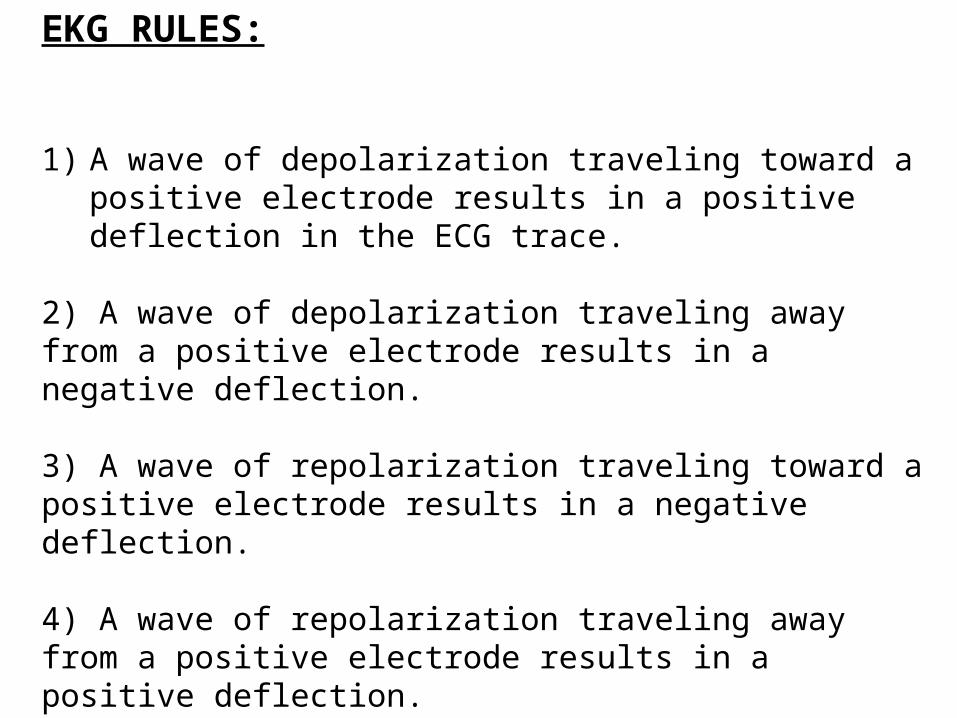
EKG RULES:
1) A wave of depolarization traveling toward a positive electrode results in a positive deflection in the ECG trace.
2) A wave of depolarization traveling away from a positive electrode results in a negative deflection.
3) A wave of repolarization traveling toward a positive electrode results in a negative deflection.
4) A wave of repolarization traveling away from a positive electrode results in a positive deflection.

EKG RULES: continued
5)A wave of depolarization or repolarization traveling perpendicular to an electrode axis results in a biphasic deflection of equal positive and negative voltages (i.e., no net deflection).
6) The instantaneous amplitude of the measured potentials depends upon the orientation of the positive electrode relative to the Mean QRS vector.
7)The voltage amplitude is directly related to the mass of tissue undergoing depolarization or repolarization.


Fig. 11. The basic direction of electrical conduction through the heart
Electrical Vectors

How the polarity of the waveform depends on the position of the recording electrodes relative to the heart.
The effect of changing electrode position on the wave form recorded.

EKG Leads
Leads are electrodes which measure the difference in electrical potential between either:
1. Two different points on the body (bipolar leads)
2. One point on the body and a virtual reference point with zero electrical potential, located in the center of the heart (unipolar leads)
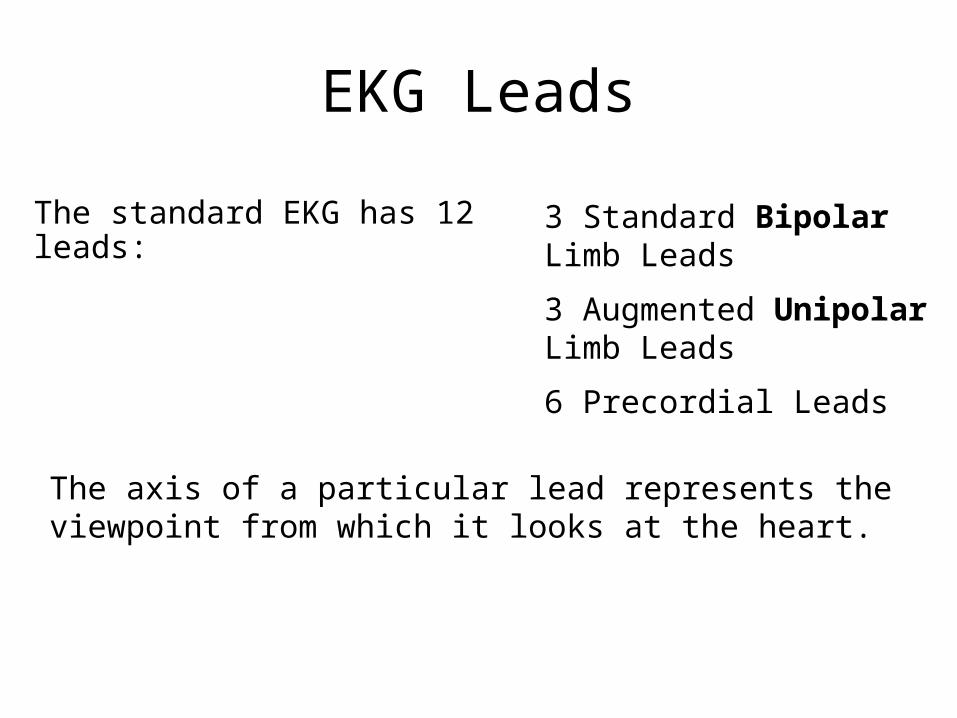
EKG Leads
The standard EKG has 12 leads: 3 Standard Bipolar Limb Leads
3 Augmented Unipolar Limb Leads
6 Precordial Leads
The axis of a particular lead represents the viewpoint from which it looks at the heart.

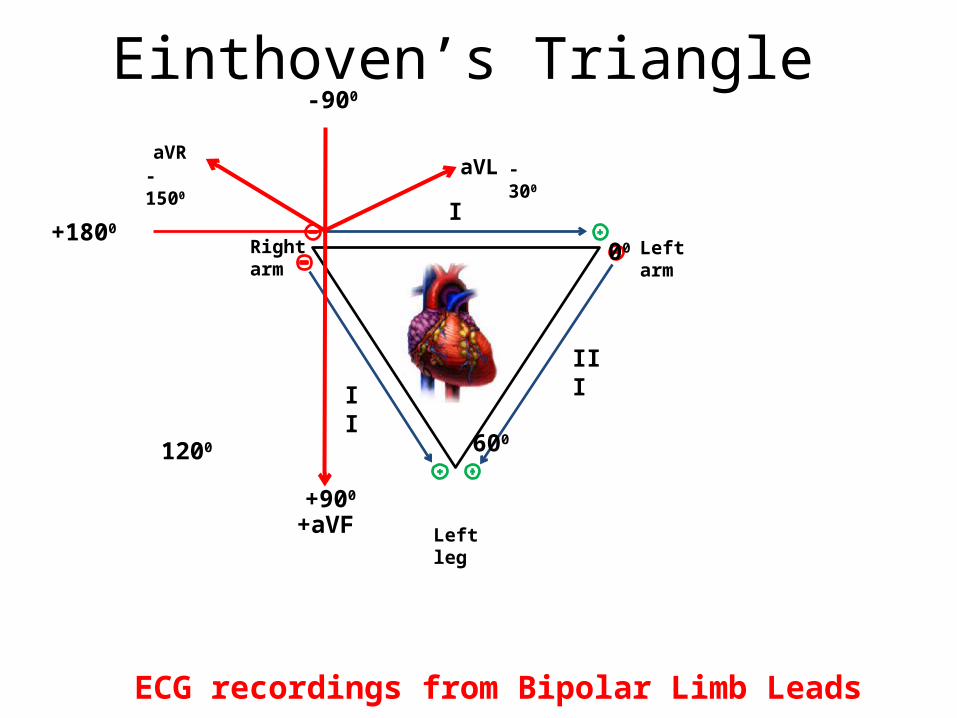
ECG recordings from Bipolar Limb Leads

ECG recordings from Bipolar Limb Leads
Right arm
Left arm
Left leg
I
II III
ECG recordings from Bipolar Limb Leads
Right arm
Left arm
Left leg
I
Einthoven’s Triangle
1200 600
00
III
II
+900
-900
+1800
aVL -300aVR
-1500
+aVF
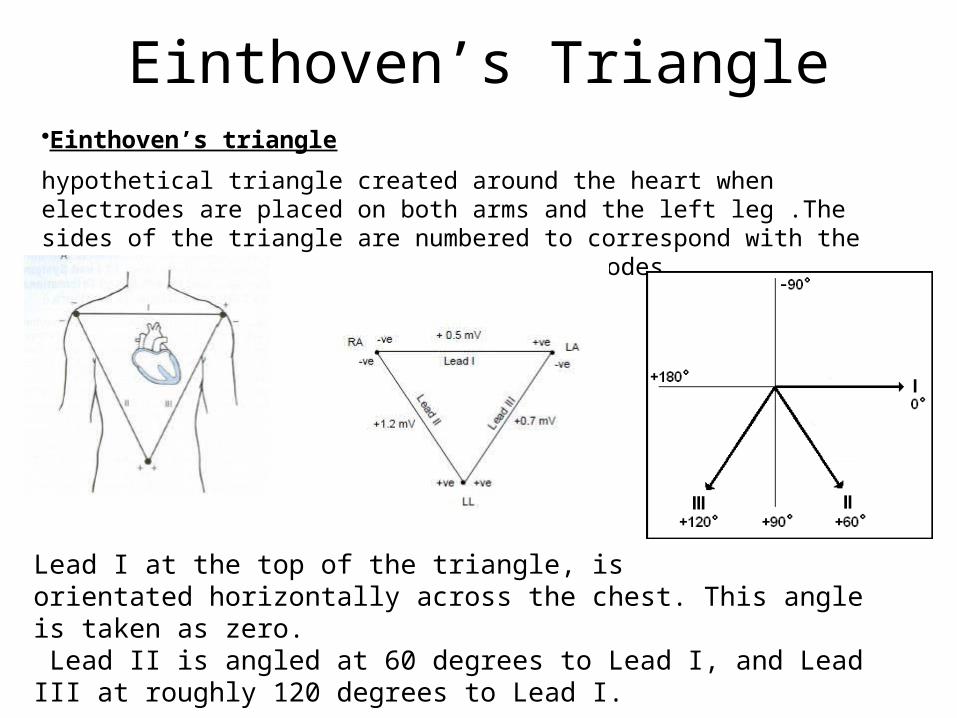
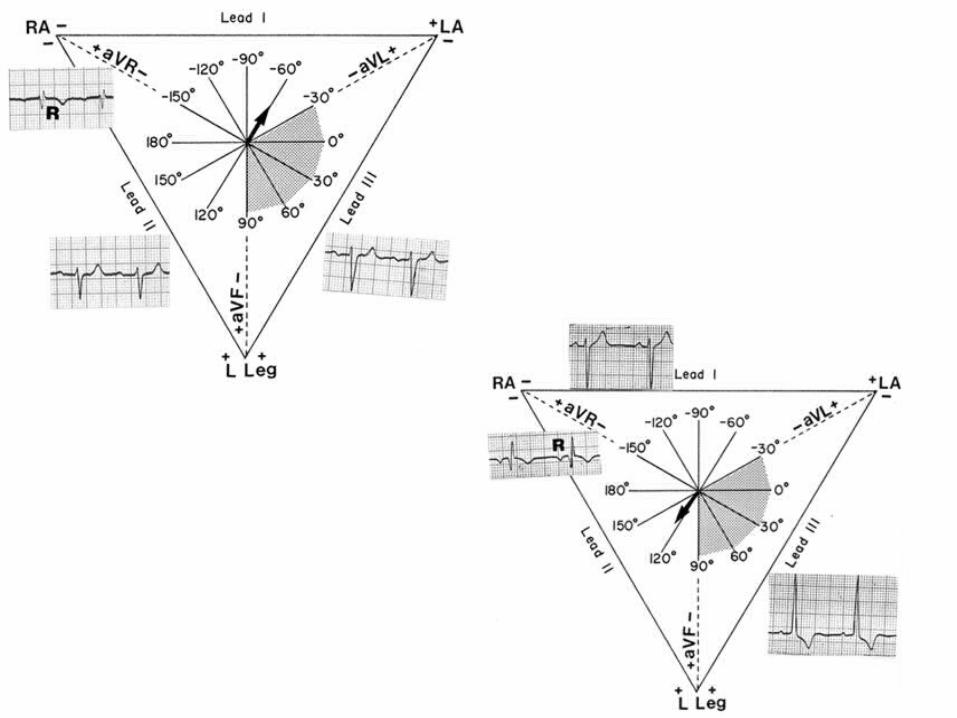
Einthoven’s Triangle•Einthoven’s triangle
hypothetical triangle created around the heart when electrodes are placed on both arms and the left leg .The sides of the triangle are numbered to correspond with the three leads ("leeds"), or pairs of electrodes.
Lead I at the top of the triangle, isorientated horizontally across the chest. This angle is taken as zero. Lead II is angled at 60 degrees to Lead I, and Lead III at roughly 120 degrees to Lead I.

Augmented Unipolar Limb Leads (aVR, aVL and aVF)
The three Unipolar augmented leads are termed unipolar leads because there is a single positive electrode that is referenced against a combination of the other limb electrodes. The positive electrodes for these augmented leads are located on the left arm (aVL), the right arm (aVR), and the left leg (aVF). In practice, these are the same electrodes used for leads I, II and III. (The ECG machine does the actual switching and rearranging of the electrode designations).

Augmented Unipolar Limb Leads (aVR, aVL and aVF)Three unipolar limb leads are also used for recording ECGs. Each lead measures the potential difference between an exploring electrode and an “indifferent” electrode (V) assumed to be at zero potential. This indifferent electrode is constructed by connecting the electrodes on the right arm (R), left arm (L) and left leg or foot (F) together. This indifferent electrode is called V and is assumed to be at zero potential (since the sum of the potentials in all the leads cancel out).

Augmented limb leads
• Represented by aVR, aVF, aVR. a- augmented V-unipolar Last letter represents the part of body• aVR- between right arm and left arm+ left leg• aVL- between left arm and rt arm+ left leg• aVF- between left foot and rt arm+ lt arm

Precordial Leads
Adapted from: www.numed.co.uk/electrodepl.html
These are unipolar leads measuring the potential difference between an electrode placed on the chest and an indifferent electrode, again made up by connecting the RA, LA and LL electrodes (i.e. the V electrode). There are 6 locations to place the chest electrode andso there are 6 chest electrodes (V1 – V6).With the chest leads, if the chest electrode is in an area of positivity, which occurs if the wave of depolarization is approaching this electrode, then an upward deflection is recorded.

Precordial Leads

Pre cordial leads
• V1- 4th intercoastal space, rt side sternal boarder• V2- 4th intercoastal space lt side of sternal boarder• V3- between V2 and V4• V4- 5th intercoastal space in the mid clavicular space• V5- 5th intercoastal space in the anterior axillary line• V6- 5th intercoastal space in the mid axillary line.

Summary of Leads
Limb Leads Precordial Leads
Bipolar I, II, III(standard limb leads)
-
Unipolar aVR, aVL, aVF (augmented limb leads)
V1-V6


Situs Inversus with dextrocardia

Arrangement of Leads on the EKG

Anatomic Groups(Septum)

Anatomic Groups(Anterior Wall)

Anatomic Groups(Lateral Wall)

Anatomic Groups(Inferior Wall)

Anatomic Groups(Summary)

INTERPRETATION OF THE ELECTROCARDIOGRAM
What to inspect in an ECG1. Heart Rate
2. Rhythm
3. Duration, segments and intervals.(P wave duration, PR interval,QRS duration, QT interval)
4. Mean QRS Axis (mean electrical axis, mean QRS vector)
5. P wave abnormalities
6. QRS wave abnormalities7. ST segment / T wave abnormalities
Inspect the P waves in leads II and V1 for left atrial or right atrial enlargement.Left atrial hypertrophy would result in a taller P wave in Lead IIRA hypertrophy – taller P wave in V1.

Rule of 300Take the number of “big boxes” between neighboring QRS complexes( R – R interval), and divide this by 300. The result will be approximately equal to the rate
Although fast, this method only works for regular rhythms.
Determining the Heart Rate
(300 / 6) = 50 bpm
(1500/30) = 50 bpm
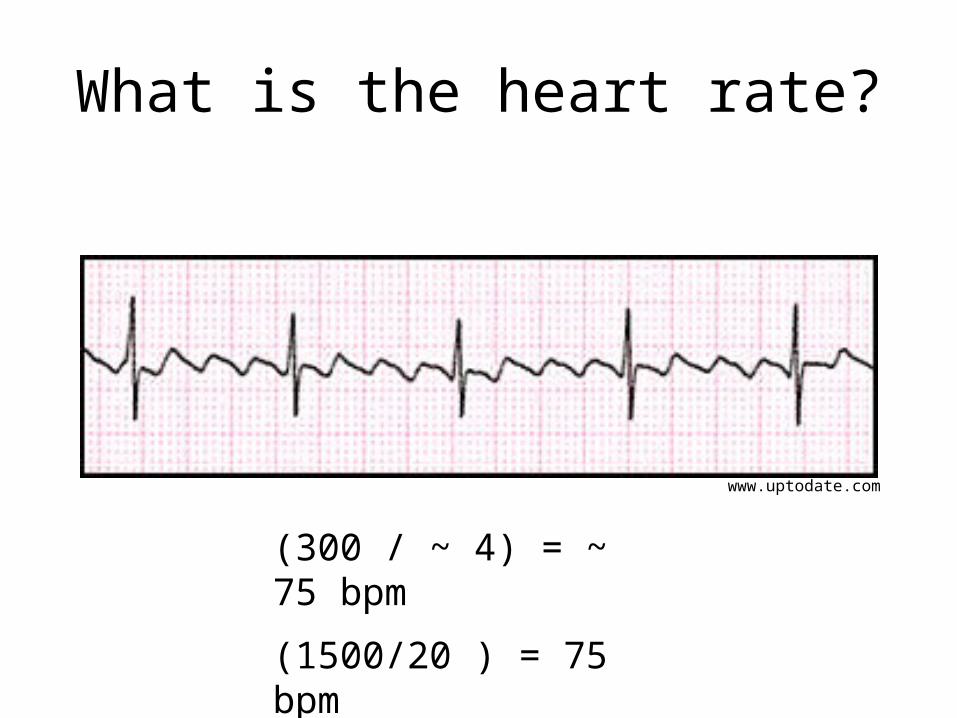
What is the heart rate?
(300 / ~ 4) = ~ 75 bpm
(1500/20 ) = 75 bpm
www.uptodate.com
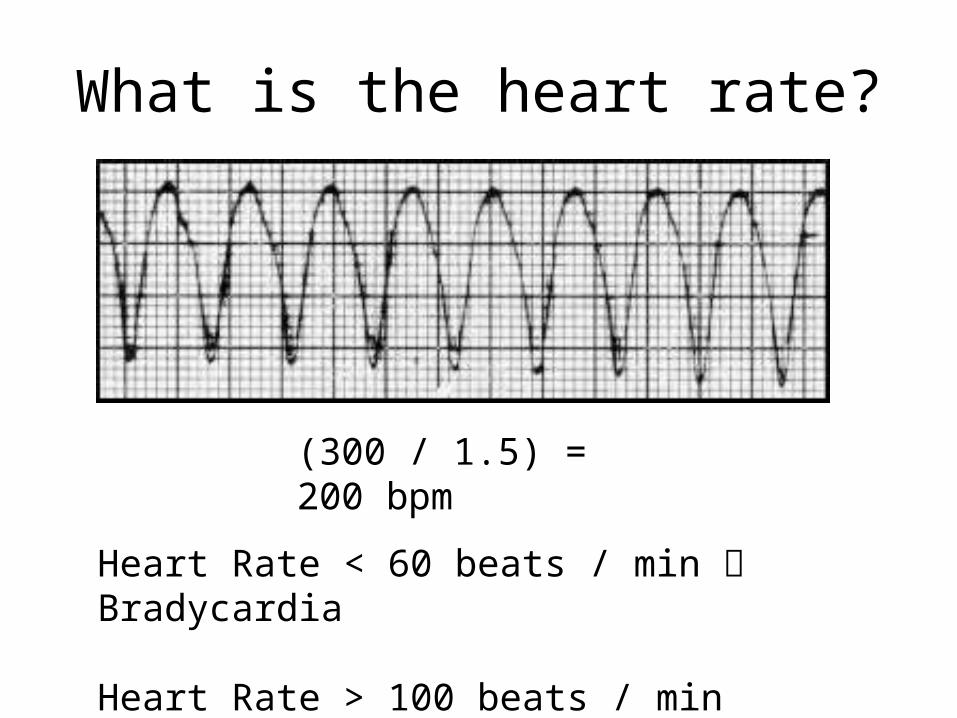
What is the heart rate?
(300 / 1.5) = 200 bpm
Heart Rate < 60 beats / min Bradycardia
Heart Rate > 100 beats / min Tachycardia

The Rule of 300
It may be easiest to memorize the following table:
# of big boxes
Rate
1 300
2 150
3 100
4 75
5 60
6 50

2. RhythmIs the rhythm determined by the SA node pacemaker? i.e. is it a “sinus rhythm”?If normal, the following should be present:
· The P wave should be upright in leads I, II and III.· Each QRS complex should follow a P wave

Einthoven’s Triangle•Einthoven’s triangle
hypothetical triangle created around the heart when electrodes are placed on both arms and the left leg .The sides of the triangle are numbered to correspond with the three leads ("leeds"), or pairs of electrodes.
Lead I at the top of the triangle, isorientated horizontally across the chest. This angle is taken as zero. Lead II is angled at 60 degrees to Lead I, and Lead III at roughly 120 degrees to Lead I.

All Limb Leads

The QRS Axis
The QRS axis represents the net overall direction of the heart’s electrical activity.
Abnormalities of axis can hint at:Ventricular enlargementConduction blocks (i.e. hemiblocks)

The QRS Axis
By near-consensus, the normal QRS axis is defined as ranging from -30° to +90°.
-30° to -90° is referred to as a left axis deviation (LAD)
+90° to +180° is referred to as a right axis deviation (RAD)

Determining the Axis
• The Quadrant Approach
• The Geometric method.

Determining the Axis
Predominantly Positive
Predominantly Negative
Equiphasic

The Quadrant Approach1. Examine the QRS complex in leads I and aVF to determine if they
are predominantly positive or predominantly negative. The combination should place the axis into one of the 4 quadrants below.

The Quadrant Approach2. In the event that LAD is present, examine lead II to determine if
this deviation is pathologic. If the QRS in II is predominantly positive, the LAD is non-pathologic (in other words, the axis is normal). If it is predominantly negative, it is pathologic.

Quadrant Approach: Example 1
Negative in I, positive in aVF RAD
The Alan E. Lindsay ECG Learning Center http://medstat.med.utah.edu/kw/ecg/

Quadrant Approach: Example 2
Positive in I, negative in aVF Predominantly positive in II
Normal Axis (non-pathologic LAD)
The Alan E. Lindsay ECG Learning Center http://medstat.med.utah.edu/kw/ecg/

QRS Axis Determination- Using the Hexaxial Diagram First find the isoelectric lead if there is one; i.e., the lead with equal forces in the positive and negative direction. Often this is the lead with the smallest QRS.
The QRS axis is perpendicular to that lead's orientation.
Since there are two perpendiculars to each isoelectric lead, chose the perpendicular that best fits the direction of the other ECG leads.

Applied physiology
• Myocardial infarction- Q wave
elevated ST segment • Ischemia- ST depression

• Heart block- • First Degree AV Block• There is a slowing of conduction through the
AV node. The P-R interval is unusuallylong (> 0.20 s). However each P wave is followed
by a QRS complex.

Second Degree BlockAs the PR interval increases to > 0.25s, sometimes conduction through the AV node fails and a P wave does not result in a QRS complex. This is intermittent conduction failure with a subsequent loss of ventricular contraction and is typical of a second degree block. There are 3 types of Second Degree Block: Mobitz type IMobitz type IIBundle Branch Block

Complete Conduction Block:- Third Degree BlockIn this condition no impulse goes through the AV node. The atria and the ventricles are now severed – electrically speaking – and each beats under control of its own pacemakers. This is also called AV dissociation. The atria have an inherent rhythm of 60– 80 bpm and the P-P interval will be regular and consisten. The only ventricular pacemaker that are available to initiate ventricular contractions are the Purkinje fibres - their inherent rhythm is 20 – 40 bpm.

Arrhythmias caused by changes in Electrolyte CompositionBoth Hypokalemia and Hyperkalemia can cause serious cardiac arrhythmias. This is not surprising considering how dependent the membrane potential is on extracellular K+ levels. To treat arrhythmias due to hyperkalemia calcium gluconate is infused. Ca++ has the opposite effects to K+ on the action potential.
Hypokalemia: Flattened T waveST depressionMore prominent U wave
Hyperkalemia: Peaked T waveLoss of P waveWidened QRS