Embed Size (px)
Citation preview
2010-2014
Final – October 2010
CoordinatedPlan
The
The Regional Short-Range Transit Plan & CoordinatedPublic Transit-Human Services Transportation Plan
One Region - One Network - One Plan
Technical Appendix
ii The Coordinated Plan (2010 – 2014) – PROPOSED FINAL
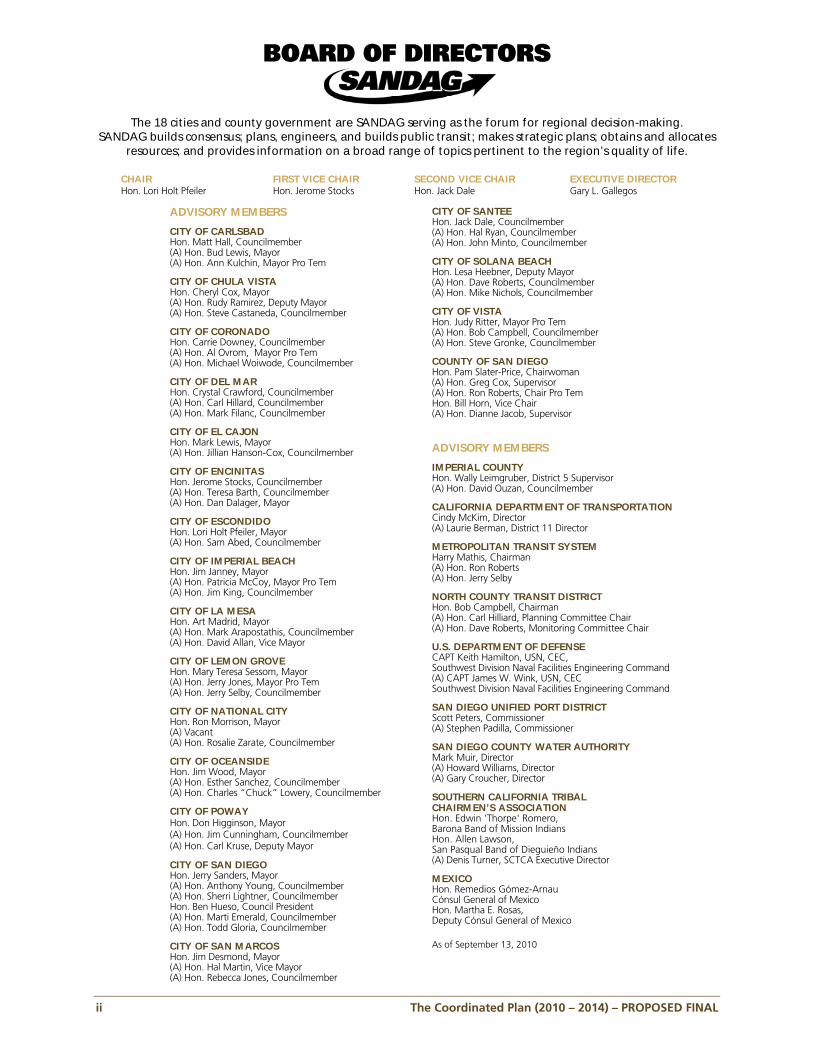
BOARD OF DIRECTORS
The 18 cities and county government are SANDAG serving as the forum for regional decision-making. SANDAG builds consensus; plans, engineers, and builds public transit; makes strategic plans; obtains and allocates
resources; and provides information on a broad range of topics pertinent to the region’s quality of life.
CHAIR Hon. Lori Holt Pfeiler
FIRST VICE CHAIR Hon. Jerome Stocks
SECOND VICE CHAIR Hon. Jack Dale
EXECUTIVE DIRECTOR Gary L. Gallegos
ADVISORY MEMBERS
CITY OF CARLSBAD Hon. Matt Hall, Councilmember (A) Hon. Bud Lewis, Mayor (A) Hon. Ann Kulchin, Mayor Pro Tem
CITY OF CHULA VISTA Hon. Cheryl Cox, Mayor (A) Hon. Rudy Ramirez, Deputy Mayor (A) Hon. Steve Castaneda, Councilmember
CITY OF CORONADO Hon. Carrie Downey, Councilmember (A) Hon. Al Ovrom, Mayor Pro Tem (A) Hon. Michael Woiwode, Councilmember
CITY OF DEL MAR Hon. Crystal Crawford, Councilmember (A) Hon. Carl Hillard, Councilmember (A) Hon. Mark Filanc, Councilmember
CITY OF EL CAJON Hon. Mark Lewis, Mayor (A) Hon. Jillian Hanson-Cox, Councilmember
CITY OF ENCINITAS Hon. Jerome Stocks, Councilmember (A) Hon. Teresa Barth, Councilmember (A) Hon. Dan Dalager, Mayor
CITY OF ESCONDIDO Hon. Lori Holt Pfeiler, Mayor (A) Hon. Sam Abed, Councilmember
CITY OF IMPERIAL BEACH Hon. Jim Janney, Mayor (A) Hon. Patricia McCoy, Mayor Pro Tem (A) Hon. Jim King, Councilmember
CITY OF LA MESA Hon. Art Madrid, Mayor (A) Hon. Mark Arapostathis, Councilmember (A) Hon. David Allan, Vice Mayor
CITY OF LEMON GROVE Hon. Mary Teresa Sessom, Mayor (A) Hon. Jerry Jones, Mayor Pro Tem (A) Hon. Jerry Selby, Councilmember
CITY OF NATIONAL CITY Hon. Ron Morrison, Mayor (A) Vacant (A) Hon. Rosalie Zarate, Councilmember
CITY OF OCEANSIDE Hon. Jim Wood, Mayor (A) Hon. Esther Sanchez, Councilmember (A) Hon. Charles “Chuck” Lowery, Councilmember
CITY OF POWAY Hon. Don Higginson, Mayor (A) Hon. Jim Cunningham, Councilmember (A) Hon. Carl Kruse, Deputy Mayor
CITY OF SAN DIEGO Hon. Jerry Sanders, Mayor (A) Hon. Anthony Young, Councilmember (A) Hon. Sherri Lightner, Councilmember Hon. Ben Hueso, Council President (A) Hon. Marti Emerald, Councilmember (A) Hon. Todd Gloria, Councilmember
CITY OF SAN MARCOS Hon. Jim Desmond, Mayor (A) Hon. Hal Martin, Vice Mayor (A) Hon. Rebecca Jones, Councilmember
CITY OF SANTEEHon. Jack Dale, Councilmember (A) Hon. Hal Ryan, Councilmember (A) Hon. John Minto, Councilmember
CITY OF SOLANA BEACH Hon. Lesa Heebner, Deputy Mayor (A) Hon. Dave Roberts, Councilmember (A) Hon. Mike Nichols, Councilmember
CITY OF VISTA Hon. Judy Ritter, Mayor Pro Tem (A) Hon. Bob Campbell, Councilmember (A) Hon. Steve Gronke, Councilmember
COUNTY OF SAN DIEGO Hon. Pam Slater-Price, Chairwoman (A) Hon. Greg Cox, Supervisor (A) Hon. Ron Roberts, Chair Pro Tem Hon. Bill Horn, Vice Chair (A) Hon. Dianne Jacob, Supervisor
ADVISORY MEMBERS
IMPERIAL COUNTY Hon. Wally Leimgruber, District 5 Supervisor (A) Hon. David Ouzan, Councilmember
CALIFORNIA DEPARTMENT OF TRANSPORTATION Cindy McKim, Director (A) Laurie Berman, District 11 Director
METROPOLITAN TRANSIT SYSTEM Harry Mathis, Chairman (A) Hon. Ron Roberts (A) Hon. Jerry Selby
NORTH COUNTY TRANSIT DISTRICT Hon. Bob Campbell, Chairman (A) Hon. Carl Hilliard, Planning Committee Chair (A) Hon. Dave Roberts, Monitoring Committee Chair
U.S. DEPARTMENT OF DEFENSE CAPT Keith Hamilton, USN, CEC, Southwest Division Naval Facilities Engineering Command (A) CAPT James W. Wink, USN, CEC Southwest Division Naval Facilities Engineering Command
SAN DIEGO UNIFIED PORT DISTRICT Scott Peters, Commissioner (A) Stephen Padilla, Commissioner
SAN DIEGO COUNTY WATER AUTHORITY Mark Muir, Director (A) Howard Williams, Director (A) Gary Croucher, Director
SOUTHERN CALIFORNIA TRIBAL CHAIRMEN’S ASSOCIATION Hon. Edwin 'Thorpe' Romero, Barona Band of Mission Indians Hon. Allen Lawson, San Pasqual Band of Dieguieño Indians (A) Denis Turner, SCTCA Executive Director
MEXICO Hon. Remedios Gómez-Arnau Cónsul General of Mexico Hon. Martha E. Rosas, Deputy Cónsul General of Mexico As of September 13, 2010
The Coordinated Plan (2010 – 2014) iii
Table of Contents
EXECUTIVE SUMMARY................................................................................................................ 1
Background Requirements.............................................................................................................. 1
Detailed Plan of Overview............................................................................................................... 2
CHAPTER 1: INTRODUCTION.................................................................................................... 1-1
1.1 One Region – One Network – One Plan ............................................................................. 1-1
1.2 Plan Requirements ............................................................................................................. 1-1
1.3 A Passenger-Centered Approach ....................................................................................... 1-4
1.4 Public Transit Evaluation .................................................................................................... 1-4
1.5 Specific Populations and Plan Components........................................................................ 1-4
1.6 Looking Forward................................................................................................................ 1-5
CHAPTER 2: COMMUNITY OUTREACH AND PUBLIC INVOLVEMENT.................................... 2-1
2.1 Public and Stakeholder Involvement................................................................................... 2-1
2.2 Outreach Efforts ................................................................................................................ 2-3
CHAPTER 3: PUBLIC AND SOCIAL SERVICE TRANSPORTATION VISION................................ 3-1
3.1 Creating a Consolidated Vision.......................................................................................... 3-1
3.2 Further Refining the RTP .................................................................................................... 3-3
CHAPTER 4: GOALS, OBJECTIVES, AND MONITORING .......................................................... 4-1
4.1 Purpose ............................................................................................................................. 4-1
4.2 Goals ................................................................................................................................. 4-1
4.3 Regional Performance Evaluation Program......................................................................... 4-2
4.4 TDA Productivity Improvement Program and Performance Monitoring............................... 4-22
4.5 Composite FY 2007 – 2010 Transit Performance Results.................................................... 4-23
4.6 TDA Performance Audit Recommendations ....................................................................... 4-25
4.7 Technical Advancements and Automation ......................................................................... 4-25
CHAPTER 5: PASSENGER DEMAND ANALYSIS ....................................................................... 5-1
5.1 Urban Versus Rural Demand Analysis................................................................................. 5-1
5.2 Urban Demand Analysis..................................................................................................... 5-1
5.3 Rural Demand Analysis ...................................................................................................... 5-5
5.4 Rural Area Demand Summary............................................................................................ 5-6
iv The Coordinated Plan (2010 – 2014)
Table of Contents (cont’d)
CHAPTER 6: TRANSPORTATION INVENTORY ......................................................................... 6-1
6.1 Public Transportation Providers .......................................................................................... 6-1
6.2 Private Transportation Providers......................................................................................... 6-5
6.3 Social Service Transportation Providers............................................................................... 6-9
6.4 Vanpool Alternatives.......................................................................................................... 6-13
6.5 Neighboring Systems ......................................................................................................... 6-14
6.6 Interregional Systems......................................................................................................... 6-16
6.7 Transit ............................................................................................................................... 6-17
6.8 Social Service Transportation.............................................................................................. 6-17
CHAPTER 7: NEEDS ASSESSMENT ........................................................................................... 7-1
7.1 Urban Needs Analysis ........................................................................................................ 7-1
7.2 Rural Needs Analysis .......................................................................................................... 7-1
7.3 Summary ........................................................................................................................... 7-4
CHAPTER 8: STRATEGIES AND PROJECT PRIORITIZATION..................................................... 8-1
8.1 Coordination of Transportation Resources – Benefits ......................................................... 8-1
8.2 Coordination of Transportation Resources – Challenges .................................................... 8-2
8.3 Mobility Management ....................................................................................................... 8-2
8.4 Project Prioritization........................................................................................................... 8-3
CHAPTER 9: FUNDING .............................................................................................................. 9-1
9.1 Federal............................................................................................................................... 9-1
9.2 State.................................................................................................................................. 9-7
9.3 Local.................................................................................................................................. 9-9
CHAPTER 10: IMPLEMENTATION ............................................................................................. 10-1
10.1 Program Management Plan and Competitive Process ........................................................ 10-1
10.2 FY 2010 Regional Service Implementation Plan.................................................................. 10-2
10.3 Looking Ahead .................................................................................................................. 10-18
10.4 Post Implementation Monitoring ....................................................................................... 10-18
10.5 Unforeseen Events ............................................................................................................. 10-19
The Coordinated Plan (2010 – 2014) v
List of Figures
CHAPTER 1: INTRODUCTION
1.1 Coordinated Plan Requirements and Components............................................................... 1-2
CHAPTER 4: GOALS, OBJECTIVES, AND MONITORING
4.1 Service Zones....................................................................................................................... 4-5
4.2 Transit Ridership Growth Compared to Jobs, Population, and Vehicle Registration .............. 4-8
4.3 Walking Distance Behavior...................................................................................................4-11
4.4 AVL and APC Fleet Deployment..........................................................................................4-26
CHAPTER 6: TRANSPORTATION INVENTORY
6.1 Free-Fare Routes for UCSD Students, Faculty, and Staff ....................................................... 6-4
CHAPTER 7: NEEDS ASSESSMENT
7.1 Total Rural Trips by Demographic ...................................................................................... 7-2
7.2 Trip Demand for Persons With Limited Means.................................................................... 7-2
7.3 Trip Demand for Persons With Disabilities .......................................................................... 7-3
7.4 Trip Demand for Seniors .................................................................................................... 7-3
CHAPTER 9: FUNDING
9.1 Urbanized Area of San Diego County ................................................................................ 9-2
vi The Coordinated Plan (2010 – 2014)
List of Tables
CHAPTER 1: INTRODUCTION
1.1 One Region – One Network – One Plan ............................................................................ 1-1
1.2 Plan Requirements ............................................................................................................ 1-1
CHAPTER 5: PASSENGER DEMAND ANALYSIS
5.1 San Diego County Population: Income Levels Compared to Poverty Level ......................... 5-2
CHAPTER 8: STRATEGIES AND PROJECT PRIORITIZATION
8.1 Coordinated Plan Strategies.............................................................................................. 8-4
CHAPTER 9: FUNDING
9.1 FTA Section 5310 Programs Funded Through the Coordinated Plan.................................. 9-4
9.2 JARC Programs Funded Through the Coordinated Plan..................................................... 9-7
9.3 New Freedom Programs Funded Through the Coordinated Plan ....................................... 9-9
9.4 Traffic Congestion Relieve Fund as of 9/30/2009 .............................................................. 9-8
9.5 Senior Mini-Grant Programs Funded Through the Coordinated Plan ................................. 9-10
9.6 TDA FY 2011 Claims Summary (Revised Apportionment) .................................................. 9-13
9.7 Summary of Potential Regional and Local Revenue Sources for Transit Operations............ 9-18
CHAPTER 10: IMPLEMENTATION
10.1 Service Reductions or Restructuring (FY 2010) .................................................................. 10-4
10.2 A – Operator-Identified Service Area Needs ...................................................................... 10-16
10.2 B – Identified Regional Needs............................................................................................ 10-17
The Coordinated Plan (2010 – 2014) vii
Technical Appendices (bound under separate cover)
A Public Involvement
B FY09 Transit Services and Programs
C FY09 RSRTP Route Statistics and Historical Data
D Social Service Transportation Inventory
E Program Management Plan (September 2010)
F Service Implementation Plans
G Sample Roadway Capacities
H Annual Title VI Consistency Evaluation
I Transit-Deficit Smart Growth Areas
J TDA Performance Indicators
K Agency Mission Statements
L RSRTP Performance Statistics
M Regional Population Maps
N Social Service Transportation Maps
O Regional Transit and Social Service Transportation Gaps
P Issues and Strategies
Q Rural Transportation Survey Results

Th
e
Co
ord
inate
d P
lan
Executive Summary

The Coordinated Plan (2010 – 2014) 1
EXECUTIVE SUMMARY
The Coordinated Plan provides a five-year blueprint for the implementation of public transit and social service transportation concepts described in the long-range Regional Transportation Plan (RTP). The Coordinated Plan is unique in that it combines the regional requirement for a Short-Range Transit Plan with the federal requirement for a Coordinated Plan into one concise planning document. Additionally, the combination of transit and social service transportation provides an opportunity to evaluate all available transportation services in the region. Along with the evaluation of transportation services, the Coordinated Plan establishes a unified regional strategy to provide transportation to the most sensitive population groups in the County: individuals with disabilities, persons with limited means, and seniors. While there is currently a range of transportation services available to these population groups, gaps in service remain due to geography, limitations in transit service, funding constraints, eligibility limitations, knowledge, and training. However, the availability of funding programs specifically tied to the Coordinated Plan enables SANDAG to help put strategies into action to help meet the identified unmet transportation needs of these population groups.
BACKGROUND REQUIREMENTS Through a provision in the federal Safe Accountable Flexible and Efficient Transportation Equity Act: A Legacy for Users (SAFETEA-LU), the Coordinated Plan must be developed and updated not less than once every four years. SAFETEA-LU requires that the Coordinated Plan include the following components:
An assessment of current transportation services;
An assessment of transportation needs for individuals with disabilities, older adults, and people with low incomes;
Strategies to address the identified gaps between current services and needs;
Priorities for implementation based on resources, time, and feasibility.
EXECUTIVE SUMMARY
2 The Coordinated Plan (2010 – 2014)
DETAILED PLAN OVERVIEW A key highlight of this Coordinated Plan update is the addition of information on rural transportation services and needs based on surveys and outreach efforts specifically in the rural areas. Therefore, rural area transportation information and needs are woven throughout the document. The following includes a brief overview of the Coordinated Plan chapters.
Chapter 1—Introduction
The introductory chapter describes the passenger-centered approach to the development and implementation of the Coordinated Plan. The chapter also identifies each of the formal regional, state, and federal requirements fulfilled by this Coordinated Plan.
Chapter 2—Community Outreach and Public Involvement
The 2010-2014 Coordinated Plan included an extensive community outreach program in both the urban and rural areas of the region, which also satisfies the federal requirements to ensure diverse public input in determining local transportation needs.
Chapter 3—Public and Social Service Transportation Vision
The intent of the Coordinated Plan is to accommodate the visions and missions of four transportation agencies, while implementing the goals and policies of the RTP. The process undertaken to develop such a consolidated vision is included in this section.
Chapter 4—Goals, Objectives, and Monitoring
This chapter includes a comprehensive policy framework which establishes goals and objectives to implement and measure the public and social services transportation in San Diego County. The framework allows SANDAG to carefully evaluate transit performance as required by the Transportation Development Act, and social services transportation performance as required by the Federal Transit Administration.
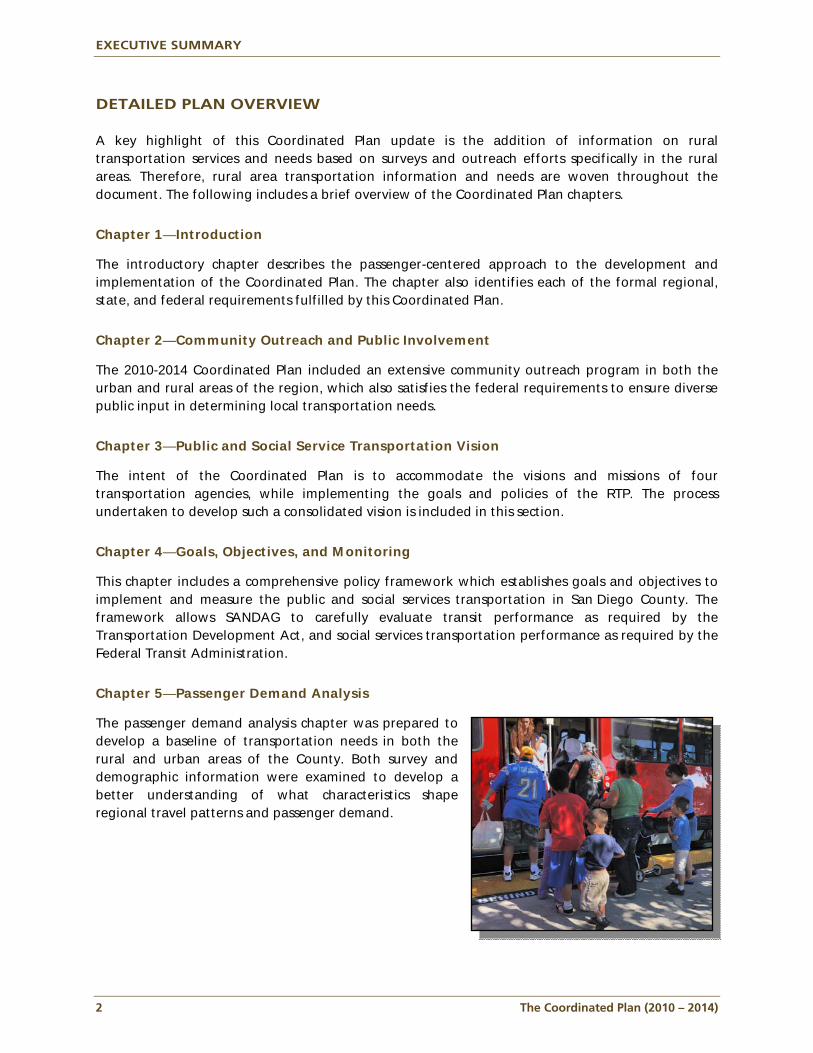
Chapter 5—Passenger Demand Analysis
The passenger demand analysis chapter was prepared to develop a baseline of transportation needs in both the rural and urban areas of the County. Both survey and demographic information were examined to develop a better understanding of what characteristics shape regional travel patterns and passenger demand.
EXECUTIVE SUMMARY
The Coordinated Plan (2010 – 2014) 3
Chapter 6—Transportation Inventory
Chapter 6 provides a comprehensive inventory of the public transportation services available in the San Diego region to meet the passenger needs identified in Chapter 5. A comprehensive list of social service transportation providers primarily serving disabled, elderly, and/or low-income populations is included in this chapter. Additionally, project narratives for social service transportation projects funded through the TransNet Senior Mini-Grant program have been added to the 2010-2014 Coordinated Plan.
Chapter 7—Needs Assessment
The needs assessment component of the Coordinated Plan was developed through the analysis of the difference between passenger demand (Chapter 5) and transportation services available to meet that demand (Chapter 6). Services that are not provided where there is demand create unmet needs that are included in this chapter. Recognizing the fundamental difference between urban and rural transportation needs, the 2010-2014 Coordinated Plan includes an in-depth analysis of rural transportation needs in addition to the urban needs assessment continued from previous Coordinated Plans.
Chapter 8—Strategies and Project Prioritization
This chapter of the Coordinated Plan identifies strategies to address the transportation deficiencies outlined in Chapter 7. This chapter also prioritizes strategies so that SANDAG may continue to fund projects through the Jobs Access and Reverse Commute (JARC), New Freedom, and Senior Mini-Grant programs. The strategies included in this section were developed to meet the regional transit and social service transportation needs as identified through the various outreach efforts, demographic research, survey efforts, and transportation inventory analysis completed over the last four years.
Chapter 9—Funding
The funding chapter describes the major sources of public transit and social services transportation funds available from federal, state, and local sources. Currently, funds for transportation services are derived from a variety of public and private sources; however, this Coordinated Plan only addresses funds that are available, either in whole or in part, from public programs. The chapter also includes detailed tables noting the money distributed to date relating to the Coordinated Plan from the JARC, New Freedom, and Senior Mini-Grant programs.
Chapter 10—Implementation
The implementation chapter explains how SANDAG will serve as a conduit for federal, state, and local funding of existing and future services recommended in this Coordinated Plan. Under current federal regulations, the Coordinated Plan enables the distribution of federal funding under the New Freedom (transportation for people with disabilities), JARC (commute transportation for individuals with limited means), and 5310 (seniors and persons with disabilities) programs. The Coordinated Plan also allows the distribution of local funding for projects targeted at seniors (through the Senior Mini-Grant program), which was created through the regional transportation sales tax measure (TransNet). The Program Management Plan (Appendix E) describes the procedures
EXECUTIVE SUMMARY
4 The Coordinated Plan (2010 – 2014)
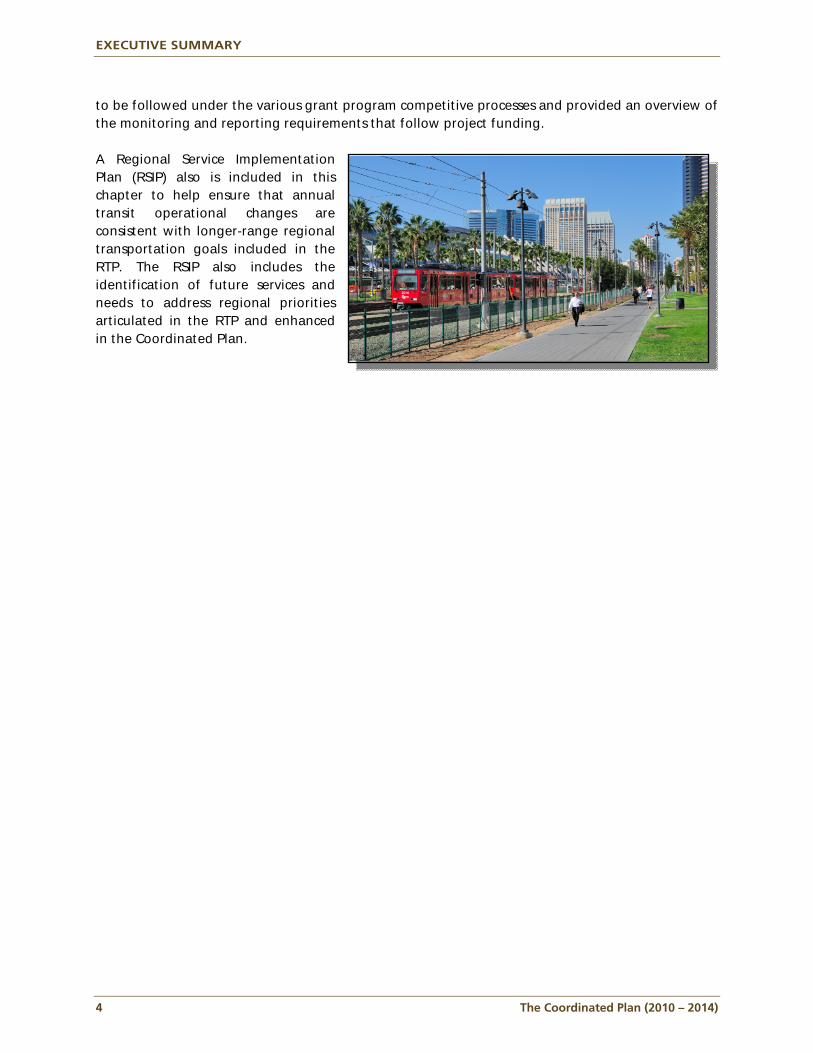
to be followed under the various grant program competitive processes and provided an overview of the monitoring and reporting requirements that follow project funding. A Regional Service Implementation Plan (RSIP) also is included in this chapter to help ensure that annual transit operational changes are consistent with longer-range regional transportation goals included in the RTP. The RSIP also includes the identification of future services and needs to address regional priorities articulated in the RTP and enhanced in the Coordinated Plan.
Chapter 1
Th
e
Co
ord
inate
d P
lan
Introduction

The Coordinated Plan (2010 – 2014) 1-1
CHAPTER 1: INTRODUCTION
The 2010-2014 Coordinated Plan represents the fourth edition, which is designed to implement the goals and policies articulated in the Regional Transportation Plan (RTP) and to fulfill federal requirements under the Safe, Accountable, Flexible, and Efficient Transportation Equity Act: A Legacy for Users (SAFETEA-LU). The Coordinated Plan refines the RTP goals and in so doing, creates an implementation plan funded by local, state, and federal sources for transit and social service transportation. The Coordinated Plan involves the identification of transit needs from a passenger perspective and includes strategies to meet those needs. The major focus of the 2010-2014 Coordinated Plan was the identification of the unmet transportation needs of citizens in rural and unincorporated parts of the County. The update includes data from this year’s rural transportation survey and outreach activities which provide a basis for the inclusion of rural funding priorities in the Coordinated Plan.
1.1 One Region – One Network – One Plan This Coordinated Plan rolls all publicly available transportation services into one unified plan as required by federal legislation. The difference between previous Regional Short Range Transit Plans and the Coordinated Plan is that the Coordinated Plan includes transportation provided by social service transportation providers in addition to those services offered by traditional public transit operators. Social service transportation providers can include private companies, nonprofit organizations, regional transportation assistance programs, and governmental or quasi-governmental social service agencies. These services also are referenced as “specialized transportation” in this plan. Given this broad approach, the Coordinated Plan represents a significant expansion of transportation planning activities conducted in the region and, as a result, establishes a “one region – one network – one plan” concept of service. The Coordinated Plan also seeks to improve transportation options by promoting coordination among agencies actively involved in transportation and by removing inefficiencies caused by redundant or duplicative services.
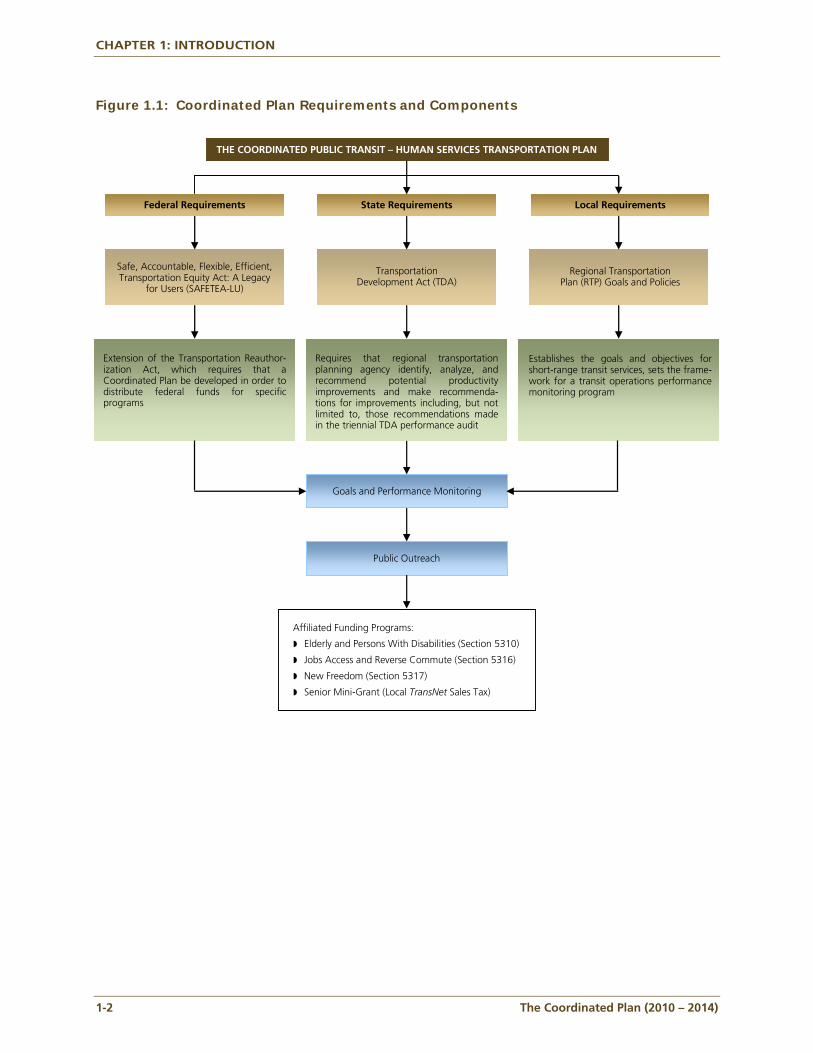
1.2 Plan Requirements The Coordinated Plan also is a consolidation of mandates stemming from federal, state, and local guidelines which are described as follows and shown graphically in Figure 1.1.
CHAPTER 1: INTRODUCTION
1-2 The Coordinated Plan (2010 – 2014)
Figure 1.1: Coordinated Plan Requirements and Components
Extension of the Transportation Reauthor-ization Act, which requires that a Coordinated Plan be developed in order to distribute federal funds for specific programs
Establishes the goals and objectives for short-range transit services, sets the frame-work for a transit operations performance monitoring program
TransportationDevelopment Act (TDA)
Safe, Accountable, Flexible, Efficient, Transportation Equity Act: A Legacy
for Users (SAFETEA-LU)
Regional TransportationPlan (RTP) Goals and Policies
State RequirementsFederal Requirements Local Requirements
THE COORDINATED PUBLIC TRANSIT – HUMAN SERVICES TRANSPORTATION PLAN
Requires that regional transportation planning agency identify, analyze, and recommend potential productivity improvements and make recommenda-tions for improvements including, but not limited to, those recommendations made in the triennial TDA performance audit
Goals and Performance Monitoring
Public Outreach
Affiliated Funding Programs:
Elderly and Persons With Disabilities (Section 5310) Jobs Access and Reverse Commute (Section 5316) New Freedom (Section 5317) Senior Mini-Grant (Local TransNet Sales Tax)
CHAPTER 1: INTRODUCTION
The Coordinated Plan (2010 – 2014) 1-3
Federal Requirements SAFETEA-LU was signed into law by President Bush in 2005. This extension of the Transportation Reauthorization Act introduced a requirement that funding for three federal programs be derived from “a locally developed, Coordinated Public Transit-Human Services Transportation Plan” (Coordinated Plan). These federal programs are Job Access and Reverse Commute (JARC) (Section 5316), New Freedom (Section 5317), and Elderly and Persons with Disabilities (Section 5310), which have been designed to meet the transportation needs of individuals with limited means (JARC), people with disabilities New Freedom, and older adults (5310).
State Requirements The Transportation Development Act (TDA) of California provides one-quarter percent of the state sales tax for operating and capital support of public transportation systems and nonmotorized transportation projects.
Local Requirements SANDAG requires that a Regional Short-Range Transit Plan (RSRTP) be developed which provides a five-year blueprint of how the transit concepts described in the RTP are to be implemented. The Coordinated Plan fulfills this requirement. The combined RSRTP and Coordinated Plan include:
Goals and objectives for short-range transit services;
Definition of the existing transit system;
Framework for a transit operations performance monitoring program as required by the TDA and a monitoring program for social services transportation as defined by the Federal Transit Administration (FTA);
Identification of service gaps and deficiencies;
Evaluation of existing services and programs;
Parameters for short-range (0-5 years) new and revised service development, as well as regionally significant and all other service adjustments;
Methodology for evaluating proposals for new and revised service;
Identification and prioritization of regional and subarea transit planning studies; and
Evaluation and prioritization of new and revised services for implementation, including the adoption of an annual Regional Service Implementation Plan.
The Coordinated Plan also makes the distribution of local funding for senior programs possible (through the Senior Mini-Grant program), which was created through the ½ cent regional transactions and use tax extension measure (TransNet II). In order to enhance and promote coordination, all projects funded by the Senior Mini-Grant program also must be consistent with the Coordinated Plan.
CHAPTER 1: INTRODUCTION
1-4 The Coordinated Plan (2010 – 2014)
1.3 A Passenger-Centered Approach In addition to bringing public transit and social service transportation under one planning umbrella, the Coordinated Plan represents a “passenger-centered” approach to finding transportation solutions for the region’s residents. Under this approach, the first step is to identify and define the mobility needs of the public and then determine the most appropriate solution, such as conventional fixed-route public transit, Americans with Disabilities Act paratransit, specialized transportation programs, or volunteer driver programs. This Coordinated Plan also looks at the type of passenger and includes those individuals who are considered to be discretionary riders (who have available a personal vehicle, but ride transit based on a personal preference). Planning for these riders represents significant transit expansion opportunities since these riders represent a potentially large, but yet untapped ridership base.
1.4 Public Transit Evaluation The incorporation of social service transportation into public transportation planning represents new opportunities, including a chance to define public transportation policies and objectives for the region. The Coordinated Plan includes a series of goals and objectives by which the complete public transportation system will be measured in future years. The Coordinated Plan incorporates elements contained in previous RSRTPs relating to the transit agencies, but more clearly evaluates those transit services by specific location type (urban, suburban, and rural) along a five-year horizon. The methodology includes and expands upon the performance measures suggested in the California TDA evaluation processes.
1.5 Specific Populations and Plan Components The Coordinated Plan focuses on the identification of specific population groups that are more likely to be dependent on public transit and social service transportation. These groups, which have been federally mandated for inclusion in the Coordinated Plan, are:
1. Persons with limited means: Refers to an individual whose family income is at or below the 150 percent poverty line threshold set in SAFETEA-LU.
2. Individuals with disabilities: Includes individuals who, because of illness, injury, age, congenital malfunction, or other incapacity or temporary or permanent disability (including an individual who is a wheelchair user or has semi-ambulatory capacity) cannot use effectively, without special facilities, planning, or design, public transportation service or a public transportation facility.
3. Older adults: Includes, at a minimum, all persons 65 years of age or older.
CHAPTER 1: INTRODUCTION
The Coordinated Plan (2010 – 2014) 1-5
In addition to identifying needs, the Coordinated Plan has been developed to respond to a transportation system that has grown to include a greater number of demand responsive services, potential opportunities for innovative technological enhancements, social service agency assistance programs, and cooperative arrangements. The Coordinated Plan includes the following elements “at a level consistent with available resources and the complexity of the local institutional environment” as required by the federal government:
An inventory and assessment of available services that identifies current transportation providers from the public, private, and nonprofit sectors;
An assessment of transportation needs for individuals with disabilities, older adults, and persons with limited means – this assessment can be based on the experiences and perceptions of the planning partners or on more sophisticated data collection efforts and gaps in service;
Strategies and/or activities to address identified gaps in service and achieve efficiencies in service delivery;
Identification of coordination strategies to eliminate or reduce duplication in services and strategies for more efficient utilization of resources; and
Priorities based on resources, time, and feasibility for implementing the specific strategies/ activities identified.
1.6 Looking Forward The operational design of transportation services developed to reduce or eliminate gaps and deficiencies identified in the Coordinated Plan are the responsibility of the transit agencies and the other members of the transportation community. In some cases, these organizations may apply for funding under the competitive grant programs administered by SANDAG to fulfill projects identified and prioritized in the Coordinated Plan. The Coordinated Plan also has been developed so that the two local transit agencies and transportation providers receiving local and federal funding can address any deficiencies identified through the performance monitoring program included in the Coordinated Plan. This process involves the preparation of the annual service implementation plans, which are prepared by the transit operators and incorporated into the Coordinated Plan to address annual service changes and improvements. The specific inclusion of rural transportation needs in the 2010-2014 Coordinated Plan also will enable rural communities and organizations serving the rural to be eligible for additional federal grant funds administered by the State of California. The rural transportation needs articulated in Chapter 7 and organized as prioritized strategies in Chapter 8 are designed provide a mechanism for rural transportation funding.

Chapter 2
Th
e
Co
ord
inate
d P
lan
Community Outreach and Public Involvement

The Coordinated Plan (2010 – 2014) 2-1
CHAPTER 2: COMMUNITY OUTREACH AND PUBLIC INVOLVEMENT
The Federal Transit Administration (FTA) requires that the Coordinated Plan be prepared and updated at least every four years and include significant public outreach. Since the inception of the Coordinated Plan, SANDAG has chosen to prepare annual updates to the Coordinated Plan, with public outreach adjusted to reflect the extent of proposed revisions to the document. Appendix A includes the public outreach documentation for the outreach effort conducted over the past year, which includes a copy of the rural transportation survey and corresponding outreach survey documents. The 2010-2014 Coordinated Plan also involved 16 outreach meetings that occurred after the survey was conducted. These meetings were distributed throughout both urban and rural parts of the County. Additionally, since a competitive grant selection process is being held concurrently with the update of the Coordinated Plan, additional grants-related outreach documents are included in Appendix A. A public hearing on the proposed plan was conducted by the Social Services Transportation Advisory Council (SSTAC) in San Diego on September 27, 2010,1 and a public hearing will be held by the SANDAG Transportation Committee on October 15, 2010.
2.1 Public and Stakeholder Involvement A public outreach component including a wide variety of organizations2 is required for the development of the Coordinated Plan. It is required that the Coordinated Plan be updated at least every four years in air quality nonattainment and maintenance areas and five years in air quality attainment areas. However, SANDAG consolidates its Coordinated Plan responsibilities with the regional requirement to develop a Regional Short-Range Transit Plan not less than every two years. The federal guidance states that the Coordinated Plan should be developed through a process that includes the representatives of public, private, and nonprofit transportation providers, as well as participation by members of the public. Furthermore, the guidelines stipulate that members of the public should include representatives of the targeted populations, including individuals with disabilities, older adults, and people with low incomes. The guidance also recommends consultation with an expansive list of stakeholders throughout all phases of the Coordinated Plan development.
1 The California Public Utilities Code (CPUC) requires SSTAC to hold at least one public meeting each year for the purpose of
soliciting input from transit-dependent disadvantaged persons, including seniors, persons with disabilities, and persons of limited means.
2 Organizations may include, but are not limited to, state and local officials and elected representatives/tribal governments, private/public/nonprofit/Americans with Disabilities Act transportation providers, social service agencies involved in transportation, taxi service providers, intercity bus operators, vanpools, flex car operators, business community/employers, economic development agencies, transit riders and potential riders, protection and advocacy organizations, agencies that administer employment or other support programs for targeted populations, faith-based and community-based organizations, and school districts/colleges.
CHAPTER 2: COMMUNITY OUTREACH AND PUBLIC INVOLVEMENT
2-2 The Coordinated Plan (2010 – 2014)
Social Services Transportation Advisory Council (SSTAC) The main group involved in the development of the 2010-2014 Coordinated Plan was the SSTAC. The mandate of the SSTAC is to assist SANDAG with responding to federal and state requirements, as well as local concerns and involvement in accessibility issues. Responsibilities of the group also include review and advice on federal funding programs for the elderly and disabled and coordination of vehicles for elderly and disabled persons. As such, the group provided an excellent fit to guide the development of the Coordinated Plan. In order to ensure consistent participation in the Coordinated Plan development by stakeholders and members of the public, the SSTAC provided input and feedback at both regular and special meetings. The composition of this group includes the following representatives:
One of potential transit users who is 60 years of age or older
One of potential transit users who is a person with a disability
Two of local social service providers for seniors, including one representative of a social service transportation provider
Two of local social service providers for persons with disabilities, including one representative of a social service transportation provider
Two of local social service providers for persons of limited means, including one representative of a social service transportation provider
Two from the local Coordinated Transportation Services Agency (CTSA) with one CTSA member representing the North County Transit District (NCTD) service area and the other CTSA member representing the Metropolitan Transit System (MTS) service area
One from NCTD representing fixed-route service
One from NCTD representing ADA service
One from MTS representing fixed-route service
One from MTS representing ADA service Additionally, development of the 2010-2014 Plan included use of a review group (the Coordinated Plan Ad Hoc Group or CPAG) that was made up of several SSTAC members.
Regional Transit Planning Task Force The Regional Transit Planning Task Force includes staff members from the two transit operators in the County, MTS, and NCTD, along with members from SANDAG and the CTSA. The group discussed the Coordinated Plan at its quarterly meetings and provided input into the development of the updated Coordinated Plan. Additionally, transit staff from both MTS and NCTD provided key performance measures utilized in Chapter 4 and Appendix L. Transit agency staff members also provided the Service Implementation Plans (Appendix F) used to develop the Regional Service Implementation Plan included in Chapter 10.
CHAPTER 2: COMMUNITY OUTREACH AND PUBLIC INVOLVEMENT
The Coordinated Plan (2010 – 2014) 2-3
2.2 Outreach Efforts
Rural Transportation Study Recognizing the difference in transportation needs between urban and rural residents, the 2010-2014 Coordinated Plan focuses on soliciting comments from rural communities. This study was conducted in three parts: 1) a telephone interview with 48 community liaisons who represented schools, medical centers, religious institutions, and social groups; 2) an 18-question public survey distributed online and via hard copy to identified community groups through the community liaisons; and 3) telephone interviews with transportation providers and mobility managers. The community liaisons were identified through a thorough search of multiple organization categories, including schools, medical centers, religious institutions, and social groups listed by the Chambers of Commerce for eight rural communities3 throughout San Diego County.
Social Services Transportation Advisory Committee (SSTAC) Public Hearing The CPUC requires that the SSTAC hold at least one noticed meeting to receive comment from the public on transportation issues. In 2010, this meeting was held on September 27, 2010, to solicit the input of transit-dependent and transportation-disadvantaged persons, including seniors, persons with disabilities, and persons with limited means. Appendix A contains the public notice used for this meeting. The SSTAC public hearing was conducted during the Coordinated Plan review period to ensure that comments heard at the meeting could be incorporated into the proposed final Coordinated Plan.
Public Comment Period The SANDAG Public Participation/Involvement Policy establishes a process for obtaining input from, and providing information to, the public. Public outreach is conducted concerning agency programs, projects, and program funding in order to ensure the public is informed and has the opportunity to provide SANDAG with input so plans can reflect the public’s desire. Comments received for the Coordinated Plan within the comment period and any appropriate revisions will be included in the final document.
SANDAG Public Hearing SANDAG Board Policy requires the approval of the Coordinated Plan by the SANDAG Transportation Committee be held after a public hearing. The public hearing is scheduled for October 15, 2010.
3 Alpine, Mountain Empire, Julian, Ramona, Borrego Springs, Valley Center, Bonsall, and Fallbrook

Chapter 3
Th
e
Co
ord
inate
d P
lan
Public and Social Service Transportation Vision

The Coordinated Plan (2010 – 2014) 3-1
CHAPTER 3: PUBLIC AND SOCIAL SERVICE TRANSPORTATION VISION
The Coordinated Plan is an attempt to synthesize the missions of the four local transportation agencies into a coordinated transportation approach for San Diego County. These agencies have not changed since the development of the first Coordinated Plan (2007-2011) and include:
SAN DIEGO ASSOCIATION OF GOVERNMENTS
METROPOLITAN TRANSIT SYSTEM
NORTH COUNTY TRANSIT DISTRICT CONSOLIDATED TRANSPORTATION SERVICES AGENCY
North County Transit District (NCTD) and Metropolitan Transit System (MTS) are transit operators, while Full Access & Coordinated Transportation (FACT) was contracted to serve as the Consolidated Transportation Services Agency (CTSA) on behalf of SANDAG in 2006. FACT is a special-purpose agency dedicated to improving, consolidating, and coordinating social service transportation in the region. SANDAG is the regional transportation planning agency with specific responsibilities for long- and short-range transit planning. The mission/vision statements of the four agencies are included in Appendix K.
3.1 Creating a Consolidated Vision A recurring theme of the transit agency visions and that of the CTSA is the idea of providing a customer-focused system that provides high-quality services that are sustainable and make the best use of available resources. These themes are consistent with the focus of the SANDAG Regional Transportation Plan (RTP). The RTP is our region’s blueprint for a transportation system that enhances our quality of life and identifies our mobility needs to 2030.1 The Coordinated Plan’s vision for transportation supports the region’s comprehensive strategy to promote smarter, more sustainable growth. The RTP focuses on the development of a flexible transportation system that focuses on moving people and goods – not
1 The current RTP, “2030 San Diego Regional Transportation Plan: Pathways for the Future,” (available at
www.sandag.org/2030rtp), contains an integrated set of public policies, strategies, and investments to maintain, manage, and improve the transportation system in the San Diego region through the year 2030.
CHAPTER 3: PUBLIC AND SOCIAL SERVICE TRANSPORTATION VISION
3-2 The Coordinated Plan (2010 – 2014)
just vehicles. The vision is to provide more convenient, fast, and safe travel choices for public transit, ridesharing, walking, biking, private vehicles, and freight. Its goals include preservation of existing transportation resources and efficient management of the regional transportation system. At the core of the 2030 RTP are seven goals:
1. LIVABILITY Provide livable communities
2. MOBILITY Improve the mobility of people & freight
3. EFFICIENCY Maximize the efficiency of the existing & future transportation system
4. ACCESSIBILITY Improve accessibility to major employment & other regional activity centers
5. RELIABILITY Improve the reliability & safety of the transportation system
6. SUSTAINABILITY Minimize effects on the environment
7. EQUITY Ensure equitable distribution of the benefits among various demographic & user groups
The RTP envisions a regional transit system that is the first choice for trips made in the region. The long-range transit vision calls for a network of fast, flexible, reliable, safe, and convenient transit services that connect our homes to the region’s major employment centers and major destinations. This vision was first developed in 2001 when SANDAG, MTS, and NCTD adopted the Regional Transit Vision, setting in place the framework for transit improvements in the 2030 RTP. The 2030 RTP identifies the transit improvements that have the highest priority for the region. The identified services will help to boost transit ridership and help achieve an increased transit mode share along key corridors during peak periods. The identified services fulfill a variety of network functions, but particularly offer competitive travel times to major job centers. The 2030 RTP also acknowledges the role played by social service transportation which was missing from previous RTPs.
3.2 Further Refining the RTP The role of the Coordinated Plan is to identify a list of activities and projects from the RTP that can be implemented over the next five years within the context of available funding and other service changes desired by SANDAG, MTS, NCTD, and the CTSA. The Coordinated Plan also combines social services transportation with transit under a regional transportation planning umbrella as outlined in the RTP. A new RTP is currently being developed which will extend through 2050 and is scheduled for release in summer 2011.
Chapter 4
Th
e
Co
ord
inate
d P
lan
Goals, Objectives, and Monitoring

The Coordinated Plan (2010 – 2014) 4-1
CHAPTER 4: GOALS, OBJECTIVES, AND MONITORING
4.1 Purpose The performance monitoring program was developed to retain a regional perspective on the transportation system as a whole, but it also was conducted to assist the transportation agencies with their evaluation of current or future service expansions or contractions. The evaluation of social service transportation also is included to develop an understanding of these types of programs and how they contribute to the host of transportation solutions available. This chapter begins with an overview of the goals and policies of the Regional Transportation Plan (RTP) and how they have been refined and enhanced in this Coordinated Plan to evaluate the transit and social service transportation system. This is followed by the overall goals and objectives to guide the development of the transit and social service transportation systems over the next five years. Finally, since transit funding also is tied to state funding sources, a description of the state-mandated evaluation process also is included in this chapter.
4.2 Goals In order to present the basis for evaluating transit and social service transportation in the San Diego region, a series of nine goals for the coordinated transportation network in San Diego was developed. These goals were based on the visions of the four agencies (Metropolitan Transit System (MTS), North County Transit District (NCTD), Coordinated Transportation Services Agency (CTSA), and SANDAG)) involved in planning and operation of the transportation system, along with the overarching goals of the RTP identified in Chapter 3. The coordinated transportation network goals are to:
1. Provide an accessible transit network in the urban areas that offers frequency and span of service to support spontaneous use for a wide range of needs;
2. Provide an accessible transit network in the suburban areas that offers direct service along commute corridors with critical mass featuring rapid, frequent service during peaks with seamless coordinated transfers and local service focused on smart growth areas and lifeline needs;
3. Provide accessible lifeline public and social service transportation in rural areas;
4. Maximize the farebox recovery rate and ensure that operation of the transit system is fiscally responsible;
5. Offer accessible public and social service transportation services that are productive, coordinated, convenient, and appropriate for the markets being served;
CHAPTER 4: GOALS, OBJECTIVES, AND MONITORING
4-2 The Coordinated Plan (2010 – 2014)
6. Offer accessible public and social service transportation services in San Diego that are reliable and offer competitive travel times to major destinations;
7. Offer accessible public and social service transportation services that support the smart growth policies as outlined in the Regional Comprehensive Plan (RCP);
8. Offer accessible public and social service transportation services in San Diego without discrimination on the basis of race, color, national origin, or disability; and
9. Enhance the mobility choices of the transportation disadvantaged by improving coordination and developing alternative models of transportation.
4.3 Regional Performance Evaluation Program The objectives and performance indicators included in the regional performance evaluation program evaluate transit service on a five-year time horizon. This allows SANDAG to more carefully evaluate transit performance and to ensure that additional planning and funding resources are allocated appropriately. This section provides the evaluation of transit service and also includes indicators to monitor social service transportation as required by the federal government in Safe, Accountable, Flexible, and Efficient Transportation Equity Act: A Legacy for Users (SAFETEA-LU).
Regional Transit Service Monitoring and Links to the RTP The monitoring of transit performance provides a tool to annually assess the overall health of the regional public transit system. The objectives explored in this section are derived from the RTP, which includes several action items relevant to the evaluation of transit and social service transportation performance. These action items are:
Facilitate efforts to promote coordination among fixed-route and paratransit operators and nonprofit agencies in the region;
Improve accessibility of transit stops and walkways to stops for persons with disabilities and identify potential funding programs for these improvements;
Improve connections and transfers between paratransit and fixed-route transit operators;
Continue educational efforts on the use of transit and accessibility equipment among persons with disabilities;
Continue to use the SANDAG Social Services Transportation Advisory Council (SSTAC) to recognize the changing transit needs of seniors and persons with disabilities, including those too frail to access traditional fixed-route and Americans with Disabilities Act (ADA) paratransit services;
Continue to implement and expand the TransNet Senior Mini-Grant Program;
Implement monitoring of regional transit service through the use of automated data collection and vehicle location systems; and
CHAPTER 4: GOALS, OBJECTIVES, AND MONITORING
The Coordinated Plan (2010 – 2014) 4-3
Work with the region’s transit operators to ensure that transit services are available to minority, disabled, elderly, and low-income persons so that they have access to service, employment, and schools.
Guidelines vs. Targets
Under these RTP action items, the general approach to evaluating transit and social service transportation includes the setting of guidelines where the requirement is in a SANDAG policy or the requirement is a target in state or federal regulations. The guidelines presented in this chapter are based on a five-year service objective, which can be adjusted, as needed, to reflect changing conditions. These conditions may include, but are not limited to, funding, energy costs, and the health of the local economy. The guidelines also may be updated to reflect changes in funding levels or from a desire to adjust service levels. On the other hand, the identified targets are based on requirements established by state and federal legislation or regulations.
Interpreting the Results The results of the performance indicators give the transit agencies, SANDAG, the public, and elected officials valuable information, including:
Evaluation of regional transit system performance;
Determination of whether sufficient funding is being provided to the regional transit system to meet the guidelines and targets;
Indication of the need for transit priority measures and, once implemented over time, how well they are performing in terms of improving transit performance;
Assessment of regional efforts to better link transit and land use planning through regional smart growth programs; and
Identification of deficiencies or service gaps.
Methodology and Performance Indicator Development Care has been taken to identify objectives that can easily be quantified and indicators that can be objectively measured with existing or proposed data sources. Should the development of new transportation funding sources arise, the evaluation of transit service performance may enable the justification for the programming of future funds for transit given the ongoing evaluation of actual quantitative performance data. The goals and objectives influence the design and quality of the transit service and implement the transit vision of the RTP. The RTP policy goals and objectives are to be applied across the entire county, while the performance indicators and guidelines have been tailored to specific environments. The guidelines help provide clarity for decision makers and the public regarding the level of transit service proposed to be provided regionally and assist individuals in making decisions on where to locate their residence, place of employment, choose a school, or location for their business.
CHAPTER 4: GOALS, OBJECTIVES, AND MONITORING
4-4 The Coordinated Plan (2010 – 2014)
Comprehensive Performance Evaluation Categories The comprehensive objectives are based on regional issues as they relate to transit and social service transportation. These objectives include multiple variables or results which have regional impacts beyond transit or social service transportation. The passenger-centered comprehensive objectives address the following categories:
Greenhouse Gas (GHG) Reduction Measures
Regional Growth
Transit Performance Evaluation Categories The transit objectives are based on subregional areas that group similar geographic or demographic areas. These objectives either relate to the goals of the RCP, the RTP, or have consistently been tracked through the annual Transportation Development Act (TDA) performance improvement program. The transit objectives address the following categories:
Financial
Productivity
Access
Convenience
Reliability and Speed
Environmental Justice
Comfort A brief description of the performance results relating to these categories is included in this chapter, while the detailed statistical tables are included in Appendix L. This report also includes data sets reported in prior years in order to ensure statistical continuity between previous Regional Short-Range Transit Plans and future Coordinated Plans (Appendices B and C). It is anticipated that in future plans, this data set will be improved and expanded as new data from automated sources becomes available to encompass social service transportation.
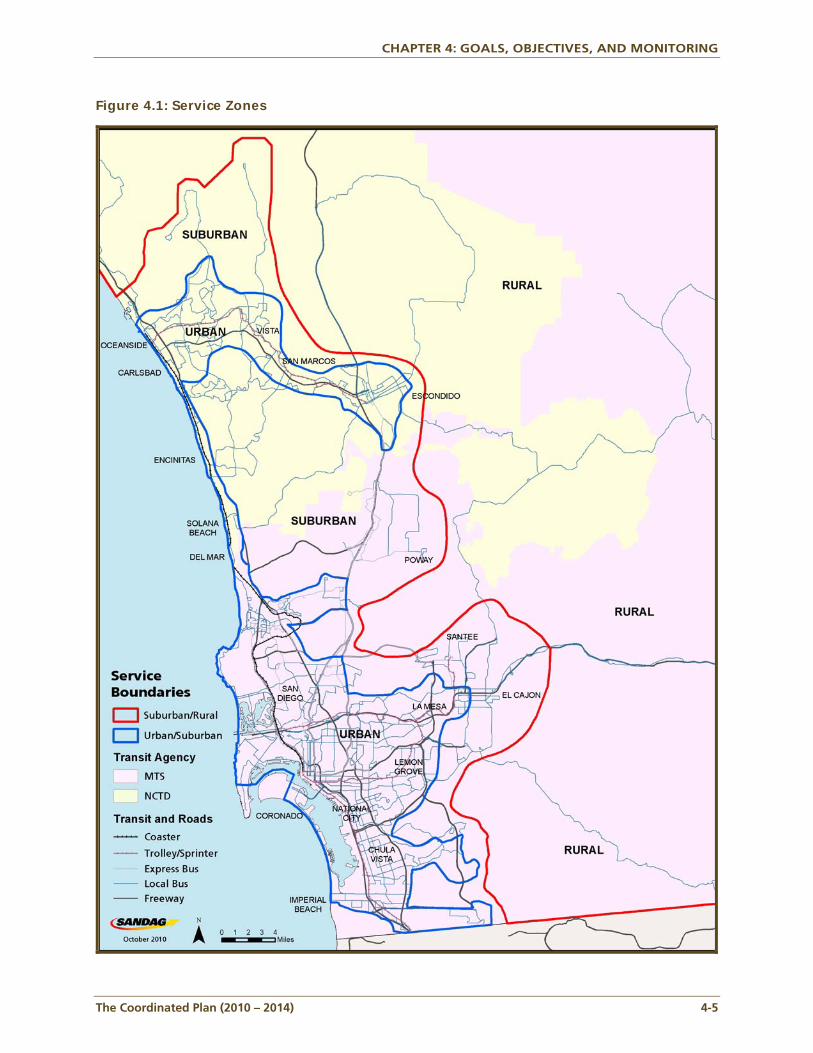
Service Zones The Coordinated Plan must integrate the transit vision of the 2030 RTP, the smart growth objectives of the RCP, the short-term service objectives of the MTS Comprehensive Operations Analysis (COA) and NCTD’s forthcoming Mobility Plan. To do this, San Diego County was divided into three distinct types of service zones based on land use, demographics, and travel behaviors in order to more carefully evaluate transit service in these zones. These three zones are urban, suburban, and rural, which are shown in Figure 4.1. The objectives, indicators, and guidelines or targets provide policy direction to the two transit agencies as they implement service to ensure that it is provided efficiently, effectively, and equitably across the entire service area. The objectives and indicators usually apply across all zones, but the guidelines will generally vary by zone reflecting the different needs and markets in the urban, suburban, and rural zones.
CHAPTER 4: GOALS, OBJECTIVES, AND MONITORING
The Coordinated Plan (2010 – 2014) 4-5
Figure 4.1: Service Zones
CHAPTER 4: GOALS, OBJECTIVES, AND MONITORING
4-6 The Coordinated Plan (2010 – 2014)
There are two urbanized areas of San Diego County that are connected via the Interstate (I-) 5 north coastal urbanized zone forming one continuous urban zone, as shown in Figure 4.1. The largest urban area within the urban zone covers the denser central, south, and east county areas and extends from University City on the north to Imperial Beach in the south and from the coast east to El Cajon. The northern urbanized area follows the SPRINTER corridor in North County and includes parts of Oceanside, Escondido, Carlsbad, Vista, and San Marcos. The coastal urban zone generally covers the lands between I-5 and the Pacific Ocean from La Jolla to Oceanside. The urban zones are characterized by two key factors that support high levels of transit service: higher-density, transit-oriented land uses (residential, commercial, industrial, institutional) and good access to transit via a network of arterial and collector roadways. A rich transit network in this zone should be provided and designed to allow for spontaneous use for a wide range of destinations and trip needs throughout the day, including early evening. The suburban zone surrounds the urban zone. The suburban zone is characterized by low-density development and street patterns that make access to transit difficult. These areas may include some smart growth development, including pockets of transit-oriented residential, commercial, and institutional uses; however, the overall development pattern is not transit friendly. The result is that spontaneous transit use would be difficult to achieve even if a high level of service is provided. Thus, transit services in the suburban zone are best oriented toward providing peak-period commuter services, linkages to major destinations in key travel corridors, and community-based services tailored to individual community needs. The provision of park-and-ride facilities is needed to maximize access to the peak-period commuter services. The third zone (rural) extends from the eastern edge of the suburban zone into the backcountry areas. The limited transit services are designed to maintain lifeline access to rural villages. The zones were initially developed to support planning for public transportation; however, in the future they also may become a useful tool in planning for social service transportation. It may become necessary in the future to use the zones as means of prioritizing social service transportation needs and expenditures. For example, it seems unlikely that the region will be able to provide the same level of social service transportation services and mobility choices for people living in rural areas as for those people who are living in urban areas.
Comprehensive Objectives The comprehensive objectives outlined below involve more than just transit or social service performance data. The climate change indicator includes an evaluation of the future benefit of transit toward regional GHG reduction targets, while the growth objectives looks at transit ridership compared to other growth measures in the region.
GHG REDUCTION OBJECTIVE Public transit can play an important role in the reduction of regional GHG emissions to combat global climate change. In doing so, transit can contribute to the emissions reductions targets included in California Senate Bill (SB) 375 (Government Code § 65080 et seq.) for passenger cars and light-duty trucks. Quantifying potential GHG emissions reductions from transit operations will help achieve the draft targets set by the California Air Resources Board required by SB 375. This analysis
CHAPTER 4: GOALS, OBJECTIVES, AND MONITORING
The Coordinated Plan (2010 – 2014) 4-7
also will support the SANDAG development of a Sustainable Community Strategy, also required by SB 375. Since passenger cars and light-duty trucks account for about 41 percent of the region’s cumulative GHG emissions,1 transit’s role is potentially substantial in order to curb GHG emissions down to desired levels. The anticipated benefits of transit ridership on GHG reductions will be quantified and incorporated into future Coordinated Plans.2 The transit GHG reduction objective and guideline are as follows:
Objective Reduce regional GHG emissions
Guideline Reduced carbon emissions from the expansion or addition of regional transit services
GROWTH OBJECTIVE In the San Diego region, ridership growth is measured against growth in population and against growth in employment and growth in vehicle registrations. The need to increase transit ridership is a corollary to the service growth projected in the RTP. In addition, many existing services have additional capacity to handle more riders at no additional cost; however, much of the capacity is in the off-peak direction or during off-peak periods. To take advantage of this capacity may require land use change and significant transit-oriented development, which is beyond the direct control of SANDAG and the transit operators.
Objective The ridership for each transit agency shall grow faster than the rate of growth in population, jobs, and private vehicle registrations within their service area.
Guideline Year-over-year growth in transit ridership by operator.
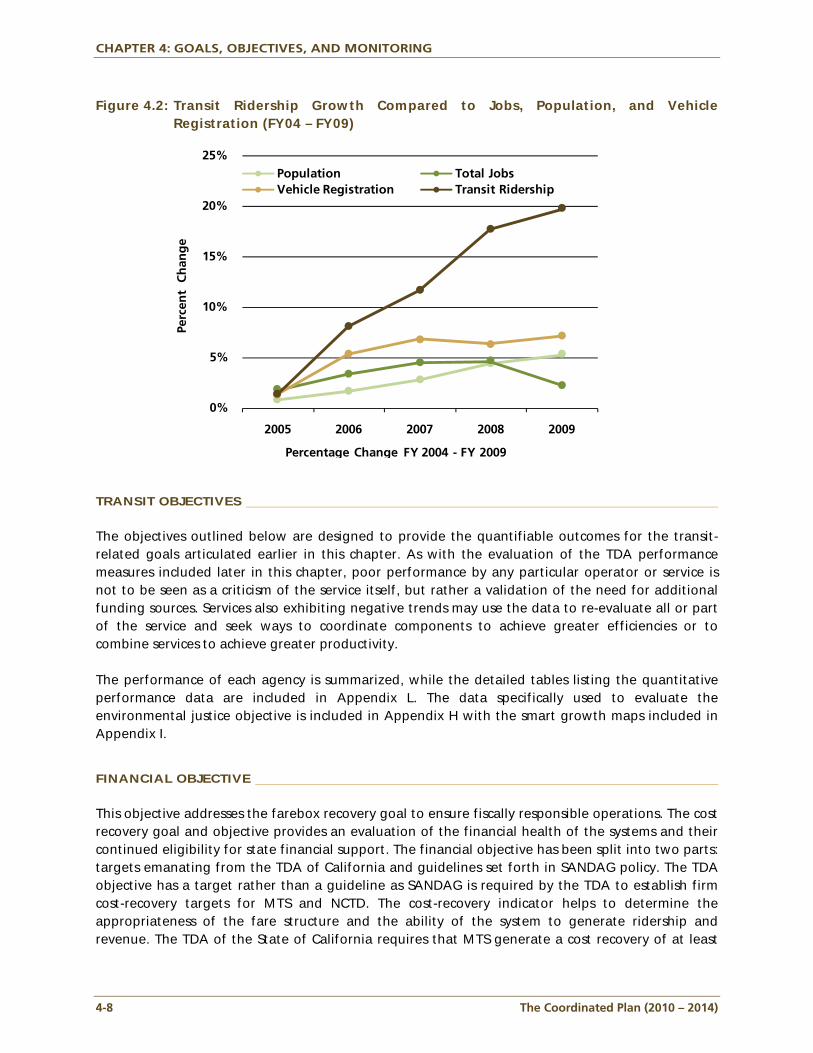
Results Between FY 2008 and FY 2009, transit ridership growth outpaced all other growth indicators (population, employment, and rate of vehicle registrations) in the region. Both MTS and NCTD also posted ridership increases from FY 2008 to FY 2009 despite declining revenue hours. Additionally, transit ridership growth outpaced the other growth indicators over the last five years (FY 2004 – FY 2009) as shown in the following chart.
1 From the September 2008 “San Diego County GHG Inventory” report prepared by the Energy Policy Initiatives Center
(EPIC), University of San Diego. 2 Available reporting methodologies include the Climate Registry’s “Performance Metrics for Transit Agencies” (June 2010,
Version 1.0), which include three specific metrics: emissions per passenger-mile traveled, emissions per vehicle-mile and emissions per revenue vehicle-hour.
CHAPTER 4: GOALS, OBJECTIVES, AND MONITORING
4-8 The Coordinated Plan (2010 – 2014)
Figure 4.2: Transit Ridership Growth Compared to Jobs, Population, and Vehicle Registration (FY04 – FY09)
TRANSIT OBJECTIVES The objectives outlined below are designed to provide the quantifiable outcomes for the transit-related goals articulated earlier in this chapter. As with the evaluation of the TDA performance measures included later in this chapter, poor performance by any particular operator or service is not to be seen as a criticism of the service itself, but rather a validation of the need for additional funding sources. Services also exhibiting negative trends may use the data to re-evaluate all or part of the service and seek ways to coordinate components to achieve greater efficiencies or to combine services to achieve greater productivity. The performance of each agency is summarized, while the detailed tables listing the quantitative performance data are included in Appendix L. The data specifically used to evaluate the environmental justice objective is included in Appendix H with the smart growth maps included in Appendix I.
FINANCIAL OBJECTIVE This objective addresses the farebox recovery goal to ensure fiscally responsible operations. The cost recovery goal and objective provides an evaluation of the financial health of the systems and their continued eligibility for state financial support. The financial objective has been split into two parts: targets emanating from the TDA of California and guidelines set forth in SANDAG policy. The TDA objective has a target rather than a guideline as SANDAG is required by the TDA to establish firm cost-recovery targets for MTS and NCTD. The cost-recovery indicator helps to determine the appropriateness of the fare structure and the ability of the system to generate ridership and revenue. The TDA of the State of California requires that MTS generate a cost recovery of at least
0%
5%
10%
15%
20%
25%
2005 2006 2007 2008 2009
Perc
ent
Ch
ang
e
Percentage Change FY 2004 - FY 2009
Population Total JobsVehicle Registration Transit Ridership
CHAPTER 4: GOALS, OBJECTIVES, AND MONITORING
The Coordinated Plan (2010 – 2014) 4-9
31.9 percent for all services except the Commuter Express Service, which must achieve a 20 percent cost recovery. NCTD must achieve a minimum cost recovery of 18.8 percent for all services. Additionally, the SANDAG guideline stems from Board of Directors’ direction to obtain a farebox recovery ratio that is higher than the TDA targets to encourage revenue growth and ridership (SANDAG Policy 29). To do this, the SANDAG guideline was developed to track farebox recovery growth in terms of trends above the TDA thresholds.
Objective For each transit agency to meet or exceed minimum farebox cost-recovery targets or guidelines.
TDA Target Percentage of operating costs recovered from fare revenue for fixed-route and demand responsive services (31.9 percent MTS, 20 percent MTS Commuter Express, 18.8 percent NCTD, and 10 percent MTS ADA and NCTD ADA).
Results Both transit agencies met the performance targets for this objective.
SANDAG Guideline
Farebox recovery should improve annually above the minimum TDA targets.
Results Both MTS and NCTD met the performance objective for this category for fixed-route services, and NCTD met it for ADA services. MTS, however, did not meet this objective for ADA service since a slight downward trend was identified in this category since FY 2007.
PRODUCTIVITY OBJECTIVE This objective addresses the goals to operate productive services that also are convenient and appropriate for the markets being served. In order to meet this goal, an objective was developed to measure productivity and to judge whether appropriate levels of service are being provided. Separate guidelines have been established for each service type to reflect differing expectations. A guideline was chosen instead of a target, as this is a SANDAG policy objective, rather than a state or federal requirement. The productivity evaluation includes an evaluation of passengers per revenue- hour and average percentage of seats occupied. Both measures provide a passenger-centric means of evaluating productivity and the attractiveness of a service.3 Calculating a load factor for a transit service has some similarity to a capacity analysis for a roadway. Both roads and transit services are well utilized during peak periods, but when measured over an entire operating day, the capacity utilization is much less. Transit systems reduce capacity or headway during off-peak hours to keep their load factors from falling too low. Roads, as fixed facilities cannot usually reduce capacity in off-peak hours.4
3 Transit productivity is impacted by nonproductive time resulting from deadhead, layovers, and operator makeup time
(time for which drivers are paid, but are not driving), which means that load factor may be a less valuable measurement for analyzing specific routes. MTS and NCTD will need to continue to look at other more detailed measurement techniques to determine potential service adjustments at the route or route segment level.
4 In urban areas, transit services that manage an overall daily load factor average of at least 20 percent are doing well. A typical urban arterial, such as Balboa Avenue in San Diego, El Camino Real in North County, and H Street in Chula Vista also have a typical all-day capacity utilization rate by all vehicles of about 20 percent. Sample capacity calculations for these arterial roadways are provided in Appendix G.
CHAPTER 4: GOALS, OBJECTIVES, AND MONITORING
4-10 The Coordinated Plan (2010 – 2014)
Objective To operate transit services that are productive and appropriate for the markets being served.
Guideline 1 Average annual revenue passengers per revenue service-hour by operator (at least 35 revenue passenger boardings/service-hour for MTS and at least 20 revenue passenger boardings/service-hour for NCTD).
Results Both MTS and NCTD met both guidelines for this objective.
Guideline 2 Average percentage of seats occupied (load factor) at or above the set thresholds included in Appendix L, which vary by service type, zone and time of day (peak/off peak).
Results In FY 2009 MTS met all of the guidelines for this category, while NCTD met all but the urban regional and urban corridor guidelines. NCTD did not meet the urban corridor guidelines (peak and off-peak) due to the SPRINTER service, which is the only corridor service. However, only the last quarter of FY 2009 SPRINTER data included the reduction of SPRINTER trains from two cars to one car in off-peak timeframes. Therefore, FY 2010 should reveal an improvement in this measure. Additionally, NCTD did not meet its urban regional guidelines (peak and off-peak) due to COASTER performance which has been impacted by the economic downturn and recent fare increases. The NCTD rural local bus indicator also was slightly below the guideline. NCTD will be addressing these deficiencies in the Mobility Plan currently being prepared.
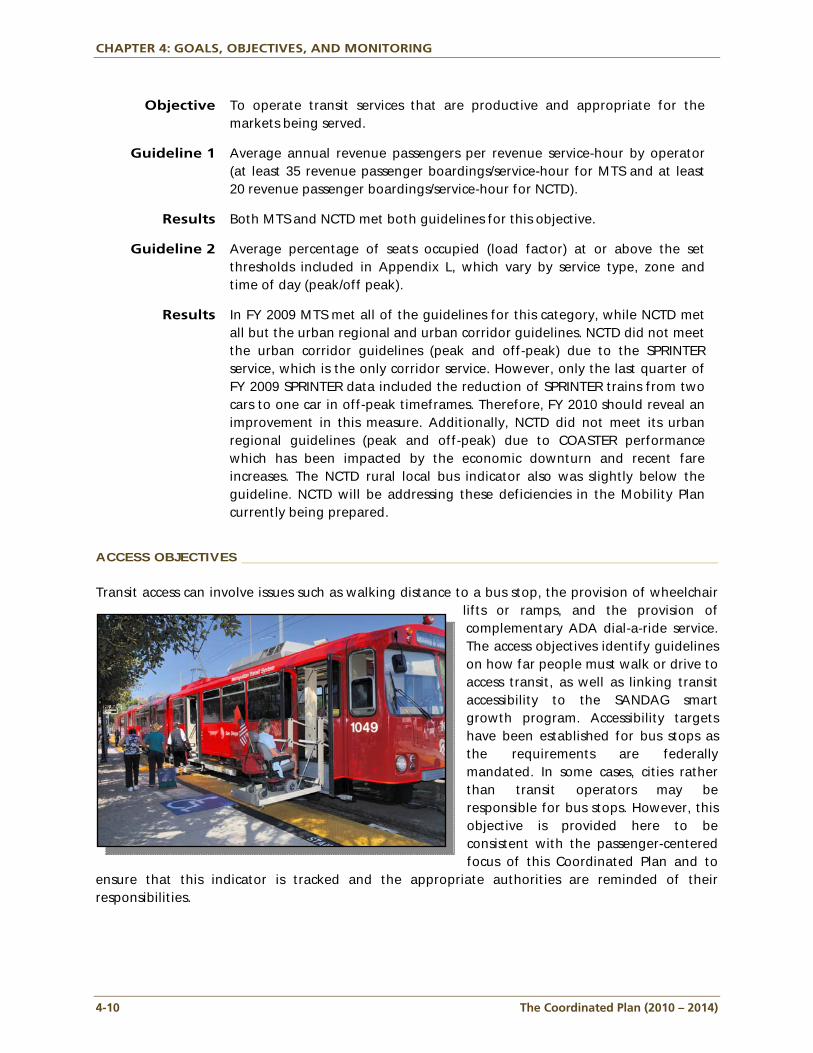
ACCESS OBJECTIVES Transit access can involve issues such as walking distance to a bus stop, the provision of wheelchair
lifts or ramps, and the provision of complementary ADA dial-a-ride service. The access objectives identify guidelines on how far people must walk or drive to access transit, as well as linking transit accessibility to the SANDAG smart growth program. Accessibility targets have been established for bus stops as the requirements are federally mandated. In some cases, cities rather than transit operators may be responsible for bus stops. However, this objective is provided here to be consistent with the passenger-centered focus of this Coordinated Plan and to
ensure that this indicator is tracked and the appropriate authorities are reminded of their responsibilities.
CHAPTER 4: GOALS, OBJECTIVES, AND MONITORING
The Coordinated Plan (2010 – 2014) 4-11
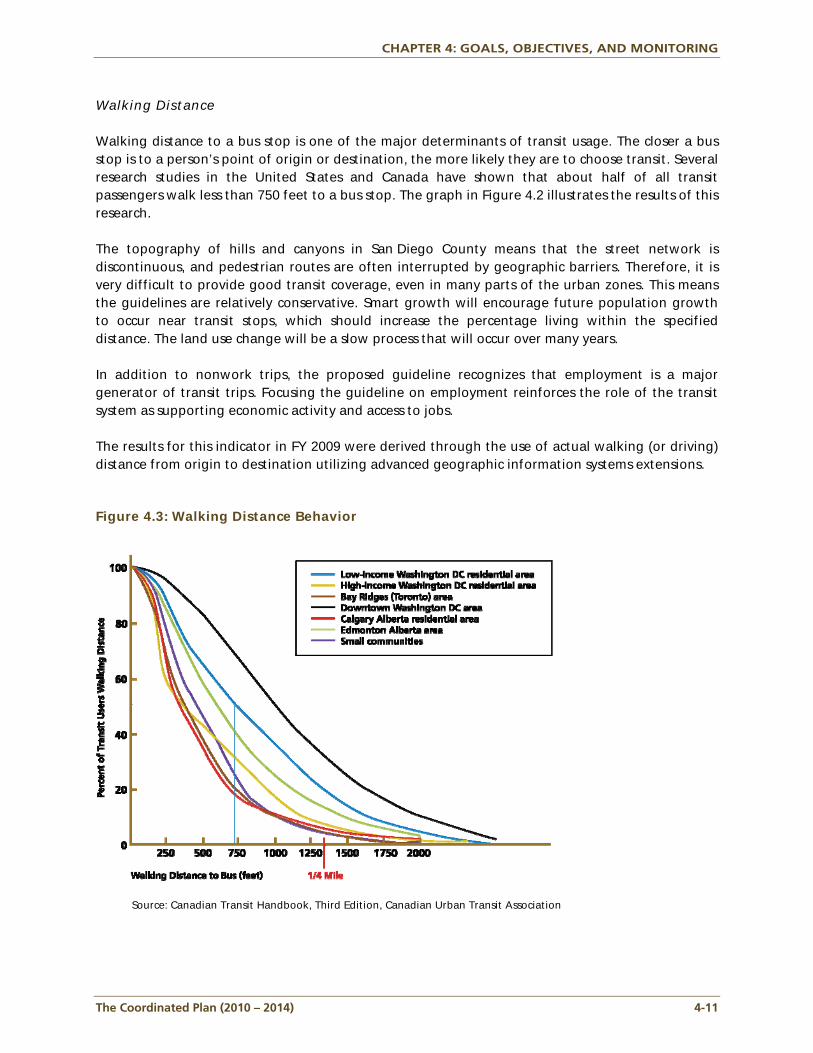
Walking Distance Walking distance to a bus stop is one of the major determinants of transit usage. The closer a bus stop is to a person’s point of origin or destination, the more likely they are to choose transit. Several research studies in the United States and Canada have shown that about half of all transit passengers walk less than 750 feet to a bus stop. The graph in Figure 4.2 illustrates the results of this research. The topography of hills and canyons in San Diego County means that the street network is discontinuous, and pedestrian routes are often interrupted by geographic barriers. Therefore, it is very difficult to provide good transit coverage, even in many parts of the urban zones. This means the guidelines are relatively conservative. Smart growth will encourage future population growth to occur near transit stops, which should increase the percentage living within the specified distance. The land use change will be a slow process that will occur over many years. In addition to nonwork trips, the proposed guideline recognizes that employment is a major generator of transit trips. Focusing the guideline on employment reinforces the role of the transit system as supporting economic activity and access to jobs. The results for this indicator in FY 2009 were derived through the use of actual walking (or driving) distance from origin to destination utilizing advanced geographic information systems extensions. Figure 4.3: Walking Distance Behavior
Source: Canadian Transit Handbook, Third Edition, Canadian Urban Transit Association
CHAPTER 4: GOALS, OBJECTIVES, AND MONITORING
4-12 The Coordinated Plan (2010 – 2014)
Objective1 In urban areas, transit and land use development should ensure a comfortable walking distance to transit for residents and jobs.
Guideline 1 60 percent of residents or jobs within one-quarter mile of a bus stop or rail station in urban areas.
Results NCTD met the employee guideline, but did not meet the residential guideline for this objective. For NCTD, this issue will be evaluated in the upcoming NCTD Mobility Plan. MTS did not meet either criterion for this objective. Even so, SANDAG will monitor the replacement of service in FY 2011 to determine if performance returns to FY 2008 levels (61 percent for residential access and 69 percent for employment access). Additionally, the employment access issue is primarily due to sprawling employment sites which have outgrown the ability for MTS to serve all sites under current budget constraints.
Objective 2 Transit and land use development should attempt to ensure that in suburban areas, residents are within a reasonable distance of a park-and-ride facility with access to the transit network, and transit services should be provided to existing or planned smart growth areas.
Guideline 1 80 percent of suburban residences within five miles of a park-and-ride facility with regional or corridor services.
Results Park-and-ride facilities in the MTS area met the guideline. However, NCTD did not meet the guideline, but improved over FY 2008. Since the operators are engaged in the development of park-and-ride facilities but are not responsible for their implementation, it is the responsibility of the region to explore additional options for park-and-ride locations in the region.
Guideline 2 70 percent of residents and 75 percent of jobs within one mile of a bus stop or rail station in suburban areas.
Results MTS and NCTD met both guidelines for this objective (suburban residential and employment access).
Smart Growth To provide consistency with the smart growth objectives of the SANDAG RCP, the following performance measure recognizes the critical link between land use and transportation services.
Objective 3 Transit service should be designed to support smart growth.
Guideline Transit service should be designed to support the smart growth areas located on the SANDAG Smart Growth Concept Map.
CHAPTER 4: GOALS, OBJECTIVES, AND MONITORING
The Coordinated Plan (2010 – 2014) 4-13
Results All of the “existing/planned” smart growth areas included in the SANDAG Smart Growth Concept Map are served by the requisite levels of transit specified in the RCP. The vast majority of “potential” smart growth areas also are served by transit. Several areas do not have the level of transit service called for in the RCP, including 20 areas5 without the desired levels of regional transit service. SANDAG will look into incorporating service improvements in these areas with the next revision of the RTP since SANDAG is responsible for the planning, development and implementation of regional services.
Additionally, there were six areas which require high–frequency, local service under the operational purview of the transit agencies. Five areas6 are located in the MTS service area, and one is located in the NCTD service area.7 Maps illustrating these areas along with the regionally deficient areas are shown in Appendix I. There is a recognition that, while service to smart growth areas is desirable, implementing higher levels of service needs to be justified based on the overall transit demand potential of the area. As such, MTS and NCTD will continue to review the demand potential in these potential smart growth areas compared with the demand potential in other areas where service improvements are needed. Given the current budget shortfall faced by the transit agencies, the ability to implement service improvements will likely be constrained over the next several years.
Lifeline Services The evaluation of lifeline services helps to ensure that at least some level of service is provided to areas that have been identified as smart growth opportunity areas.
Objective 4 Transit should attempt to maintain existing lifeline services to currently identified rural village smart growth areas.
5 Chula Vista, Otay Ranch University (CV-10), Chula Vista, Southwestern College (CV-15), Coronado, Downtown Coronado
Town Center (CO-1), Del Mar, New Coaster Station at Fairgrounds (DM-1), El Cajon, Grossmont Community College (EC-4), Poway, Poway Road and Community Road (PW-1), Poway, Pomerado Hospital Area (PW-2), San Diego, Black Mountain Ranch (Southwest of Intersection of Camino del Sur and Black Mountain) (SD-BMR-1), Carmel Mountain Ranch (Carmel Mountain Ranch Road and Highland Ranch Road) (SD-CMR-1), San Diego, Carmel Valley (Southeast of intersection of El Camino Real and Del Mar Heights) (SD-CV-1), San Diego, Clairemont Mesa (Morena Boulevard from Clairemont Drive to Tecolote Road) (SD-CM-8), San Diego, Mira Mesa, (Mira Mesa Boulevard from Greenford Drive to Marbury) (SD-MM-4), San Diego, Otay Mesa, Airway Road between Heritage Road and Britannia Boulevard Interchange (SD-OM-2), San Diego, Otay Mesa, Southwestern College (SD-OM-3), San Diego, Pacific Highlands Ranch (East of Carmel Valley Road and Del Mar Heights Road) (SD-PHR-1), San Diego, Scripps Miramar Ranch (West side of Scripps Ranch Boulevard at Mira Mesa Boulevard and Hibert Street) (SD-SMR-1), San Diego, Torrey Highlands (north of intersection of SR 56 and Camino del Sur) (SD-THD-1), Santee, Intersection of Edgemoor Drive and Mission Gorge Road (ST-2), Santee, Mission Gorge Road (ST-3) and County of San Diego, Lakeside-Bostonia (CN-7).
6 La Mesa, Lake Murray Boulevard (LM-9), San Diego, City Heights (Euclid Avenue from El Cajon Boulevard to University Avenue) (SD-CH-2), San Diego, Encanto (Market Street and Imperial Avenue from 47th St. to 69th Street) (SD-EN-1), San Diego, Otay Mesa (South of I-905 and Oceanview Hills Parkway) (SD-OM-1) and San Diego, Uptown (SD-UP-3).
7 Escondido, Citracado Parkway, and Centre City Parkway (ES-6).
CHAPTER 4: GOALS, OBJECTIVES, AND MONITORING
4-14 The Coordinated Plan (2010 – 2014)
Guideline One return trip provided at least two days per week to destinations from rural villages identified on the Smart Growth Concept Map.
Results Both MTS and NCTD met both guidelines for this objective.
Accessible Services The evaluation of accessible services helps to ensure that accessible services are provided to disabled populations in the region.
Objective 5 Attempt to provide fully accessible bus stops and transit stations.
Guideline 100 percent of bus stops and transit stations that are fully accessible.
Results Neither MTS nor NCTD currently meet the guidelines established for this category. MTS will, however, finish developing a comprehensive inventory of all of its bus stops in the next year so that MTS may seek grant funding and develop a plan to prioritize and retrofit nonADA-compliant stops. Additionally, NCTD has developed a program to look beyond the accessibility of the stop to look comprehensively at the path of travel to the stop; however, the identified deficiencies point to the need for additional funding in this category.
CONVENIENCE OBJECTIVES Five of the regional transit goals relate to developing a transit system that is convenient for users and potential users. The goals in this section all relate to convenience but note that different levels of service are appropriate for different markets or zones. The span of service guidelines define the times that transit service will be provided. For the Urban Zone, the objective is to ensure that service is convenient and can accommodate travel during most hours of the day. In the suburban zone, the emphasis on providing excellent commuter services in major corridors is backed by a guideline to provide a limited network of lifeline services. In the rural areas, the policy objectives and guidelines only contemplate lifeline levels of service. The MTS and NCTD Boards of Directors also may decide to provide higher levels of service in specific areas where there is higher ridership or special market conditions. The frequency of service also influences people’s modal choice. The urban core is the area that requires and can support a high-level of frequency that will enable passengers to travel spontaneously. The COA has developed an extensive network of routes with headways of 15 minutes or better in the urban zone. Experience in San Diego and elsewhere shows that better headways almost always result in more riders. The minimum regional service headway goals are set at 20 minutes for bus and 30 minutes for rail, consistent with the vision of the RTP. With the additional investment described in the 2030 RTP, the headways will be enhanced in future plans with the goal of bringing bus services in key travel corridors up to the service goal of 15 minutes or better for all-day service. The current goals
CHAPTER 4: GOALS, OBJECTIVES, AND MONITORING
The Coordinated Plan (2010 – 2014) 4-15
recognize the high cost of reducing rail headways below 30 minutes and take into account current funding or facility limitations.
Objective 1 To provide an appropriate span of service to bus stops based on the zone designation.
Guideline Percentage of stops that have transit service within the specified timeframes for each zone and day of week (weekday/Saturday/Sunday) that are at or above the thresholds included in Appendix L.
Results Both agencies did not meet weekday guidelines for this objective. It is recognized, however, that limited financial resources have an impact on reduced service spans at “shoulder” time periods where service is less efficient.
Objective 2 To provide frequency appropriate for spontaneous travel on major corridors and convenient travel to all parts of the urban core.
Guideline Minimum headways expressed in minutes that are at or below the thresholds included in Appendix L, which vary by service type, zone, and time of day (peak/off peak).
Results The performance results for the frequency performance measure were mixed, with both MTS and NCTD exceeding several frequency thresholds. The results show that, while the service guidelines are certainly reasonable expectations for our transit system, funding for public transportation in the region is not sufficient for MTS and NCTD to provide this desired level of service.
RELIABILITY AND SPEED OBJECTIVES Reliability and speed are very important to existing and prospective transit users. As such the transit service goals recognize the importance of reliability and maintaining or improving travel times. The reliability objective provides a link between the published timetables (promised service) and actual service operated on the road.8 The guideline for local and community bus service was lowered to 80 percent in the 2008-2012 Coordinated Plan from 95 percent. This was done to reflect experience from other transit agencies that have shown that the previous manual schedule adherence-checking often overstates reliability, and to distinguish local and community buses from regional and corridor cars where greater reliability is expected due to use of reserved rights-of-way and priority systems. In future years, the guidelines can be adjusted as more data is received and analyzed. The evaluation of completed trips also is included under the first objective since it is important to evaluate whether the overall transit routes are adequately serving the public. While on-time performance helps evaluate scheduling or congestion issues, this indicator quantifies maintenance or driver issues for vehicles that are taken out of service.
8 Service reliability is a critical factor that influences people’s modal choice. The automatic vehicle location (AVL) system now
being installed on the transit fleet will provide useful data for evaluating the schedule reliability of the system. These guidelines are consistent with the capabilities of the electronic data reporting that will be feasible with AVL.
CHAPTER 4: GOALS, OBJECTIVES, AND MONITORING
4-16 The Coordinated Plan (2010 – 2014)
The guidelines for ADA paratransit meet federal rules that establish guidelines for ADA paratransit service. The federal law does not specify performance levels for missed trips or schedule performance, but does require a high level of service be provided. MTS considers an Access trip to be on time if the passenger is picked up within a 10-minute window surrounding the promised pickup time. NCTD considers NCTD LIFT to be on time if the passenger is picked up within a 20-minute window. The second objective is to ensure that transit services do not lose speed over the course of the evaluation period. Slower services cost more in operating expenses and are less attractive to passengers. It becomes increasingly difficult to maintain service speed in the face of growing traffic congestion; however, implementation of transit priority measures can mitigate this problem. Deficiencies in this area can point to the need for additional funding for signal priority systems which can be developed through partnerships between Caltrans, SANDAG, various cities, transit agencies, developers, or other organizations.
Objective 1 To operate transit services that are reliable, offer competitive travel times, and adhere to published timetables or service intervals.
Guideline 1 Percentage of trips on time at departure, arrivals, and enroute timing points.
Results MTS met the 80 percent on-time guideline for regional services (Premium Express Bus), but fell shy of the guideline for urban corridor and local bus service and suburban corridor, local bus, and community bus service. For the urban and suburban corridor bus guideline, this was due to the performance of Routes 20, 50, 210, 929, 31, and 44. For the urban and suburban local bus guideline, this was due to Routes 15, 30, 974 and 929. NCTD generally met the 80 percent on-time guideline, with the exception of regional rail and rural local bus services. The regional rails service is solely the COASTER, and the rural local bus service decline was due to Route 395.
Guideline 2 Percentage of completed trips.
Results Both MTS and NCTD met both guidelines for this objective.
Guideline 3 Percentage of ADA trips with pickup within schedule window.
Results In FY 2009, MTS achieved 92.6 percent on-time performance based on this standard. While this is below the 94 percent performance guideline, it should be noted that this is a high level of service compared to most large urban areas in the country. MTS also has advised that due to growing traffic congestion, and longer trip lengths, it may be necessary to either lengthen the ten-minute window or reduce the percentage guideline for on-time performance. Given that FY 2009 was the first year that MTS dropped below the performance threshold for this indicator, the Short-Range Transit Task Force will discuss this issue in FY 2011 to determine if a lower threshold is appropriate for MTS given their 10-minute pickup window. NCTD’s corresponding service window is 20 minutes, and their FY 2009 performance at 94.0 percent met the objective.
CHAPTER 4: GOALS, OBJECTIVES, AND MONITORING
The Coordinated Plan (2010 – 2014) 4-17
Objective 2 To maintain or improve existing average speeds on existing transit services within the geographical zones.
Guideline Average transit operating speed in each zone.
Results Both MTS and NCTD met the speed guidelines with the exception of NCTD rural service, which was due to slower speeds on Route 386. This issue will be evaluated in the upcoming NCTD Mobility Plan.
ENVIRONMENTAL JUSTICE OBJECTIVE This objective supports the federal environmental justice, federal Title VI legislation, and RTP equity goals articulated in Chapter 3.
Objective To ensure that transit service and amenities provided in minority and low-income census tracts are on average comparable to the level of service and amenities provided in nonminority census tracts.
Target Percentage of minority and low-income census tracts with transit service must not be disparately impacted when compared to the average level of service and amenities provided in nonminority census tracts.
Results An updated Title VI evaluation was conducted for FY 2009 and found that the transit operators provided service in minority and low-income census tracts that was equal or of better quality than service typically provided in nonminority and non low-income census tracts. The results of this analysis are included in Appendix H.
COMFORT OBJECTIVE This objective addresses the goal to provide appropriate service for the markets being served. One of the least welcomed aspects of public transit is the need to stand on board crowded, moving buses or trains during peak periods. Standing can be uncomfortable and is perceived by some passengers as being unsafe, particularly for Express/Bus Rapid Transit services operating at freeway speeds. In extreme conditions, standing also may be the result of crowding that exceeds the comfort level in terms of personal space. People are generally uncomfortable in an environment where they must stand shoulder to shoulder with complete strangers. As a result, most transit systems have policies that define the maximum capacity of bus and rail vehicles. This objective sets guidelines for transit occupancy based on standee density using available floor space. This policy proposes to adopt guidelines for transit occupancy based on standee density using only the available floor space in the calculation. This requires the measurement of the floor area for each vehicle type in the fleet, but represents the only accurate means of measuring standee density. This indicator will require on-board observations. However, automatic passenger counting (APC) data, when it becomes available, will be used to highlight any routes not meeting the guidelines.
Objective Occupancy on board vehicles should be appropriate for the distance, speed, fare, and type of service being operated.
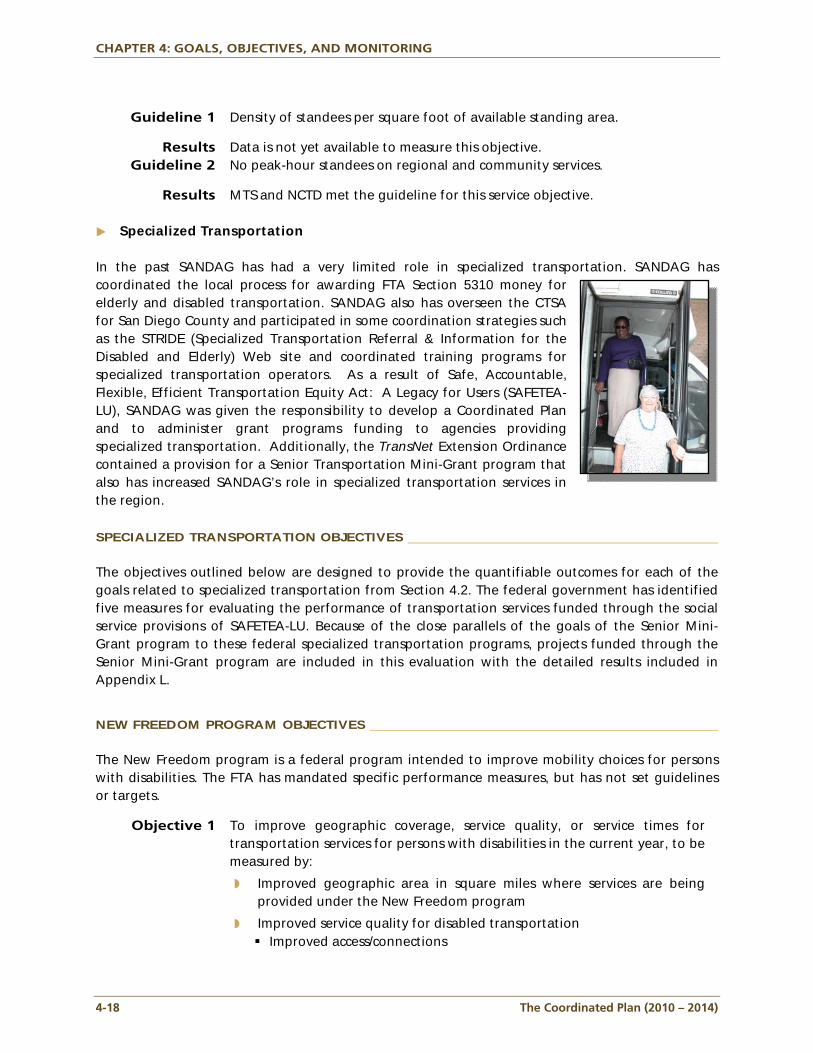
CHAPTER 4: GOALS, OBJECTIVES, AND MONITORING
4-18 The Coordinated Plan (2010 – 2014)
Guideline 1 Density of standees per square foot of available standing area.
Results Data is not yet available to measure this objective. Guideline 2 No peak-hour standees on regional and community services.
Results MTS and NCTD met the guideline for this service objective.
Specialized Transportation In the past SANDAG has had a very limited role in specialized transportation. SANDAG has coordinated the local process for awarding FTA Section 5310 money for elderly and disabled transportation. SANDAG also has overseen the CTSA for San Diego County and participated in some coordination strategies such as the STRIDE (Specialized Transportation Referral & Information for the Disabled and Elderly) Web site and coordinated training programs for specialized transportation operators. As a result of Safe, Accountable, Flexible, Efficient Transportation Equity Act: A Legacy for Users (SAFETEA-LU), SANDAG was given the responsibility to develop a Coordinated Plan and to administer grant programs funding to agencies providing specialized transportation. Additionally, the TransNet Extension Ordinance contained a provision for a Senior Transportation Mini-Grant program that also has increased SANDAG’s role in specialized transportation services in the region. SPECIALIZED TRANSPORTATION OBJECTIVES The objectives outlined below are designed to provide the quantifiable outcomes for each of the goals related to specialized transportation from Section 4.2. The federal government has identified five measures for evaluating the performance of transportation services funded through the social service provisions of SAFETEA-LU. Because of the close parallels of the goals of the Senior Mini-Grant program to these federal specialized transportation programs, projects funded through the Senior Mini-Grant program are included in this evaluation with the detailed results included in Appendix L.
NEW FREEDOM PROGRAM OBJECTIVES The New Freedom program is a federal program intended to improve mobility choices for persons with disabilities. The FTA has mandated specific performance measures, but has not set guidelines or targets.
Objective 1 To improve geographic coverage, service quality, or service times for transportation services for persons with disabilities in the current year, to be measured by:
Improved geographic area in square miles where services are being provided under the New Freedom program
Improved service quality for disabled transportation Improved access/connections
CHAPTER 4: GOALS, OBJECTIVES, AND MONITORING
The Coordinated Plan (2010 – 2014) 4-19
Improved service times for disabled transportation Improved frequency of service
Results The geographic coverage includes the Cities of La Mesa and Oceanside and 12 zip codes. Specifically, only the City of La Mesa was covered in FY 2008, while the zip codes and the City of Oceanside were added in FY 2009. Future Coordinated Plans will include information on service quality and service times when data is available from the grant recipients.
Objective 2 To add or improve environmental infrastructure, technology, and vehicles that impact the availability of transportation services for the disabled in the current year, to be measured by:
Improved infrastructure and technologies
Improved vehicles
Results No data is currently available for these categories. Information will be added, however, in future Coordinated Plans when data is available from the grant recipients.
Objective 3 To attract riders to New Freedom program services (as measures by one-way trips), to be measured by:
Improved number of one-way trips on New Freedom program services
Results The number of one-way trips provided under the New Freedom program increased from 873 trips in FY 2008 to 7,435 trips in FY 2009.
JARC PROGRAM OBJECTIVES Job Access and Reverse Commute (JARC) is a federal program intended to improve mobility choices for employment related travel for reverse commuters and persons of limited means. The FTA has mandated specific performance measures, and similar to the New Freedom program, has not set guidelines or targets. Since this is the first year SANDAG has been involved in these types of programs, no baseline information exists. The guidelines or targets will be added in future Coordinated Plans.
Objective 1 To increase the estimated number of jobs that can be accessed as a result of geographic or temporal coverage of JARC projects implemented in current year, to be measured by:
Number of jobs within a quarter mile of a stop on JARC-funded services
Results The baseline jobs accessed by the JARC projects in FY 2008 was 371,608, which increased by 13,200 between FY08 and FY09.
Objective 2 To attract riders to new JARC services (as measured by one-way trips):
Number of one-way trips on JARC-funded services
Results The baseline one-way trips provided by the JARC projects in FY 2008 was 940,149, which increased by 379,439 between FY 2008 and FY 2009.
CHAPTER 4: GOALS, OBJECTIVES, AND MONITORING
4-20 The Coordinated Plan (2010 – 2014)
SENIOR MINI-GRANT PROGRAM OBJECTIVES The Senior Mini-Grant program is a local program funded through the TransNet Extension Ordinance. SANDAG has included the requirement that all projects funded through the Senior Mini-Grant program be included in the Coordinated Plan, similar to the federal requirements under the JARC and New Freedom programs. The program and evaluation criteria were developed with stakeholder input and through this process, three performance indicators were established to measure the performance of projects funded under this program. The three measures established for operational projects funded by the Senior Mini-Grant program are:
Objective 1 To evaluate the cost-efficiency of a project, to be measured by:
Operating cost in dollars per vehicle service-hour
Results No data is currently available for this objective. Information will be added, however, in future Coordinated Plans when data is available from the grant recipients.
Objective 2 To evaluate the cost-effectiveness of a project, to be measured by:
Operating cost in dollars per passenger
Results The operating cost in dollars per passenger in FY 2009 was $32.50, which represents the baseline since there were no FY 2008 projects.
Objective 3 To evaluate the service-effectiveness of a project, to be measured by:
Passenger seat utilization
Results No data is currently available for this objective. Information will be added, however, in future Coordinated Plans when data is available from the grant recipients.
Specialized Transportation Evaluation
With the responsibility of coordinating the local process for awarding and providing grant money for the JARC, New Freedom, and Senior Mini-Grant programs, SANDAG has developed a consolidated approach to monitoring the effectiveness of these services. This monitoring system incorporates performance measures developed for evaluating Senior Mini-Grant projects, in addition to performance measures similar to the federal reporting requirements for JARC and New Freedom programs developed by the FTA. Since the evaluation of projects include a combination of funding between the three programs, SANDAG will evaluate the services at the project level rather than at the grant level.
Specialized Transportation Performance Monitoring Appendix L includes performance data related to specialized transportation service projects under the JARC, New Freedom, and Senior Mini-Grant programs. In total, there were 19 JARC, New Freedom, and Senior Mini-Grant projects operating in FY 2008 through FY 2009. These projects produced a total of 2,272,650 one-way passenger trips; extended coverage across the county through operating, capital, and mobility management grants; provided service to Oceanside, Vista, Escondido, University City, Mira Mesa, Poway, La Mesa, Spring Valley, Lemon Grove, College Area,
CHAPTER 4: GOALS, OBJECTIVES, AND MONITORING
The Coordinated Plan (2010 – 2014) 4-21
Chula Vista, City Heights, Hillcrest, Mission Hills, Normal Heights, Point Loma, Mission Beach, Pacific Beach, Ocean Beach, Morena, and Downtown San Diego (New Freedom and Senior Mini-Grant projects); and served dense employment areas with an estimated number of 384,808 jobs (JARC program projects). The following performance indicators are included in the Appendix L table to evaluate the projects:
Operating Projects/Trip-Based Services
Total number of one-way passenger trips
Operating cost per trip
Geographical coverage
Number of targeted jobs (JARC only)
Mobility Management Projects
Total number of service units provided
Operating cost per service unit
Geographical coverage
Number of targeted jobs (JARC only)
Capital Projects
Total number of units added
Operating cost per unit
Number of targeted jobs (JARC only) Additional indicators, such as operating cost per revenue-hour and passenger seat utilization, and evaluation for capital projects will be added in future years per the guidelines list in the previous section. COORDINATION OBJECTIVE The major initiative of SANDAG to improve transportation coordination among social service transportation providers has been the creation and funding of the CTSA. In 2006 SANDAG designated Full Access & Coordinated Transportation (FACT) of Oceanside to be the CTSA for San Diego County. The role of the CTSA is to improve transportation service that is needed by social service recipients by promoting consolidation of social service transportation, incorporating such benefits as centralized dispatching, combined purchasing of necessary equipment and supplies, centralized maintenance, centralized administration to eliminate duplicative administrative tasks, and consolidation of existing sources of funding. This consolidation results in more efficient and effective use of vehicles throughout the region. The core mission of the CTSA is to consolidate and coordinate transportation services to people with disabilities, senior citizens, social service agencies, health care providers, various organizations, and individuals within that particular service area. Now that SANDAG has actively managed several grant recipients over the past several years, SANDAG can begin to evaluate the coordination of the various grant projects. The following objective was set by SANDAG to develop and encourage coordinated transportation.
CHAPTER 4: GOALS, OBJECTIVES, AND MONITORING
4-22 The Coordinated Plan (2010 – 2014)
Objective 1 To effectively advance coordinated access to the full spectrum of community transportation options for populations in need (seniors, persons with disabilities, and persons of limited means) through mechanisms such as mobility management, vehicle brokerage, coordinated service, etc., to be measured by: Increase in the number of social service programs including, coordinated
transportation as an integrated component
4.4 TDA Productivity Improvement Program and Performance Monitoring In addition to matching the RTP action items to the elements of the performance monitoring program, one specific action item references the TDA and states that SANDAG is to:
Implement the service productivity and other recommendations from the performance audit process of the TDA.
This action item is accomplished through the TDA productivity improvement program and performance audit, which is included in the Coordinated Plan. This program is updated and evaluated annually so that SANDAG may distribute state TDA monies to the transit agencies.9 The productivity improvement program ensures that state and local requirements are met and that these programs improve the effectiveness and efficiency of the regional transportation system. Pursuant to California Public Utilities Code Section 99244, an operator can be allocated no more in FY 2011 than it was allocated in FY 2010 unless SANDAG determines that the operator made a reasonable effort to implement the productivity improvement recommendations adopted by the Board of Directors for the current fiscal year. SANDAG determined that both MTS and NCTD made reasonable efforts toward achieving their FY 2010 productivity goals. In FY 2008 SANDAG updated the TDA productivity improvement program to include all of the performance measures explicitly stated in the state TDA Manual Section 99246(d). Multiyear trend analysis also was included at that time since it was recognized that steps taken by the transit agencies to improve system performance often take several years to be fully realized. The productivity improvement program for FY 2010 included the evaluation of the following six TDA performance measures over a three-year period:
Operating Cost Per Passenger (adjusted for annual inflation) – measures cost-effectiveness
Operating Cost Per Revenue Hour (adjusted for annual inflation) – measures cost-efficiency
Passengers Per Revenue-Hour – measures service productivity
Passengers Per Revenue-Mile – measures service productivity
Revenue-Hours Per Employee – measures labor productivity
Farebox Recovery Ratio – measures service cost-efficiency10
9 The TDA provides funding for the region’s public transit operators and for nonmotorized transportation projects and, as
the Regional Transportation Planning Agency, SANDAG administers the TDA funds. 10 Based on the TDA Manual Sections 6633.2 and 6633.5, this measure includes the evaluation of the last four quarters of
available data (quarter 2 of FY 2009 through quarter 2 of FY 2010).
CHAPTER 4: GOALS, OBJECTIVES, AND MONITORING
The Coordinated Plan (2010 – 2014) 4-23
These performance indicators are measured separately for fixed-route (MTS Trolley, MTS Bus, NCTD SPRINTER, NCTD COASTER, and NCTD BREEZE Bus) and ADA paratransit services (MTS paratransit and NCTD paratransit). These indicators help determine if the agency is obtaining the desired results from the system and if overall performance is improving based on updated regional strategies or service operation plans. Also, these indicators help the transit agencies determine where improvements can be made. These improvements can be incorporated into each operator’s service improvement plan, which is included in Chapter 10. Performance trends were evaluated in FY 2010 to determine whether the transit agencies improved their performance in light of external circumstances (e.g., fuel prices and loss of operating funds). To facilitate a greater understanding of each individual service (MTS Bus, MTS paratransit, MTS Trolley, NCTD BREEZE, NCTD COASTER, NCTD SPRINTER, and NCTD paratransit), a composite index of the six TDA performance measures was developed and included in the productivity improvement program to help determine overall trends. Appendix J includes the composite evaluation of each service from the 2nd quarter of FY 2007 to the 2nd quarter of FY 2010. The overall composite charts are followed by charts that specifically illustrate the percent change through the reporting period as discussed below. 4.5 Composite FY 2007 – 2010 Transit Performance Results A composite index11 of the six TDA performance measures was developed to help determine the overall trends for each of the evaluated transit services. Declining performance of any particular operator is not to be seen as a criticism of the service itself, but rather a validation of the need for additional funding sources which may be available. Services also exhibiting negative trends may use the data to re-evaluate all or part of the service and seek ways to coordinate components to achieve greater efficiencies. Services exhibiting improving performance enable the operators and SANDAG to understand that plans are targeting the specific types of improvements which were originally prioritized. Charts illustrating transit agency performance (composite and detailed individual measures) are included in Appendix J. The results for the FY 2007 - 2010 TDA analysis reveal that:
MTS TROLLEY
Performance slightly declined (-1%) based on the 2nd quarter FY 2007 to 2nd quarter FY 2010 analysis. The main reason for the slight decline was a drop in Trolley ridership. Between the 2nd quarter of FY 2007 and the 2nd quarter of FY 2010, ridership dropped by 17 percent over the three-year period. As a result, operating costs per passenger have increased, and passenger productivity (passengers per revenue-hour and revenue-mile) also has declined. However, despite the drop in ridership, farebox recovery improved by nearly 16 percent to 67 percent, well above the 38 percent system average and far above the national light rail average of 27 percent. This was largely due to a 14 percent reduction in operating costs over the evaluation period.
11 The inverse of the operating cost performance measures were applied to the index to ensure that improvements equaled
scaled increases. Without the inverse application, any decrease in operating costs would be shown as a negative result.
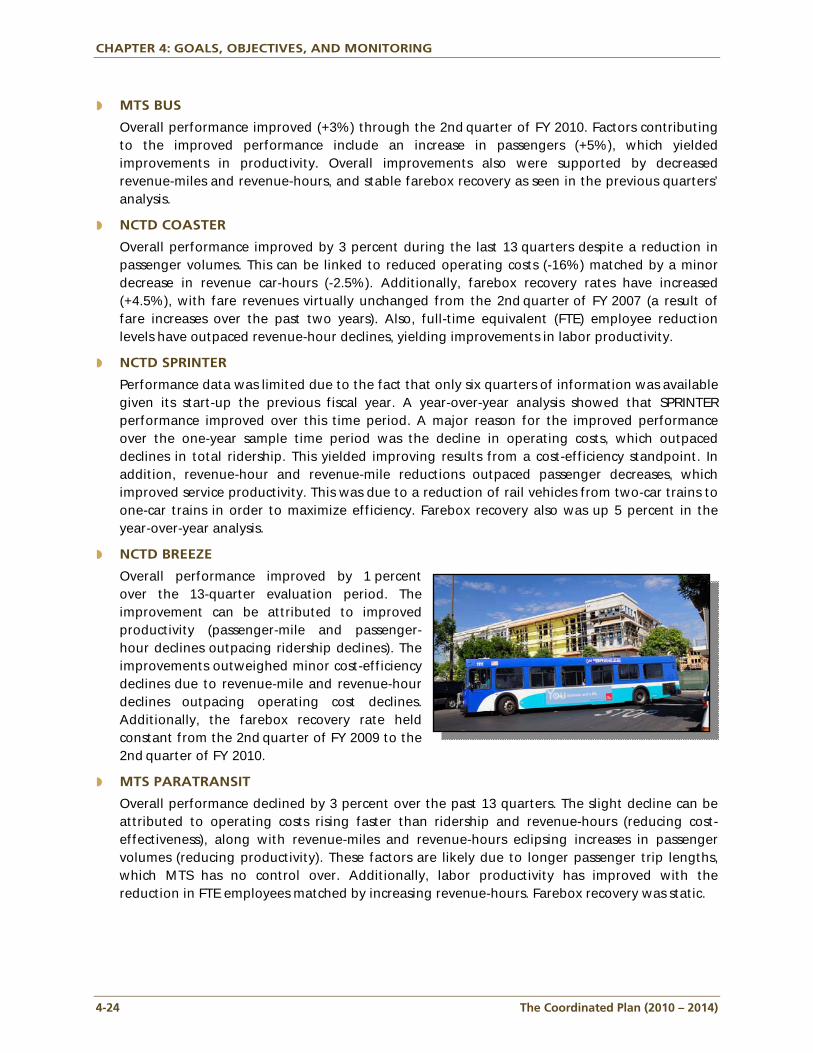
CHAPTER 4: GOALS, OBJECTIVES, AND MONITORING
4-24 The Coordinated Plan (2010 – 2014)
MTS BUS
Overall performance improved (+3%) through the 2nd quarter of FY 2010. Factors contributing to the improved performance include an increase in passengers (+5%), which yielded improvements in productivity. Overall improvements also were supported by decreased revenue-miles and revenue-hours, and stable farebox recovery as seen in the previous quarters’ analysis.
NCTD COASTER
Overall performance improved by 3 percent during the last 13 quarters despite a reduction in passenger volumes. This can be linked to reduced operating costs (-16%) matched by a minor decrease in revenue car-hours (-2.5%). Additionally, farebox recovery rates have increased (+4.5%), with fare revenues virtually unchanged from the 2nd quarter of FY 2007 (a result of fare increases over the past two years). Also, full-time equivalent (FTE) employee reduction levels have outpaced revenue-hour declines, yielding improvements in labor productivity.
NCTD SPRINTER
Performance data was limited due to the fact that only six quarters of information was available given its start-up the previous fiscal year. A year-over-year analysis showed that SPRINTER performance improved over this time period. A major reason for the improved performance over the one-year sample time period was the decline in operating costs, which outpaced declines in total ridership. This yielded improving results from a cost-efficiency standpoint. In addition, revenue-hour and revenue-mile reductions outpaced passenger decreases, which improved service productivity. This was due to a reduction of rail vehicles from two-car trains to one-car trains in order to maximize efficiency. Farebox recovery also was up 5 percent in the year-over-year analysis.
NCTD BREEZE
Overall performance improved by 1 percent over the 13-quarter evaluation period. The improvement can be attributed to improved productivity (passenger-mile and passenger-hour declines outpacing ridership declines). The improvements outweighed minor cost-efficiency declines due to revenue-mile and revenue-hour declines outpacing operating cost declines. Additionally, the farebox recovery rate held constant from the 2nd quarter of FY 2009 to the 2nd quarter of FY 2010.
MTS PARATRANSIT
Overall performance declined by 3 percent over the past 13 quarters. The slight decline can be attributed to operating costs rising faster than ridership and revenue-hours (reducing cost-effectiveness), along with revenue-miles and revenue-hours eclipsing increases in passenger volumes (reducing productivity). These factors are likely due to longer passenger trip lengths, which MTS has no control over. Additionally, labor productivity has improved with the reduction in FTE employees matched by increasing revenue-hours. Farebox recovery was static.
CHAPTER 4: GOALS, OBJECTIVES, AND MONITORING
The Coordinated Plan (2010 – 2014) 4-25
NCTD PARATRANSIT
Service improved by 16 percent over the previous 13-quarter period. Improvements were seen in all categories (cost-efficiency, labor and service productivity, and farebox recovery). The exception was one of the service productivity metrics where revenue-hour increases slightly outpaced passenger increases. During the evaluation period, ridership increased by 24 percent, while costs were kept in check with an 8 percent increase.
4.6 TDA Performance Audit Recommendations In addition to the three-year performance monitoring associated with the annual TDA claim, the triennial performance audit commissioned by SANDAG included the development of improvement recommendations for the transit agencies. The most recent performance audit completed in April 2007 included some recommendations on possible strategies to improve efficiency and effectiveness for both transit operators. These recommendations and the associated MTS and NCTD action plans to implement them (from Form B of the 2010 TDA Claim) were updated by MTS and NCTD and are included in Appendix J.
4.7 Technical Advancements and Automation As outlined in this chapter, the Coordinated Plan provides a comprehensive performance analysis of transit service from the regional and passenger perspectives. However, as more detailed data becomes available from new technologies, this evaluation can be further expanded in future years. Automated and consistent data collection is critical to ensuring that performance is tracked over the five-year timeframe discussed in this chapter, including the three years outlined in the TDA section. The following section discusses the status of technical advancements and improvements to the data collection process expected over the next several years.
Transit System SANDAG, MTS, and NCTD rely on numerous tools for performance monitoring. The Regional Transit Management System (RTMS) is a sophisticated management tool for providing real-time performance monitoring and reporting. The RTMS relies on data from automatic vehicle locator (AVL) technology for real time vehicle location. AVL data is used for on-time performance monitoring, as well as real-time dispatch control. The passenger counting program (PCP) provides stop-by-stop boarding and alighting information for every weekday trip, as well as a sample of weekend trips. The PCP relies heavily on manually collected data, but has recently been using data from APC units from a subset of the system. To increase the reliability of PCP data and reduce data collection costs, APC units will be purchased on most new vehicles and retrofitted on older buses and rail cars. The long-term goal for the region is to have 100 percent of transit vehicles equipped with APC units. Figure 4.4 shows the percentage of vehicles with AVL and APC technology within each fleet, as well as regionwide.
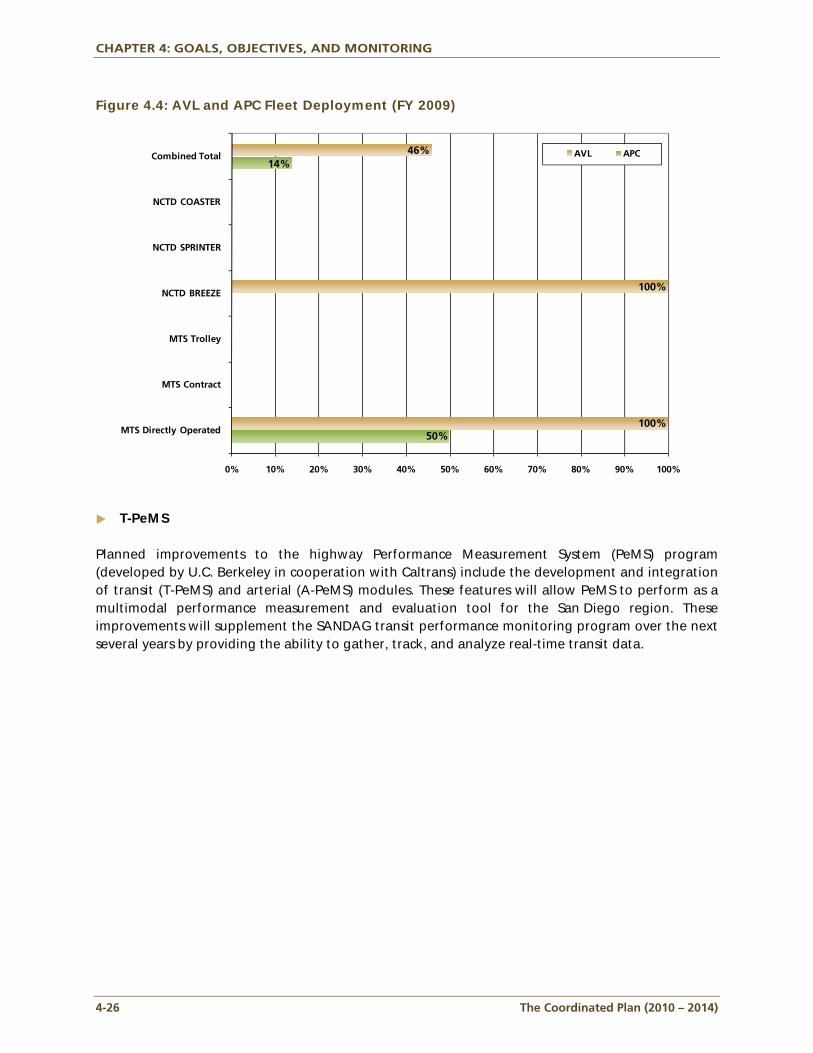
CHAPTER 4: GOALS, OBJECTIVES, AND MONITORING
4-26 The Coordinated Plan (2010 – 2014)
Figure 4.4: AVL and APC Fleet Deployment (FY 2009)
T-PeMS Planned improvements to the highway Performance Measurement System (PeMS) program (developed by U.C. Berkeley in cooperation with Caltrans) include the development and integration of transit (T-PeMS) and arterial (A-PeMS) modules. These features will allow PeMS to perform as a multimodal performance measurement and evaluation tool for the San Diego region. These improvements will supplement the SANDAG transit performance monitoring program over the next several years by providing the ability to gather, track, and analyze real-time transit data.
0% 10% 20% 30% 40% 50% 60% 70% 80% 90% 100%
MTS Directly Operated
MTS Contract
MTS Trolley
NCTD BREEZE
NCTD SPRINTER
NCTD COASTER
Combined Total AVL APC46% 14%
100%
100% 50%
Chapter 5
Th
e
Co
ord
inate
d P
lan
Passenger Demand Analysis

The Coordinated Plan (2010 – 2014) 5-1
CHAPTER 5: PASSENGER DEMAND ANALYSIS
Since the Coordinated Plan is “passenger-centered” planning document, it is important to include detailed information about the passengers being served and their transportation needs. Both survey and demographic information were examined for the Coordinated Plan to develop a better understanding of how these characteristics shape regional travel patterns. Chapter 6 follows this chapter and includes an inventory of available transportation services, while Chapter 7 explains the unmet transportation needs. The unmet needs are essentially derived by comparing the passenger demand from this chapter with the inventory of services to determine where there are unserved populations. Chapter 8 then provides strategies and prioritizes those strategies to address the identified unmet transportation needs.
5.1 Urban Versus Rural Demand Analysis For the urban areas in the region, demand analysis has typically been centered on the use of decennial census data to determine where specific population groups are located that are more likely to be dependent on public transit and social service transportation. For the rural areas, SANDAG undertook a specific rural survey effort to determine transportation demand in those areas since census data is unable to provide enough detailed information.
5.2 Urban Demand Analysis As mentioned above, 2000 Census data was used to develop a clear demographic picture of the urbanized areas of San Diego County. Unfortunately, this data is over ten years old, with new information expected to replace it by the summer of 2011 (when the data is released by the U.S. Census). However, the 2000 Census data is included in the plan, with detailed maps available to provide resource material for this chapter included as Appendix M. The population groups discussed here and included in the appendix maps are consistent with the other groups described in this Coordinated Plan which are:
1. Individuals With Limited Means
2. People With Disabilities
3. Older Adults
Urban Demographic Analysis – Persons With Limited Means The assessment of the residential, employment, and mobility characteristics for persons with limited incomes is important since these individuals are often dependent on public transit to meet their trip making needs. An assessment of those individuals in poverty was undertaken and based on the poverty rates defined in the Federal Jobs Access and Reverse Commute (JARC) (Section 5316) program, which expands the assessment of poverty to include all individuals whose income level is below the 150 percent poverty-line threshold. Table 5.1 illustrates the San Diego County population
CHAPTER 5: PASSENGER DEMAND ANALYSIS
5-2 The Coordinated Plan (2010 – 2014)
by poverty level from the Census 2000 to show the number of persons in poverty at the traditional 100 percent threshold in addition to the 150 percent poverty-line threshold. Nearly 22 percent of the regional population earns less than 150 percent of the federal poverty level. Table 5.1: San Diego County Population: Income Levels Compared to Poverty Level
< 100% Poverty Level < 150% of the Poverty Level Year
Persons Percent Persons Percent
2000 338,399 12.4% 592,991 21.8%
Source: Census 2000, Summary File 3 (SF3), Sample Data, Table P88 (Ratio of Income in 1999 to Poverty Level)
According to the JARC definition, the almost 600,000 individuals in poverty were mapped by Census block group to determine place of residence. The corresponding map of population densities for low-income individuals at or below the 150 percent poverty-line threshold is included in Appendix M. Concentrations of individuals with limited incomes are highest in the denser urban areas of San Ysidro, City Heights, Southeast San Diego, National City, western Chula Vista, El Cajon, parts of Escondido, Vista, and Oceanside, and the communities around Downtown San Diego. High poverty rates also are generally associated with low rates of car ownership and higher rates of transit usage. A map of households with zero car ownership also is included in Appendix M. The correlation of individuals in poverty and areas with zero car ownership rates point to the need for good, high-frequency local transit services connecting the centralized urban communities with major job centers.
Urban Mobility Assessment – Persons with Limited Means The Census Transportation Planning Package (CTPP) data was used to conduct a mobility assessment of persons in poverty since it provides specific information on population subgroups, such as persons in poverty and individuals with disabilities. The data was examined by Census block group to determine both residential and job locations. This data source and corresponding evaluation is particularly important to determine the commute-trip transportation needs for individuals with limited incomes. This information can then be used to determine where funds from the federal JARC program should be spent to improve transportation for workers with limited means.1 Based on the CTPP data from 2000, there are about 170,000 persons below the 150 percent poverty-line threshold who work and presumably need to travel to their place of employment. This represents approximately 30 percent of the total persons below the 150 percent poverty line countywide. The densities of these residential locations shown in a map included in Appendix M. The overall poverty map and specific worker poverty map show similar concentrations of individuals with limited incomes. As is the case with the general population, poverty is higher in the denser urban areas of San Ysidro, City Heights, National City, western Chula Vista, El Cajon, parts of Escondido, Vista, Oceanside, and the communities around Downtown San Diego. However, there
1 The Federal Transit Administration (FTA) specifies that “funds from the JARC program are available for capital, planning,
and operating expenses that support the development and maintenance of transportation services designed to transport low-income individuals to and from jobs and activities related to their employment and to support reverse commute projects (FTA C 9050.1).
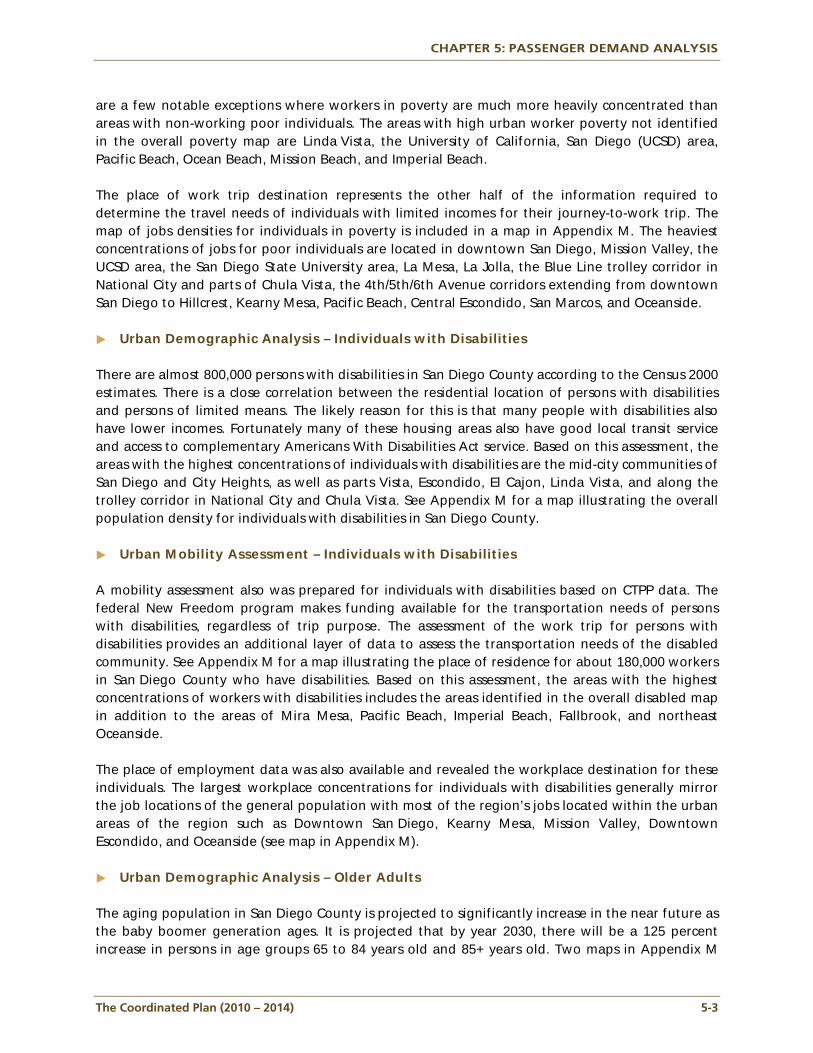
CHAPTER 5: PASSENGER DEMAND ANALYSIS
The Coordinated Plan (2010 – 2014) 5-3
are a few notable exceptions where workers in poverty are much more heavily concentrated than areas with non-working poor individuals. The areas with high urban worker poverty not identified in the overall poverty map are Linda Vista, the University of California, San Diego (UCSD) area, Pacific Beach, Ocean Beach, Mission Beach, and Imperial Beach. The place of work trip destination represents the other half of the information required to determine the travel needs of individuals with limited incomes for their journey-to-work trip. The map of jobs densities for individuals in poverty is included in a map in Appendix M. The heaviest concentrations of jobs for poor individuals are located in downtown San Diego, Mission Valley, the UCSD area, the San Diego State University area, La Mesa, La Jolla, the Blue Line trolley corridor in National City and parts of Chula Vista, the 4th/5th/6th Avenue corridors extending from downtown San Diego to Hillcrest, Kearny Mesa, Pacific Beach, Central Escondido, San Marcos, and Oceanside.
Urban Demographic Analysis – Individuals with Disabilities There are almost 800,000 persons with disabilities in San Diego County according to the Census 2000 estimates. There is a close correlation between the residential location of persons with disabilities and persons of limited means. The likely reason for this is that many people with disabilities also have lower incomes. Fortunately many of these housing areas also have good local transit service and access to complementary Americans With Disabilities Act service. Based on this assessment, the areas with the highest concentrations of individuals with disabilities are the mid-city communities of San Diego and City Heights, as well as parts Vista, Escondido, El Cajon, Linda Vista, and along the trolley corridor in National City and Chula Vista. See Appendix M for a map illustrating the overall population density for individuals with disabilities in San Diego County.
Urban Mobility Assessment – Individuals with Disabilities A mobility assessment also was prepared for individuals with disabilities based on CTPP data. The federal New Freedom program makes funding available for the transportation needs of persons with disabilities, regardless of trip purpose. The assessment of the work trip for persons with disabilities provides an additional layer of data to assess the transportation needs of the disabled community. See Appendix M for a map illustrating the place of residence for about 180,000 workers in San Diego County who have disabilities. Based on this assessment, the areas with the highest concentrations of workers with disabilities includes the areas identified in the overall disabled map in addition to the areas of Mira Mesa, Pacific Beach, Imperial Beach, Fallbrook, and northeast Oceanside. The place of employment data was also available and revealed the workplace destination for these individuals. The largest workplace concentrations for individuals with disabilities generally mirror the job locations of the general population with most of the region’s jobs located within the urban areas of the region such as Downtown San Diego, Kearny Mesa, Mission Valley, Downtown Escondido, and Oceanside (see map in Appendix M).
Urban Demographic Analysis – Older Adults The aging population in San Diego County is projected to significantly increase in the near future as the baby boomer generation ages. It is projected that by year 2030, there will be a 125 percent increase in persons in age groups 65 to 84 years old and 85+ years old. Two maps in Appendix M
CHAPTER 5: PASSENGER DEMAND ANALYSIS
5-4 The Coordinated Plan (2010 – 2014)
illustrate population densities of both of these age groups based on Census 2000 data. Census 2000 data was used since it is the most recent population data available for this subgroup. Based on an evaluation of these figures, senior concentrations in the 65-84 age category are currently highest in western Chula Vista, National City, Hillcrest, City Heights, Coronado, La Mesa, El Cajon, Linda Vista, Point Loma, La Jolla, Mira Mesa, Rancho Bernardo, Escondido, and Oceanside. For those age 85+, population densities are currently highest in El Cajon, Hillcrest, La Jolla, Rancho Bernardo, Escondido, Vista, and Oceanside.
Urban Mobility Assessment – Older Adults Most seniors do not need to travel to work as part of their daily routine; however, seniors do have a need for basic mobility, including access to services both within and beyond their communities. Due to the expected increase in the older adult population over the next several years, there will be an increased demand for transit and paratransit services for these individuals. Many of these individuals will rely on dependable public transportation and social service transportation to complete necessary errands, get to medical appointments, and to take discretionary trips, such as visiting friends and family. Access to routine care and preventative medical services (otherwise known as nonemergency medical transportation) is one of the most important needs among seniors. Seniors are a transportation disadvantaged group, and isolation can bring about significant social and medical problems. Recent research conducted by the Transit Cooperative Research Program (TCRP)2 has concluded that approximately 3.6 million Americans miss or delay nonemergency medical care each year due to transportation difficulties, and a disproportionate number of these individuals are seniors. The TCRP, however, found that transportation is relatively inexpensive compared with the high and rapidly growing cost of healthcare. More importantly, the study found that of the 12 common, but serious medical conditions analyzed, providing preventable care was cost-effective for all 12 conditions. In four of the conditions (heart disease, diabetes, prenatal care, and asthma) actual cost savings (medical care plus transportation) were achieved by improving transportation access to medical care. This means that additional investment in transportation for nonemergency medical care leads to a net decrease in total costs to the taxpayer when both transportation and healthcare costs are included. It also is expected that more and more seniors will decide to continue to live in their single-family suburban residence for as long as possible. This trend will create a strain on current paratransit and specialized transportation operations. With limited public transit and specialized transportation infrastructure to serve these individuals, senior isolation and withdrawal may occur after they lose their ability to drive. The related consequences of a loss in mobility for seniors are a loss in independence, a dependence on others, decrease in life satisfaction, increased depression, and (as noted above) increased medical costs. Compounding the need for public transit and social service transportation for older adults will be the anticipated growth in these population groups as the baby boomers age and move into retirement.
2 “Research Results Digest 75: Cost Benefit Analysis of Providing Non-Emergency Medical Transportation,” Transit
Cooperative Research Program (TCRP), January 2006.
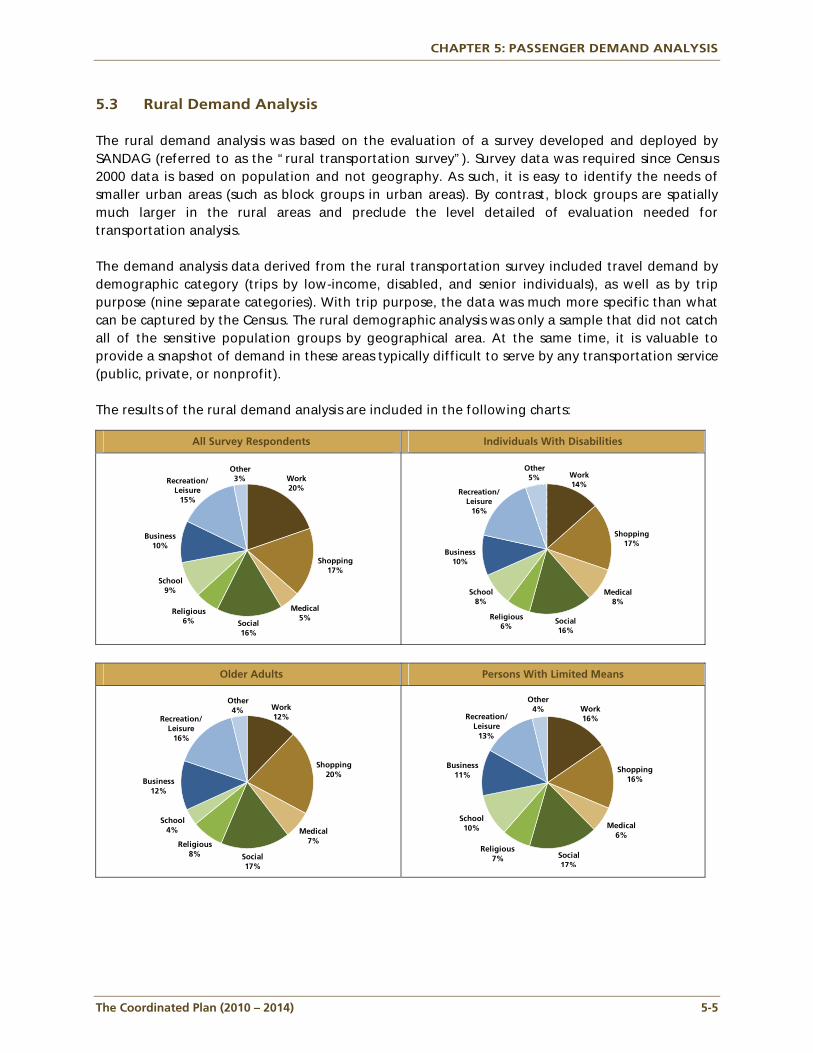
CHAPTER 5: PASSENGER DEMAND ANALYSIS
The Coordinated Plan (2010 – 2014) 5-5
Work16%
Shopping16%
Medical6%
Social17%
Religious7%
School10%
Business11%
Recreation/Leisure
13%
Other4%
5.3 Rural Demand Analysis The rural demand analysis was based on the evaluation of a survey developed and deployed by SANDAG (referred to as the “rural transportation survey”). Survey data was required since Census 2000 data is based on population and not geography. As such, it is easy to identify the needs of smaller urban areas (such as block groups in urban areas). By contrast, block groups are spatially much larger in the rural areas and preclude the level detailed of evaluation needed for transportation analysis. The demand analysis data derived from the rural transportation survey included travel demand by demographic category (trips by low-income, disabled, and senior individuals), as well as by trip purpose (nine separate categories). With trip purpose, the data was much more specific than what can be captured by the Census. The rural demographic analysis was only a sample that did not catch all of the sensitive population groups by geographical area. At the same time, it is valuable to provide a snapshot of demand in these areas typically difficult to serve by any transportation service (public, private, or nonprofit). The results of the rural demand analysis are included in the following charts:
All Survey Respondents Individuals With Disabilities
Older Adults Persons With Limited Means
Work14%
Shopping17%
Medical8%
Social16%
Religious6%
School8%
Business10%
Recreation/Leisure
16%
Other5%
Work12%
Shopping20%
Medical7%
Social17%
Religious8%
School4%
Business12%
Recreation/Leisure
16%
Other4%
Work20%
Shopping17%
Medical5%
Social16%
Religious6%
School9%
Business10%
Recreation/Leisure
15%
Other3%
CHAPTER 5: PASSENGER DEMAND ANALYSIS
5-6 The Coordinated Plan (2010 – 2014)
The analysis revealed the following highlights:
All Rural Areas Persons With
Limited Means Individuals
With Disabilities Older Adults
Work trips represented the largest category of all trips (20%);
Medical trips represented the smallest category of trips compared to the specific population group analysis (5%).
Work trips represented a significant percent of trips;
Medical trips represented the smallest category of trips compared to individuals with disabilities and older adults.
Work trips represented a much smaller percentage than the rural area average for this population (13%);
Medical trips represented the largest share (8%) of any of the groups (including the rural area average).
Work trips represented the smallest percentage (12%) among all of the groups (including the rural area average);
Shopping trips and medical trips generally accounted for a larger percentage of trips from older adults than the other population examined (including the rural area average).
5.4 Rural Area Demand Summary Based on the details gathered in the survey, it was clear that there were only minor differences between the transportation demand of the three specific population groups versus the general population. However, the survey also included questions to determine which of these trips were not made due to lack of available transportation, which is the basis for the discussion that follows in Chapter 7.
Chapter 6
Th
e
Co
ord
inate
d P
lan
Transportation Inventory

The Coordinated Plan (2010 – 2014) 6-1
CHAPTER 6: TRANSPORTATION INVENTORY
The following chapter provides an inventory of the public transportation services available in the San Diego region. A comprehensive list of social service transportation providers primarily serving disabled, elderly, and/or low-income populations is included in this chapter. This inventory includes information about private transportation providers that was collected for the 2007-2011 Coordinated Plan. In addition, to recognize the vital connection served by San Diego County in promoting interregional transportation, services to and from the surrounding areas in Riverside County, Orange County, Imperial County, and Mexico are included in this inventory. Emergency transportation services acknowledge the roles that transit and social service transportation play in the implementation of emergency transportation plans. Additionally, project narratives for social service transportation projects funded through the TransNet Senior Mini-Grant program have been added to the 2010-2014 Coordinated Plan. Future Coordinated Plan updates will include project narratives for Job Access and Reverse Commute- (JARC) and New Freedom-funded services.
6.1 Public Transportation Providers Public transit service in the San Diego region is provided by two agencies, the Metropolitan Transit System (MTS) and the North County Transit District (NCTD). These two agencies provide services through a variety of directly operated and contracted services, including three fixed-route bus operators, San Diego Trolley Incorporated, NCTD COASTER commuter train service, Coronado Ferry service, general demand responsive operators, and Americans with Disabilities Act (ADA) paratransit operators. These operators provide service in the SANDAG area of jurisdiction covering 4,261 square miles and encompassing 18 incorporated cities and the County of San Diego. A more detailed description of the services provided by MTS and NCTD, along with route statistical information, is included in Appendices B and C. Additionally, MTS manages jitney services as described below.
Jitney Service Jitneys are privately owned vehicles operating on a fixed or semi-fixed schedule for a fare. The City of San Diego gained national attention by legalizing jitney services and deregulated taxis in 1979. By 1984 jitneys flourished in San Diego, with around 100 vehicles operated by 15 companies and ridership peaking around 15,000 weekly passengers. However, increased regulation along with the declining economy and a reduced military presence in the late 80s reduced the viability of jitney service to short-haul trips in the San Ysidro area. Jitney licenses are provided by MTS, while the Sheriff’s Department licenses jitney drivers. Each jitney route is approved by MTS along with the fare, which currently ranges between $1.25 and $1.50 per passenger. There are currently 11 licensed jitney companies, with 12 vehicles serving the greater San Ysidro/ Otay Mesa area. Space for the 12 jitneys has been assigned to the curb (240 feet) near the San Ysidro Intermodal Transit Center on San Ysidro Boulevard across from the Trolley line. The main purpose of the jitneys in the San Ysidro community is to provide transportation for the swap meets,
CHAPTER 6: TRANSPORTATION INVENTORY
6-2 The Coordinated Plan (2010 – 2014)
as well as area businesses. The Coronado swap meet operates Wednesday, Saturdays and Sundays from 6 a.m. to 3 p.m. at the drive-in theater facility at 2170 Coronado Avenue, San Diego. The jitneys are the only transportation to and from this swap meet. Operations are based on a fixed or semi-fixed route depending on passenger requests. Additionally, jitneys may stop at any existing bus route along the approved jitney route to pick up or drop off passengers. When the swap meet is closed, the jitneys offer service between the transit center and Palm Avenue. There are no designated jitneys serving the San Ysidro swap meet, which operates Wednesdays through Sundays from 8:30 a.m. to 8 p.m. (6 p.m. on Saturdays and Sundays). Instead, free shuttle transportation is provided by this swap meet from the intersection of East Beyer Boulevard at East San Ysidro Boulevard intersection. However, other jitney routes operate in the vicinity of the San Ysidro swap meet and jitney vehicles often stop at the free shuttle stop to solicit fare-paying rides for individuals unwilling to wait for the next free shuttle.
School Buses The provision of school transportation, with dedicated yellow school buses, is a discretionary service of local school districts. Of the 42 school districts in San Diego County, 30 offer yellow bus transportation, while 6 offer transportation to their special-needs students only. On a daily basis, approximately 54,000 students and 11,700 special-needs students are transported to and from school by yellow school buses. In school districts where yellow school busing is not provided, the public transit system is often the only alternative for middle and high school students. In some areas of the County, students are a major source of ridership and revenue for transit operators, but they also are a challenge to serve due to the sharp peak periods created by strict school schedules and federal rules that limit the ability of transit to serve the market. In addition, new schools in some parts of the region are being built in areas beyond existing transit services. Due to the limitations of transit funding and federal rules, creating service extensions to meet the needs of the new schools are not always feasible. The largest single school district in San Diego County is the San Diego Unified School District, which operates about 550 buses. In comparison, the combined transit fleets of San Diego Transit, MTS Contract Services, Chula Vista Transit, and NCTD operate approximately 578 peak buses. The transit systems have substantially higher ridership because transit buses are in use for many more hours each day than school buses and are able to carry standees. Comparing the fleet size provides an excellent indication of the substantial demand for school transportation during peak periods. Altogether, the remaining 41 school districts in both the urban and suburban portions of the County operate about 574 buses, for a countywide total of more than 1,000 school buses. The San Diego Unified School District, or San Diego City Schools (SDCS), transports about 18,000 students out of a total enrollment of 135,000. The majority of those students (about 71 percent) are either in the voluntary integration or magnet schools programs. The majority of the remaining students are special-education students, who are offered transportation as part of their individual education plan). SDCS is legally obligated to provide transportation to special-education students to match student needs with the program that best meets their needs.
CHAPTER 6: TRANSPORTATION INVENTORY
The Coordinated Plan (2010 – 2014) 6-3
Transportation is provided for eligible students who attend an integration program outside of their neighborhood school boundaries. No student living less than one mile from school is eligible to ride. For magnet schools, only elementary students who live two miles or more from the school, and atypical, middle, and secondary school students who live two and one-half miles or more from the school, are eligible for transportation. Secondary and atypical school students may be expected to travel up to one mile from their homes or service addresses to the designated bus stop. Elementary students (including kindergartners) may be expected to travel up to four-tenths (0.4) of a mile to the bus stop.
University of California, San Diego (UCSD) Shuttles UCSD operates an extensive network of 11 shuttle routes around the UCSD campus and to major offsite landmarks, such as the Old Town Transit Center, the Sorrento Valley COASTER Station, University Towne Center, Hillcrest, and the airport on major holidays. Access to the shuttles is limited to UCSD students, faculty, and staff. The services operate various schedules, but some service is available seven days per week and as late as 12:15 a.m. The service is free of charge for currently registered UCSD students, faculty, and staff. The routes are:
Academic-year shuttles:
Campus Loop Shuttle
City Shuttle
East Campus/Regents Express Shuttles
Holiday Airport Shuttle
Year-round shuttles:
COASTER Shuttle
Hillcrest/Campus Shuttle
Hillcrest/Old Town Transit Center Shuttle
Mesa Housing Shuttle
Scripps Institution of Oceanography Shuttle
Torrey Pines Center Shuttle In addition, UCSD has established a special arrangement with both MTS and NCTD allowing students, faculty, and staff to ride free on regular routes that directly serve the UCSD east and west campuses (Routes 30, 41, 101, 150, 201/202, 921, and the SuperLoop) and the two routes that serve the UCSD medical center in Hillcrest (Routes 3 and 10). UCSD passengers may board NCTD Route 101 free anywhere along the route between Oceanside and UTC. Figure 6.3 shows these routes.
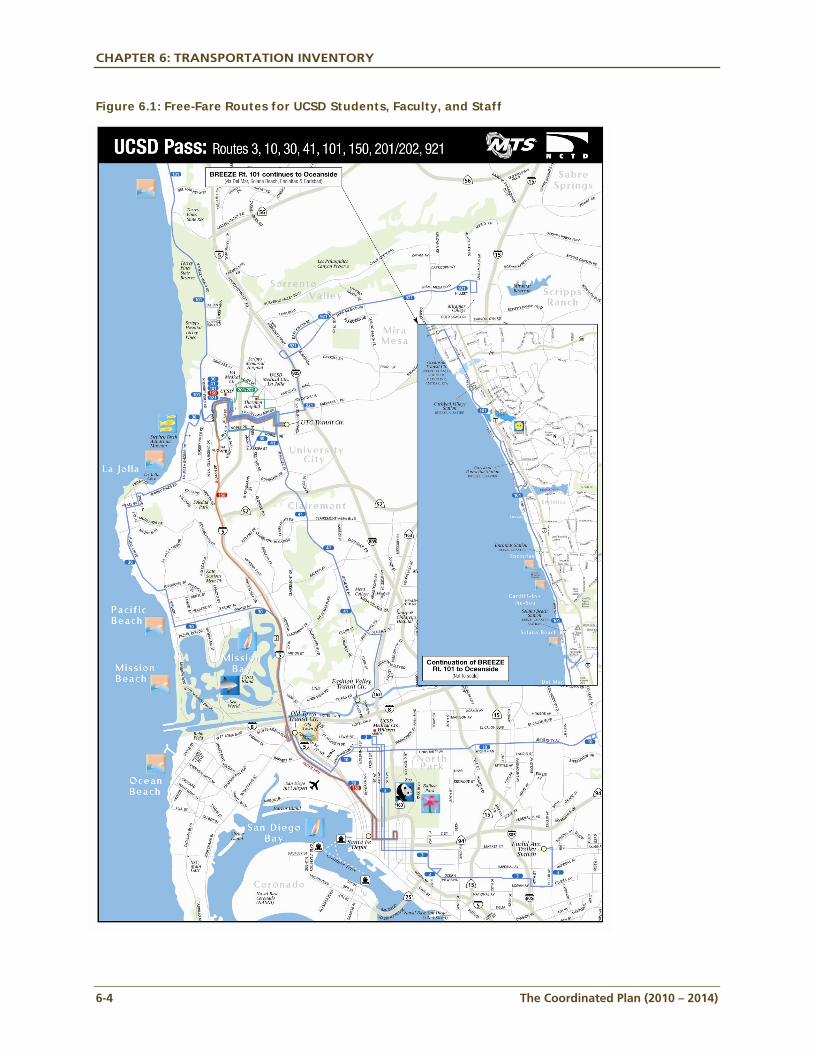
CHAPTER 6: TRANSPORTATION INVENTORY
6-4 The Coordinated Plan (2010 – 2014)
Figure 6.1: Free-Fare Routes for UCSD Students, Faculty, and Staff
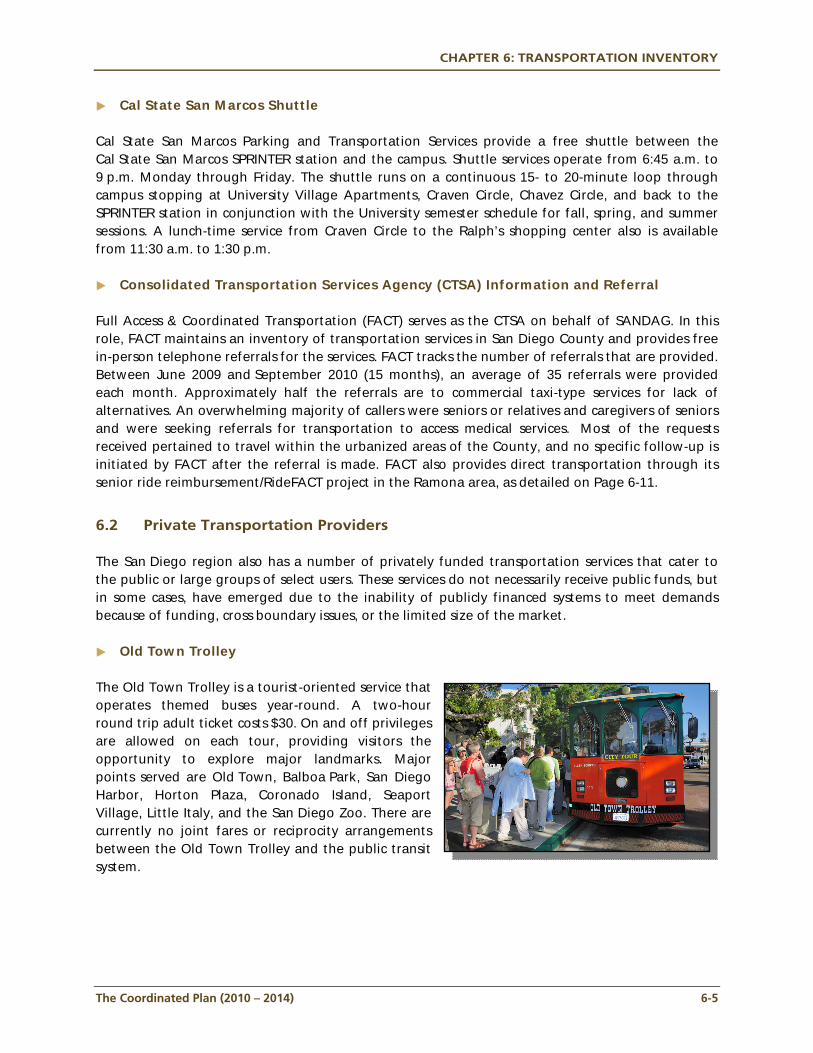
CHAPTER 6: TRANSPORTATION INVENTORY
The Coordinated Plan (2010 – 2014) 6-5
Cal State San Marcos Shuttle Cal State San Marcos Parking and Transportation Services provide a free shuttle between the Cal State San Marcos SPRINTER station and the campus. Shuttle services operate from 6:45 a.m. to 9 p.m. Monday through Friday. The shuttle runs on a continuous 15- to 20-minute loop through campus stopping at University Village Apartments, Craven Circle, Chavez Circle, and back to the SPRINTER station in conjunction with the University semester schedule for fall, spring, and summer sessions. A lunch-time service from Craven Circle to the Ralph’s shopping center also is available from 11:30 a.m. to 1:30 p.m.
Consolidated Transportation Services Agency (CTSA) Information and Referral Full Access & Coordinated Transportation (FACT) serves as the CTSA on behalf of SANDAG. In this role, FACT maintains an inventory of transportation services in San Diego County and provides free in-person telephone referrals for the services. FACT tracks the number of referrals that are provided. Between June 2009 and September 2010 (15 months), an average of 35 referrals were provided each month. Approximately half the referrals are to commercial taxi-type services for lack of alternatives. An overwhelming majority of callers were seniors or relatives and caregivers of seniors and were seeking referrals for transportation to access medical services. Most of the requests received pertained to travel within the urbanized areas of the County, and no specific follow-up is initiated by FACT after the referral is made. FACT also provides direct transportation through its senior ride reimbursement/RideFACT project in the Ramona area, as detailed on Page 6-11.
6.2 Private Transportation Providers The San Diego region also has a number of privately funded transportation services that cater to the public or large groups of select users. These services do not necessarily receive public funds, but in some cases, have emerged due to the inability of publicly financed systems to meet demands because of funding, cross boundary issues, or the limited size of the market.
Old Town Trolley The Old Town Trolley is a tourist-oriented service that operates themed buses year-round. A two-hour round trip adult ticket costs $30. On and off privileges are allowed on each tour, providing visitors the opportunity to explore major landmarks. Major points served are Old Town, Balboa Park, San Diego Harbor, Horton Plaza, Coronado Island, Seaport Village, Little Italy, and the San Diego Zoo. There are currently no joint fares or reciprocity arrangements between the Old Town Trolley and the public transit system.
CHAPTER 6: TRANSPORTATION INVENTORY
6-6 The Coordinated Plan (2010 – 2014)
Greyhound Greyhound is a nationwide inter-city bus operator. Within San Diego County, Greyhound offers services from Oceanside, Escondido, El Cajon, and San Ysidro to downtown San Diego. Greyhound services operate express via the freeway system. In the suburbs, Greyhound operates from public transit centers in Oceanside, Escondido, El Cajon, and San Ysidro. However, in downtown San Diego, Greyhound uses its own terminal. Greyhound operates seven days per week. Service on board the Oceanside and San Ysidro bus lines is typically offered every hour throughout the day, with some early morning and/or late night trips. Oceanside to San Diego service is offered 12 times daily, with an adult cash fare of $8 and a typical scheduled travel time of 50 minutes. Escondido to San Diego is offered four times daily, with an adult cash fare of $12.50 and a travel time of 40 minutes. El Cajon to San Diego is offered three times daily, with an adult cash fare of $10 and a travel time of 30 minutes. San Ysidro to San Diego is offered 17 times daily, with an adult cash fare of $10 and a travel time of 25 minutes. In the past NCTD and Greyhound had a joint ticketing scheme that allowed Greyhound passengers to ride on NCTD between Escondido and Oceanside.
Casino Shuttles Indian casinos in the rural areas of San Diego County have become major attractions for residents and visitors, creating a significant demand for bus services. Some casinos, such as Pala, Harrahs, and Viejas, are located on existing rural bus routes, while others are not. The casino industry has responded with special bus services for casino visitors and employees. Barona Valley Ranch Resort and Casino, Sycuan Resort and Casino, Valley View Casino, and Viejas Casino now operate shuttle service to selected areas throughout the County to help fill in the missing links in MTS and NCTD service networks. Barona Valley Ranch Resort and Casino currently operates approximately 60 express shuttles to and from the East County, South Bay, Mira Mesa, and Kearny Mesa. These shuttles run from 5:15 a.m. until 2:15 a.m. the following morning and operate on Saturday and Sunday only. Passengers must be 18 years or older to ride the shuttle, and the fare to board the shuttle is $10. If the passenger has a Club Barona Card, the fare is free. In addition, Barona operates three express shuttles on Wednesdays and Thursdays that services the Los Angeles and Laguna Woods areas. The fare to board those shuttles also is $10. Sycuan Resort and Casino currently operates approximately 28 daily shuttles to and from the Plaza Bonita Shopping Center and the El Cajon Trolley Station. In addition, 14 daily shuttles also run to and from Tecate and Horario Diario in Mexico. Sycuan also operates 11 supplementary evening and bingo routes that service the South Bay, Chula Vista, National City, Spring Valley, Mira Mesa, Kearny Mesa, North Park, and North County, and these routes also run daily. All passengers must be 18 years or older to ride, and the fare to board is $10. If the passenger has a Club Sycuan Card, the fare is free. Valley View Casino currently operates 12 shuttles that run daily to and from the North County Coast, Escondido, Rancho Bernardo, Poway, Rancho Peñasquitos, and Mira Mesa. Valley View also provides service on select days of the week to other areas in the County. On Tuesdays, Fridays, and Saturdays, 5 shuttles are offered from Chula Vista and National City, as well as from the Euclid and
CHAPTER 6: TRANSPORTATION INVENTORY
The Coordinated Plan (2010 – 2014) 6-7
Market Trolley station. Two shuttles service downtown San Diego on Thursdays and Sundays only, and two shuttles service the Hillcrest area on Mondays and Wednesdays. Also, Valley View offers shuttle service to Laguna Woods Village on Mondays by reservation only. It is free to ride any of these shuttles. Viejas Casino currently operates 44 daily shuttles that service El Cajon, Mira Mesa, Kearny Mesa, Rancho Penasquitos, Imperial Valley, San Ysidro, and National City. These shuttles operate from 5:15 a.m. until 2 a.m. the following day. Passengers must be 18 years or older to ride, and the fare to board is $10. If passengers have a V Club card, the fare is free. While these casino shuttles do offer supplemental transit service to the existing MTS and NCTD routes, it should be noted that during the unmet transit needs hearings in 2005, the management of Harrah’s Casino in North County made a presentation on the unmet transit needs of their employees. The Casino noted that the current service provided by NCTD was inadequate, and they asked for improved service to bring employees to their worksite at the casino.
Employer Shuttles It is understood that employers in the region do offer shuttle services for their employees; however, there is no inventory of the services. The shuttles may be operated by company employees or contracted to a transportation provider. The shuttles typically operate from transit centers, such as the Sorrento Valley COASTER station or between remote employee parking and the jobsite. Currently, Qualcomm is providing shuttle service to its employees from the Sorrento Valley COASTER station. A similar shuttle is being operated by Cloud 9 Shuttles. In future years, additional research will be undertaken to identify the locations of employer shuttles as their presence is indicative of gaps in transit coverage, as well as a confirmation of potential demand.
Airport Shuttles Frequent shuttle service between downtown San Diego, the Santa Fe Depot train station, and Lindbergh Field is provided by MTS Route 992. In addition, private shuttle operators provide shared-ride shuttle service from all points in San Diego County to the International Airport. Cloud 9 Shuttle is a privately owned and operated shared-ride taxi service that serves the airport market. Cloud 9 Shuttle also is authorized to provide "shared-ride" transportation throughout San Diego County to San Diego Amtrak, the San Diego Convention Center, and the San Diego Cruise Terminal. All Cloud 9 Shuttle fares are structured by ZIP code.
Mexicoach Mexicoach operates shuttle services from San Ysidro to their downtown terminal in Tijuana, with connections to Rosarito and the industrial parks. The service operates from the San Ysidro transit center and offers convenient connections with the Trolley. The cash fare on Mexicoach is $4 one way or $6 round trip. All buses are wheelchair lift-equipped. There are currently no joint fares or reciprocity arrangements between Mexicoach and the public transit system.
CHAPTER 6: TRANSPORTATION INVENTORY
6-8 The Coordinated Plan (2010 – 2014)
Private Paratransit Service Providers California Paratransit Services provides transportation service for seniors and persons with disabilities. Transportation is contracted out through various taxi companies, who typically charge a fee of $2.30 per mile with no loading fee. Wheelchair-accessible vehicles are available, but scheduling is suggested one week in advance.
Hospital Shuttles A number of agencies provide transportation to hospitals in the San Diego region. The hospitals may fulfill the demand themselves, providing either emergency ambulances and/or shuttle services to their campuses and to their immediate neighbors. These include shuttles between remote parking areas and hospital sites for employees (e.g., Palomar Hospital District) and shuttles for staff and patients (e.g., UCSD Hillcrest and Veteran’s Hospital). The private/public market also has facilitated this demand. The following is a limited list of medical-related transportation providers, both emergency and nonemergency, in the San Diego region:
Emergency
American Medical Response
Balboa Ambulance
Care Medical
Critical Air Medicine
East County Fire Department
Pacific Ambulance
San Diego Medical Services
Schaeffer Ambulance
Nonemergency
American Medical Response
Care-A-Van
DVA Transit
No Vacancy
San Diego Medical Services
Sharp Healthcare Transportation
TLC Medical Transport
Tri-City Medical Center
VA Patient Travel Hospital shuttles are not necessarily limited to private agencies, but in many cases fall into this category.
CHAPTER 6: TRANSPORTATION INVENTORY
The Coordinated Plan (2010 – 2014) 6-9
6.3 Social Service Transportation Providers Several social service agencies provide transportation in San Diego County, effectively expanding the MTS and NCTD paratransit services. In December 2007 SANDAG conducted a phone survey to update the inventory of available services. Two hundred eight agencies were surveyed, taken from the SANDAG 2006 inventory and the Consolidated Transportation Services Agency’s (CTSA) STRIDE Web site. Of the 208 agencies that were contacted, 97 responded, 56 of which are transportation providers. Through the survey, participants were asked about the service area of their operations, enrollment or program requirements, hours and days of operation, fare requirements, and vehicle types. The results of the survey are included in Appendix D. SANDAG used the results of the survey to determine where social service agency transportation was available in San Diego County. To do this, SANDAG asked each agency surveyed to describe their service area. The most common responses were based on city boundaries, ZIP codes, or within a certain radius of an area. SANDAG then used this information to map where service is available for each population group. This information is included in a series of maps in Appendix N.
Social Service Transportation Options – Seniors Of the 56 agencies that responded, 40 provide transportation services for seniors. There is significant coverage throughout most of the urbanized areas of the County, with the highest levels of service available along the State Route (SR) 78 corridor in North County and the Interstate (I-) 8 corridor in Central and East County. Significantly, less transportation services are available for seniors on weeknights; however, a moderate amount of service is available on the weekends. SANDAG also asked survey respondents whether their transportation services were available only to agency clients, and if so, if there are any requirements to become a client. For those agencies reporting that their transportation services were not only available to agency clients or those with no barriers or requirements to becoming a client, their coverage area was included in a set of additional maps titled “Nonagency Clients.” These maps represent the services that are available to the general public. For the senior population, the services available to nonagency clients were approximately the same for weeknights; however, a rather dramatic decrease was apparent for the weekdays and weekends, particularly in North County. Social Service Transportation Project Narratives The Program Management Plan (Appendix E) outlines strategies and provides tools for effectively administering and monitoring the JARC, New Freedom, and Senior Mini-Grant programs. Among these strategies and tools is a standardized reporting procedure, which consists of standardized reporting forms for invoices, progress and quarterly reports, and performance data reports. The following project summaries are based on information provided by Senior Mini-Grant recipients. Project information will vary by number of months in operation and date on which invoices and progress reports were provided. Future Coordinated Plan updates will include project narratives for JARC and New Freedom funded services. The narratives for the Senior Mini-Grant through FY 2010 are as follows:
CHAPTER 6: TRANSPORTATION INVENTORY
6-10 The Coordinated Plan (2010 – 2014)
1. NCTD Mobility/Travel Training Program
This program was awarded up to $156,957 in Senior Mini-Grant funding for FY 2009 and FY 2010. The training programs help individuals learn how to use the NCTD Rider’s Guide and its contents, create and plan travel options, and receive individualized or group training where a trainee navigates the NCTD transit system. To date, 21 individual travel trainings have been completed. The Senior Transit Buddy Program, a component of Mobility/Travel Training, has 24 volunteers, providing training to 60 seniors.
2. All Congregations Together (ACT) ComLink Transportation Project
This project was awarded up to $333,660 in Senior Mini-Grant funding through FY 2009 and FY 2010. This program was planned to provide shuttle service for nonemergency medical and social trips for residents of five senior centers in Chula Vista and National City. Two of the five senior centers have utilized the transportation service, although ACT has extensively marketed the service to all five centers. For this reason, ACT recently added two new senior centers to provide senior transportation. ACT continues to partner with resident/facility managements to administer a voucher program at $4 per trip. During the first six months of the TransNet grant, ACT has provided 229 one-way passenger trips.
3. Alpha Project Senior Transportation Program
This program provides transportation to low-income seniors in downtown San Diego and the North County communities of Oceanside and Escondido and was awarded up to $391,612 in Senior Mini-Grant funding through FY 2009 and FY 2010. To date, Alpha Project has provided more than 4,428 one-way trips in North County and the City of San Diego.
4. City of La Mesa Rides4Neighbors Program
This program is a volunteer driver service in Mt. Helix and neighboring communities; Spring Valley; parts of El Cajon and Lemon Grove; and San Carlos and Del Cerro. In January 2009 the program introduced another specialized transportation alternative - Discount Taxi Scrip. Eligible older adults and residents with disabilities in La Mesa and neighboring communities have the option of purchasing a Yellow Cab taxi scrip booklet at half price ($10 per booklet). This program was awarded up to $160,000 in Senior Mini-Grant funding through FY 2009 and FY 2010. In 2009, Rides4Neighbors provided 5,357 total one-way passenger trips. Of these trips, 2,106 were one-way taxicab trips, and 3,251 were provided by the volunteer driver program.
5. City of Oceanside Solutions for Seniors on the Go Program
This program offers three options to facilitate the transportation needs of seniors. The options are: curb-to-curb taxi scrip subsidies, door-to-door shuttle transportation, and door-through-door volunteer driver and destination assistance transportation. It was awarded up to $339,587 in Senior Mini-Grant funding through FY 2009 and FY 2010. In the first seven months of the TransNet grant, Seniors on the Go has provided 3,993 one-way passenger trips (which includes 1,621 from the shuttle service and 2,372 from the taxi vouchers).
CHAPTER 6: TRANSPORTATION INVENTORY
The Coordinated Plan (2010 – 2014) 6-11
6. City of Vista Out & About Vista Program
A two-part service makes up this program: a Senior Shuttle service that provides door-to-door bus service and a volunteer driver component that utilizes volunteers in the community to provide transportation in privately owned vehicles. This program was awarded up to $76,464 in Senior Mini-Grant funding through FY 2009. In the first six months of the TransNet grant, Out & About Vista provided 4,330 one-way passenger trips.
7. ElderHelp Volunteer Driver Program
This program provides transportation service to low-income seniors in the Mid-City area of San Diego. This program was awarded up to $228,531 in Senior Mini-Grant funding through FY 2009 and FY 2010 to expand services. ElderHelp has grown from 33 seniors in January 2009 to 107 seniors by January 2010, providing more than 1,037 one-way trips. Eighty seniors are currently enrolled in the Seniors A Go Go program, the name of the Volunteer Driver service operated by ElderHelp.
8. Full Access and Coordinated Transportation (FACT) Senior Ride Reimbursement Program/RideFACT
This program subsidizes rides for seniors on the FACT-coordinated transportation system called RideFACT. RideFACT was implemented on October 4, 2010. It is a senior transportation service that operates in Ramona and San Diego Country Estates. It is a general purpose, shared-ride, curb-to-curb, next-day service with a minimum fare of $3.00 that operates two days a week (on Tuesdays and Thursdays). FACT contracts with a private transportation provider for the service. FACT plans to provide 1,200 one-way passenger trips during the first year of the RideFACT service, and the contract may be extended based on the performance during the first year. This program was awarded up to $66,240 in Senior Mini-Grant program funding through FY 2009 and FY 2010. The FACT business plan, approved in December 2009, provides an operational roadmap, schedule of scaled growth, and evaluation procedures that will be used to measure performance. In addition to trips provided through RideFACT, FACT services are measured in terms of STRIDE Web site hits and in-person telephone referrals provided. FACT maintains an updated inventory – a Web-based database of transportation services in San Diego County (STRIDE) and uses the data to provide telephone referrals to callers seeking transportation options. During the most recent 15-month period (June 2009 to September 2010), FACT recorded an average of 1,394 STRIDE Web site hits/month and 35 in-person telephone referrals/month.
9. ITN San Diego’s Volunteer Driver Program
This program was awarded up to $75,000 in Senior Mini-Grant funding through FY 2009 and FY 2010. ITN San Diego is an affiliate community of the ITNAmerica network, a national nonprofit transportation system designed for adults 60 years or older. During the first 13 months of the TransNet grant, ITN San Diego has provided more than 1,600 rides. As part of its operational sustainability, ITN San Diego’s Road Scholarship program allows volunteers to provide rides and earn transportation credits, which can be donated to a senior for a free ride or saved for their own future use. Additionally, ITNRides was incorporated into ITN San Diego ride operations, enabling the affiliate community program access to expertise through a
CHAPTER 6: TRANSPORTATION INVENTORY
6-12 The Coordinated Plan (2010 – 2014)
centralized logistical management and monitoring network. The grant awarded to ITN was seed funding to help with operational start-up, and further grant applications are not expected.
10. Jewish Family Service’s Rides & Smiles Program
This program is a volunteer-based transportation service for seniors in the North County Inland communities of San Diego. It was awarded up to $149,411 in Senior Mini-Grant funding through FY 2009 and FY 2010. During the first nine months of the TransNet grant, Rides & Smiles has provided 5,104 volunteer rides with 150 enrolled and screened volunteers.
11. Peninsula Shepherd Senior Center’s Senior Transportation Program
This program provides volunteer driver and weekly shuttle service transportation to ambulatory seniors in the communities of Point Loma, Ocean Beach, and Midway/Sports Arena. It was awarded up to $86,021 in Senior Mini-Grant funding through FY 2009 and FY 2010. During the first seven months of the TransNet grant, this program has provided 1,054 volunteer driver one-way rides, and 735 rides provided by the shuttle van service in which 184 trips were taken.
12. Redwood Elderlink’s Out & About Program
This program is the senior transportation service arm of the Redwood Senior Homes and Service. It was awarded up to $104,006 in Senior Mini-Grant funding through FY 2009 and FY 2010. During the first six months of the TransNet grant, Redwood Elderlink provided 142 one-way trips.
13. Travelers Aid Society’s SenioRide Program
This program provides senior transportation service throughout San Diego County, with most requests received within central San Diego. It also provides taxi scrip service throughout the Yellow Cab coverage area. This program was awarded up to $191,801 in Senior Mini-Grant funding through FY 2009 and FY 2010. The recipient has experienced some delays in project start-up, but expects to fully begin implementation of the program, including a Web site that launched in February 2010.
Social Service Transportation Map Appendix N includes a Social Service Transportation Map showing the service coverage areas for each Senior Mini-Grant-funded project. Service coverage areas were based on ZIP codes served by each project. ZIP code information was drawn from service area size descriptions and other service information provided in progress and quarterly reports. Volunteer Driver Program and Coalition There are a number of volunteer driver programs in the San Diego area. FACT, the CTSA for San Diego County, has been working with many of them to create a volunteer driver coalition. The San Diego County Volunteer Driver Coalition brings together representatives from private agencies, nonprofits, and municipalities to learn from each other, share knowledge and resources, establish standards for
CHAPTER 6: TRANSPORTATION INVENTORY
The Coordinated Plan (2010 – 2014) 6-13
driver qualification, and training. Many coalition members, including Jewish Family Service – Rides & Smiles, City of Vista – Out & About, Peninsula Shepherd Senior Center, City of Oceanside, City of La Mesa, ElderHelp, and ITN San Diego, are recipients of Senior Mini-Grant funding. The coalition has been meeting since February 2007 and has developed a coalition member handbook with a standardized rider application. Each agency develops their own volunteer driver application customized to meet the needs of their agency or program. Additionally, a data collection program has been established to document services by participating agencies. By coming together and providing similar sets of data, the coalition will be able to demonstrate the true impact these agencies have on the seniors in San Diego. Further analysis of the data will provide additional assessments of each project and the grant programs as a whole.
Social Service Transportation Options – Persons With Disabilities Of the 56 agencies that responded to the survey discussed above, 26 provided transportation services for persons with disabilities. The maps representing transportation services available to persons with disabilities reveal less services available than those for seniors. The highest level of service available is along the SR 78 corridor in North County. There is significantly less service available on weekends and no service available in North County on weeknights. When examining the transportation services available to nonagency clients, SANDAG determined that there is no service available on weekdays, weeknights, or weekends in North County. There is, however, a limited amount of service available to the general public in some areas of the central, southern, and eastern areas of the County.
Social Service Transportation Options – Persons With Low-Incomes Of the 56 agencies that responded to the survey, 31 provided transportation services for persons with low incomes. This population had the highest level of service available during the weekdays, with the most significant concentrations in the central and southern areas of the County. There was less service available during the weekends, with none in North County. There were no agencies that reported providing transportation for low-income individuals during weeknights; therefore, no map was included. Finally, for nonagency clients, there was still service available on the weekdays and weekends, mostly in the central, southern, and eastern areas of the County.
6.4 Vanpool Alternatives Alternative public transportation opportunities are available in the San Diego region through existing vanpooling programs. Vanpooling programs involve coordination services such as ride matching, but also can involve operation of regional van or car service. Vanpooling services located in the San Diego region are described in greater detail below.
iCommute iCommute is the commuter services program for the San Diego region. The program is managed by SANDAG and offers free services to help commuters find alternatives to driving alone. Services include: carpool
CHAPTER 6: TRANSPORTATION INVENTORY
6-14 The Coordinated Plan (2010 – 2014)
matching services (for work and school), regional vanpool program, “Guaranteed Ride Home” program, Bike to Work information, bike locker rentals throughout the County, transit information, teleworking information for employers, and customized commuting programs for employers. iCommute’s vanpool program utilizes the Congestion Mitigation and Air Quality (CMAQ) Improvement Program and the San Diego County Air Pollution Control District funds to subsidize up to $400 per month of the van lease cost for approved vanpools. Vanpool costs range from approximately $600 to $1,400 per month for a variety of van sizes provided by one of three vendors. Commuters initiate and negotiate their own lease agreements. Maintenance and insurance are typically included in the lease cost, while vanpool users pay for gas and the remainder of the van lease not covered by the subsidy. iCommute’s regional bike locker network includes 559 locker spaces serving 467 current users. The lockers are currently free to use, with a $25 or $35 security deposit for the key. Funding for management of the program and locker maintenance comes from CMAQ. iCommute is currently exploring a retrofit of existing lockers and purchase of new electronic on-demand units to make the network compatible with the Compass Card, the region’s new smart card standard.
6.5 Neighboring Systems Transit services in adjacent jurisdictions connect to services to and from San Diego County and are therefore recognized in the regional transportation inventory.
Orange County Transportation Authority (OCTA) The OCTA is a multimodal transportation agency serving Orange County. The OCTA operates countywide bus and paratransit service; the 91 Express Lanes toll facility, freeway, street and road improvement projects, motorist-aid services, regulation of taxi operations, and administers all of Orange County's Metrolink rail corridor service. The OCTA recently prepared its draft Long-Range Transportation Plan (LRTP) that provides the planning foundation for future transportation improvements. The proposed LRTP includes improvements to the transportation network, such as new and widened freeways, tollways, roadways, new and enhanced transit facilities, regional bikeway improvements, and new environmental programs. Orange County’s current transit system includes a network of local bus routes that provide service to most residential and employment areas of the County, several express bus routes, and service for longer-distance travel. The current (2004) level of ridership is 67.5 million riders. The number of Orange County riders on Metrolink has increased from less than 145,000 passengers in 1994 to over 3,000,000 passengers in 2004. Orange County’s express buses use the freeway system to provide commuters with faster service over longer distances. There are currently nine express bus routes in place using I-5, I-405, SR 91, and SR 57 to connect major employment centers and park-and-ride lots.
CHAPTER 6: TRANSPORTATION INVENTORY
The Coordinated Plan (2010 – 2014) 6-15
OCTA’s goals for transit improvements include improving bus connections to Metrolink, developing rapid bus service on major arterials, and improving Metrolink frequency. None of OCTA’s routes serve San Diego County; however, OCTA Routes 1 and 191 serve San Clemente Plaza, where passengers can transfer to San Diego NCTD BREEZE Route 395 to Camp Pendleton and Oceanside. Interagency transfers from OCTA to BREEZE buses are available upon request.
Riverside Transit Agency The Riverside Transit Agency (RTA) is the CTSA for western Riverside County and is responsible for coordinating transit services throughout the approximate 2,500-square-mile service area. RTA provides both local and regional services throughout the region with 38 fixed routes, five CommuterLink routes, and Dial-A-Ride services using 231 vehicles. RTA Route 202 provides peak-hour commuter express service from Temecula to Oceanside Transit Center for connections to NCTD’s COASTER service. An interagency transfer agreement between NCTD and RTA is currently being negotiated.
Imperial Valley Transit Imperial Valley Transit was created in 1989 as “Imperial County Transit.” It began as a five-route system, with approximately 3,000 passengers a month. Today IVT has 18 routes, with an average ridership of 23,000 passengers per month. The service is operated by LAIDLAW Transit Services, Inc., which is administered by the County Department of Public Works and funded by the Imperial Valley Association of Governments. Two Imperial Valley routes (Routes 400 and 450) serve the eastern edge of San Diego County at Ocotillo one day per week. However, there are no connecting routes from Ocotillo into the rest of San Diego County. The nearest MTS route serves Borrego Springs.
Tijuana The border crossings between the United States and Mexico are the busiest in the world. Annually, more than 31 million cars carrying nearly 73 million passengers, 23 million pedestrians, and 1.3 million people arriving by bus have entered California from Mexico. In addition, nearly 1.3 million trucks enter the United States at the commercial crossings. Similar numbers of passengers, pedestrians, and vehicles head south from California to Mexico. To accommodate the border transportation system, a comprehensive effort is underway to improve access to border crossings, expand freight rail service, and coordinate commercial vehicle crossings. A proposed third border crossing at East Otay Mesa would provide an alternate entry for vehicles and commercial trucks. In the United States, the proposed SR 11 will connect the new border crossing to SR 905 and SR 125. In Mexico, the Tijuana-Rosarito 2000 corridor will connect to the East Otay future Port of Entry. The Otay Mesa-Mesa de Otay Binational Corridor Strategic Plan, adopted by the SANDAG Board in 2007, proposes to improve cross-border travel, giving high priority to public transportation. The City of Tijuana has identified several transit issues, including saturated streets due to growth in vehicular travel, inadequate boarding facilities, an older bus fleet, lack of schedules for transit routes, and
CHAPTER 6: TRANSPORTATION INVENTORY
6-16 The Coordinated Plan (2010 – 2014)
inadequate control of transit operations. A restructuring plan is proposed to better meet travel demand patterns in Tijuana. Rail is another key component to the binational transportation system. Re-opening the (San Diego and Arizona Eastern Railway (SD&AE) Railway is proposed to improve the movement of goods through the Southern California/Baja California region. Existing freight service between San Diego and Tecate can be extended to the Imperial Valley by rehabilitating the Desert Line section of the SD&AE. Another rail improvement under consideration is a new rail line between Ensenada and Tecate that will connect to the SD&AE. An additional method that facilitates border crossing is offered by the newest airline of Mexico, Volaris. This airline offers shuttle service from the Santa Fe Depot in San Diego to the Tijuana Airport in Mexico. A one-way ticket to Tijuana costs $15, and return services also are available from the Tijuana airport to both the San Ysidro border and downtown San Diego. It should be noted that cross-border transit services require patrons to alight at the border, walk through the inspection area, and re-board their bus once they have cleared Mexican Customs.
6.6 Interregional Systems
Amtrak Amtrak’s 351-mile Pacific Surfliner corridor serves more than 2.5 million intercity passengers each year. Together with more than six million commuter passengers using either Metrolink or COASTER, it is the second busiest passenger rail corridor in the nation. The coastal corridor runs from San Diego to San Luis Obispo through six counties. Stations in San Diego County include Oceanside, Solana Beach, Old Town, and downtown San Diego. Connections to the transit system occur at each of these stations, including COASTER, Metrolink, Greyhound, local bus routes, the San Diego Trolley, and the SPRINTER light rail route. The Surfliner operates 7 days per week, 11 times per day. Most service is between San Diego and Los Angeles; 2 round trips each day operate between San Luis Obispo and San Diego (including stops at Santa Barbara), while the other round trips operate between Los Angeles and San Diego. Since 1989 SANDAG has been a member of the Los Angeles, San Diego, San Luis Obispo (LOSSAN) Rail Corridor Agency, which seeks to increase ridership, revenue, capacity, reliability, and safety on the corridor. Other members of LOSSAN are rail owners and operators and regional transportation planning agencies. LOSSAN has secured funding for intercity rail programs. The State of California has invested more than $1 billion in the corridor, along with $200 million from Amtrak and $300 million by local member agencies. Federal funding since 1996 has resulted in $24 million in improvements, including grade separations in the cities of Solana Beach, Commerce, and Fullerton. LOSSAN also has obtained federal funds for the Del Mar Bluffs Stabilization project. LOSSAN aims to enhance funding for intercity rail, enhance service frequency and quality, improve safety, and promote transit-oriented development.
CHAPTER 6: TRANSPORTATION INVENTORY
The Coordinated Plan (2010 – 2014) 6-17
The Rail2Rail program previously allowed COASTER’s monthly passholders to ride Surfliner trains within the limits of their monthly pass. This service provided additional options for people traveling between the Santa Fe Depot, Solana Beach, and Oceanside. Similarly, Amtrak passengers could ride the COASTER if they had a valid Amtrak ticket for service between Oceanside, Solana Beach, and the Santa Fe Depot. The program was eliminated on July 1, 2008, due to budget constraints.
Metrolink Metrolink is a regional rail system, including commuter and other passenger services, linking communities to employment and activity centers in Riverside, San Bernardino, the Inland Empire, Orange, and Ventura Counties. The services on board the Orange County line are offered on both weekdays and weekends. Although the Orange County line provides connections to the Oceanside Transit Center and links San Diego County with Los Angeles and Orange County, there is currently not a transfer agreement in place between the COASTER and the Metrolink. Passengers wishing to continue their rail trip further south must purchase an additional ticket on the COASTER in order to get to their final destination. There is a transfer agreement allowing Metrolink passengers to transfer to the NCTD BREEZE bus and SPRINTER rail system; however, the transfer agreement is only valid one-way. Metrolink tickets may now be purchased at the Santa Fe Depot in San Diego, although the service is only available at Oceanside.
Emergency Transportation Services Transit and social service transportation can provide critical transportation services in the event of a regional emergency. Therefore, emergency transportation services have been included in the short-range transit planning process to acknowledge the roles that transit and social service transportation can play in meeting the needs of area residents during a catastrophic event. The following sections explain these roles in detail.
6.7 Transit Since all transit services are ADA-accessible, potentially all transit vehicles could be utilized in the event they are needed to provide relief for a major emergency. The County of San Diego’s Office of Emergency Services (OES) coordinates the overall county response to disasters. For evacuations and emergencies, OES coordinates with the transit agencies to utilize fleet vehicles in the event that they are needed. There are currently 901 MTS and NCTD transit vehicles available to provide mass transportation assistance. During large-scale events, OES can coordinate with transit agencies outside of the county in the event that additional vehicles are needed for disaster relief.
6.8 Social Service Transportation Until recently, social service transportation was not included in the pool of potential emergency relief services coordinated or available to OES. To this end, OES is currently preparing a database and negotiating transportation agreements with social service transportation providers for emergency transportation assistance. Upon its completion, this project will assist the Emergency Operations Center staff in the event that additional transportation services are needed during an

Chapter 7
Th
e
Co
ord
inate
d P
lan
Needs Assessment

The Coordinated Plan (2010 – 2014) 7-1
CHAPTER 7: NEEDS ASSESSMENT
The needs assessment component of the Coordinated Plan was developed through the analysis of the difference between passenger demand (Chapter 5) and transportation services that are available to meet that demand (Chapter 6). Services that are not provided where there is demand create unmet needs and are included in this chapter. Recognizing the fundamental difference between urban and rural transportation needs, the 2010-2014 Coordinated Plan includes an in-depth analysis of rural transportation needs in addition to the urban needs assessment continued from previous Coordinated Plans.
7.1 Urban Needs Analysis A number of transportation needs were identified through the urban outreach programs conducted for the 2007 and 2008 Coordinated Plans. Detailed maps illustrating transit service gaps from those efforts have been provided in Appendix O for each of the following transportation disadvantaged population groups included in this plan:
1. General Population
2. Individuals With Limited Means
3. People With Disabilities
4. Older Adults
7.2 Rural Needs Analysis Specifically, the 2010-2014 Coordinated Plan focuses on developing an understanding of the unmet transportation needs in rural communities. This was done through a four-step rural transportation study, including phone interviews with community leaders, a public survey, outreach meetings, and input from the Social Service Transportation Advisory Council (SSTAC). In particular, the survey enabled SANDAG to isolate trips that were not made because the respondent was unable to arrange transportation (referenced as “unserved” trips). Additionally, since specific personal demographic information was asked on the survey (age, income, disability, etc.), SANDAG was able to calculate the percentage of unserved trips by each transportation disadvantaged population group evaluated in this plan. Figure 7.1 illustrates the total rural unserved trips missed by population group.
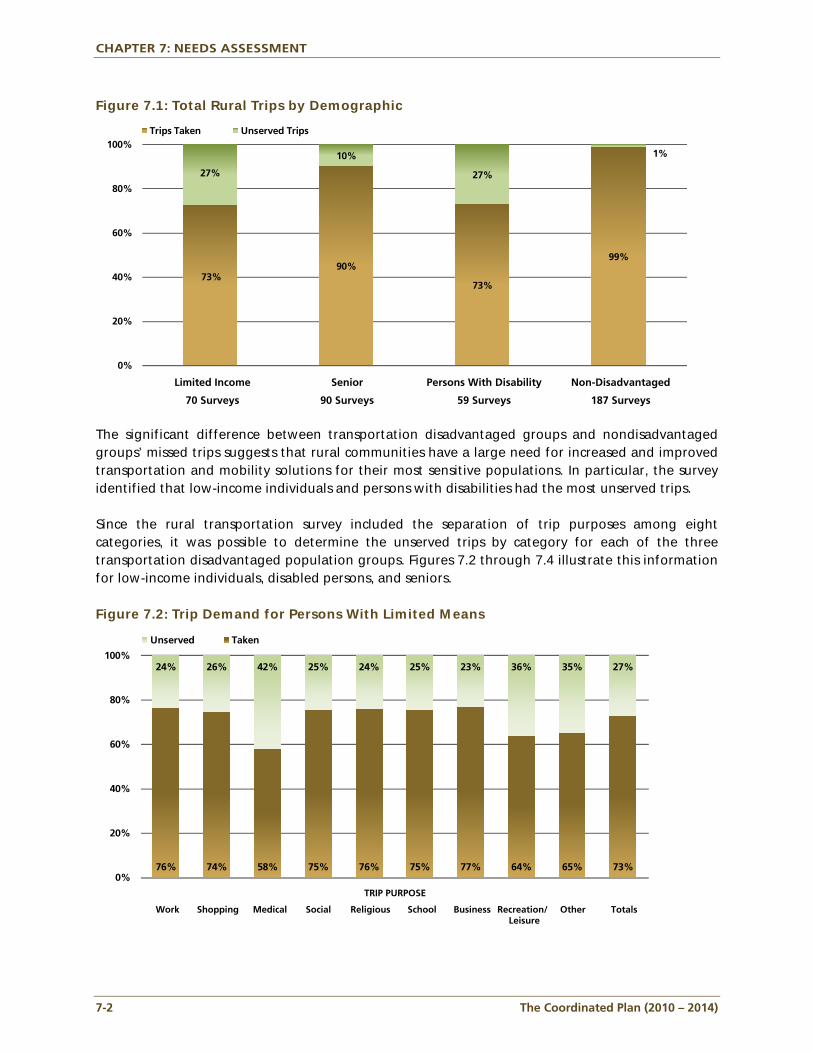
CHAPTER 7: NEEDS ASSESSMENT
7-2 The Coordinated Plan (2010 – 2014)
Figure 7.1: Total Rural Trips by Demographic
73%90%
73%
99%
27%
10%
27%
1%
0%
20%
40%
60%
80%
100%Trips Taken Unserved Trips
Limited Income Senior Persons With Disability Non-Disadvantaged
70 Surveys 90 Surveys 59 Surveys 187 Surveys
The significant difference between transportation disadvantaged groups and nondisadvantaged groups’ missed trips suggests that rural communities have a large need for increased and improved transportation and mobility solutions for their most sensitive populations. In particular, the survey identified that low-income individuals and persons with disabilities had the most unserved trips. Since the rural transportation survey included the separation of trip purposes among eight categories, it was possible to determine the unserved trips by category for each of the three transportation disadvantaged population groups. Figures 7.2 through 7.4 illustrate this information for low-income individuals, disabled persons, and seniors. Figure 7.2: Trip Demand for Persons With Limited Means
76% 74% 58% 75% 76% 75% 77% 64% 65% 73%
24% 26% 42% 25% 24% 25% 23% 36% 35% 27%
0%
20%
40%
60%
80%
100%
Unserved Taken
TRIP PURPOSE
Work Shopping Medical Social Religious School Business Recreation/ Other Totals Leisure
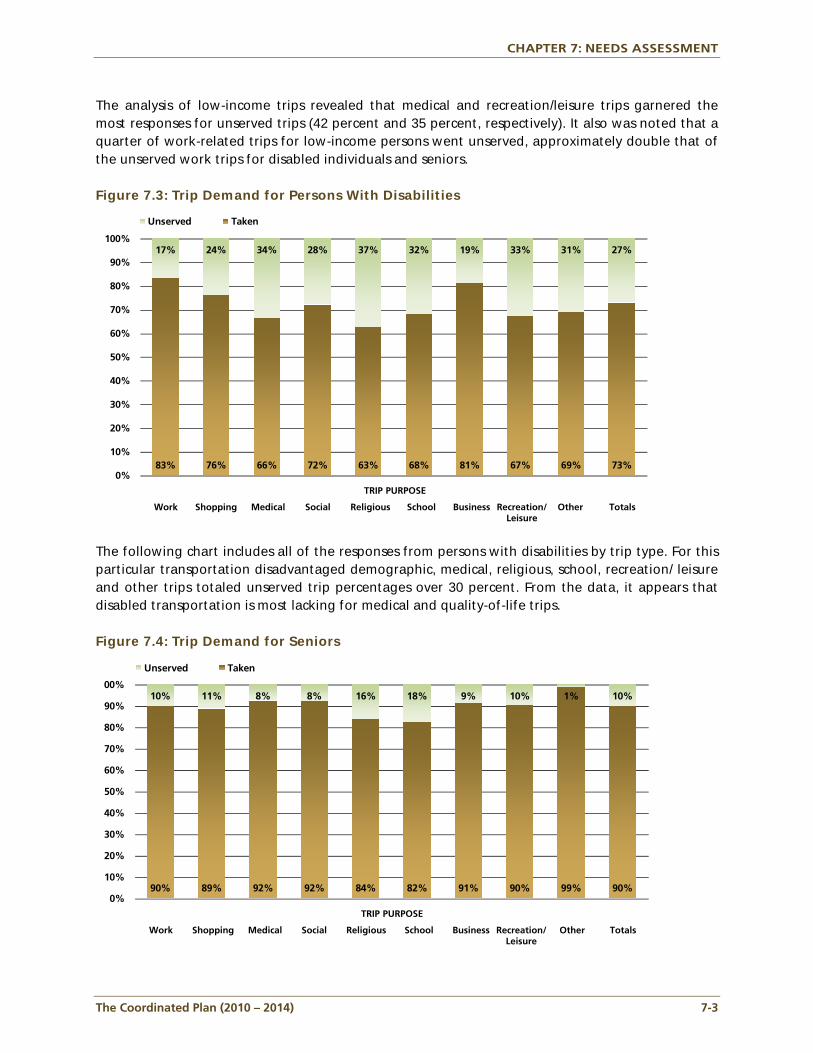
CHAPTER 7: NEEDS ASSESSMENT
The Coordinated Plan (2010 – 2014) 7-3
The analysis of low-income trips revealed that medical and recreation/leisure trips garnered the most responses for unserved trips (42 percent and 35 percent, respectively). It also was noted that a quarter of work-related trips for low-income persons went unserved, approximately double that of the unserved work trips for disabled individuals and seniors. Figure 7.3: Trip Demand for Persons With Disabilities
83% 76% 66% 72% 63% 68% 81% 67% 69% 73%
17% 24% 34% 28% 37% 32% 19% 33% 31% 27%
0%
10%
20%
30%
40%
50%
60%
70%
80%
90%
100%
Unserved Taken
TRIP PURPOSE
Work Shopping Medical Social Religious School Business Recreation/ Other Totals Leisure
The following chart includes all of the responses from persons with disabilities by trip type. For this particular transportation disadvantaged demographic, medical, religious, school, recreation/ leisure and other trips totaled unserved trip percentages over 30 percent. From the data, it appears that disabled transportation is most lacking for medical and quality-of-life trips. Figure 7.4: Trip Demand for Seniors
90% 89% 92% 92% 84% 82% 91% 90% 99% 90%
10% 11% 8% 8% 16% 18% 9% 10% 1% 10%
0%
10%
20%
30%
40%
50%
60%
70%
80%
90%
00%
Unserved Taken
TRIP PURPOSE
Work Shopping Medical Social Religious School Business Recreation/ Other Totals Leisure
CHAPTER 7: NEEDS ASSESSMENT
7-4 The Coordinated Plan (2010 – 2014)
The analysis of unserved trips by seniors (persons over 65), revealed that religious and school trips represented the largest category of unserved trips for this population by percent. Most of the other categories were at or near the 10-percent unserved trip level, similar to the overall senior average. This data showed that virtually every category included unmet senior transportation needs. This same unserved trip analysis was performed for each of the following community planning areas:
Ramona (including North Mountain, Julian, Cuyamaca, Central Mountain, and Barona);
Borrego Springs;
Valley Center (including Palomar Mountain, Pala-Pauma, Rainbow, Fallbrook, Bonsall, and Hidden Meadows); and
Campo (including Alpine, Crest-Dehesa, Jamul, Otay, Potrero, Boulevard, Mountain Empire, Pine Valley and Jacumba).
Charts illustrating the missed trips of these communities are included in Appendix Q, along with charts illustrating responses to the other questions asked in the survey.
7.3 Summary Appendix O includes the areas, communities, or neighborhoods where service gaps were found in both the urban and rural areas based on an analysis of Census 2000, existing service, and rural survey data. The urban service gaps in social service transportation1 were based on the expanded social service transportation assessment and survey conducted for the 2008-2012 Coordinated Plan. These gaps pertain to each of the above population groups with the exception of the “General Population” group. This category was not included in the inventory since it was only conducted for groups eligible to receive funding under the federal programs associated with the Coordinated Plan (those serving low-income, disabled, and seniors populations). The social service coverage maps are included in Appendix N.
1 Gaps in social service transportation were based on areas with significant populations having limited or no social service
transportation provided without significant barriers to receive service (such as requirements to be a member or “agency client” of that organization, etc.).
Chapter 8
Th
e
Co
ord
inate
d P
lan
Strategies and Project Prioritization

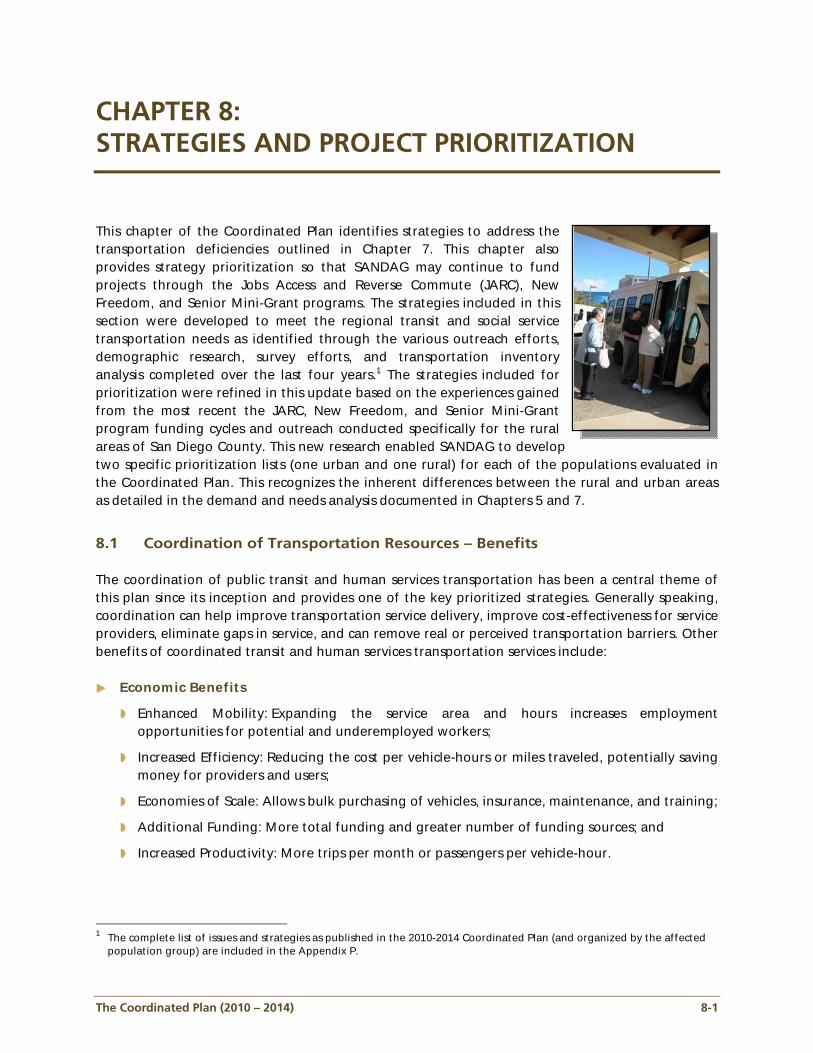
The Coordinated Plan (2010 – 2014) 8-1
CHAPTER 8: STRATEGIES AND PROJECT PRIORITIZATION
This chapter of the Coordinated Plan identifies strategies to address the transportation deficiencies outlined in Chapter 7. This chapter also provides strategy prioritization so that SANDAG may continue to fund projects through the Jobs Access and Reverse Commute (JARC), New Freedom, and Senior Mini-Grant programs. The strategies included in this section were developed to meet the regional transit and social service transportation needs as identified through the various outreach efforts, demographic research, survey efforts, and transportation inventory analysis completed over the last four years.1 The strategies included for prioritization were refined in this update based on the experiences gained from the most recent the JARC, New Freedom, and Senior Mini-Grant program funding cycles and outreach conducted specifically for the rural areas of San Diego County. This new research enabled SANDAG to develop two specific prioritization lists (one urban and one rural) for each of the populations evaluated in the Coordinated Plan. This recognizes the inherent differences between the rural and urban areas as detailed in the demand and needs analysis documented in Chapters 5 and 7.
8.1 Coordination of Transportation Resources – Benefits The coordination of public transit and human services transportation has been a central theme of this plan since its inception and provides one of the key prioritized strategies. Generally speaking, coordination can help improve transportation service delivery, improve cost-effectiveness for service providers, eliminate gaps in service, and can remove real or perceived transportation barriers. Other benefits of coordinated transit and human services transportation services include:
Economic Benefits
Enhanced Mobility: Expanding the service area and hours increases employment opportunities for potential and underemployed workers;
Increased Efficiency: Reducing the cost per vehicle-hours or miles traveled, potentially saving money for providers and users;
Economies of Scale: Allows bulk purchasing of vehicles, insurance, maintenance, and training;
Additional Funding: More total funding and greater number of funding sources; and
Increased Productivity: More trips per month or passengers per vehicle-hour.
1 The complete list of issues and strategies as published in the 2010-2014 Coordinated Plan (and organized by the affected
population group) are included in the Appendix P.
CHAPTER 8: STRATEGIES AND PROJECT PRIORITIZATION
8-2 The Coordinated Plan (2010 – 2014)
Social Benefits:
Allows Independence: Improves quality of life by providing access to work, medical needs, shopping, social events, and religious services for those who cannot drive; and
Easy-to-Use System: Coordinated services are better publicized, reliable, and accessible for users with the potential of serving more destinations.
8.2 Coordination of Transportation Resources – Challenges While there are numerous benefits of coordinating transportation services, there also are many existing barriers facing coordination. The following areas were identified which could be improved or coordinated to enhance efficiency and service delivery:
Training and Maintenance: School districts, transit, paratransit, and other transportation providers operate their own training programs for drivers and own maintenance program for vehicles;
Eligibility: Each transportation system has different eligibility requirements for riders precluding efficient coordination;
Capital Cost and Purchasing: Each transportation system typically purchases its own equipment and vehicles;
Reporting and Usage: Federal, state, and local funds used for transportation have different restrictions and reporting requirements; and
Funding Source Restrictions: Various sources of funding restrict different transportation service to specific populations for specific purposes.
8.3 Mobility Management Mobility management is a method of coordinating transportation resources to respond to the challenges listed above. Mobility management includes the design and management of the transportation services so they can perform effectively and efficiently. Mobility management can have the following characteristics that distinguish it from the traditional transportation service development model:
Disaggregated rather than aggregated service planning. Under the mobility management concept, the agency disaggregates markets, seeks to understand the individualized needs of those markets, and designs service strategies to effectively meet those needs.
Service diversity rather than service uniformity. Most transportation systems are built on a principle of unified, fixed-route service coverage. Mobility management involves the development of a network of multiple services to serve a wide variety of needs.
Multiple rather than a single provider. Under the mobility management arrangement, the agency looks to broker service to the most efficient and effective provider. The result is a transportation network of diverse providers rather than a single system.
CHAPTER 8: STRATEGIES AND PROJECT PRIORITIZATION
The Coordinated Plan (2010 – 2014) 8-3
Service advocate rather service provider. Transportation agencies, including transit agencies, generally focus on the direct provision of service delivery. Under mobility management, the agency views itself as a travel agent seeking the most effective strategy for meeting service needs.
8.4 Project Prioritization Beginning with the 2008-2012 update of the Coordinated Plan, the Safe, Accountable, Flexible, Efficient Transportation Equity Act: A Legacy for Users (SAFETEA-LU) required that the prioritization of projects and strategies be included in the Coordinated Plan in order for SANDAG to distribute federal funding through the JARC and New Freedom programs. The 2010-2014 Plan is the first plan to include specific lists for the rural and urbanized area separately based on the research conducted in 2010 in the rural areas. A list of priorities was developed for both areas (urban and rural) through an expansive public outreach program, which included members of the public, the transit agencies, stakeholders, and social service agencies. These priorities were then included with the comprehensive empirical data analysis gathered via surveys and developed through the use of sophisticated geographic mapping techniques. The results are included in the following tables and have been organized and updated according to strategies that meet the needs of each population group identified in the plan. There are four priority levels ranging from “Very High Priorities” to “Low Priorities.” These priorities will assist SANDAG in its effort to continue the distribution of funding related to the Coordinated Plan in the most equitable manner possible. The priority tables are included in Tables 8.1 through 8.6. Additionally, the concept of transportation vouchers emerged during research of the rural areas of San Diego County and, as a result, has been added to the rural prioritized tables (Tables 8.2 and 8.3). This concept is explained in the following subsection.
Voucher Programs Voucher programs are similar to Volunteer Driver Programs, but place the onus on the passenger to find someone to provide the needed ride. When someone provides the passenger with a ride they can give the driver a voucher which can be exchanged for reimbursement for driving. Vouchers can be given to friends, family, neighbors, or even strangers. The advantage of a voucher program is the relatively low overhead, but it may not work for people who do not have friends, family, or neighbors upon which they can call. During the last few years, two models for managing voucher systems have emerged.
Checkbook Model – Customers receive a pre-printed checkbook with an allocation of miles or trips from the supporting agency. The customer trades the check for a ride with a volunteer. The support agency can help locate rides or offer trip planning support; however, customers may plan the trips themselves, thereby requiring less management on the part of the supporting agency. In either case, the supporting agency allocates vouchers and reimburses drivers. Although volunteer drivers are paid, the driver maintains volunteer status under IRS rules.
i-voucher Model – The i-voucher model involves pre-printed rides with specified origins and destinations which contain information about mileage, value, and documentation (e.g., driver’s signature, rider data). Voucher sites reimburse drivers and invoice funding sources.
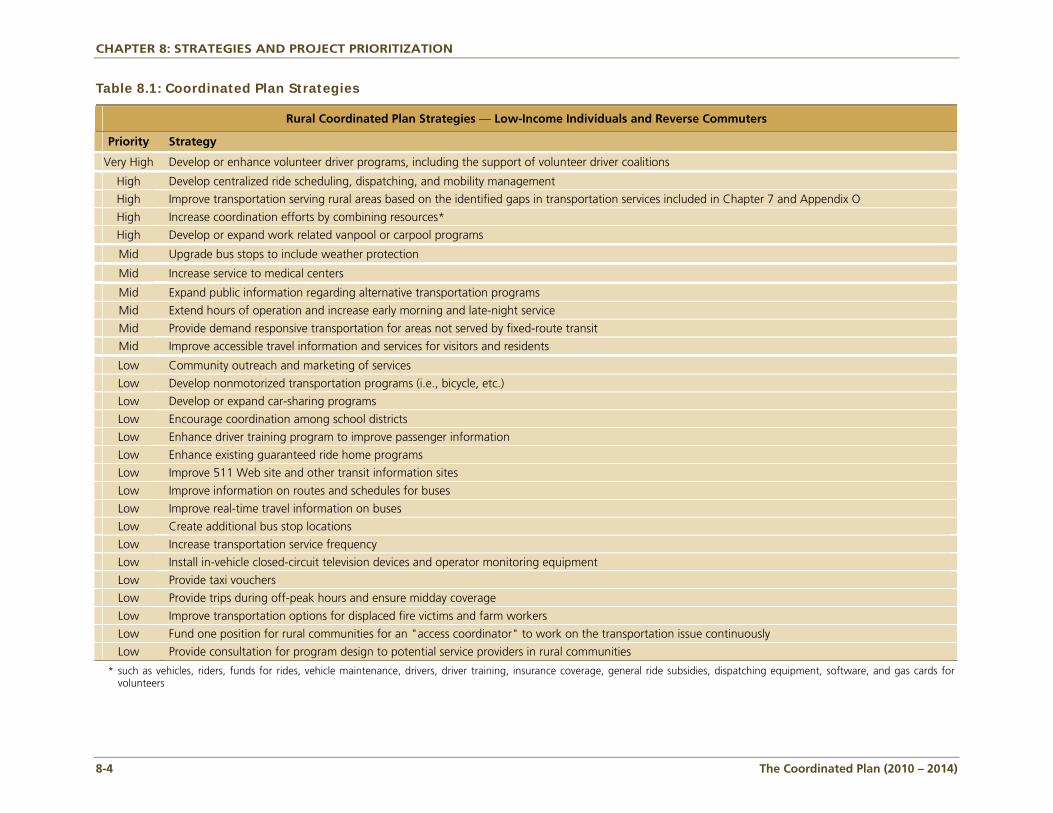
CHAPTER 8: STRATEGIES AND PROJECT PRIORITIZATION
8-4 The Coordinated Plan (2010 – 2014)
Table 8.1: Coordinated Plan Strategies
Rural Coordinated Plan Strategies — Low-Income Individuals and Reverse Commuters
Priority Strategy
Very High Develop or enhance volunteer driver programs, including the support of volunteer driver coalitions
High Develop centralized ride scheduling, dispatching, and mobility management
High Improve transportation serving rural areas based on the identified gaps in transportation services included in Chapter 7 and Appendix O
High Increase coordination efforts by combining resources*
High Develop or expand work related vanpool or carpool programs
Mid Upgrade bus stops to include weather protection
Mid Increase service to medical centers
Mid Expand public information regarding alternative transportation programs
Mid Extend hours of operation and increase early morning and late-night service
Mid Provide demand responsive transportation for areas not served by fixed-route transit
Mid Improve accessible travel information and services for visitors and residents
Low Community outreach and marketing of services
Low Develop nonmotorized transportation programs (i.e., bicycle, etc.)
Low Develop or expand car-sharing programs
Low Encourage coordination among school districts
Low Enhance driver training program to improve passenger information
Low Enhance existing guaranteed ride home programs
Low Improve 511 Web site and other transit information sites
Low Improve information on routes and schedules for buses
Low Improve real-time travel information on buses
Low Create additional bus stop locations
Low Increase transportation service frequency
Low Install in-vehicle closed-circuit television devices and operator monitoring equipment
Low Provide taxi vouchers
Low Provide trips during off-peak hours and ensure midday coverage
Low Improve transportation options for displaced fire victims and farm workers
Low Fund one position for rural communities for an "access coordinator" to work on the transportation issue continuously
Low Provide consultation for program design to potential service providers in rural communities
* such as vehicles, riders, funds for rides, vehicle maintenance, drivers, driver training, insurance coverage, general ride subsidies, dispatching equipment, software, and gas cards for volunteers
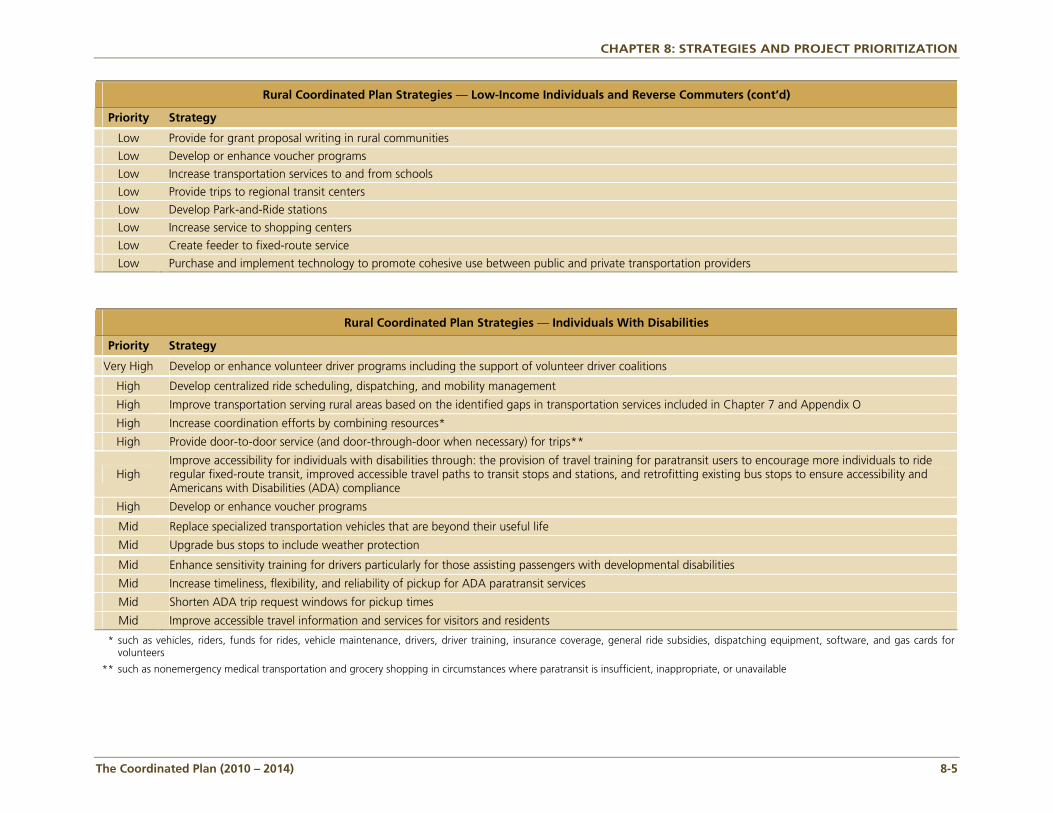
CHAPTER 8: STRATEGIES AND PROJECT PRIORITIZATION
The Coordinated Plan (2010 – 2014) 8-5
Rural Coordinated Plan Strategies — Low-Income Individuals and Reverse Commuters (cont’d)
Priority Strategy
Low Provide for grant proposal writing in rural communities
Low Develop or enhance voucher programs
Low Increase transportation services to and from schools
Low Provide trips to regional transit centers
Low Develop Park-and-Ride stations
Low Increase service to shopping centers
Low Create feeder to fixed-route service
Low Purchase and implement technology to promote cohesive use between public and private transportation providers
Rural Coordinated Plan Strategies — Individuals With Disabilities
Priority Strategy
Very High Develop or enhance volunteer driver programs including the support of volunteer driver coalitions
High Develop centralized ride scheduling, dispatching, and mobility management
High Improve transportation serving rural areas based on the identified gaps in transportation services included in Chapter 7 and Appendix O
High Increase coordination efforts by combining resources*
High Provide door-to-door service (and door-through-door when necessary) for trips**
High Improve accessibility for individuals with disabilities through: the provision of travel training for paratransit users to encourage more individuals to ride regular fixed-route transit, improved accessible travel paths to transit stops and stations, and retrofitting existing bus stops to ensure accessibility and Americans with Disabilities (ADA) compliance
High Develop or enhance voucher programs
Mid Replace specialized transportation vehicles that are beyond their useful life
Mid Upgrade bus stops to include weather protection
Mid Enhance sensitivity training for drivers particularly for those assisting passengers with developmental disabilities
Mid Increase timeliness, flexibility, and reliability of pickup for ADA paratransit services
Mid Shorten ADA trip request windows for pickup times
Mid Improve accessible travel information and services for visitors and residents
* such as vehicles, riders, funds for rides, vehicle maintenance, drivers, driver training, insurance coverage, general ride subsidies, dispatching equipment, software, and gas cards for volunteers
** such as nonemergency medical transportation and grocery shopping in circumstances where paratransit is insufficient, inappropriate, or unavailable
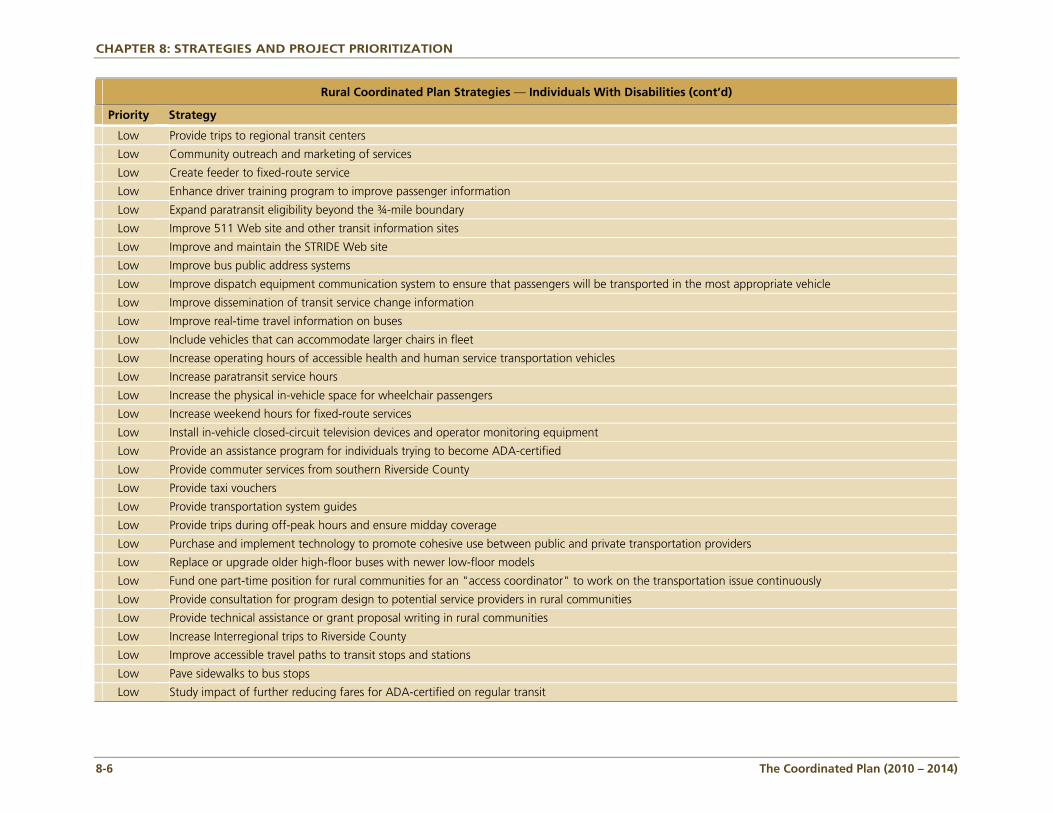
CHAPTER 8: STRATEGIES AND PROJECT PRIORITIZATION
8-6 The Coordinated Plan (2010 – 2014)
Rural Coordinated Plan Strategies — Individuals With Disabilities (cont’d)
Priority Strategy
Low Provide trips to regional transit centers
Low Community outreach and marketing of services
Low Create feeder to fixed-route service
Low Enhance driver training program to improve passenger information
Low Expand paratransit eligibility beyond the ¾-mile boundary
Low Improve 511 Web site and other transit information sites
Low Improve and maintain the STRIDE Web site
Low Improve bus public address systems
Low Improve dispatch equipment communication system to ensure that passengers will be transported in the most appropriate vehicle
Low Improve dissemination of transit service change information
Low Improve real-time travel information on buses
Low Include vehicles that can accommodate larger chairs in fleet
Low Increase operating hours of accessible health and human service transportation vehicles
Low Increase paratransit service hours
Low Increase the physical in-vehicle space for wheelchair passengers
Low Increase weekend hours for fixed-route services
Low Install in-vehicle closed-circuit television devices and operator monitoring equipment
Low Provide an assistance program for individuals trying to become ADA-certified
Low Provide commuter services from southern Riverside County
Low Provide taxi vouchers
Low Provide transportation system guides
Low Provide trips during off-peak hours and ensure midday coverage
Low Purchase and implement technology to promote cohesive use between public and private transportation providers
Low Replace or upgrade older high-floor buses with newer low-floor models
Low Fund one part-time position for rural communities for an "access coordinator" to work on the transportation issue continuously
Low Provide consultation for program design to potential service providers in rural communities
Low Provide technical assistance or grant proposal writing in rural communities
Low Increase Interregional trips to Riverside County
Low Improve accessible travel paths to transit stops and stations
Low Pave sidewalks to bus stops
Low Study impact of further reducing fares for ADA-certified on regular transit
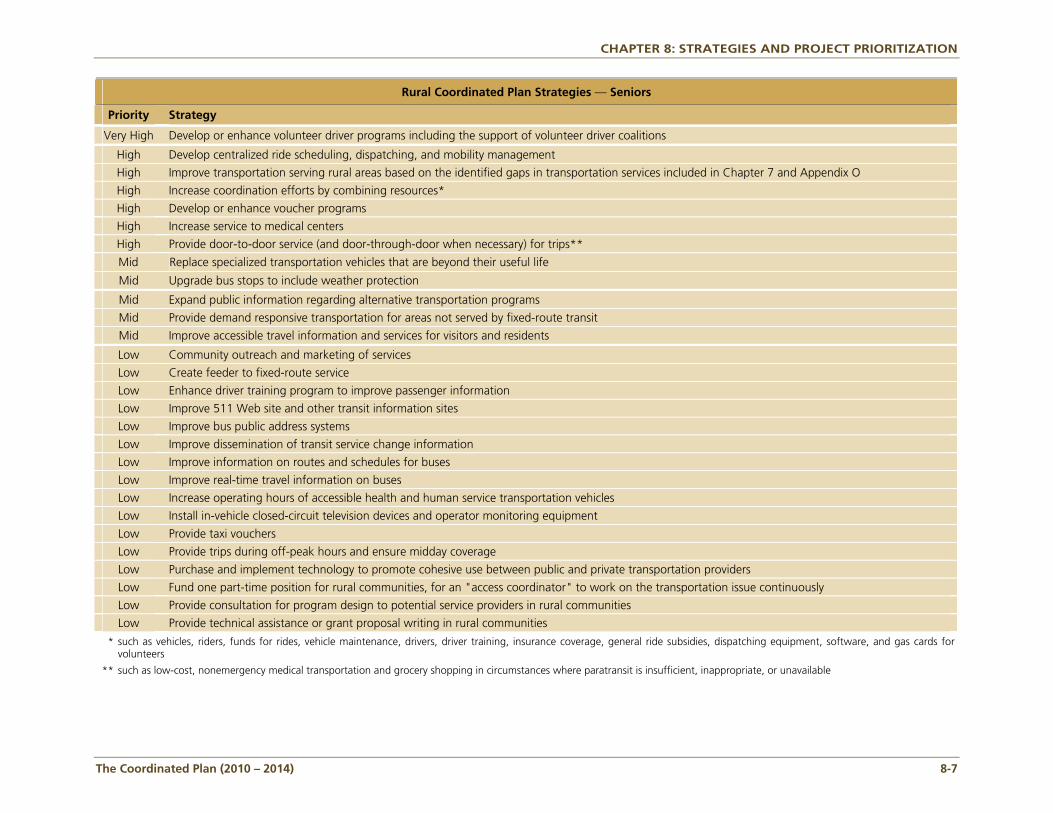
CHAPTER 8: STRATEGIES AND PROJECT PRIORITIZATION
The Coordinated Plan (2010 – 2014) 8-7
Rural Coordinated Plan Strategies — Seniors
Priority Strategy
Very High Develop or enhance volunteer driver programs including the support of volunteer driver coalitions
High Develop centralized ride scheduling, dispatching, and mobility management
High Improve transportation serving rural areas based on the identified gaps in transportation services included in Chapter 7 and Appendix O
High Increase coordination efforts by combining resources*
High Develop or enhance voucher programs
High Increase service to medical centers
High Provide door-to-door service (and door-through-door when necessary) for trips**
Mid Replace specialized transportation vehicles that are beyond their useful life
Mid Upgrade bus stops to include weather protection
Mid Expand public information regarding alternative transportation programs
Mid Provide demand responsive transportation for areas not served by fixed-route transit
Mid Improve accessible travel information and services for visitors and residents
Low Community outreach and marketing of services
Low Create feeder to fixed-route service
Low Enhance driver training program to improve passenger information
Low Improve 511 Web site and other transit information sites
Low Improve bus public address systems
Low Improve dissemination of transit service change information
Low Improve information on routes and schedules for buses
Low Improve real-time travel information on buses
Low Increase operating hours of accessible health and human service transportation vehicles
Low Install in-vehicle closed-circuit television devices and operator monitoring equipment
Low Provide taxi vouchers
Low Provide trips during off-peak hours and ensure midday coverage
Low Purchase and implement technology to promote cohesive use between public and private transportation providers
Low Fund one part-time position for rural communities, for an "access coordinator" to work on the transportation issue continuously
Low Provide consultation for program design to potential service providers in rural communities
Low Provide technical assistance or grant proposal writing in rural communities
* such as vehicles, riders, funds for rides, vehicle maintenance, drivers, driver training, insurance coverage, general ride subsidies, dispatching equipment, software, and gas cards for volunteers
** such as low-cost, nonemergency medical transportation and grocery shopping in circumstances where paratransit is insufficient, inappropriate, or unavailable
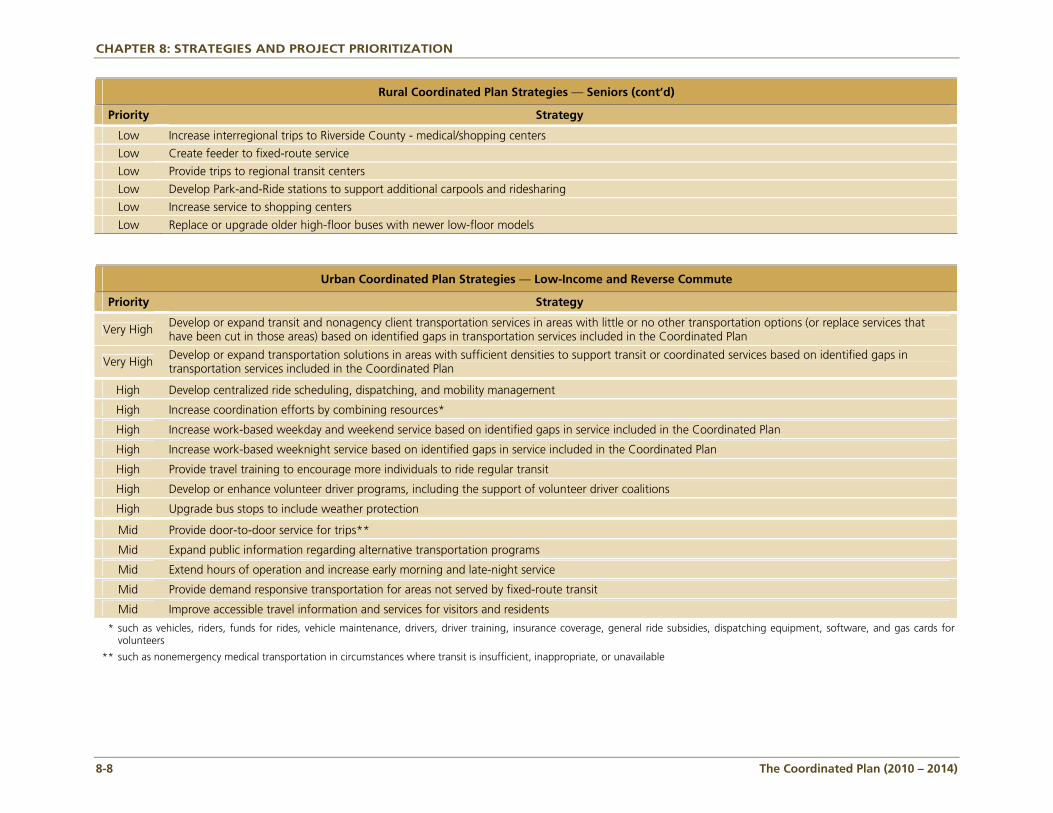
CHAPTER 8: STRATEGIES AND PROJECT PRIORITIZATION
8-8 The Coordinated Plan (2010 – 2014)
Rural Coordinated Plan Strategies — Seniors (cont’d)
Priority Strategy
Low Increase interregional trips to Riverside County - medical/shopping centers
Low Create feeder to fixed-route service
Low Provide trips to regional transit centers
Low Develop Park-and-Ride stations to support additional carpools and ridesharing
Low Increase service to shopping centers
Low Replace or upgrade older high-floor buses with newer low-floor models
Urban Coordinated Plan Strategies — Low-Income and Reverse Commute
Priority Strategy
Very High Develop or expand transit and nonagency client transportation services in areas with little or no other transportation options (or replace services that have been cut in those areas) based on identified gaps in transportation services included in the Coordinated Plan
Very High Develop or expand transportation solutions in areas with sufficient densities to support transit or coordinated services based on identified gaps in transportation services included in the Coordinated Plan
High Develop centralized ride scheduling, dispatching, and mobility management
High Increase coordination efforts by combining resources*
High Increase work-based weekday and weekend service based on identified gaps in service included in the Coordinated Plan
High Increase work-based weeknight service based on identified gaps in service included in the Coordinated Plan
High Provide travel training to encourage more individuals to ride regular transit
High Develop or enhance volunteer driver programs, including the support of volunteer driver coalitions
High Upgrade bus stops to include weather protection
Mid Provide door-to-door service for trips**
Mid Expand public information regarding alternative transportation programs
Mid Extend hours of operation and increase early morning and late-night service
Mid Provide demand responsive transportation for areas not served by fixed-route transit
Mid Improve accessible travel information and services for visitors and residents
* such as vehicles, riders, funds for rides, vehicle maintenance, drivers, driver training, insurance coverage, general ride subsidies, dispatching equipment, software, and gas cards for volunteers
** such as nonemergency medical transportation in circumstances where transit is insufficient, inappropriate, or unavailable
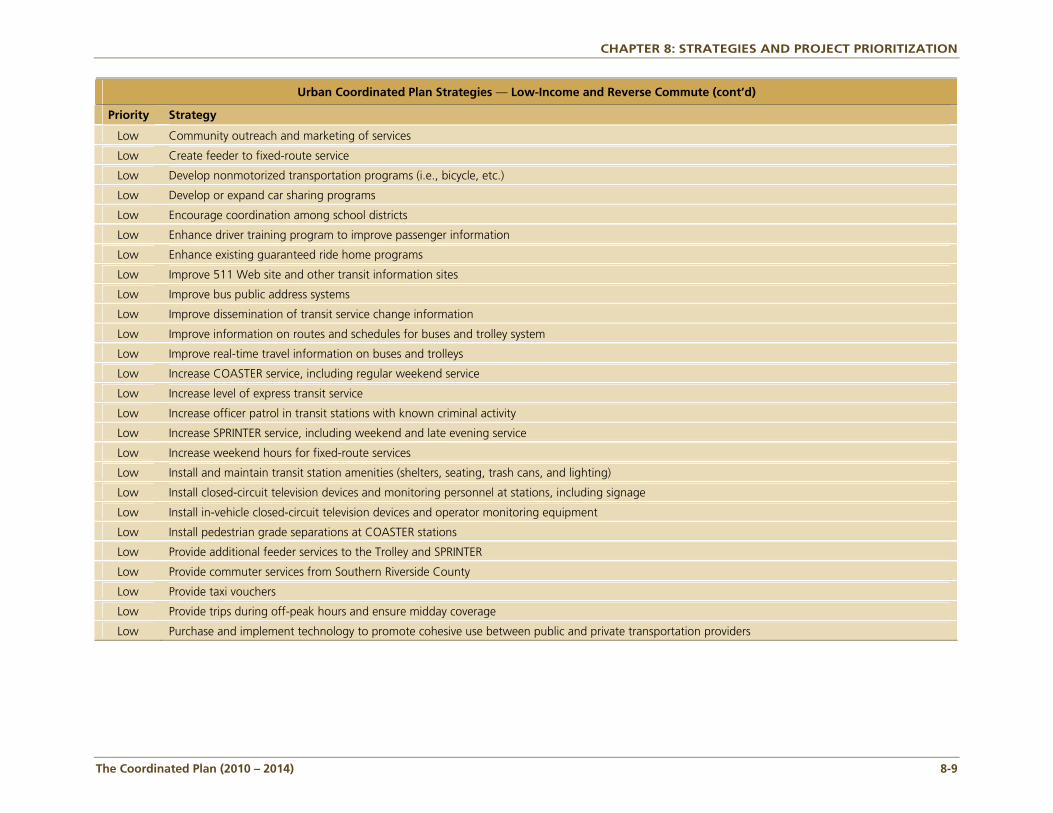
CHAPTER 8: STRATEGIES AND PROJECT PRIORITIZATION
The Coordinated Plan (2010 – 2014) 8-9
Urban Coordinated Plan Strategies — Low-Income and Reverse Commute (cont’d)
Priority Strategy
Low Community outreach and marketing of services
Low Create feeder to fixed-route service
Low Develop nonmotorized transportation programs (i.e., bicycle, etc.)
Low Develop or expand car sharing programs
Low Encourage coordination among school districts
Low Enhance driver training program to improve passenger information
Low Enhance existing guaranteed ride home programs
Low Improve 511 Web site and other transit information sites
Low Improve bus public address systems
Low Improve dissemination of transit service change information
Low Improve information on routes and schedules for buses and trolley system
Low Improve real-time travel information on buses and trolleys
Low Increase COASTER service, including regular weekend service
Low Increase level of express transit service
Low Increase officer patrol in transit stations with known criminal activity
Low Increase SPRINTER service, including weekend and late evening service
Low Increase weekend hours for fixed-route services
Low Install and maintain transit station amenities (shelters, seating, trash cans, and lighting)
Low Install closed-circuit television devices and monitoring personnel at stations, including signage
Low Install in-vehicle closed-circuit television devices and operator monitoring equipment
Low Install pedestrian grade separations at COASTER stations
Low Provide additional feeder services to the Trolley and SPRINTER
Low Provide commuter services from Southern Riverside County
Low Provide taxi vouchers
Low Provide trips during off-peak hours and ensure midday coverage
Low Purchase and implement technology to promote cohesive use between public and private transportation providers
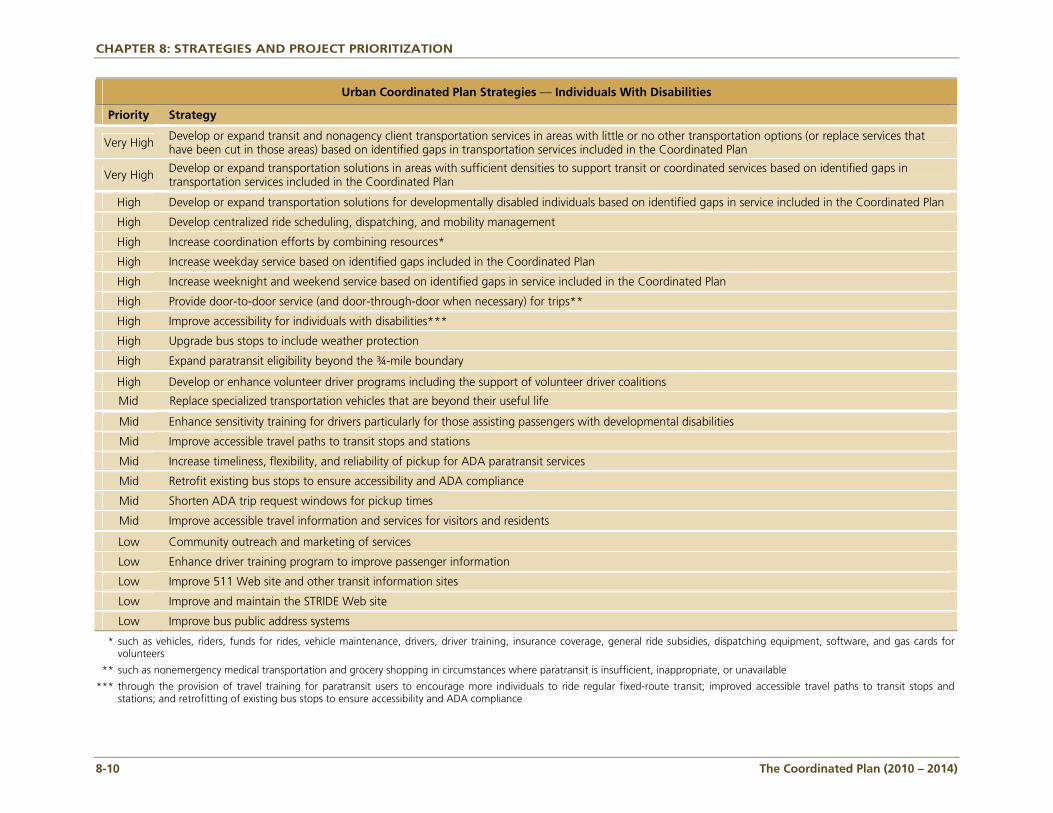
CHAPTER 8: STRATEGIES AND PROJECT PRIORITIZATION
8-10 The Coordinated Plan (2010 – 2014)
Urban Coordinated Plan Strategies — Individuals With Disabilities
Priority Strategy
Very High Develop or expand transit and nonagency client transportation services in areas with little or no other transportation options (or replace services that have been cut in those areas) based on identified gaps in transportation services included in the Coordinated Plan
Very High Develop or expand transportation solutions in areas with sufficient densities to support transit or coordinated services based on identified gaps in transportation services included in the Coordinated Plan
High Develop or expand transportation solutions for developmentally disabled individuals based on identified gaps in service included in the Coordinated Plan
High Develop centralized ride scheduling, dispatching, and mobility management
High Increase coordination efforts by combining resources*
High Increase weekday service based on identified gaps included in the Coordinated Plan
High Increase weeknight and weekend service based on identified gaps in service included in the Coordinated Plan
High Provide door-to-door service (and door-through-door when necessary) for trips**
High Improve accessibility for individuals with disabilities***
High Upgrade bus stops to include weather protection
High Expand paratransit eligibility beyond the ¾-mile boundary
High Develop or enhance volunteer driver programs including the support of volunteer driver coalitions
Mid Replace specialized transportation vehicles that are beyond their useful life
Mid Enhance sensitivity training for drivers particularly for those assisting passengers with developmental disabilities
Mid Improve accessible travel paths to transit stops and stations
Mid Increase timeliness, flexibility, and reliability of pickup for ADA paratransit services
Mid Retrofit existing bus stops to ensure accessibility and ADA compliance
Mid Shorten ADA trip request windows for pickup times
Mid Improve accessible travel information and services for visitors and residents
Low Community outreach and marketing of services
Low Enhance driver training program to improve passenger information
Low Improve 511 Web site and other transit information sites
Low Improve and maintain the STRIDE Web site
Low Improve bus public address systems
* such as vehicles, riders, funds for rides, vehicle maintenance, drivers, driver training, insurance coverage, general ride subsidies, dispatching equipment, software, and gas cards for volunteers
** such as nonemergency medical transportation and grocery shopping in circumstances where paratransit is insufficient, inappropriate, or unavailable
*** through the provision of travel training for paratransit users to encourage more individuals to ride regular fixed-route transit; improved accessible travel paths to transit stops and stations; and retrofitting of existing bus stops to ensure accessibility and ADA compliance
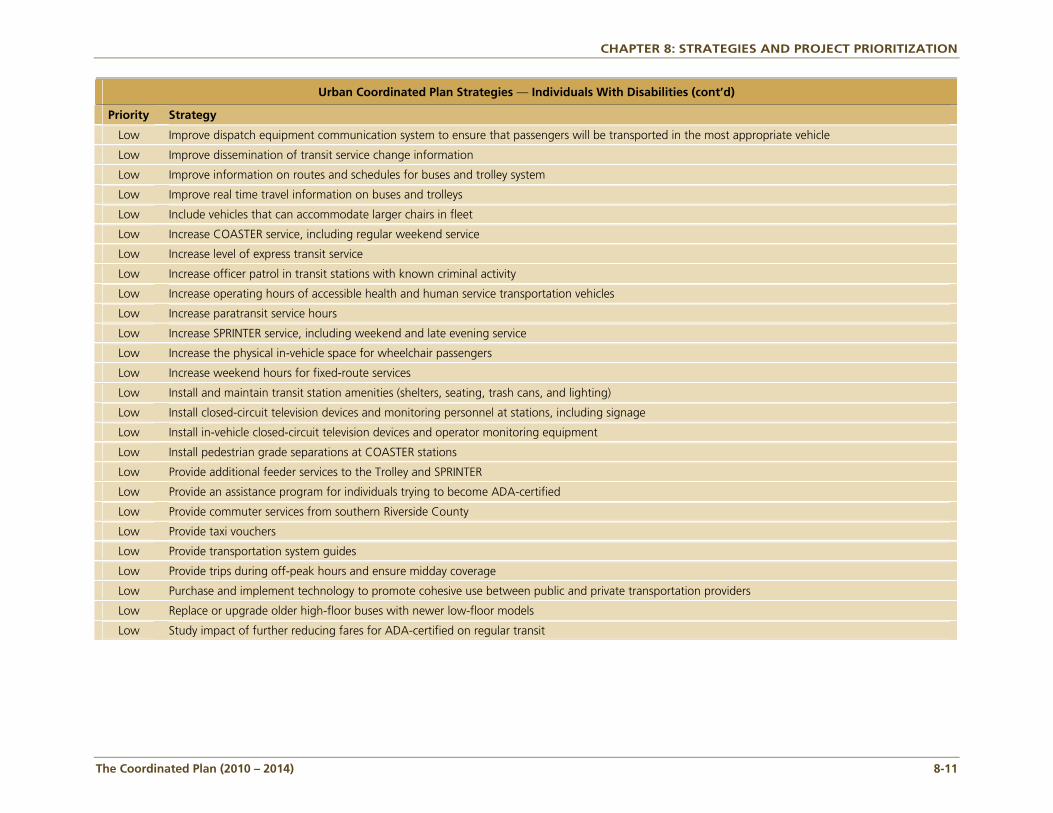
CHAPTER 8: STRATEGIES AND PROJECT PRIORITIZATION
The Coordinated Plan (2010 – 2014) 8-11
Urban Coordinated Plan Strategies — Individuals With Disabilities (cont’d)
Priority Strategy
Low Improve dispatch equipment communication system to ensure that passengers will be transported in the most appropriate vehicle
Low Improve dissemination of transit service change information
Low Improve information on routes and schedules for buses and trolley system
Low Improve real time travel information on buses and trolleys
Low Include vehicles that can accommodate larger chairs in fleet
Low Increase COASTER service, including regular weekend service
Low Increase level of express transit service
Low Increase officer patrol in transit stations with known criminal activity
Low Increase operating hours of accessible health and human service transportation vehicles
Low Increase paratransit service hours
Low Increase SPRINTER service, including weekend and late evening service
Low Increase the physical in-vehicle space for wheelchair passengers
Low Increase weekend hours for fixed-route services
Low Install and maintain transit station amenities (shelters, seating, trash cans, and lighting)
Low Install closed-circuit television devices and monitoring personnel at stations, including signage
Low Install in-vehicle closed-circuit television devices and operator monitoring equipment
Low Install pedestrian grade separations at COASTER stations
Low Provide additional feeder services to the Trolley and SPRINTER
Low Provide an assistance program for individuals trying to become ADA-certified
Low Provide commuter services from southern Riverside County
Low Provide taxi vouchers
Low Provide transportation system guides
Low Provide trips during off-peak hours and ensure midday coverage
Low Purchase and implement technology to promote cohesive use between public and private transportation providers
Low Replace or upgrade older high-floor buses with newer low-floor models
Low Study impact of further reducing fares for ADA-certified on regular transit
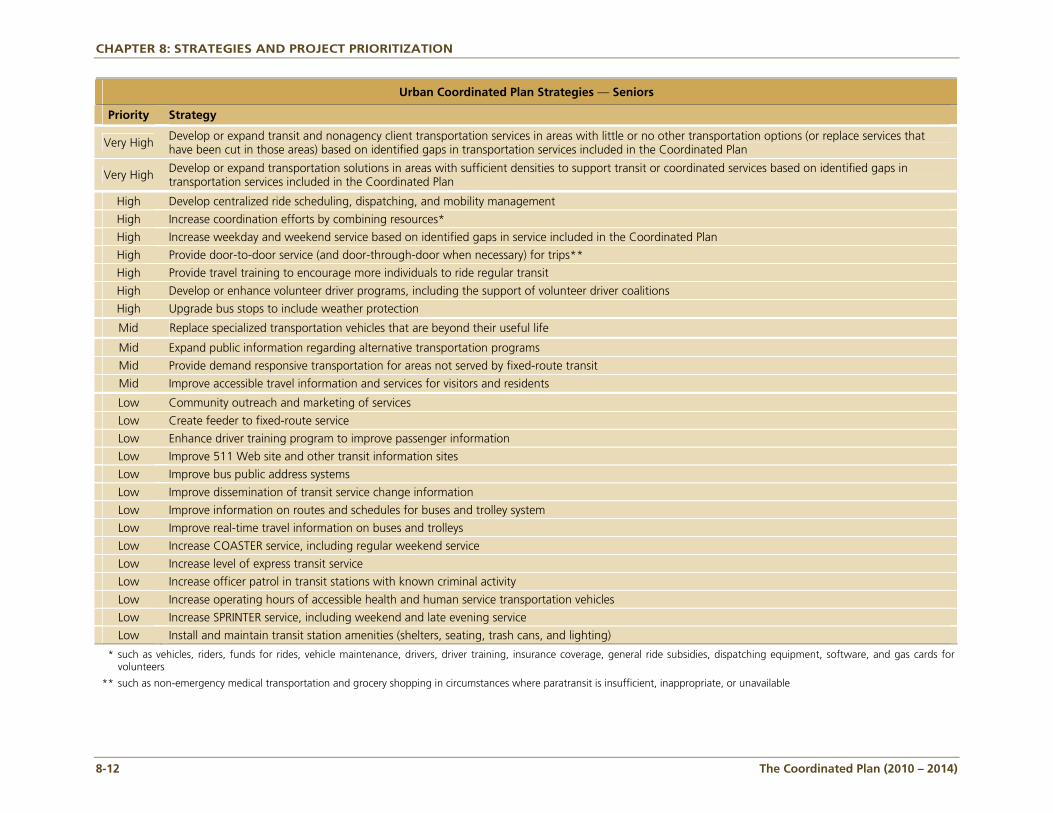
CHAPTER 8: STRATEGIES AND PROJECT PRIORITIZATION
8-12 The Coordinated Plan (2010 – 2014)
Urban Coordinated Plan Strategies — Seniors
Priority Strategy
Very High Develop or expand transit and nonagency client transportation services in areas with little or no other transportation options (or replace services that have been cut in those areas) based on identified gaps in transportation services included in the Coordinated Plan
Very High Develop or expand transportation solutions in areas with sufficient densities to support transit or coordinated services based on identified gaps in transportation services included in the Coordinated Plan
High Develop centralized ride scheduling, dispatching, and mobility management
High Increase coordination efforts by combining resources*
High Increase weekday and weekend service based on identified gaps in service included in the Coordinated Plan
High Provide door-to-door service (and door-through-door when necessary) for trips**
High Provide travel training to encourage more individuals to ride regular transit
High Develop or enhance volunteer driver programs, including the support of volunteer driver coalitions
High Upgrade bus stops to include weather protection
Mid Replace specialized transportation vehicles that are beyond their useful life
Mid Expand public information regarding alternative transportation programs
Mid Provide demand responsive transportation for areas not served by fixed-route transit
Mid Improve accessible travel information and services for visitors and residents
Low Community outreach and marketing of services
Low Create feeder to fixed-route service
Low Enhance driver training program to improve passenger information
Low Improve 511 Web site and other transit information sites
Low Improve bus public address systems
Low Improve dissemination of transit service change information
Low Improve information on routes and schedules for buses and trolley system
Low Improve real-time travel information on buses and trolleys
Low Increase COASTER service, including regular weekend service
Low Increase level of express transit service
Low Increase officer patrol in transit stations with known criminal activity
Low Increase operating hours of accessible health and human service transportation vehicles
Low Increase SPRINTER service, including weekend and late evening service
Low Install and maintain transit station amenities (shelters, seating, trash cans, and lighting)
* such as vehicles, riders, funds for rides, vehicle maintenance, drivers, driver training, insurance coverage, general ride subsidies, dispatching equipment, software, and gas cards for volunteers
** such as non-emergency medical transportation and grocery shopping in circumstances where paratransit is insufficient, inappropriate, or unavailable
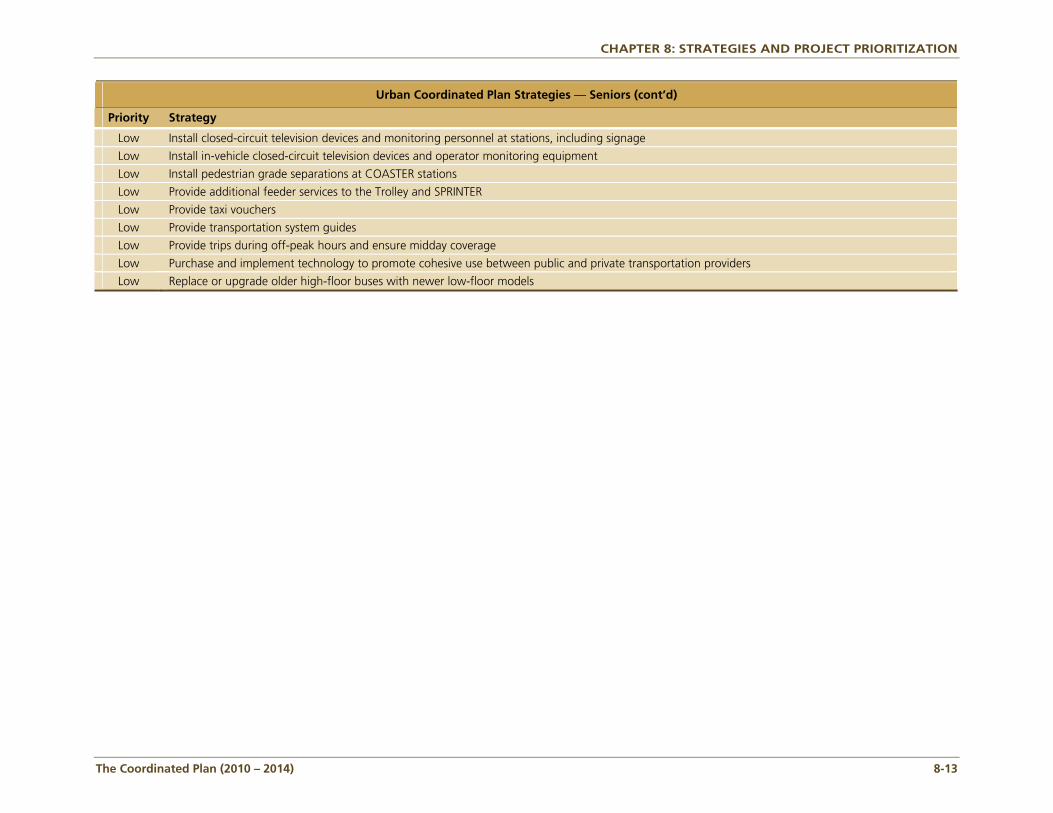
CHAPTER 8: STRATEGIES AND PROJECT PRIORITIZATION
The Coordinated Plan (2010 – 2014) 8-13
Urban Coordinated Plan Strategies — Seniors (cont’d)
Priority Strategy
Low Install closed-circuit television devices and monitoring personnel at stations, including signage
Low Install in-vehicle closed-circuit television devices and operator monitoring equipment
Low Install pedestrian grade separations at COASTER stations
Low Provide additional feeder services to the Trolley and SPRINTER
Low Provide taxi vouchers
Low Provide transportation system guides
Low Provide trips during off-peak hours and ensure midday coverage
Low Purchase and implement technology to promote cohesive use between public and private transportation providers
Low Replace or upgrade older high-floor buses with newer low-floor models

Chapter 9
Th
e
Co
ord
inate
d P
lan
Funding

The Coordinated Plan (2010 – 2014) 9-1
CHAPTER 9: FUNDING
Public transit and human service transportation in San Diego is funded from a variety of public and private sources. This chapter only addresses services that are in whole or partly funded with money from public transportation funding programs, which include federal, state, and local sources.
9.1 Federal Congress authorizes a multiyear federal surface transportation measure approximately every six years along with the other surface transportation programs under the Department of Transportation. The most recent authorization entitled, Safe, Accountable, Flexible, Efficient Transportation Equity Act: A Legacy for Users (SAFETEA-LU) authorized federal programs for FY 2005 through FY 2009. Based on annual levels established in the authorizing legislation, Congress then appropriates funds for FTA programs. Although this bill expired in 2009, a continuing resolution was passed in 2010, allowing Congress to apportion transportation funding at the previous year’s funding levels through 2010. SAFETEA-LU continues many of the programs created under the two previous transportation bills (ISTEA and TEA-21). For transit, the Federal Transit Administration (FTA) administers these programs, with some programs allocated under formula provisions, while others are apportioned on a discretionary basis. The different federal transit funding programs are described below.
FTA Section 5307 (Urbanized Area Formula Program) The Urbanized Area Formula Program makes federal resources available to urbanized areas for transit capital and operating assistance and for transportation-related planning. An urbanized area is an incorporated area with a population of 50,000 or more that is designated as such by the Census Bureau. Eligible activities include planning, engineering, design, and evaluation of transit projects and other technical transportation-related studies, capital investments in bus and bus-related activities, and capital investments in new and existing fixed guideway systems. For urbanized areas with populations less than 200,000, operating assistance is an eligible expense. The urbanized area of San Diego County is shown in Figure 9.1. Because the San Diego urbanized area has a population larger than 200,000, the Section 5307 program does not provide assistance for operating costs such as operator salaries and overhead, but based on the need to maintain federally funded assets, this program enables transit agencies to use their Section 5307 apportionments to pay the cost of maintaining those assets. The provision, called preventive maintenance, allows the transit operators to recover up to 80 percent of their total maintenance costs from this source. This provision is applicable to all modes; however, use of these funds for this purpose is likely to be at the expense of funding ongoing capital needs, such as bus and other equipment replacements.
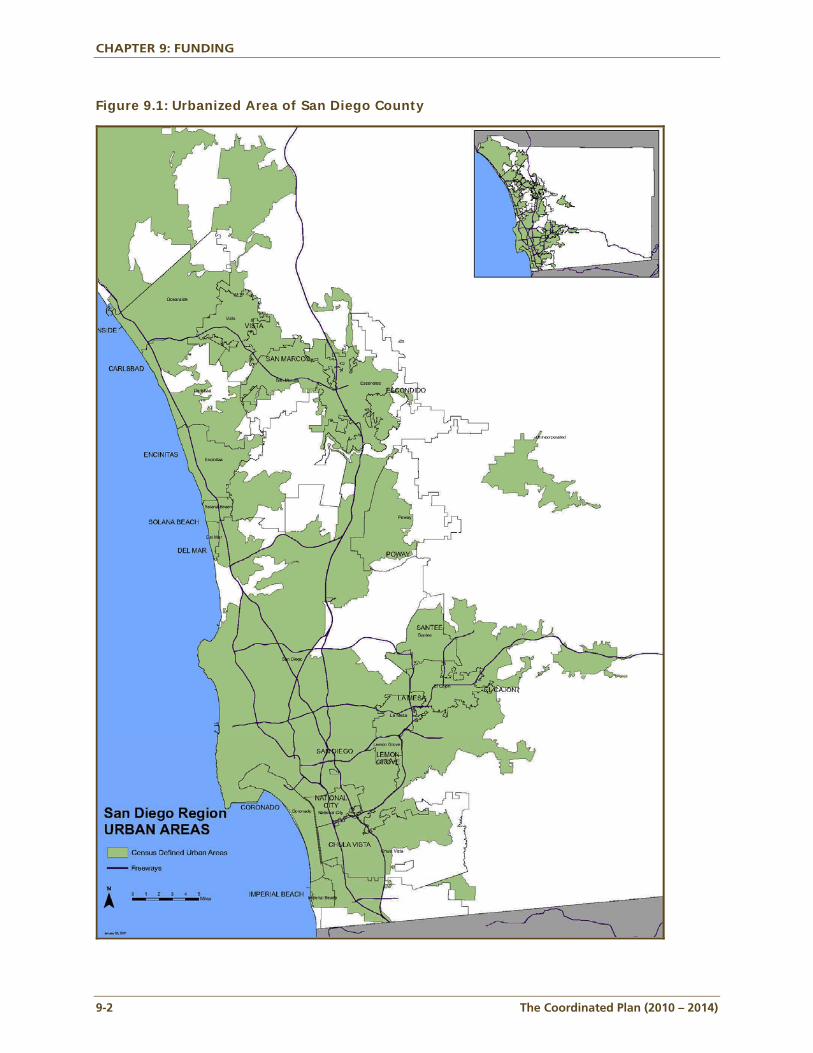
CHAPTER 9: FUNDING
9-2 The Coordinated Plan (2010 – 2014)
Figure 9.1: Urbanized Area of San Diego County
CHAPTER 9: FUNDING
The Coordinated Plan (2010 – 2014) 9-3
Two other special provisions under Section 5307 may be employed to direct these capital funds toward operations: the Capital Cost of Contracting and Americans with Disabilities Act (ADA) Services provisions. Capital Costs of Contracting allows the transit agencies to use the Section 5307 funds to pay a portion of costs of operating contracts based on the amount of capital being provided by the contractor. The proportions vary based on the type of contract and whether the contractor provides vehicles. The transit agencies may pay up to 80 percent of the ADA operating contracts with Section 5307 funds instead of using those funds for ongoing capital needs. Urbanized Area Formula Program funds appropriated by Congress are apportioned annually by the FTA. Funds apportioned by the FTA under the Urbanized Area Formula Program remain available to the recipient for four fiscal years—the year of the apportionment, plus three additional years. SANDAG is the designated recipient of the 5307 funds and apportions these funds to the transit agencies after a small portion, currently about $2.5 million, is set aside for SANDAG planning purposes. SANDAG policy has been to allocate 70 percent of the remaining funds to Metropolitan Transit System (MTS) and 30 percent to the North County Transit District (NCTD). 5307 funding for prior years and projected years are included in Appendix B, Table B.11.
FTA Section 5309 (Fixed Guideway/Discretionary) This federal formula program is available to fixed guideway agencies with systems in operation for at least seven years. The term “fixed guideway” refers to any transit service that uses exclusive or controlled rights-of-way or rails, entirely or in part. The term includes heavy rail, commuter rail, light rail, trolleybus, aerial tramway, inclined plane, cable car, automated guideway transit, ferryboats, that portion of motor bus service operated on exclusive or controlled rights-of-way, and high occupancy vehicle (HOV) lanes. Called 5309 Rail Mod, these program funds must be used only for fixed guideway projects, including preventive maintenance. These funds require a nonfederal match of 20 percent to the federal 80-percent contribution. Like Section 5307 funds, Fixed Guideway Modernization funds are authorized under SAFETEA-LU and are appropriated annually by Congress. FTA apportions these funds to the regions based on a complicated tiered formula using factors of revenue-miles and route-miles, and SANDAG apportions these funds directly to MTS (70%) and NCTD (30%). Section 5309 funding for prior and projected years are included in Appendix B, Table B.11.
FTA Section 5310 Formula Funds for Service to Elderly Individuals and Individuals with Disabilities
The goal of the Section 5310 program is to improve mobility for seniors and individuals with disabilities throughout the country. These funds can be used for capital purposes only such as vehicle replacement, or the procurement of radios or computers to support transportation operations. Funding is allocated directly to the states by a formula. The State of California, through the actions of the California Department of Transportation (Caltrans) and the California Transportation Commission (CTC), distributes the funds on a competitive basis. The primary recipients of these funds are nonprofit agencies that provide transportation for seniors and persons with disabilities; however, public transit agencies may apply if they can show that no nonprofits are readily available to provide service for which the capital funds are requested.
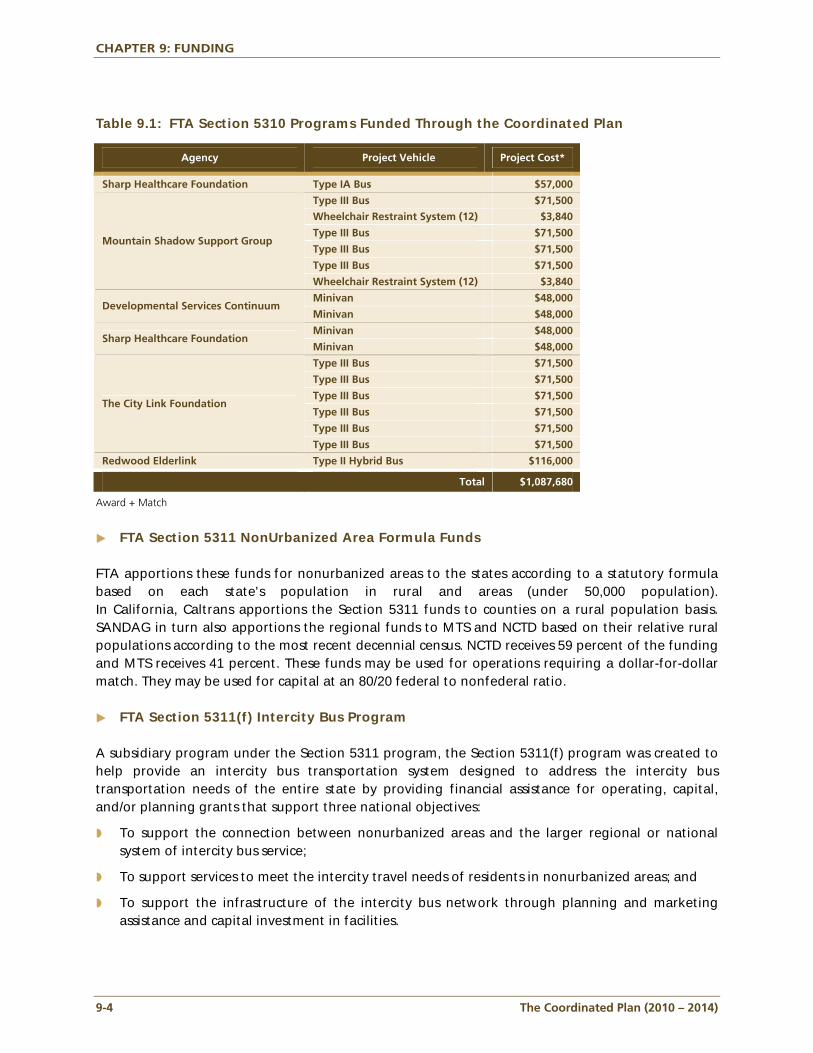
CHAPTER 9: FUNDING
9-4 The Coordinated Plan (2010 – 2014)
Table 9.1: FTA Section 5310 Programs Funded Through the Coordinated Plan
Agency Project Vehicle Project Cost* Sharp Healthcare Foundation Type IA Bus $57,000
Type III Bus $71,500
Wheelchair Restraint System (12) $3,840
Type III Bus $71,500
Type III Bus $71,500
Type III Bus $71,500
Mountain Shadow Support Group
Wheelchair Restraint System (12) $3,840
Minivan $48,000 Developmental Services Continuum
Minivan $48,000
Minivan $48,000 Sharp Healthcare Foundation
Minivan $48,000
Type III Bus $71,500
Type III Bus $71,500
Type III Bus $71,500
Type III Bus $71,500
Type III Bus $71,500
The City Link Foundation
Type III Bus $71,500
Redwood Elderlink Type II Hybrid Bus $116,000 Total $1,087,680
Award + Match
FTA Section 5311 NonUrbanized Area Formula Funds
FTA apportions these funds for nonurbanized areas to the states according to a statutory formula based on each state's population in rural and areas (under 50,000 population). In California, Caltrans apportions the Section 5311 funds to counties on a rural population basis. SANDAG in turn also apportions the regional funds to MTS and NCTD based on their relative rural populations according to the most recent decennial census. NCTD receives 59 percent of the funding and MTS receives 41 percent. These funds may be used for operations requiring a dollar-for-dollar match. They may be used for capital at an 80/20 federal to nonfederal ratio.
FTA Section 5311(f) Intercity Bus Program A subsidiary program under the Section 5311 program, the Section 5311(f) program was created to help provide an intercity bus transportation system designed to address the intercity bus transportation needs of the entire state by providing financial assistance for operating, capital, and/or planning grants that support three national objectives:
To support the connection between nonurbanized areas and the larger regional or national system of intercity bus service;
To support services to meet the intercity travel needs of residents in nonurbanized areas; and
To support the infrastructure of the intercity bus network through planning and marketing assistance and capital investment in facilities.
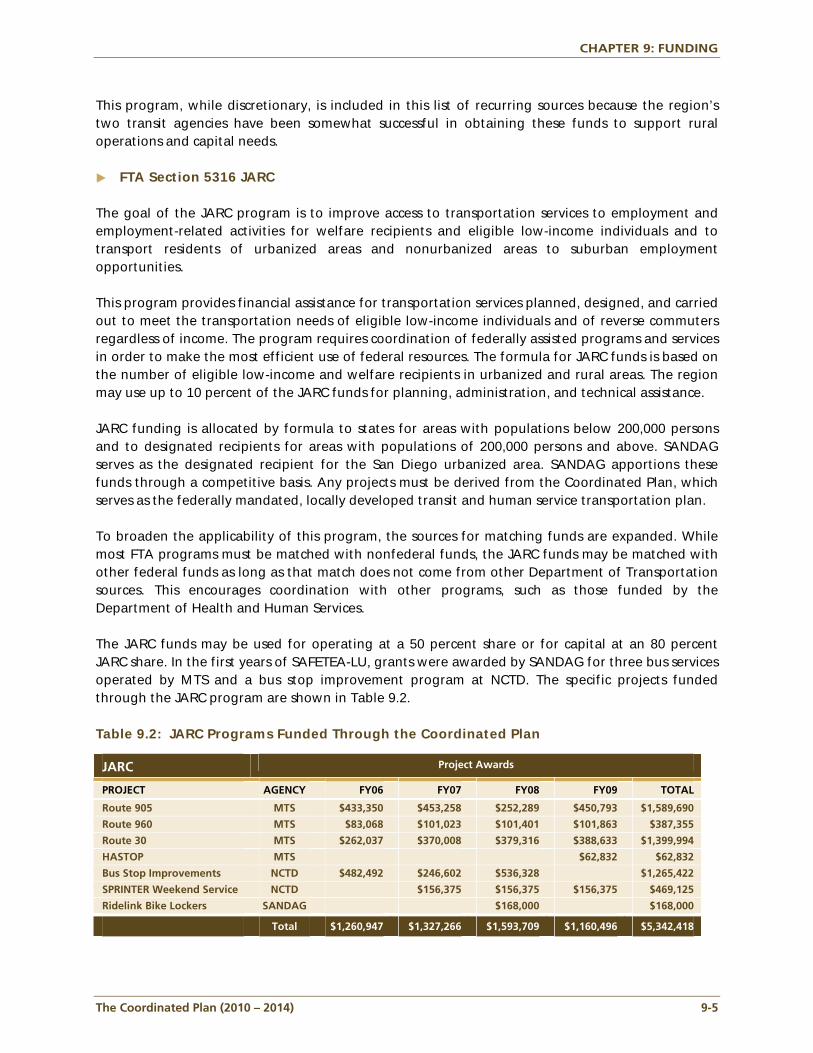
CHAPTER 9: FUNDING
The Coordinated Plan (2010 – 2014) 9-5
This program, while discretionary, is included in this list of recurring sources because the region’s two transit agencies have been somewhat successful in obtaining these funds to support rural operations and capital needs.
FTA Section 5316 JARC The goal of the JARC program is to improve access to transportation services to employment and employment-related activities for welfare recipients and eligible low-income individuals and to transport residents of urbanized areas and nonurbanized areas to suburban employment opportunities. This program provides financial assistance for transportation services planned, designed, and carried out to meet the transportation needs of eligible low-income individuals and of reverse commuters regardless of income. The program requires coordination of federally assisted programs and services in order to make the most efficient use of federal resources. The formula for JARC funds is based on the number of eligible low-income and welfare recipients in urbanized and rural areas. The region may use up to 10 percent of the JARC funds for planning, administration, and technical assistance. JARC funding is allocated by formula to states for areas with populations below 200,000 persons and to designated recipients for areas with populations of 200,000 persons and above. SANDAG serves as the designated recipient for the San Diego urbanized area. SANDAG apportions these funds through a competitive basis. Any projects must be derived from the Coordinated Plan, which serves as the federally mandated, locally developed transit and human service transportation plan. To broaden the applicability of this program, the sources for matching funds are expanded. While most FTA programs must be matched with nonfederal funds, the JARC funds may be matched with other federal funds as long as that match does not come from other Department of Transportation sources. This encourages coordination with other programs, such as those funded by the Department of Health and Human Services. The JARC funds may be used for operating at a 50 percent share or for capital at an 80 percent JARC share. In the first years of SAFETEA-LU, grants were awarded by SANDAG for three bus services operated by MTS and a bus stop improvement program at NCTD. The specific projects funded through the JARC program are shown in Table 9.2. Table 9.2: JARC Programs Funded Through the Coordinated Plan
JARC Project Awards PROJECT AGENCY FY06 FY07 FY08 FY09 TOTAL
Route 905 MTS $433,350 $453,258 $252,289 $450,793 $1,589,690
Route 960 MTS $83,068 $101,023 $101,401 $101,863 $387,355
Route 30 MTS $262,037 $370,008 $379,316 $388,633 $1,399,994
HASTOP MTS $62,832 $62,832
Bus Stop Improvements NCTD $482,492 $246,602 $536,328 $1,265,422
SPRINTER Weekend Service NCTD $156,375 $156,375 $156,375 $469,125
Ridelink Bike Lockers SANDAG $168,000 $168,000 Total $1,260,947 $1,327,266 $1,593,709 $1,160,496 $5,342,418
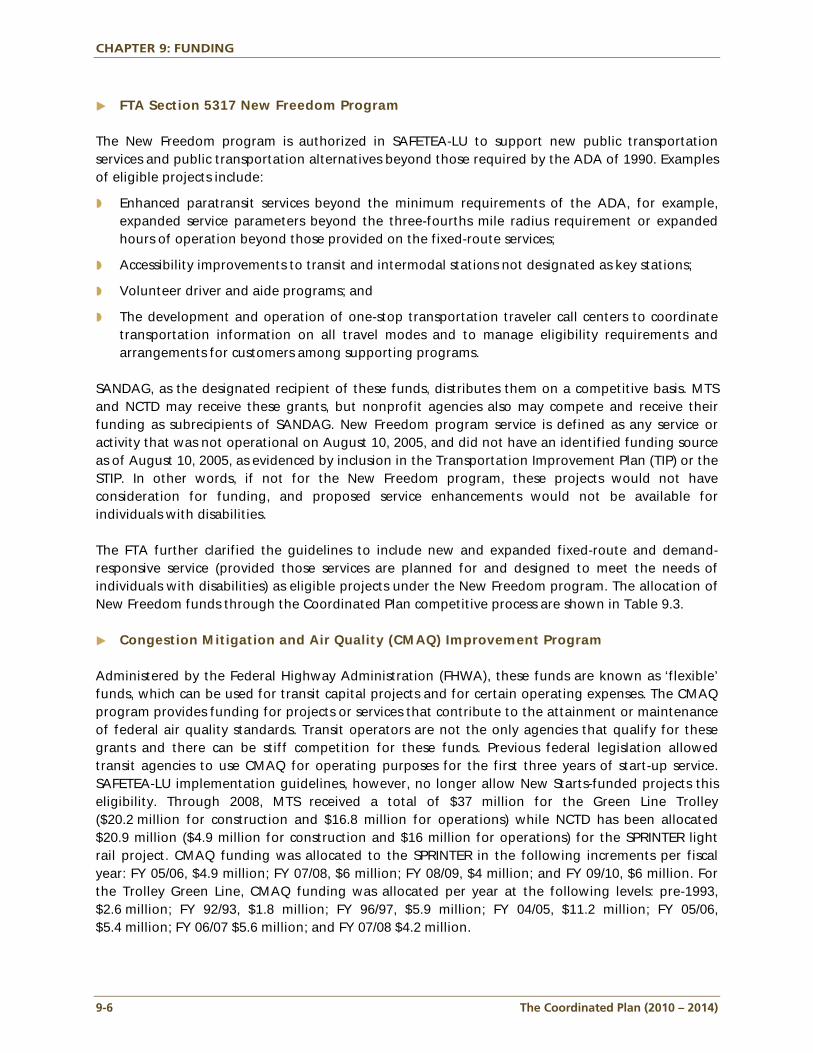
CHAPTER 9: FUNDING
9-6 The Coordinated Plan (2010 – 2014)
FTA Section 5317 New Freedom Program The New Freedom program is authorized in SAFETEA-LU to support new public transportation services and public transportation alternatives beyond those required by the ADA of 1990. Examples of eligible projects include:
Enhanced paratransit services beyond the minimum requirements of the ADA, for example, expanded service parameters beyond the three-fourths mile radius requirement or expanded hours of operation beyond those provided on the fixed-route services;
Accessibility improvements to transit and intermodal stations not designated as key stations;
Volunteer driver and aide programs; and
The development and operation of one-stop transportation traveler call centers to coordinate transportation information on all travel modes and to manage eligibility requirements and arrangements for customers among supporting programs.
SANDAG, as the designated recipient of these funds, distributes them on a competitive basis. MTS and NCTD may receive these grants, but nonprofit agencies also may compete and receive their funding as subrecipients of SANDAG. New Freedom program service is defined as any service or activity that was not operational on August 10, 2005, and did not have an identified funding source as of August 10, 2005, as evidenced by inclusion in the Transportation Improvement Plan (TIP) or the STIP. In other words, if not for the New Freedom program, these projects would not have consideration for funding, and proposed service enhancements would not be available for individuals with disabilities. The FTA further clarified the guidelines to include new and expanded fixed-route and demand-responsive service (provided those services are planned for and designed to meet the needs of individuals with disabilities) as eligible projects under the New Freedom program. The allocation of New Freedom funds through the Coordinated Plan competitive process are shown in Table 9.3.
Congestion Mitigation and Air Quality (CMAQ) Improvement Program Administered by the Federal Highway Administration (FHWA), these funds are known as ‘flexible’ funds, which can be used for transit capital projects and for certain operating expenses. The CMAQ program provides funding for projects or services that contribute to the attainment or maintenance of federal air quality standards. Transit operators are not the only agencies that qualify for these grants and there can be stiff competition for these funds. Previous federal legislation allowed transit agencies to use CMAQ for operating purposes for the first three years of start-up service. SAFETEA-LU implementation guidelines, however, no longer allow New Starts-funded projects this eligibility. Through 2008, MTS received a total of $37 million for the Green Line Trolley ($20.2 million for construction and $16.8 million for operations) while NCTD has been allocated $20.9 million ($4.9 million for construction and $16 million for operations) for the SPRINTER light rail project. CMAQ funding was allocated to the SPRINTER in the following increments per fiscal year: FY 05/06, $4.9 million; FY 07/08, $6 million; FY 08/09, $4 million; and FY 09/10, $6 million. For the Trolley Green Line, CMAQ funding was allocated per year at the following levels: pre-1993, $2.6 million; FY 92/93, $1.8 million; FY 96/97, $5.9 million; FY 04/05, $11.2 million; FY 05/06, $5.4 million; FY 06/07 $5.6 million; and FY 07/08 $4.2 million.
CHAPTER 9: FUNDING
The Coordinated Plan (2010 – 2014) 9-7
Table 9.3: New Freedom Programs Funded Through the Coordinated Plan
NEW FREEDOM Project Awards PROJECT AGENCY FY06 FY07 FY08 FY09 TOTAL
Volunteer Driver Program
La Mesa $50,000 $76,500 $76,500 $76,500 $279,500
Mobility/Travel Training Program
NCTD $34,412 $44,242 $161,897 $172,433 $412,985
Mobility Management
FACT $107,007 $557,760 $491,195 $287,521 $1,443,483
Volunteer Driver Program
Oceanside $16,500 $16,500
Senior Shuttle Program
Oceanside $23,300 $23,300
Senior Activity Van
Senior Community Centers
$51,451 $51,451
Volunteer Driver Program
Jewish Family Services
$41,811 $47,097 $88,908
Purchase Lift Equipped Vehicle
All Congregations Together
$64,000 $64,000
Bus Stop Accessibility
NCTD $70,400 $76,378 $146,778
Purchase Lift Equipped vehicle
SWCCD $40,000 $40,000
Accessible Tourism Trans-portation Information Net
Accessible San Diego
$132,960 $132,960
Total $259,370 $807,613 $887,089 $745,792 $2,699,864
Surface Transportation Program (STP) The STP is primarily designed to support road and highway projects. Despite this, under the flexible funding rules this program can be applied to transit, but there may be strong competition for these funds. In Los Angeles County, the STP funds are traded for FTA Section 5310 operating funds, which are then used to meet some of the costs of providing ADA service.
9.2 State State funding sources generally include motor fuel taxes, special fuel taxes, vehicle registration fees, and driver’s license fees. State funding for transit projects are available through the STIP. In addition to the STIP, the State Transit Assistance (STA) is funded with 50 percent of the Public Transit Account revenues, which is principally derived from sales tax on gasoline and diesel. Vehicle registration fee money also is available as a potential funding source according to Assembly Bill (AB) 2766. The Air Pollution Control District (APCD), however, has not increased the fee from $2 to $6 as allowed by law. A future increase could be implemented to provide additional support for public transit.
CHAPTER 9: FUNDING
9-8 The Coordinated Plan (2010 – 2014)
State Transportation Improvement Program (STIP-RIP/IIP) The STIP includes both the Regional Improvement Program (RIP) and the Interregional Improvement Program (IIP). The RIP is allocated by County based on a formula, while the IIP is allocated based on a competitive process administered by the CTC. SANDAG proposes all projects under the RIP, while Caltrans is responsible for the IIP and proposes those projects in consultation with SANDAG. STIP funds may only be used for capital and not operating expenses. Although major highway projects have been recipients of STIP funds, regional transit projects, such as Mid-Coast and Fare Technology, have received funding as well under the RIP component of the STIP. The projects and funding levels which have received RIP and IIP funds are available at www.catc.ca.gov/programs/stip.htm.
State Transit Assistance Program (STA) and ABs 6 and 9 In February 2009 the STA program (Senate Bill (SB) 620, as amended) was suspended through FY 2013 by the state. Previously, this program was the only ongoing source of state funding for day-to-day transit operations. In March 2010 however, Governor Arnold Schwarzenegger signed two bills (AB X8 6 and AB X8 9) that would appropriate $400 million to local transit operators in FY 2009-10 and FY 2010-11. For the San Diego region, MTS and NCTD would receive about $18.4 million and $5.9 million, respectively. Beginning in FY 2011-12, the increased diesel sales tax will provide about $348 million overall for local transit operations and state transit programs. Assembly Bills 8 6 and 8 9 included the following major provisions:
Repeal the sales tax on gasoline.
Increase the excise tax on gasoline by 17.3 cents and add an annual index that will ensure that the new excise tax will keep pace with the revenues expected from the sales tax on gasoline.
Increase the sales tax on diesel by 1.75 percent and allocate 75 percent to local transit agencies and 25 percent to state transit programs beginning in FY 2011-12. The legislation also reduced the excise tax on diesel from 18 cents to 13.6 cents to maintain revenue neutrality.
Temporarily suspends STA efficiency criteria after January 1, 2010, through FY 2011-2012 to ensure that State Transit Assistance funds can be used for operations.
Traffic Congestion Relief Program (TCRP)
In FY 2001 the Governor of California initiated a new, one-time funding program, TCRP, in an effort to relieve congestion statewide. The CTC oversees the TCRP which is included in the adopted fund estimate; however the status of TCRP-funded projects remains uncertain as the state faces significant budget deficits and competing unmet needs. The 2010 RTIP reflects the TCRP funds in the year of anticipated allocation for the four remaining corridors (Pacific Surfliner, State Route (SR) 94, SR 94/SR 125 Interchange and Interstate (I-)5/Virginia Avenue Re-alignment).The funding levels for each of these projects are included in Table 9.4.
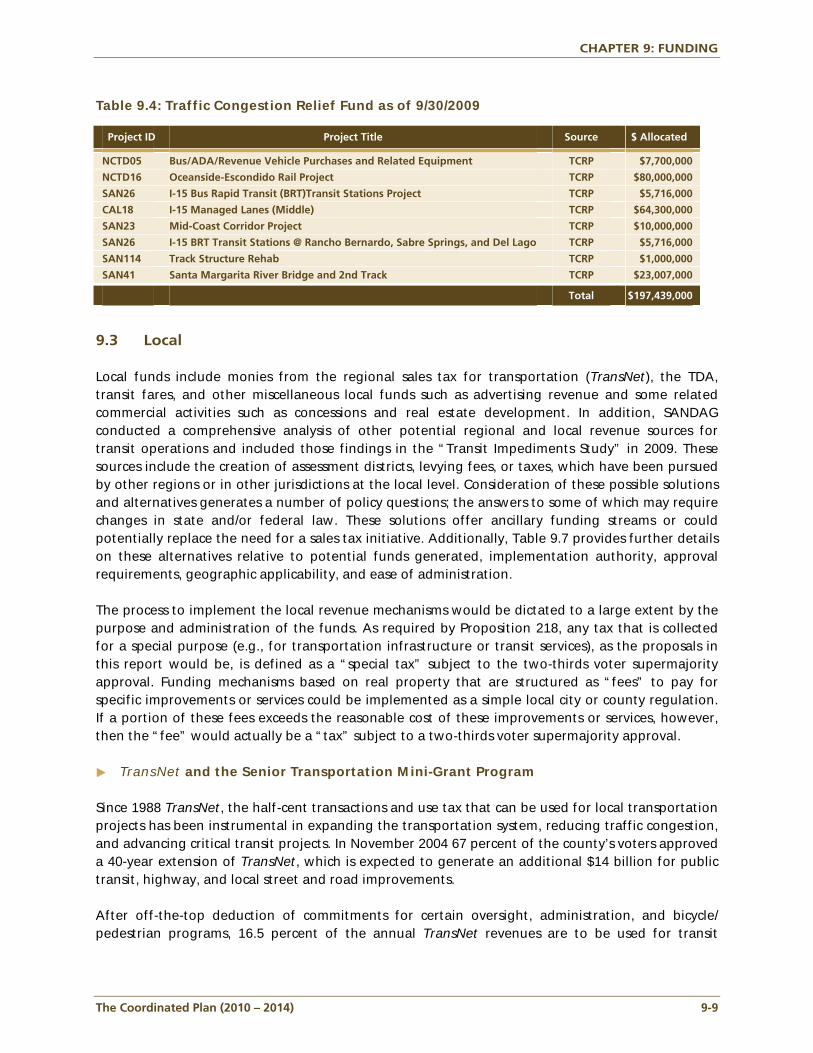
CHAPTER 9: FUNDING
The Coordinated Plan (2010 – 2014) 9-9
Table 9.4: Traffic Congestion Relief Fund as of 9/30/2009
Project ID Project Title Source $ Allocated NCTD05 Bus/ADA/Revenue Vehicle Purchases and Related Equipment TCRP $7,700,000
NCTD16 Oceanside-Escondido Rail Project TCRP $80,000,000
SAN26 I-15 Bus Rapid Transit (BRT)Transit Stations Project TCRP $5,716,000
CAL18 I-15 Managed Lanes (Middle) TCRP $64,300,000
SAN23 Mid-Coast Corridor Project TCRP $10,000,000
SAN26 I-15 BRT Transit Stations @ Rancho Bernardo, Sabre Springs, and Del Lago TCRP $5,716,000
SAN114 Track Structure Rehab TCRP $1,000,000
SAN41 Santa Margarita River Bridge and 2nd Track TCRP $23,007,000 Total $197,439,000
9.3 Local Local funds include monies from the regional sales tax for transportation (TransNet), the TDA, transit fares, and other miscellaneous local funds such as advertising revenue and some related commercial activities such as concessions and real estate development. In addition, SANDAG conducted a comprehensive analysis of other potential regional and local revenue sources for transit operations and included those findings in the “Transit Impediments Study” in 2009. These sources include the creation of assessment districts, levying fees, or taxes, which have been pursued by other regions or in other jurisdictions at the local level. Consideration of these possible solutions and alternatives generates a number of policy questions; the answers to some of which may require changes in state and/or federal law. These solutions offer ancillary funding streams or could potentially replace the need for a sales tax initiative. Additionally, Table 9.7 provides further details on these alternatives relative to potential funds generated, implementation authority, approval requirements, geographic applicability, and ease of administration. The process to implement the local revenue mechanisms would be dictated to a large extent by the purpose and administration of the funds. As required by Proposition 218, any tax that is collected for a special purpose (e.g., for transportation infrastructure or transit services), as the proposals in this report would be, is defined as a “special tax” subject to the two-thirds voter supermajority approval. Funding mechanisms based on real property that are structured as “fees” to pay for specific improvements or services could be implemented as a simple local city or county regulation. If a portion of these fees exceeds the reasonable cost of these improvements or services, however, then the “fee” would actually be a “tax” subject to a two-thirds voter supermajority approval.
TransNet and the Senior Transportation Mini-Grant Program Since 1988 TransNet, the half-cent transactions and use tax that can be used for local transportation projects has been instrumental in expanding the transportation system, reducing traffic congestion, and advancing critical transit projects. In November 2004 67 percent of the county’s voters approved a 40-year extension of TransNet, which is expected to generate an additional $14 billion for public transit, highway, and local street and road improvements. After off-the-top deduction of commitments for certain oversight, administration, and bicycle/ pedestrian programs, 16.5 percent of the annual TransNet revenues are to be used for transit
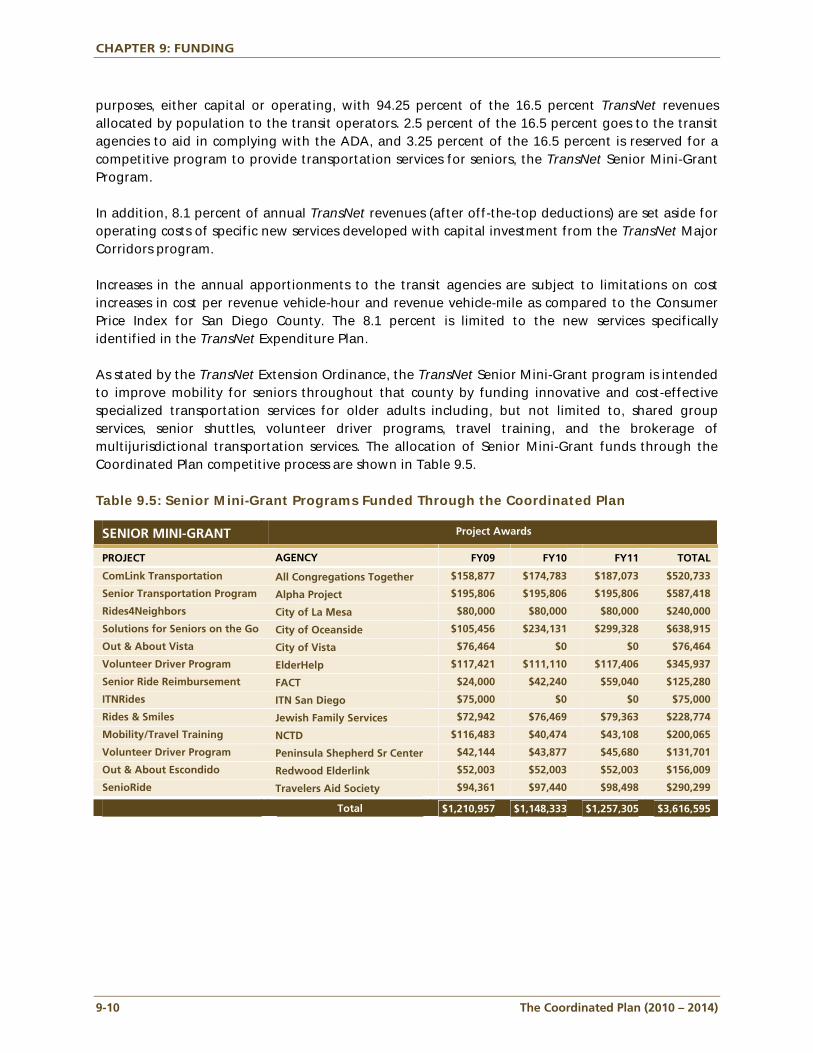
CHAPTER 9: FUNDING
9-10 The Coordinated Plan (2010 – 2014)
purposes, either capital or operating, with 94.25 percent of the 16.5 percent TransNet revenues allocated by population to the transit operators. 2.5 percent of the 16.5 percent goes to the transit agencies to aid in complying with the ADA, and 3.25 percent of the 16.5 percent is reserved for a competitive program to provide transportation services for seniors, the TransNet Senior Mini-Grant Program. In addition, 8.1 percent of annual TransNet revenues (after off-the-top deductions) are set aside for operating costs of specific new services developed with capital investment from the TransNet Major Corridors program. Increases in the annual apportionments to the transit agencies are subject to limitations on cost increases in cost per revenue vehicle-hour and revenue vehicle-mile as compared to the Consumer Price Index for San Diego County. The 8.1 percent is limited to the new services specifically identified in the TransNet Expenditure Plan. As stated by the TransNet Extension Ordinance, the TransNet Senior Mini-Grant program is intended to improve mobility for seniors throughout that county by funding innovative and cost-effective specialized transportation services for older adults including, but not limited to, shared group services, senior shuttles, volunteer driver programs, travel training, and the brokerage of multijurisdictional transportation services. The allocation of Senior Mini-Grant funds through the Coordinated Plan competitive process are shown in Table 9.5. Table 9.5: Senior Mini-Grant Programs Funded Through the Coordinated Plan
SENIOR MINI-GRANT Project Awards PROJECT AGENCY FY09 FY10 FY11 TOTAL
ComLink Transportation All Congregations Together $158,877 $174,783 $187,073 $520,733
Senior Transportation Program Alpha Project $195,806 $195,806 $195,806 $587,418
Rides4Neighbors City of La Mesa $80,000 $80,000 $80,000 $240,000
Solutions for Seniors on the Go City of Oceanside $105,456 $234,131 $299,328 $638,915
Out & About Vista City of Vista $76,464 $0 $0 $76,464
Volunteer Driver Program ElderHelp $117,421 $111,110 $117,406 $345,937
Senior Ride Reimbursement FACT $24,000 $42,240 $59,040 $125,280
ITNRides ITN San Diego $75,000 $0 $0 $75,000
Rides & Smiles Jewish Family Services $72,942 $76,469 $79,363 $228,774
Mobility/Travel Training NCTD $116,483 $40,474 $43,108 $200,065
Volunteer Driver Program Peninsula Shepherd Sr Center $42,144 $43,877 $45,680 $131,701
Out & About Escondido Redwood Elderlink $52,003 $52,003 $52,003 $156,009
SenioRide Travelers Aid Society $94,361 $97,440 $98,498 $290,299 Total $1,210,957 $1,148,333 $1,257,305 $3,616,595
CHAPTER 9: FUNDING
The Coordinated Plan (2010 – 2014) 9-11
Transportation Development Act (TDA) The Mills-Alquist-Deddeh Act (SB 325) was enacted by the California Legislature to improve existing public transportation services and encourage regional transportation coordination. Known as the Transportation Development Act of 1971, this law provides funding to be allocated to transit and nontransit-related purposes that comply with regional transportation plans. The TDA provides two funding sources including the STA described previously and the Local Transportation Fund (LTF), which is derived from a quarter cent of the general sales tax collected statewide. The State Board of Equalization, based on sales tax collected in each county, returns the general sales tax revenues to each county’s LTF. TDA comprises the largest source of subsidy for the San Diego region’s transit operators. TDA funds may be used for a wide variety of transportation programs, including operations, planning and program activities, pedestrian and bicycle facilities, community transit services, public transportation, and bus and rail projects. Providing certain conditions are met, counties with a population under 500,000 also may use the LTF for local streets and roads, construction, and maintenance. The Public Utilities Code Section 99230 requires SANDAG, as the designated transportation planning agency, to annually determine the amounts to be allocated to the TDA claimants of San Diego County. To respond to this requirement, SANDAG adopted Board Policy No. 027. This policy addresses SANDAG’s rules and procedures for administering TDA funds applicable with all local and state regulations. The State Legislature provides up to 5 percent of the annual TDA funds for community transit services (TDA Section 4.5), which include services for those such as persons with disabilities who cannot otherwise use conventional transit services. Eligible applicants are cities, counties, public transit operators, and the Consolidated Transportation Services Agency (CTSA). According to SANDAG Board Policy No. 027, 2 percent of the total available under TDA Section 4.5 will be set aside to support the CTSA, currently designated as Full Access and Coordinated Transportation (FACT). In recent history, this amount has been approximately $100,000 per year. The remaining funds in this section (3 percent) are divided between MTS and the NCTD service areas based on the ratio of the total population in each area to support their respective ADA paratransit services. A summary of the FY 2011 TDA claims is shown in Table 9.6.
Fares Since 2007 SANDAG periodically has increased fares upon request by the transit agencies. In addition, SANDAG has developed a Regional Comprehensive Fare Study, with the original goal of achieving a single, simplified, equitable structure for both operators. With the current financial constraints facing MTS and NCTD, this goal has been amended also to include how best to maximize transit revenues. At the same time, it is recognized that there are clear limitations on raising fares, and there are market forces that need to be carefully considered. It should be emphasized that fare increases are not easily accomplished, and that modification to fare policy will not by itself change the dynamics of the situation facing public transit in this region.
CHAPTER 9: FUNDING
9-12 The Coordinated Plan (2010 – 2014)
Tolls The existing and future managed lane programs on regional freeways including Interstate 15 (I-15), I-805 and I-5 are designed to allow surplus revenues from the roadway to be used to support transit services. To date, MTS has received over $10 million in surplus revenue generated by the existing I-15 toll segment. The annual amount made available for transit does vary based on the tolls generated by the managed lanes and related costs. The SANDAG Board and has committed to providing $500,000 per year for I-15 transit services and the SANDAG Transportation Committee has recommended that the fiscal year 2011 amount be increased to $1 million.
Air Pollution Control District (APCD) Quality Improvement Fund The County of San Diego's APCD funding for the Sorrento Valley COASTER Connection services ended effective June of 2008; however, the APCD continues to provide funding for juror transit passes.
Caltrans Mitigation Funds In special cases where highway construction creates additional congestion, some special funding has been available to transit operators to pay for additional transit services. Temporary mitigation funding may be available for future highway projects.
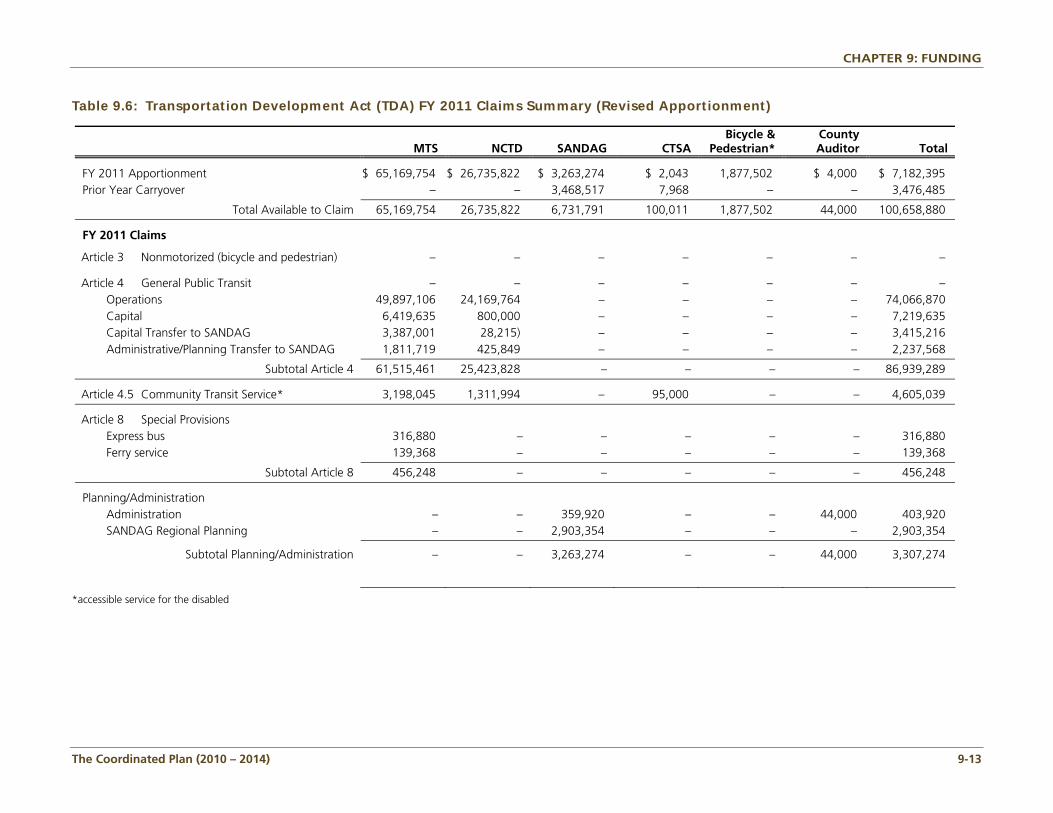
CHAPTER 9: FUNDING
The Coordinated Plan (2010 – 2014) 9-13
Table 9.6: Transportation Development Act (TDA) FY 2011 Claims Summary (Revised Apportionment)
MTS NCTD SANDAG CTSA Bicycle &
Pedestrian* County Auditor Total
FY 2011 Apportionment $ 65,169,754 $ 26,735,822 $ 3,263,274 $ 2,043 1,877,502 $ 4,000 $ 7,182,395 Prior Year Carryover – – 3,468,517 7,968 – – 3,476,485
Total Available to Claim 65,169,754 26,735,822 6,731,791 100,011 1,877,502 44,000 100,658,880 FY 2011 Claims Article 3 Nonmotorized (bicycle and pedestrian) – – – – – – – Article 4 General Public Transit – – – – – – –
Operations 49,897,106 24,169,764 – – – – 74,066,870 Capital 6,419,635 800,000 – – – – 7,219,635 Capital Transfer to SANDAG 3,387,001 28,215) – – – – 3,415,216 Administrative/Planning Transfer to SANDAG 1,811,719 425,849 – – – – 2,237,568
Subtotal Article 4 61,515,461 25,423,828 – – – – 86,939,289 Article 4.5 Community Transit Service* 3,198,045 1,311,994 – 95,000 – – 4,605,039 Article 8 Special Provisions
Express bus 316,880 – – – – – 316,880 Ferry service 139,368 – – – – – 139,368
Subtotal Article 8 456,248 – – – – – 456,248 Planning/Administration
Administration – – 359,920 – – 44,000 403,920 SANDAG Regional Planning – – 2,903,354 – – – 2,903,354
Subtotal Planning/Administration – – 3,263,274 – – 44,000 3,307,274
*accessible service for the disabled
CHAPTER 9: FUNDING
9-14 The Coordinated Plan (2010 – 2014)
Other Potential Regional and Local Revenue Sources Explored in the SANDAG “Transit Impediments Study”
VEHICLE LICENSE FEES
Another funding source is increased revenues through the increase in annual vehicle registration fees. AB 2766 (Richmond, 1990) allows air districts to set a fee of up to $4 for the registration of vehicles within their jurisdictions. The San Diego APCD recently increased this fee from $2 to the maximum $4 as allowed under AB 2766 (effective October 1, 2009). These funds typically are used for projects and programs that reduce emissions, including transit services (the Sorrento Valley COASTER Connection services were funded, in part, by the APCD through FY 2008). With the increase to the full $4, transit projects may be eligible to compete for these funds. Other existing legislation, AB 923 (Firebaugh, 2004), allows the APCD to charge an additional $2 for a total of up to $6. The additional $2 (from $4 to $6) cannot be spent on transit projects and is limited to Carl Moyer projects, agricultural sources, lower-emission school buses, accelerated vehicle retirement, and repair programs.
TRANSIT CENTER USER FEES
Parking structures and other facilities located at premium, rapid bus, and rail stations often are at or near capacity. A potential revenue source would be to establish user fees at these facilities. While user fees can help manage the use where parking supply is constrained relative to demand, care must be exercised to develop a fee structure that does not discourage use of the bus or rail service to the point that it significantly reduces ridership. Based on a daily flat parking fee of $3 levied on weekday nontransit passholders (assuming current parking occupancy), this type of fee could generate in the range of $1 million per year (existing number of park-and-ride spaces) to $2 million per year (future parking spaces included in the 2030 Regional Transportation Plan). SANDAG and the transit agencies currently have the authority to implement user fees. This would require a new program structure to administer since no fees are currently collected.
PARCEL TAXES
Property taxes on land and building values are generally the principal source of revenue for local governments. Portions of local property taxes are authorized widely for use by special districts and authorities, including transit agencies and school districts. Unlike real estate transfer taxes (discussed below), property taxes can provide an annual versus one-time funding source for public transit. Traditionally, support for public transportation has been derived from sources other than property tax to avoid competition with other basic public services, such as health, education, police, and fire protection. With existing sources of transit funding being reduced or eliminated, parcel tax assessments for transit could provide a valuable tool to reduce the gap between operating costs and revenues. Based on a range of $50 to $100 assessed on each parcel, this type of tax could generate between $35 and $70 million for transit operations. Local jurisdictions have the authority to implement a parcel tax, but it would require two-thirds voter supermajority approval. The existing programmatic structure in place could be used to collect such a tax should it be levied in the County.
CHAPTER 9: FUNDING
The Coordinated Plan (2010 – 2014) 9-15
PAYROLL TAXES
A transit payroll tax involves a tax imposed directly on an employee or employer based on gross wages regardless of whether the employee uses transit or not. In Portland, Oregon a payroll tax is levied by the Tri-County Metropolitan Transportation District (TriMet) and the Lane County Mass Transit District, while a similar payroll tax is levied by the New York Metropolitan Transit Authority (MTA). Unlike a commuter benefits ordinance which has the advantage of encouraging public transit ridership, a payroll tax has the potential to cover unsubsidized gaps in operating costs and revenues. Existing legislation may allow cities in San Diego County to institute a type of tax known as an “occupation” tax, which is a tax on employees rather than employers (as is the case under the Portland TriMet and New York MTA payroll taxes). Where similar payroll tax percentages were applied countywide under the “occupation” tax using the 0.34 percent TriMet and 0.66 percent New York MTA examples, this type of funding source could generate in the range of $175 to $340 million for transit operations. Such a tax would require 2/3 voter approval to implement.
RENTAL CAR FEES
Rental car fees, more commonly found in rental agreements that originate at airports, are levied in jurisdictions across the United States. While these fees are sometimes used to pay for facilities directly associated with the airport (parking structures or new terminals, for example) some jurisdictions levy these fees to pay for facilities that are not associated with airport improvements, such as stadium expansions or renovations. An option would be to establish rental car fees that provide funding for transit system operations as mitigation for their contribution to congestion on the local street and highway network. These rental car fees could be extended to rental car agreements originating at locations other than airports. SANDAG does not have the authority to impose rental car fees, and so new legislation would be required to allow SANDAG or any local jurisdiction to impose such a fee for transit operations. If legislative changes were implemented and rental car fees were imposed at a rate of 1 percent to 5 percent (based on a recent New York MTA rental car fee of 5 percent), between $2 million and $10 million could be generated for transit operations.
BENEFIT ASSESSMENT DISTRICTS
Benefit assessment districts allow a public agency to construct and maintain improvements, such as traffic signals, parks, and others. Project costs are assessed within the boundaries of the designated benefit area of the county or city. Benefit assessment districts have several advantages: they tie financing of specific projects to beneficiaries; they allow different levels of infrastructure and services to vary with different demands for these public goods; and they allow an area that wants better infrastructure the ability to fund desired improvements itself. There are certain disadvantages, however, including potential fragmentation of infrastructure and services varying between those areas that want to pay for the improvements and those that do not. Local jurisdictions have the authority to create benefit assessment districts. A nexus study and local agency approval would be required and would require a new program structure to administer.
PARKING ASSESSMENT DISTRICTS
Parking assessment districts would allow the region to assess fees on certain parking spaces within defined areas. A surcharge or fee on parking spaces through parking assessment districts
CHAPTER 9: FUNDING
9-16 The Coordinated Plan (2010 – 2014)
in congested areas, such as downtown San Diego or other major employment centers, would help raise additional revenue and reduce traffic congestion. Local jurisdictions have the authority to create parking assessment districts, but a nexus study and local agency approval is required. Additionally, any new assessment district would require a new program structure to administer.
DEVELOPMENT IMPACT FEES AND EXACTIONS
Development impact fees (DIF) are fees collected by local agencies to grant development permits that are tied to certain infrastructure improvements. The DIF also could be a vehicle to fund regional transportation mitigation projects. An analysis of these options must include recognition that DIFs may be opposed by the development community as additional fees would increase their cost of doing business. Public agencies also may find it hard to bond against projected DIF revenue, since the revenues materialize only once the development is implemented. DIFs currently can only be applied to transit capital expenses and not operating expenses. Local jurisdictions have the authority under the Mitigation Fee Act to impose a fee for transit capital, but new legislation would be required to allow the funding to be used for transit operations.
COMMUNITY FACILITIES DISTRICTS
Community facilities districts (CFDs) are allowed under the provisions of California Government Code Section 53311 (known as the “Mello-Roos Community Facilities Act of 1982). Districts formed under this act are more commonly referred to as “Mello-Roos” districts, “community facilities districts, or “CFDs.” The act allows public agencies and cities to form a CFD to fund capital infrastructure and services. It is not clear though that statues would currently allow the use of CFDs to fund transit operations.
TAX INCREMENT FINANCING
Tax increment financing (TIF), in contrast to DIFs, is made up of two components. The first is base revenues, which are the property taxes collected based on existing assessed property values. The second component is the tax increment, which represents the new revenues in excess of the base revenues that are generated based on the higher assessed value of the new development. TIFs can only be imposed by cities and the County, but may be opposed by local agencies as they limit the amount of revenues that are collected in an area positively impacted by the construction of infrastructure, in this case transportation improvements. A mitigating action in the creation of TIFs is that the local agencies could keep the tax increment upon payment of the transportation infrastructure financing.
TIF can only be used to fund capital purchases. Current law allows redevelopment agencies formed by cities and counties to use this type of funding for transit capital projects in highly populated areas. New state legislation would be required to amend the community redevelopment law to authorize funding for transit operations. New state legislation also would be required to amend the community redevelopment law to authorize funding for transit capital in areas with a population under the current thresholds (4 million in the County or 500,000 in a city).
CHAPTER 9: FUNDING
The Coordinated Plan (2010 – 2014) 9-17
REAL ESTATE TRANSER TAXES
Real estate transfer taxes (RETT), also referred as deed recordation taxes, are imposed on the sale or transfer of real property. The fees usually are based on or measured by the consideration paid for or the fair market value of the real estate. Thirty-five states already use RETTs to generate revenue. Some of the uses in other jurisdictions in California and Oregon for revenues derived from RETTs include: affordable housing programs, open space, parkland acquisition and maintenance, and transportation infrastructure. In California, RETTs may be imposed only at the local level by cities and counties. The level of revenues generated depends on the rate, though in the San Diego region the high level of real estate valuations also would influence the amount of revenues. California law allows up to a maximum of $0.55 per $500 of the value of the property being conveyed. There may be some opposition to the imposition of these RETTs precisely because property owner tax bills may be considered high due to these higher property values.
Currently, the maximum tax is being assessed at $0.55 per $500, which is split evenly with $0.55 per $1,000 for each city and $0.55 per $1,000 for the County. Any additional tax increase for noncharter cities would require new state legislation. Additionally, a charter city can forgo its right to half of this tax (known as a “conforming tax”) and subsequently can levy a “nonconforming tax” in its place. There does not appear to be a limit on the amount a charter city can charge for a so-called nonconforming tax. Current examples of this practice vary from $1.10 per $1,000 in Riverside and to as high as $15 per $1,000 in Berkeley and Oakland.
ADVERTISING
Advertising can provide a source of income with minimal associated overhead costs. Revenues from advertising typically flow directly or indirectly to the operating agencies from single- or multiyear advertising contracts. Advertising revenue opportunities can include both electronic and print formats, with print ads opportunities on both buses and at transit stations. Revenue from advertising is typically modest, from 0.1 percent to about 3.0 percent of operating revenue. A targeted advertising strategy focused on station naming rights for new transit services, such as the planned BRT/rapid bus stations for example, could present the opportunity to help subsidize operations or maintenance costs at these stations. Any new transit advertising strategy would need to be consistent the SANDAG Board Policy No. 034 on Advertising.
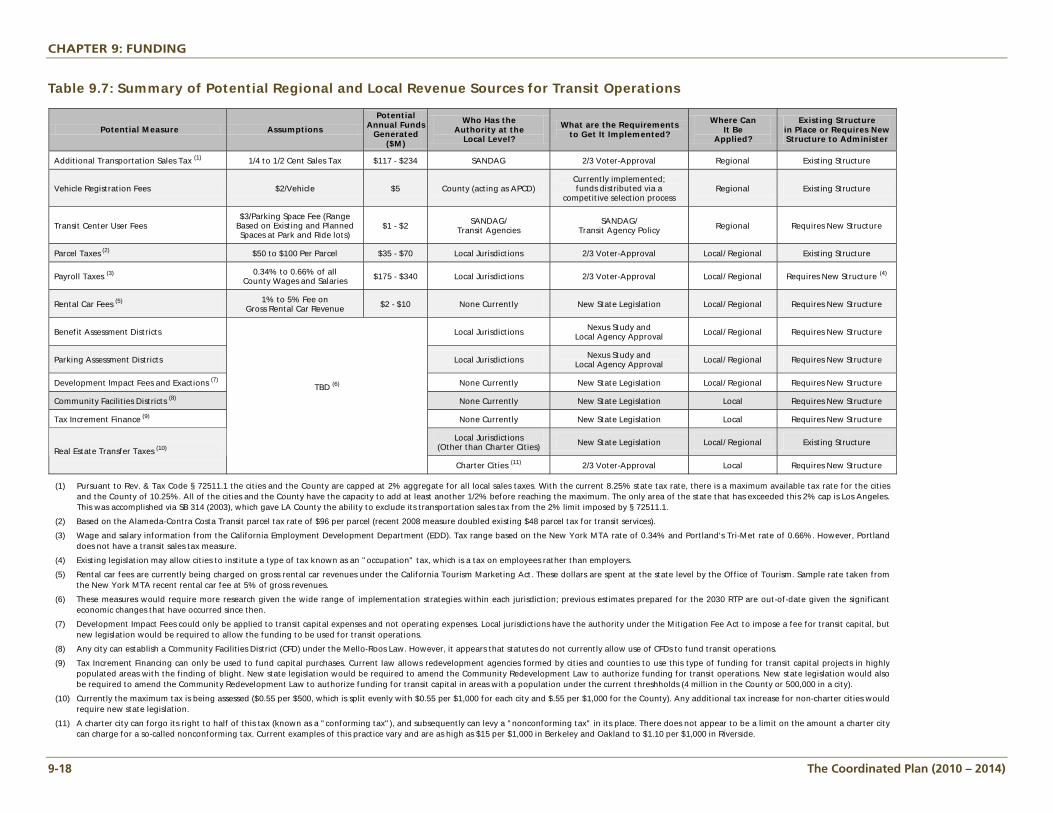
CHAPTER 9: FUNDING
9-18 The Coordinated Plan (2010 – 2014)
Table 9.7: Summary of Potential Regional and Local Revenue Sources for Transit Operations
Potential Measure Assumptions
Potential Annual Funds
Generated ($M)
Who Has the Authority at the
Local Level?
What are the Requirements to Get It Implemented?
Where Can It Be
Applied?
Existing Structure in Place or Requires New Structure to Administer
Additional Transportation Sales Tax (1) 1/4 to 1/2 Cent Sales Tax $117 - $234 SANDAG 2/3 Voter-Approval Regional Existing Structure
Vehicle Registration Fees $2/Vehicle $5 County (acting as APCD) Currently implemented; funds distributed via a
competitive selection process Regional Existing Structure
Transit Center User Fees $3/Parking Space Fee (Range
Based on Existing and Planned Spaces at Park and Ride lots)
$1 - $2 SANDAG/ Transit Agencies
SANDAG/ Transit Agency Policy Regional Requires New Structure
Parcel Taxes (2) $50 to $100 Per Parcel $35 - $70 Local Jurisdictions 2/3 Voter-Approval Local/ Regional Existing Structure
Payroll Taxes (3) 0.34% to 0.66% of all County Wages and Salaries $175 - $340 Local Jurisdictions 2/3 Voter-Approval Local/ Regional Requires New Structure (4)
Rental Car Fees (5) 1% to 5% Fee on Gross Rental Car Revenue $2 - $10 None Currently New State Legislation Local/ Regional Requires New Structure
Benefit Assessment Districts Local Jurisdictions Nexus Study and Local Agency Approval Local/ Regional Requires New Structure
Parking Assessment Districts Local Jurisdictions Nexus Study and Local Agency Approval Local/ Regional Requires New Structure
Development Impact Fees and Exactions (7) None Currently New State Legislation Local/ Regional Requires New Structure
Community Facilities Districts (8) None Currently New State Legislation Local Requires New Structure
Tax Increment Finance (9) None Currently New State Legislation Local Requires New Structure
Local Jurisdictions (Other than Charter Cities) New State Legislation Local/ Regional Existing Structure
Real Estate Transfer Taxes (10)
TBD (6)
Charter Cities (11) 2/3 Voter-Approval Local Requires New Structure
(1) Pursuant to Rev. & Tax Code § 72511.1 the cities and the County are capped at 2% aggregate for all local sales taxes. With the current 8.25% state tax rate, there is a maximum available tax rate for the cities
and the County of 10.25%. All of the cities and the County have the capacity to add at least another 1/2% before reaching the maximum. The only area of the state that has exceeded this 2% cap is Los Angeles. This was accomplished via SB 314 (2003), which gave LA County the ability to exclude its transportation sales tax from the 2% limit imposed by § 72511.1.
(2) Based on the Alameda-Contra Costa Transit parcel tax rate of $96 per parcel (recent 2008 measure doubled existing $48 parcel tax for transit services).
(3) Wage and salary information from the California Employment Development Department (EDD). Tax range based on the New York MTA rate of 0.34% and Portland's Tri-Met rate of 0.66%. However, Portland does not have a transit sales tax measure.
(4) Existing legislation may allow cities to institute a type of tax known as an "occupation" tax, which is a tax on employees rather than employers.
(5) Rental car fees are currently being charged on gross rental car revenues under the California Tourism Marketing Act. These dollars are spent at the state level by the Office of Tourism. Sample rate taken from the New York MTA recent rental car fee at 5% of gross revenues.
(6) These measures would require more research given the wide range of implementation strategies within each jurisdiction; previous estimates prepared for the 2030 RTP are out-of-date given the significant economic changes that have occurred since then.
(7) Development Impact Fees could only be applied to transit capital expenses and not operating expenses. Local jurisdictions have the authority under the Mitigation Fee Act to impose a fee for transit capital, but new legislation would be required to allow the funding to be used for transit operations.
(8) Any city can establish a Community Facilities District (CFD) under the Mello-Roos Law. However, it appears that statutes do not currently allow use of CFDs to fund transit operations.
(9) Tax Increment Financing can only be used to fund capital purchases. Current law allows redevelopment agencies formed by cities and counties to use this type of funding for transit capital projects in highly populated areas with the finding of blight. New state legislation would be required to amend the Community Redevelopment Law to authorize funding for transit operations. New state legislation would also be required to amend the Community Redevelopment Law to authorize funding for transit capital in areas with a population under the current threshholds (4 million in the County or 500,000 in a city).
(10) Currently the maximum tax is being assessed ($0.55 per $500, which is split evenly with $0.55 per $1,000 for each city and $.55 per $1,000 for the County). Any additional tax increase for non-charter cities would require new state legislation.
(11) A charter city can forgo its right to half of this tax (known as a "conforming tax"), and subsequently can levy a "nonconforming tax" in its place. There does not appear to be a limit on the amount a charter city can charge for a so-called nonconforming tax. Current examples of this practice vary and are as high as $15 per $1,000 in Berkeley and Oakland to $1.10 per $1,000 in Riverside.
Chapter 10
Th
e
Co
ord
inate
d P
lan
Implementation

The Coordinated Plan (2010 – 2014) 10-1
CHAPTER 10: IMPLEMENTATION
Implementation of services based on this plan will largely be the responsibility of the transit operators, health and human service agencies, the Consolidated Transportation Services Agency (CTSA), and other public agencies (e.g., cities, tribes). SANDAG will serve as a conduit for federal, state, and local funding of existing and future services recommended in this plan. SANDAG also develops the long-range transit plan through the Regional Transportation Plan (RTP), develops operating plans for regional services identified in the TransNet Extension Ordinance, funds services, and implements projects identified in the TransNet Extension Ordinance. SANDAG also plays a role in developing and promoting some alternative transportation modes (e.g., icommute.com, buspools, vanpools) and enhancing transportation information (e.g., 511). SANDAG staff will monitor new and existing services and report back to the SANDAG Transportation Committee on progress toward achieving the goals, objectives, guidelines, and targets established in this document.
10.1 Program Management Plan and Competitive Process In its role as the conduit for federal, state, and local funding of existing and future services recommended in the plan, SANDAG prepares and updates the Program Management Plan (PMP) to manage the Jobs Access and Reverse Commute (JARC), New Freedom, and the TransNet Senior Mini-Grant programs. The PMP was originally developed to ensure that all SANDAG policies and federal and local statutes and regulations applicable to these programs are fulfilled. Additionally, the PMP was crafted to ensure that the maximum possible benefit is enjoyed by the community through a fair and equitable distribution of the available funds. This includes comprehensive community outreach, public involvement, and stakeholder input through coordination with advisory committees (e.g., Social Services Transportation Advisory Council and the Independent Taxpayer Oversight Committee). The complete updated PMP is shown in Appendix E. The PMP includes the following two key components:
Description of the competitive process procedures to select JARC, New Freedom, and Senior Mini-Grant projects.
Overview of the monitoring and reporting requirements of the projects selected and funded through the competitive process.
The PMP was updated in FY 2009 and FY 2010 to enhance both of the above components. Amendments to the competitive process included enhancing the connection between the prioritized strategies from the Coordinated Plan and projects funded through the grant programs. Additionally, the PMP includes a general update of the project selection criteria and scoring processes for the JARC, New Freedom and Senior Mini-Grant programs. The monitoring and reporting requirements were enhanced in FY 2009 to include a requirement for recipients to provide quarterly project reports to enable SANDAG to determine if the grantees are: performing to expectations; are on schedule; on budget and within funding limitations; able to meet local
CHAPTER 10: IMPLEMENTATION
10-2 The Coordinated Plan (2010 – 2014)
match requirements from eligible funds; encountering any nonfunding challenges or difficulties; meeting performance goals; and taking corrective action as necessary. In addition, SANDAG does not participate in the competitive process for rural JARC and New Freedom applications. The rural competitive process is run by the California Department of Transportation (Caltrans) on a statewide basis; however, all rural projects selected by Caltrans in the rural areas of the county must be derived from the Coordinated Plan prepared by SANDAG. SANDAG also participates in the annual competitive process to award funds under Federal Transit Administration Section 5310 for capital projects for transportation for seniors and persons with disabilities. The actual process is managed by Caltrans on a statewide basis and is not included in the PMP; however, SANDAG provides input in the evaluation of local applications.
10.2 FY 2010 Regional Service Implementation Plan (RSIP) The current economic crisis has forced the transit agencies to make tough decisions on service cuts. The RSIP is developed to ensure that transit service changes are consistent with regional objectives. Each year the Metropolitan Transit System (MTS) and the North County Transit District (NCTD) are required to submit a service implementation plan (SIP) to SANDAG in advance of the budget approval process. The SIPs list the operational changes each transit operator implemented or plans to implement in order to balance proposed fiscal year budgets. Minus budget shortfalls, a discussion is included in these plans regarding the service changes and their impacts on existing service gaps and deficiencies based on the goals and objectives from the Coordinated Plan. This year, MTS provided an update of their FY 2010 SIP. No SIP update was provided by NCTD since they are in the midst of preparing their Mobility Plan which will serve as their Comprehensive Operations Analysis (similar to what MTS prepared several years ago). The revised NCTD SIP will be included in the 2011-2015 Coordinated Plan. Additionally, it is recognized that the CTSA for San Diego also plays a role in regional service implementation since the CTSA’s mission is to provide access and mobility in the region by coordinating existing resources and developing alternative models of transportation. Therefore, the CTSA Business Plan is included in the appendix containing the transit agency SIPs (Appendix F). The inclusion of the CTSA in implementation discussions is appropriate given that transit service reductions have created gaps in service coverage that have, in turn, created challenges for provision of specialized transportation in those areas.
CTSA Business Plan Highlights SANDAG designated Full Access & Coordinated Transportation (FACT) to be the CTSA for San Diego County. CTSAs were established by the state legislature in 1979 to foster coordination between social service transportation agencies. FACT developed a Business Plan in 2009 to focus on its role as the mobility manager for the transportation disadvantaged populations of San Diego County with key services to be provided by FACT including:
One-stop call center, providing a central location for all transportation services for seniors, people with disabilities and low-income residents. The call center will provide information and referral and travel navigation services;
CHAPTER 10: IMPLEMENTATION
The Coordinated Plan (2010 – 2014) 10-3
FACT will partner with multiple nonprofit agencies and serve as a broker of transportation services, ensuring that trip requests are directed to the most appropriate transportation provider;
FACT will serve as a coordinator of shuttle and other transportation services when a transportation need has been identified that would be too costly for NCTD or MTS to provide;
FACT will serve as a resource for all human service providers in the county who need technical assistance such as grant writing or training;
FACT will serve as a coordinated maintenance facilitator;
FACT will be responsible for all transit travel training in San Diego County;
FACT will contract with local cab companies to provide “ first- and last-mile” services to transit centers for transit-dependent individuals who do not live in areas served by Americans with Disabilities Act paratransit.
The FACT Business Plan also described its short- and medium-term projects for implementation including: (1) The Ramona Senior Transportation Pilot Project; (2) Mobility Management Pilot Program; (3) Maintenance Coordination; (4) Volunteer Driver Program Resource Allocation; (5) Older Driver Wellness Program; (6) DMV Guaranteed Ride Home Program; (7) Senior Group Travel Training; (8) Homeless Transportation Program; and (9) Trapeze Loan Program.
RSIP Development After receiving the transit agency SIPs, SANDAG is responsible for developing the RSIP to evaluate operational changes. Additional services can include those designed by the operators (MTS or NCTD) and/or by SANDAG. Accordingly, the plan includes the following sections:
Service reductions or restructuring;
Service enhancements or additions; and
Identification of future services and needs to address regional priorities.
Service Reductions or Restructuring As has been the case for a majority of this past decade, no additional funding categories are expected to be available for transit operations in FY 2011 other than those identified in Chapter 9. However, funding from Assembly Bills (ABs) 8 and 9 (March 2010) is available to the transit agencies to replace some of the services that were cut in FY 2009 and FY 2010. MTS has decided to replace approximately $1.5 million dollars in service at the beginning of FY 2011, which includes modifying service to improve the network, addressing capacity deficiencies, and responding to customer complaints received since the February 2010 weekend service reductions were implemented. NCTD, as mentioned above, is currently developing their Mobility Plan, which will incorporate the replacement funding. While the RSIP ideally focuses on the evaluation of new services and programs for regional consistency and need, the converse also is true. The RSIP must ensure that service reductions and restructuring are consistent with regional goals and objectives. Table 10-1 includes the service reductions undertaken in fiscal year 2010, along with any public hearings and civil rights (Title VI) assessments associated with the adjustments. Additionally, the table includes a determination of regional significance.
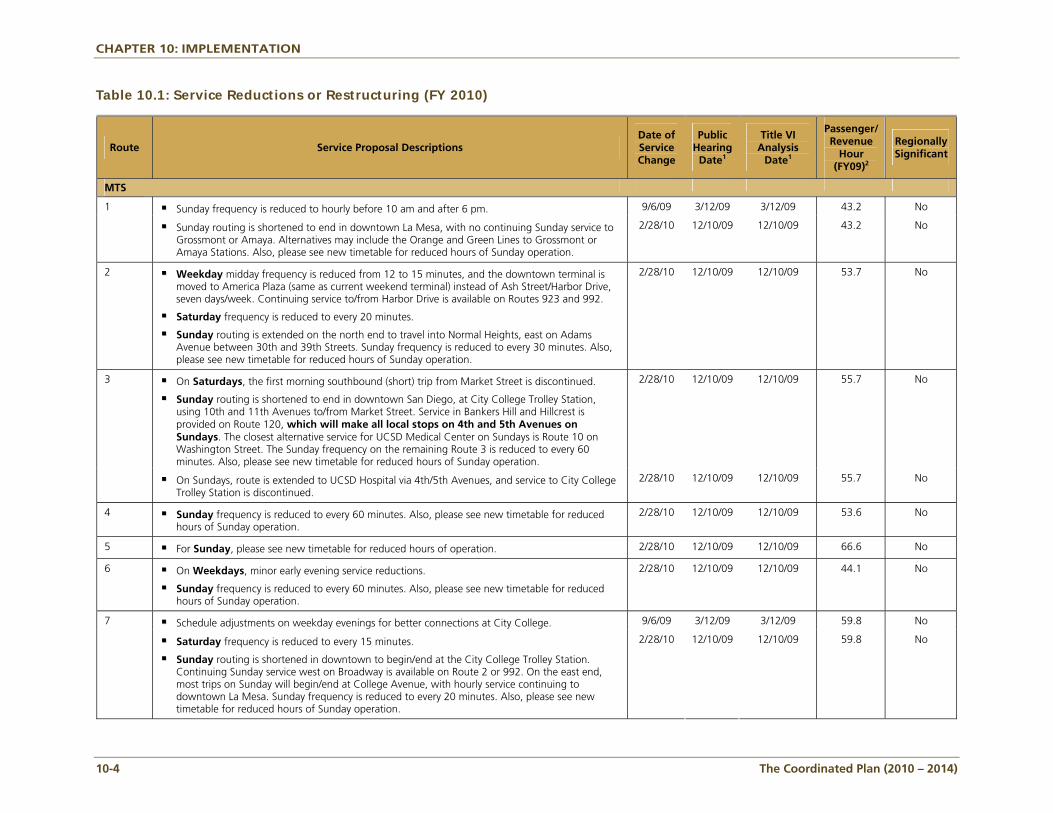
CHAPTER 10: IMPLEMENTATION
10-4 The Coordinated Plan (2010 – 2014)
Table 10.1: Service Reductions or Restructuring (FY 2010)
Route Service Proposal Descriptions Date of Service Change
Public Hearing
Date1
Title VI Analysis
Date1
Passenger/ Revenue
Hour (FY09)2
Regionally Significant
MTS
Sunday frequency is reduced to hourly before 10 am and after 6 pm. 9/6/09 3/12/09 3/12/09 43.2 No 1
Sunday routing is shortened to end in downtown La Mesa, with no continuing Sunday service to Grossmont or Amaya. Alternatives may include the Orange and Green Lines to Grossmont or Amaya Stations. Also, please see new timetable for reduced hours of Sunday operation.
2/28/10 12/10/09 12/10/09 43.2 No
2 Weekday midday frequency is reduced from 12 to 15 minutes, and the downtown terminal is moved to America Plaza (same as current weekend terminal) instead of Ash Street/Harbor Drive, seven days/week. Continuing service to/from Harbor Drive is available on Routes 923 and 992.
Saturday frequency is reduced to every 20 minutes.
Sunday routing is extended on the north end to travel into Normal Heights, east on Adams Avenue between 30th and 39th Streets. Sunday frequency is reduced to every 30 minutes. Also, please see new timetable for reduced hours of Sunday operation.
2/28/10 12/10/09 12/10/09 53.7 No
On Saturdays, the first morning southbound (short) trip from Market Street is discontinued.
Sunday routing is shortened to end in downtown San Diego, at City College Trolley Station, using 10th and 11th Avenues to/from Market Street. Service in Bankers Hill and Hillcrest is provided on Route 120, which will make all local stops on 4th and 5th Avenues on Sundays. The closest alternative service for UCSD Medical Center on Sundays is Route 10 on Washington Street. The Sunday frequency on the remaining Route 3 is reduced to every 60 minutes. Also, please see new timetable for reduced hours of Sunday operation.
2/28/10 12/10/09 12/10/09 55.7 No 3
On Sundays, route is extended to UCSD Hospital via 4th/5th Avenues, and service to City College Trolley Station is discontinued.
2/28/10 12/10/09 12/10/09 55.7 No
4 Sunday frequency is reduced to every 60 minutes. Also, please see new timetable for reduced hours of Sunday operation.
2/28/10 12/10/09 12/10/09 53.6 No
5 For Sunday, please see new timetable for reduced hours of operation. 2/28/10 12/10/09 12/10/09 66.6 No
6 On Weekdays, minor early evening service reductions.
Sunday frequency is reduced to every 60 minutes. Also, please see new timetable for reduced hours of Sunday operation.
2/28/10 12/10/09 12/10/09 44.1 No
Schedule adjustments on weekday evenings for better connections at City College. 9/6/09 3/12/09 3/12/09 59.8 No 7
Saturday frequency is reduced to every 15 minutes.
Sunday routing is shortened in downtown to begin/end at the City College Trolley Station. Continuing Sunday service west on Broadway is available on Route 2 or 992. On the east end, most trips on Sunday will begin/end at College Avenue, with hourly service continuing to downtown La Mesa. Sunday frequency is reduced to every 20 minutes. Also, please see new timetable for reduced hours of Sunday operation.
2/28/10 12/10/09 12/10/09 59.8 No
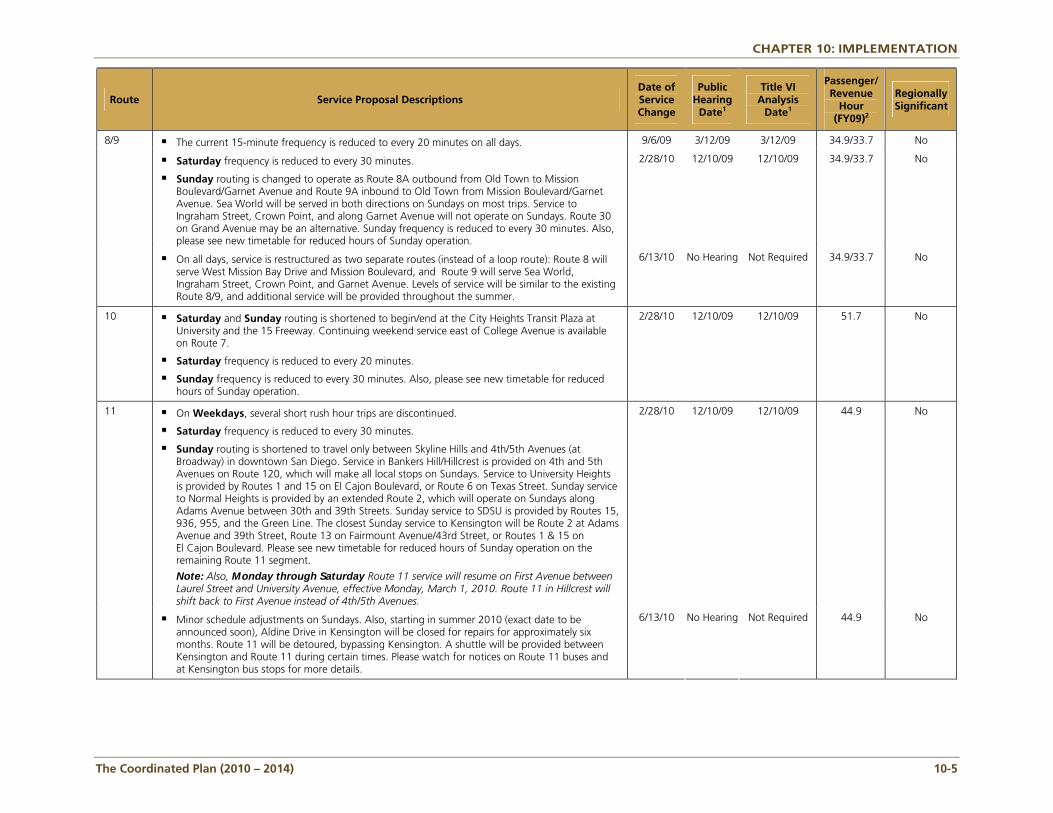
CHAPTER 10: IMPLEMENTATION
The Coordinated Plan (2010 – 2014) 10-5
Route Service Proposal Descriptions Date of Service Change
Public Hearing
Date1
Title VI Analysis
Date1
Passenger/ Revenue
Hour (FY09)2
Regionally Significant
The current 15-minute frequency is reduced to every 20 minutes on all days. 9/6/09 3/12/09 3/12/09 34.9/33.7 No
Saturday frequency is reduced to every 30 minutes.
Sunday routing is changed to operate as Route 8A outbound from Old Town to Mission Boulevard/Garnet Avenue and Route 9A inbound to Old Town from Mission Boulevard/Garnet Avenue. Sea World will be served in both directions on Sundays on most trips. Service to Ingraham Street, Crown Point, and along Garnet Avenue will not operate on Sundays. Route 30 on Grand Avenue may be an alternative. Sunday frequency is reduced to every 30 minutes. Also, please see new timetable for reduced hours of Sunday operation.
2/28/10 12/10/09 12/10/09 34.9/33.7 No
8/9
On all days, service is restructured as two separate routes (instead of a loop route): Route 8 will serve West Mission Bay Drive and Mission Boulevard, and Route 9 will serve Sea World, Ingraham Street, Crown Point, and Garnet Avenue. Levels of service will be similar to the existing Route 8/9, and additional service will be provided throughout the summer.
6/13/10 No Hearing Not Required 34.9/33.7 No
10 Saturday and Sunday routing is shortened to begin/end at the City Heights Transit Plaza at University and the 15 Freeway. Continuing weekend service east of College Avenue is available on Route 7.
Saturday frequency is reduced to every 20 minutes.
Sunday frequency is reduced to every 30 minutes. Also, please see new timetable for reduced hours of Sunday operation.
2/28/10 12/10/09 12/10/09 51.7 No
On Weekdays, several short rush hour trips are discontinued.
Saturday frequency is reduced to every 30 minutes.
Sunday routing is shortened to travel only between Skyline Hills and 4th/5th Avenues (at Broadway) in downtown San Diego. Service in Bankers Hill/Hillcrest is provided on 4th and 5th Avenues on Route 120, which will make all local stops on Sundays. Service to University Heights is provided by Routes 1 and 15 on El Cajon Boulevard, or Route 6 on Texas Street. Sunday service to Normal Heights is provided by an extended Route 2, which will operate on Sundays along Adams Avenue between 30th and 39th Streets. Sunday service to SDSU is provided by Routes 15, 936, 955, and the Green Line. The closest Sunday service to Kensington will be Route 2 at Adams Avenue and 39th Street, Route 13 on Fairmount Avenue/43rd Street, or Routes 1 & 15 on El Cajon Boulevard. Please see new timetable for reduced hours of Sunday operation on the remaining Route 11 segment.
Note: Also, Monday through Saturday Route 11 service will resume on First Avenue between Laurel Street and University Avenue, effective Monday, March 1, 2010. Route 11 in Hillcrest will shift back to First Avenue instead of 4th/5th Avenues.
2/28/10 12/10/09 12/10/09 44.9 No 11
Minor schedule adjustments on Sundays. Also, starting in summer 2010 (exact date to be announced soon), Aldine Drive in Kensington will be closed for repairs for approximately six months. Route 11 will be detoured, bypassing Kensington. A shuttle will be provided between Kensington and Route 11 during certain times. Please watch for notices on Route 11 buses and at Kensington bus stops for more details.
6/13/10 No Hearing Not Required 44.9 No
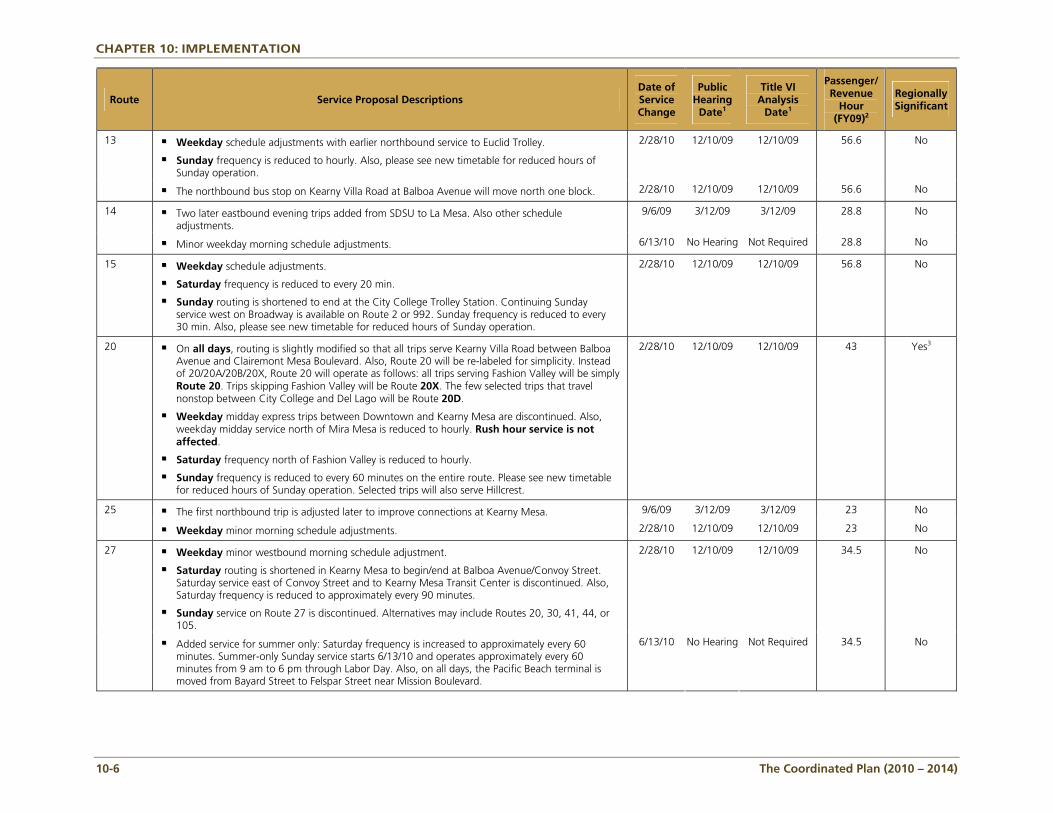
CHAPTER 10: IMPLEMENTATION
10-6 The Coordinated Plan (2010 – 2014)
Route Service Proposal Descriptions Date of Service Change
Public Hearing
Date1
Title VI Analysis
Date1
Passenger/ Revenue
Hour (FY09)2
Regionally Significant
Weekday schedule adjustments with earlier northbound service to Euclid Trolley.
Sunday frequency is reduced to hourly. Also, please see new timetable for reduced hours of Sunday operation.
2/28/10 12/10/09 12/10/09 56.6 No 13
The northbound bus stop on Kearny Villa Road at Balboa Avenue will move north one block. 2/28/10 12/10/09 12/10/09 56.6 No
Two later eastbound evening trips added from SDSU to La Mesa. Also other schedule adjustments.
9/6/09 3/12/09 3/12/09 28.8 No 14
Minor weekday morning schedule adjustments. 6/13/10 No Hearing Not Required 28.8 No
15 Weekday schedule adjustments.
Saturday frequency is reduced to every 20 min.
Sunday routing is shortened to end at the City College Trolley Station. Continuing Sunday service west on Broadway is available on Route 2 or 992. Sunday frequency is reduced to every 30 min. Also, please see new timetable for reduced hours of Sunday operation.
2/28/10 12/10/09 12/10/09 56.8 No
20 On all days, routing is slightly modified so that all trips serve Kearny Villa Road between Balboa Avenue and Clairemont Mesa Boulevard. Also, Route 20 will be re-labeled for simplicity. Instead of 20/20A/20B/20X, Route 20 will operate as follows: all trips serving Fashion Valley will be simply Route 20. Trips skipping Fashion Valley will be Route 20X. The few selected trips that travel nonstop between City College and Del Lago will be Route 20D.
Weekday midday express trips between Downtown and Kearny Mesa are discontinued. Also, weekday midday service north of Mira Mesa is reduced to hourly. Rush hour service is not affected.
Saturday frequency north of Fashion Valley is reduced to hourly.
Sunday frequency is reduced to every 60 minutes on the entire route. Please see new timetable for reduced hours of Sunday operation. Selected trips will also serve Hillcrest.
2/28/10 12/10/09 12/10/09 43 Yes3
The first northbound trip is adjusted later to improve connections at Kearny Mesa. 9/6/09 3/12/09 3/12/09 23 No 25
Weekday minor morning schedule adjustments. 2/28/10 12/10/09 12/10/09 23 No
Weekday minor westbound morning schedule adjustment.
Saturday routing is shortened in Kearny Mesa to begin/end at Balboa Avenue/Convoy Street. Saturday service east of Convoy Street and to Kearny Mesa Transit Center is discontinued. Also, Saturday frequency is reduced to approximately every 90 minutes.
Sunday service on Route 27 is discontinued. Alternatives may include Routes 20, 30, 41, 44, or 105.
2/28/10 12/10/09 12/10/09 34.5 No 27
Added service for summer only: Saturday frequency is increased to approximately every 60 minutes. Summer-only Sunday service starts 6/13/10 and operates approximately every 60 minutes from 9 am to 6 pm through Labor Day. Also, on all days, the Pacific Beach terminal is moved from Bayard Street to Felspar Street near Mission Boulevard.
6/13/10 No Hearing Not Required 34.5 No
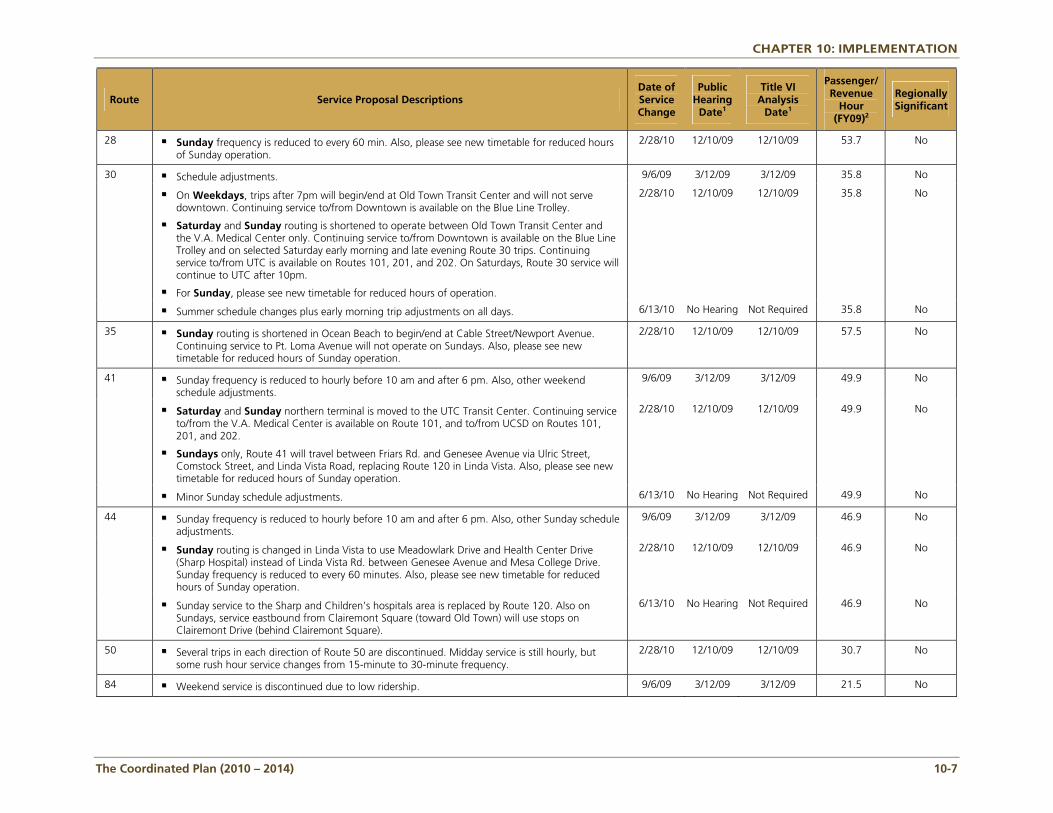
CHAPTER 10: IMPLEMENTATION
The Coordinated Plan (2010 – 2014) 10-7
Route Service Proposal Descriptions Date of Service Change
Public Hearing
Date1
Title VI Analysis
Date1
Passenger/ Revenue
Hour (FY09)2
Regionally Significant
28 Sunday frequency is reduced to every 60 min. Also, please see new timetable for reduced hours of Sunday operation.
2/28/10 12/10/09 12/10/09 53.7 No
Schedule adjustments. 9/6/09 3/12/09 3/12/09 35.8 No
On Weekdays, trips after 7pm will begin/end at Old Town Transit Center and will not serve downtown. Continuing service to/from Downtown is available on the Blue Line Trolley.
Saturday and Sunday routing is shortened to operate between Old Town Transit Center and the V.A. Medical Center only. Continuing service to/from Downtown is available on the Blue Line Trolley and on selected Saturday early morning and late evening Route 30 trips. Continuing service to/from UTC is available on Routes 101, 201, and 202. On Saturdays, Route 30 service will continue to UTC after 10pm.
For Sunday, please see new timetable for reduced hours of operation.
2/28/10 12/10/09 12/10/09 35.8 No
30
Summer schedule changes plus early morning trip adjustments on all days. 6/13/10 No Hearing Not Required 35.8 No
35 Sunday routing is shortened in Ocean Beach to begin/end at Cable Street/Newport Avenue. Continuing service to Pt. Loma Avenue will not operate on Sundays. Also, please see new timetable for reduced hours of Sunday operation.
2/28/10 12/10/09 12/10/09 57.5 No
Sunday frequency is reduced to hourly before 10 am and after 6 pm. Also, other weekend schedule adjustments.
9/6/09 3/12/09 3/12/09 49.9 No
Saturday and Sunday northern terminal is moved to the UTC Transit Center. Continuing service to/from the V.A. Medical Center is available on Route 101, and to/from UCSD on Routes 101, 201, and 202.
Sundays only, Route 41 will travel between Friars Rd. and Genesee Avenue via Ulric Street, Comstock Street, and Linda Vista Road, replacing Route 120 in Linda Vista. Also, please see new timetable for reduced hours of Sunday operation.
2/28/10 12/10/09 12/10/09 49.9 No
41
Minor Sunday schedule adjustments. 6/13/10 No Hearing Not Required 49.9 No
Sunday frequency is reduced to hourly before 10 am and after 6 pm. Also, other Sunday schedule adjustments.
9/6/09 3/12/09 3/12/09 46.9 No
Sunday routing is changed in Linda Vista to use Meadowlark Drive and Health Center Drive (Sharp Hospital) instead of Linda Vista Rd. between Genesee Avenue and Mesa College Drive. Sunday frequency is reduced to every 60 minutes. Also, please see new timetable for reduced hours of Sunday operation.
2/28/10 12/10/09 12/10/09 46.9 No
44
Sunday service to the Sharp and Children’s hospitals area is replaced by Route 120. Also on Sundays, service eastbound from Clairemont Square (toward Old Town) will use stops on Clairemont Drive (behind Clairemont Square).
6/13/10 No Hearing Not Required 46.9 No
50 Several trips in each direction of Route 50 are discontinued. Midday service is still hourly, but some rush hour service changes from 15-minute to 30-minute frequency.
2/28/10 12/10/09 12/10/09 30.7 No
84 Weekend service is discontinued due to low ridership. 9/6/09 3/12/09 3/12/09 21.5 No
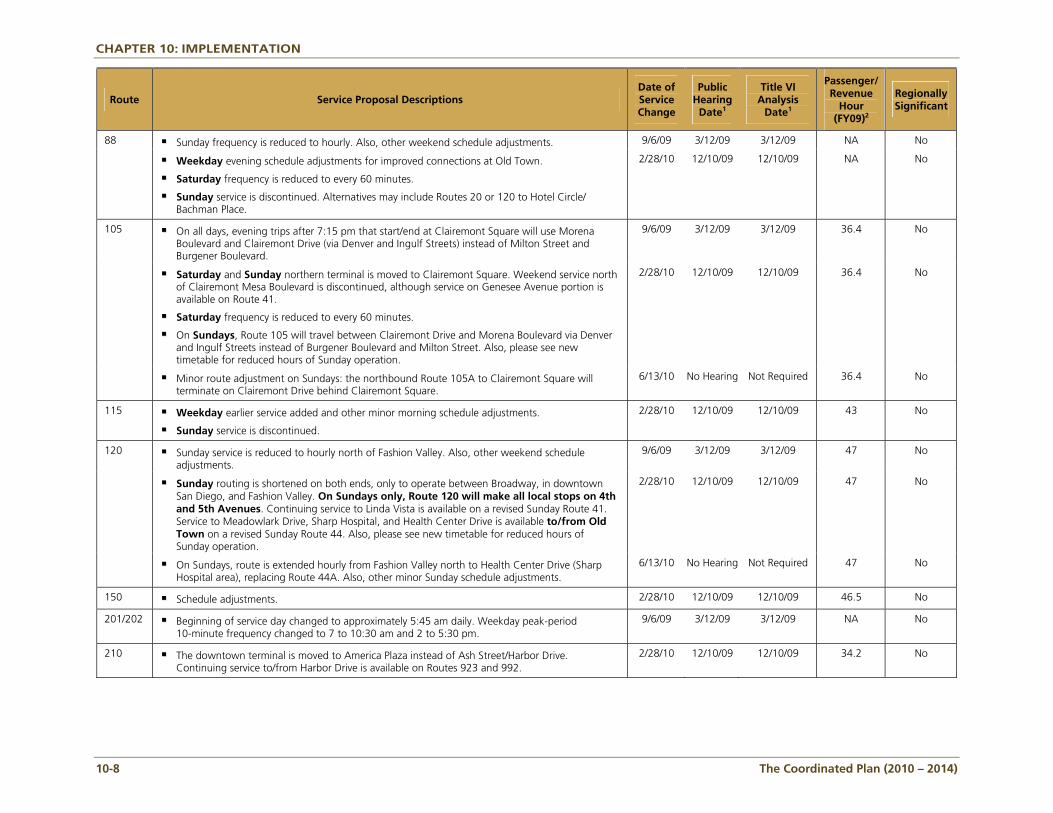
CHAPTER 10: IMPLEMENTATION
10-8 The Coordinated Plan (2010 – 2014)
Route Service Proposal Descriptions Date of Service Change
Public Hearing
Date1
Title VI Analysis
Date1
Passenger/ Revenue
Hour (FY09)2
Regionally Significant
Sunday frequency is reduced to hourly. Also, other weekend schedule adjustments. 9/6/09 3/12/09 3/12/09 NA No 88
Weekday evening schedule adjustments for improved connections at Old Town.
Saturday frequency is reduced to every 60 minutes.
Sunday service is discontinued. Alternatives may include Routes 20 or 120 to Hotel Circle/ Bachman Place.
2/28/10 12/10/09 12/10/09 NA No
On all days, evening trips after 7:15 pm that start/end at Clairemont Square will use Morena Boulevard and Clairemont Drive (via Denver and Ingulf Streets) instead of Milton Street and Burgener Boulevard.
9/6/09 3/12/09 3/12/09 36.4 No
Saturday and Sunday northern terminal is moved to Clairemont Square. Weekend service north of Clairemont Mesa Boulevard is discontinued, although service on Genesee Avenue portion is available on Route 41.
Saturday frequency is reduced to every 60 minutes.
On Sundays, Route 105 will travel between Clairemont Drive and Morena Boulevard via Denver and Ingulf Streets instead of Burgener Boulevard and Milton Street. Also, please see new timetable for reduced hours of Sunday operation.
2/28/10 12/10/09 12/10/09 36.4 No
105
Minor route adjustment on Sundays: the northbound Route 105A to Clairemont Square will terminate on Clairemont Drive behind Clairemont Square.
6/13/10 No Hearing Not Required 36.4 No
115 Weekday earlier service added and other minor morning schedule adjustments.
Sunday service is discontinued.
2/28/10 12/10/09 12/10/09 43 No
Sunday service is reduced to hourly north of Fashion Valley. Also, other weekend schedule adjustments.
9/6/09 3/12/09 3/12/09 47 No
Sunday routing is shortened on both ends, only to operate between Broadway, in downtown San Diego, and Fashion Valley. On Sundays only, Route 120 will make all local stops on 4th and 5th Avenues. Continuing service to Linda Vista is available on a revised Sunday Route 41. Service to Meadowlark Drive, Sharp Hospital, and Health Center Drive is available to/from Old Town on a revised Sunday Route 44. Also, please see new timetable for reduced hours of Sunday operation.
2/28/10 12/10/09 12/10/09 47 No
120
On Sundays, route is extended hourly from Fashion Valley north to Health Center Drive (Sharp Hospital area), replacing Route 44A. Also, other minor Sunday schedule adjustments.
6/13/10 No Hearing Not Required 47 No
150 Schedule adjustments. 2/28/10 12/10/09 12/10/09 46.5 No
201/202 Beginning of service day changed to approximately 5:45 am daily. Weekday peak-period 10-minute frequency changed to 7 to 10:30 am and 2 to 5:30 pm.
9/6/09 3/12/09 3/12/09 NA No
210 The downtown terminal is moved to America Plaza instead of Ash Street/Harbor Drive. Continuing service to/from Harbor Drive is available on Routes 923 and 992.
2/28/10 12/10/09 12/10/09 34.2 No
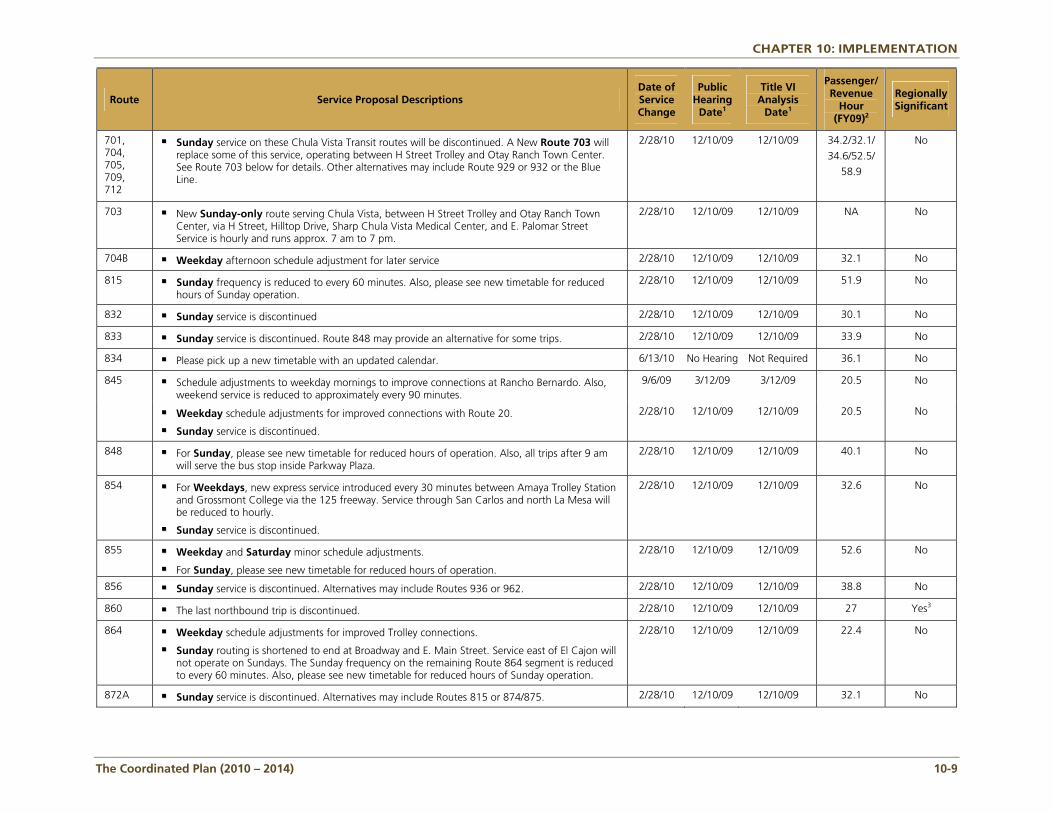
CHAPTER 10: IMPLEMENTATION
The Coordinated Plan (2010 – 2014) 10-9
Route Service Proposal Descriptions Date of Service Change
Public Hearing
Date1
Title VI Analysis
Date1
Passenger/ Revenue
Hour (FY09)2
Regionally Significant
701, 704, 705, 709, 712
Sunday service on these Chula Vista Transit routes will be discontinued. A New Route 703 will replace some of this service, operating between H Street Trolley and Otay Ranch Town Center. See Route 703 below for details. Other alternatives may include Route 929 or 932 or the Blue Line.
2/28/10 12/10/09 12/10/09 34.2/32.1/
34.6/52.5/
58.9
No
703 New Sunday-only route serving Chula Vista, between H Street Trolley and Otay Ranch Town Center, via H Street, Hilltop Drive, Sharp Chula Vista Medical Center, and E. Palomar Street Service is hourly and runs approx. 7 am to 7 pm.
2/28/10 12/10/09 12/10/09 NA No
704B Weekday afternoon schedule adjustment for later service 2/28/10 12/10/09 12/10/09 32.1 No
815 Sunday frequency is reduced to every 60 minutes. Also, please see new timetable for reduced hours of Sunday operation.
2/28/10 12/10/09 12/10/09 51.9 No
832 Sunday service is discontinued 2/28/10 12/10/09 12/10/09 30.1 No
833 Sunday service is discontinued. Route 848 may provide an alternative for some trips. 2/28/10 12/10/09 12/10/09 33.9 No
834 Please pick up a new timetable with an updated calendar. 6/13/10 No Hearing Not Required 36.1 No
Schedule adjustments to weekday mornings to improve connections at Rancho Bernardo. Also, weekend service is reduced to approximately every 90 minutes.
9/6/09 3/12/09 3/12/09 20.5 No 845
Weekday schedule adjustments for improved connections with Route 20.
Sunday service is discontinued.
2/28/10 12/10/09 12/10/09 20.5 No
848 For Sunday, please see new timetable for reduced hours of operation. Also, all trips after 9 am will serve the bus stop inside Parkway Plaza.
2/28/10 12/10/09 12/10/09 40.1 No
854 For Weekdays, new express service introduced every 30 minutes between Amaya Trolley Station and Grossmont College via the 125 freeway. Service through San Carlos and north La Mesa will be reduced to hourly.
Sunday service is discontinued.
2/28/10 12/10/09 12/10/09 32.6 No
855 Weekday and Saturday minor schedule adjustments.
For Sunday, please see new timetable for reduced hours of operation.
2/28/10 12/10/09 12/10/09 52.6 No
856 Sunday service is discontinued. Alternatives may include Routes 936 or 962. 2/28/10 12/10/09 12/10/09 38.8 No
860 The last northbound trip is discontinued. 2/28/10 12/10/09 12/10/09 27 Yes3
864 Weekday schedule adjustments for improved Trolley connections.
Sunday routing is shortened to end at Broadway and E. Main Street. Service east of El Cajon will not operate on Sundays. The Sunday frequency on the remaining Route 864 segment is reduced to every 60 minutes. Also, please see new timetable for reduced hours of Sunday operation.
2/28/10 12/10/09 12/10/09 22.4 No
872A Sunday service is discontinued. Alternatives may include Routes 815 or 874/875. 2/28/10 12/10/09 12/10/09 32.1 No
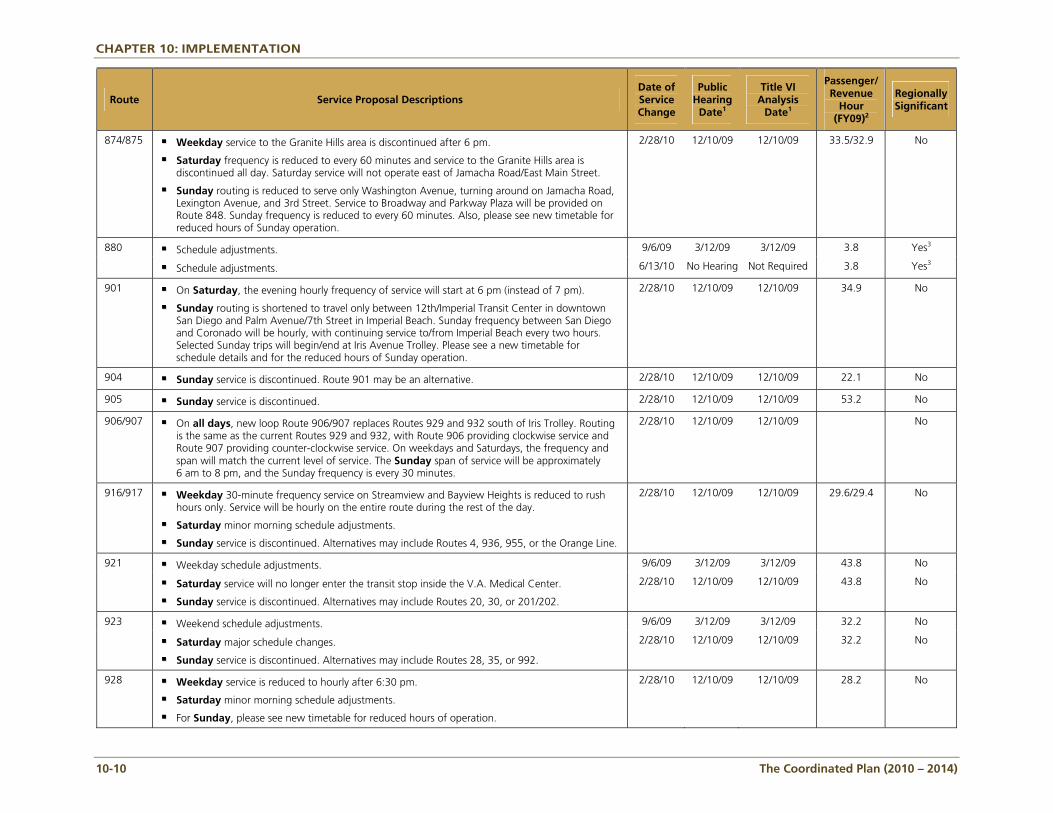
CHAPTER 10: IMPLEMENTATION
10-10 The Coordinated Plan (2010 – 2014)
Route Service Proposal Descriptions Date of Service Change
Public Hearing
Date1
Title VI Analysis
Date1
Passenger/ Revenue
Hour (FY09)2
Regionally Significant
874/875 Weekday service to the Granite Hills area is discontinued after 6 pm.
Saturday frequency is reduced to every 60 minutes and service to the Granite Hills area is discontinued all day. Saturday service will not operate east of Jamacha Road/East Main Street.
Sunday routing is reduced to serve only Washington Avenue, turning around on Jamacha Road, Lexington Avenue, and 3rd Street. Service to Broadway and Parkway Plaza will be provided on Route 848. Sunday frequency is reduced to every 60 minutes. Also, please see new timetable for reduced hours of Sunday operation.
2/28/10 12/10/09 12/10/09 33.5/32.9 No
Schedule adjustments. 9/6/09 3/12/09 3/12/09 3.8 Yes3 880
Schedule adjustments. 6/13/10 No Hearing Not Required 3.8 Yes3
901 On Saturday, the evening hourly frequency of service will start at 6 pm (instead of 7 pm).
Sunday routing is shortened to travel only between 12th/Imperial Transit Center in downtown San Diego and Palm Avenue/7th Street in Imperial Beach. Sunday frequency between San Diego and Coronado will be hourly, with continuing service to/from Imperial Beach every two hours. Selected Sunday trips will begin/end at Iris Avenue Trolley. Please see a new timetable for schedule details and for the reduced hours of Sunday operation.
2/28/10 12/10/09 12/10/09 34.9 No
904 Sunday service is discontinued. Route 901 may be an alternative. 2/28/10 12/10/09 12/10/09 22.1 No
905 Sunday service is discontinued. 2/28/10 12/10/09 12/10/09 53.2 No
906/907 On all days, new loop Route 906/907 replaces Routes 929 and 932 south of Iris Trolley. Routing is the same as the current Routes 929 and 932, with Route 906 providing clockwise service and Route 907 providing counter-clockwise service. On weekdays and Saturdays, the frequency and span will match the current level of service. The Sunday span of service will be approximately 6 am to 8 pm, and the Sunday frequency is every 30 minutes.
2/28/10 12/10/09 12/10/09 No
916/917 Weekday 30-minute frequency service on Streamview and Bayview Heights is reduced to rush hours only. Service will be hourly on the entire route during the rest of the day.
Saturday minor morning schedule adjustments.
Sunday service is discontinued. Alternatives may include Routes 4, 936, 955, or the Orange Line.
2/28/10 12/10/09 12/10/09 29.6/29.4 No
Weekday schedule adjustments. 9/6/09 3/12/09 3/12/09 43.8 No 921
Saturday service will no longer enter the transit stop inside the V.A. Medical Center.
Sunday service is discontinued. Alternatives may include Routes 20, 30, or 201/202.
2/28/10 12/10/09 12/10/09 43.8 No
Weekend schedule adjustments. 9/6/09 3/12/09 3/12/09 32.2 No 923
Saturday major schedule changes.
Sunday service is discontinued. Alternatives may include Routes 28, 35, or 992.
2/28/10 12/10/09 12/10/09 32.2 No
928 Weekday service is reduced to hourly after 6:30 pm.
Saturday minor morning schedule adjustments.
For Sunday, please see new timetable for reduced hours of operation.
2/28/10 12/10/09 12/10/09 28.2 No
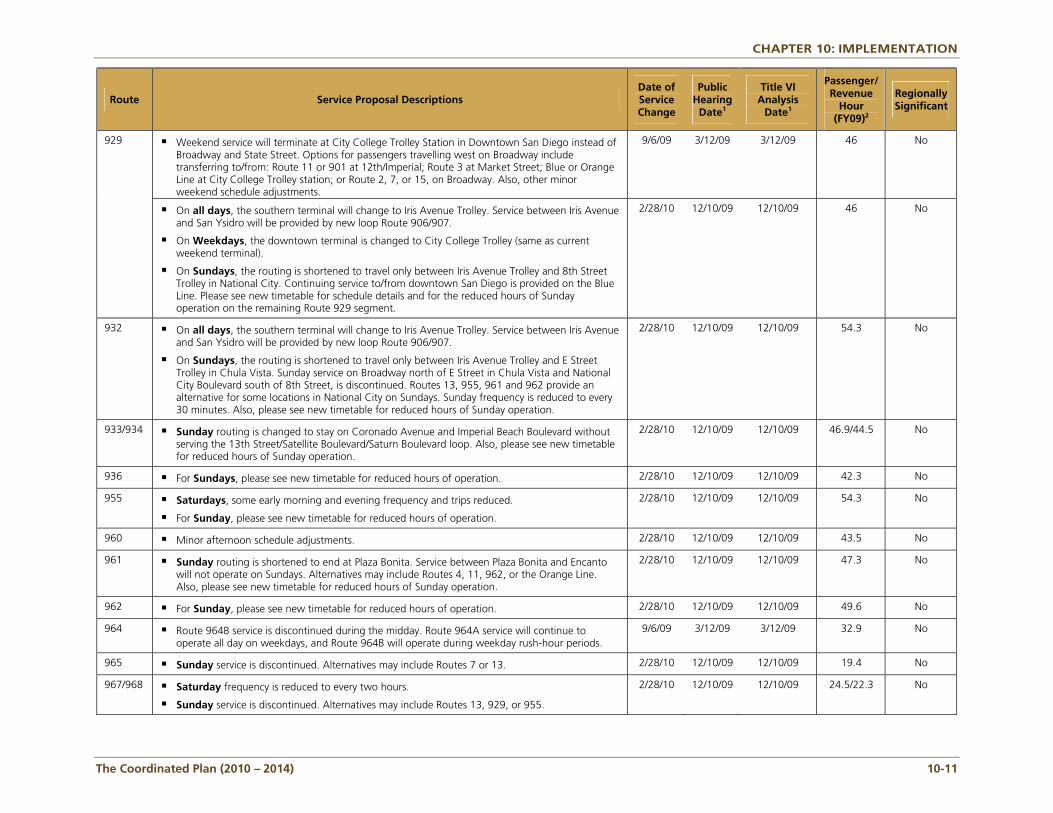
CHAPTER 10: IMPLEMENTATION
The Coordinated Plan (2010 – 2014) 10-11
Route Service Proposal Descriptions Date of Service Change
Public Hearing
Date1
Title VI Analysis
Date1
Passenger/ Revenue
Hour (FY09)2
Regionally Significant
Weekend service will terminate at City College Trolley Station in Downtown San Diego instead of Broadway and State Street. Options for passengers travelling west on Broadway include transferring to/from: Route 11 or 901 at 12th/Imperial; Route 3 at Market Street; Blue or Orange Line at City College Trolley station; or Route 2, 7, or 15, on Broadway. Also, other minor weekend schedule adjustments.
9/6/09 3/12/09 3/12/09 46 No 929
On all days, the southern terminal will change to Iris Avenue Trolley. Service between Iris Avenue and San Ysidro will be provided by new loop Route 906/907.
On Weekdays, the downtown terminal is changed to City College Trolley (same as current weekend terminal).
On Sundays, the routing is shortened to travel only between Iris Avenue Trolley and 8th Street Trolley in National City. Continuing service to/from downtown San Diego is provided on the Blue Line. Please see new timetable for schedule details and for the reduced hours of Sunday operation on the remaining Route 929 segment.
2/28/10 12/10/09 12/10/09 46 No
932 On all days, the southern terminal will change to Iris Avenue Trolley. Service between Iris Avenue and San Ysidro will be provided by new loop Route 906/907.
On Sundays, the routing is shortened to travel only between Iris Avenue Trolley and E Street Trolley in Chula Vista. Sunday service on Broadway north of E Street in Chula Vista and National City Boulevard south of 8th Street, is discontinued. Routes 13, 955, 961 and 962 provide an alternative for some locations in National City on Sundays. Sunday frequency is reduced to every 30 minutes. Also, please see new timetable for reduced hours of Sunday operation.
2/28/10 12/10/09 12/10/09 54.3 No
933/934 Sunday routing is changed to stay on Coronado Avenue and Imperial Beach Boulevard without serving the 13th Street/Satellite Boulevard/Saturn Boulevard loop. Also, please see new timetable for reduced hours of Sunday operation.
2/28/10 12/10/09 12/10/09 46.9/44.5 No
936 For Sundays, please see new timetable for reduced hours of operation. 2/28/10 12/10/09 12/10/09 42.3 No
955 Saturdays, some early morning and evening frequency and trips reduced.
For Sunday, please see new timetable for reduced hours of operation.
2/28/10 12/10/09 12/10/09 54.3 No
960 Minor afternoon schedule adjustments. 2/28/10 12/10/09 12/10/09 43.5 No
961 Sunday routing is shortened to end at Plaza Bonita. Service between Plaza Bonita and Encanto will not operate on Sundays. Alternatives may include Routes 4, 11, 962, or the Orange Line. Also, please see new timetable for reduced hours of Sunday operation.
2/28/10 12/10/09 12/10/09 47.3 No
962 For Sunday, please see new timetable for reduced hours of operation. 2/28/10 12/10/09 12/10/09 49.6 No
964 Route 964B service is discontinued during the midday. Route 964A service will continue to operate all day on weekdays, and Route 964B will operate during weekday rush-hour periods.
9/6/09 3/12/09 3/12/09 32.9 No
965 Sunday service is discontinued. Alternatives may include Routes 7 or 13. 2/28/10 12/10/09 12/10/09 19.4 No
967/968 Saturday frequency is reduced to every two hours.
Sunday service is discontinued. Alternatives may include Routes 13, 929, or 955.
2/28/10 12/10/09 12/10/09 24.5/22.3 No
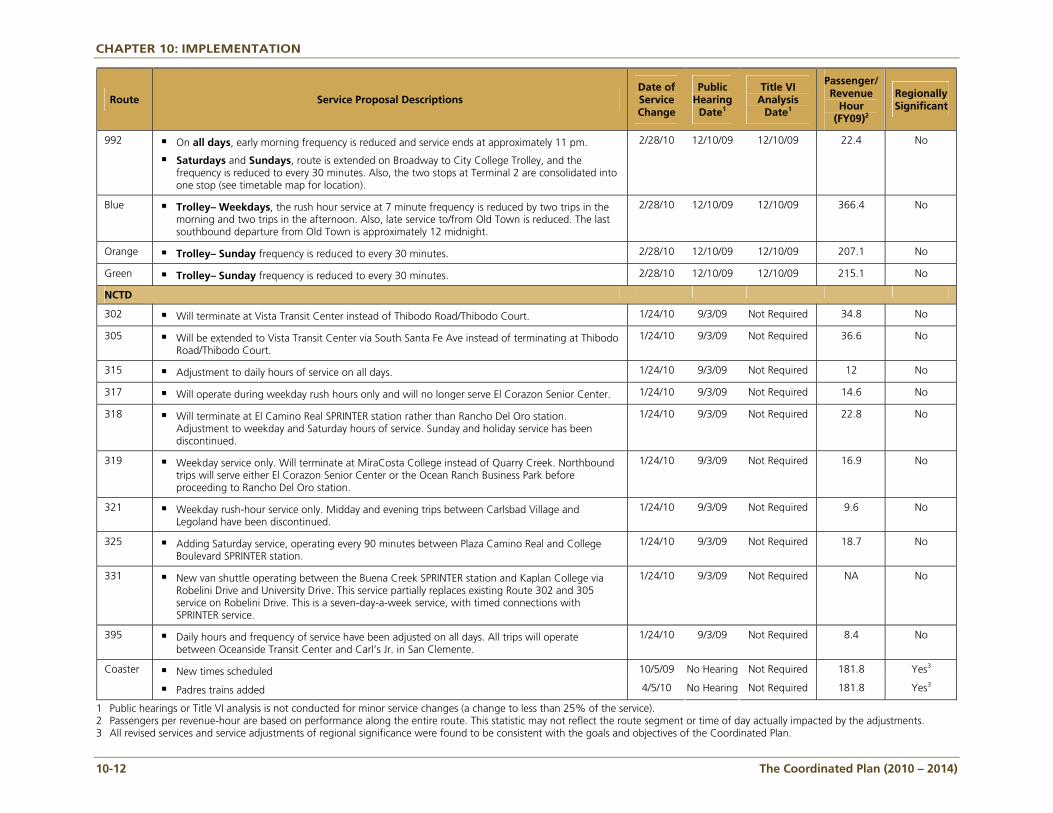
CHAPTER 10: IMPLEMENTATION
10-12 The Coordinated Plan (2010 – 2014)
Route Service Proposal Descriptions Date of Service Change
Public Hearing
Date1
Title VI Analysis
Date1
Passenger/ Revenue
Hour (FY09)2
Regionally Significant
992 On all days, early morning frequency is reduced and service ends at approximately 11 pm.
Saturdays and Sundays, route is extended on Broadway to City College Trolley, and the frequency is reduced to every 30 minutes. Also, the two stops at Terminal 2 are consolidated into one stop (see timetable map for location).
2/28/10 12/10/09 12/10/09 22.4 No
Blue Trolley– Weekdays, the rush hour service at 7 minute frequency is reduced by two trips in the morning and two trips in the afternoon. Also, late service to/from Old Town is reduced. The last southbound departure from Old Town is approximately 12 midnight.
2/28/10 12/10/09 12/10/09 366.4 No
Orange Trolley– Sunday frequency is reduced to every 30 minutes. 2/28/10 12/10/09 12/10/09 207.1 No
Green Trolley– Sunday frequency is reduced to every 30 minutes. 2/28/10 12/10/09 12/10/09 215.1 No
NCTD
302 Will terminate at Vista Transit Center instead of Thibodo Road/Thibodo Court. 1/24/10 9/3/09 Not Required 34.8 No
305 Will be extended to Vista Transit Center via South Santa Fe Ave instead of terminating at Thibodo Road/Thibodo Court.
1/24/10 9/3/09 Not Required 36.6 No
315 Adjustment to daily hours of service on all days. 1/24/10 9/3/09 Not Required 12 No
317 Will operate during weekday rush hours only and will no longer serve El Corazon Senior Center. 1/24/10 9/3/09 Not Required 14.6 No
318 Will terminate at El Camino Real SPRINTER station rather than Rancho Del Oro station. Adjustment to weekday and Saturday hours of service. Sunday and holiday service has been discontinued.
1/24/10 9/3/09 Not Required 22.8 No
319 Weekday service only. Will terminate at MiraCosta College instead of Quarry Creek. Northbound trips will serve either El Corazon Senior Center or the Ocean Ranch Business Park before proceeding to Rancho Del Oro station.
1/24/10 9/3/09 Not Required 16.9 No
321 Weekday rush-hour service only. Midday and evening trips between Carlsbad Village and Legoland have been discontinued.
1/24/10 9/3/09 Not Required 9.6 No
325 Adding Saturday service, operating every 90 minutes between Plaza Camino Real and College Boulevard SPRINTER station.
1/24/10 9/3/09 Not Required 18.7 No
331 New van shuttle operating between the Buena Creek SPRINTER station and Kaplan College via Robelini Drive and University Drive. This service partially replaces existing Route 302 and 305 service on Robelini Drive. This is a seven-day-a-week service, with timed connections with SPRINTER service.
1/24/10 9/3/09 Not Required NA No
395 Daily hours and frequency of service have been adjusted on all days. All trips will operate between Oceanside Transit Center and Carl’s Jr. in San Clemente.
1/24/10 9/3/09 Not Required 8.4 No
New times scheduled 10/5/09 No Hearing Not Required 181.8 Yes3 Coaster
Padres trains added 4/5/10 No Hearing Not Required 181.8 Yes3
1 Public hearings or Title VI analysis is not conducted for minor service changes (a change to less than 25% of the service). 2 Passengers per revenue-hour are based on performance along the entire route. This statistic may not reflect the route segment or time of day actually impacted by the adjustments. 3 All revised services and service adjustments of regional significance were found to be consistent with the goals and objectives of the Coordinated Plan.
CHAPTER 10: IMPLEMENTATION
The Coordinated Plan (2010 – 2014) 10-13
Service Enhancements or Additions Beyond necessary service cuts or restructuring activities, the RSIP also includes a list of service enhancements or additions planned for the five-year Coordinated Plan implementation period (FY 2010-2014). Additionally, SANDAG is currently developing several key transit projects which will be implemented over the next five years. Detailed descriptions of these projects are included below. The SANDAG transit projects and services are included in the Program of Projects Expenditure Plan in the TransNet sales tax extension approved by the San Diego County voters in November 2004. The budget worksheets for these projects (as included in the SANDAG FY 2011 Program Budget) are included in Appendix B.
SUPERLOOP
The SuperLoop is a new, two-way circular transit system that serves the north University City area of San Diego. The initial service began in June 2009 connecting University Towne Centre (UTC) to University of California, San Diego (UCSD) and the surrounding residential communities. Features of the SuperLoop include ten-minute peak headways between vehicles and uniquely branded vehicles with low-emission technology. The second phase of the project will include priority traffic treatments, such as signal prioritization, queue jumper lanes, and enhanced stations with “next bus” electronic messaging and station platforms custom built for easy boarding. In September 2010 the route was extended to serve La Jolla Colony south of Nobel Drive on a trial basis to assess potential ridership. Additionally, the planned final phase also will extend the route to the area east of UTC scheduled to begin in January 2011.
MID-CITY RAPID BUS
The Mid-City Rapid Bus Project includes the design and implementation of a ten-mile rapid bus line from San Diego State University (SDSU) to downtown San Diego along El Cajon and Park Boulevards. The line will provide North Park, City Heights, and College area residents, students, and visitors with a high-quality service. Major activity centers that will be served include the downtown Trolley stations, Balboa Park, San Diego Zoo, the Mid-City communities, and SDSU.
The project will provide faster travel times and increased reliability by using bus-only pockets at key intersections, priority lanes, traffic signal improvements, and enhanced stations. Stations will include ticket vending machines, upgraded shelters, passenger information signs, level platforms to ease boarding, landscaping, and upgraded paving.
INTERSTATE (I-) 15 EXPRESS LANES/BUS RAPID TRANSIT (BRT) PROJECT
The I-15 Express Lanes and BRT project is scheduled for completion in 2012. The I-15 Express Lanes will ultimately feature four lanes with a moveable barrier for maximum flexibility (similar to the moveable barriers on the San Diego-Coronado Bridge), multiple access points to the general purpose highway lanes, and direct access ramps (DARs) from five BRT stations for high-frequency BRT service, carpoolers, and Fastrak users. BRT stations and DARs have opened at Del Lago (southern Escondido), Rancho Bernardo, and Sabre Springs, with an additional DAR to open at Hale Avenue to provide access to the existing Escondido Transit Center in 2011and a BRT station and DAR in Mira Mesa in 2014.
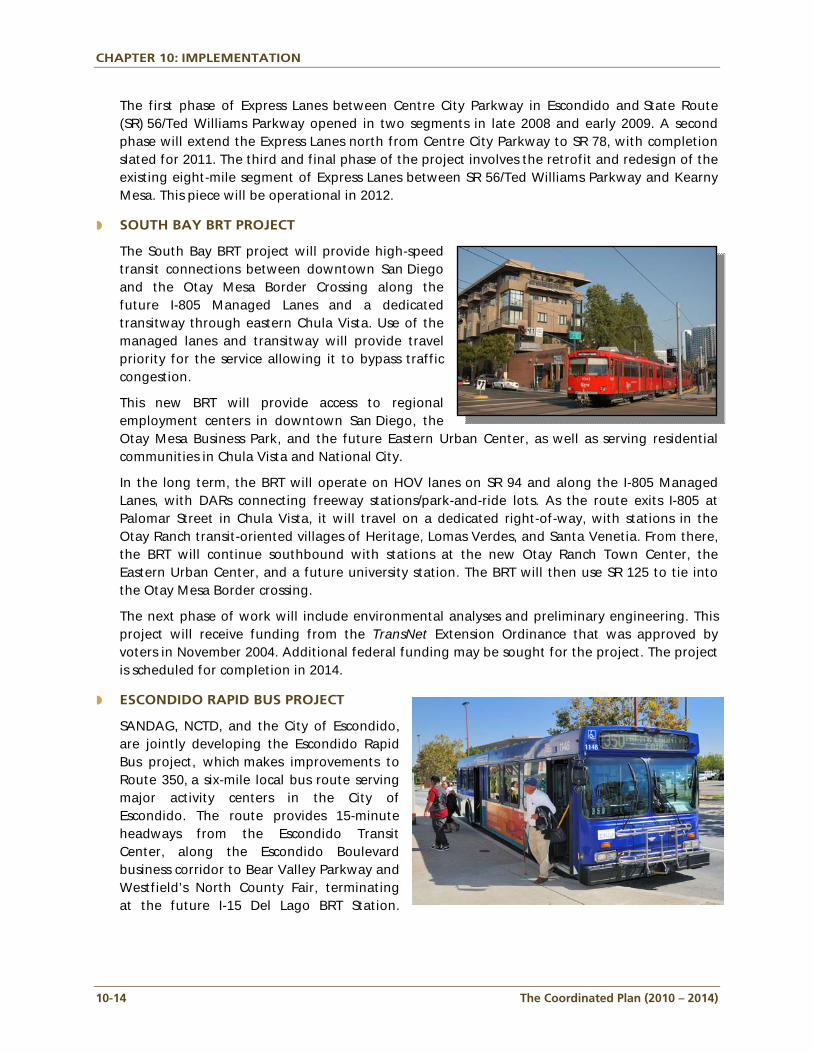
CHAPTER 10: IMPLEMENTATION
10-14 The Coordinated Plan (2010 – 2014)
The first phase of Express Lanes between Centre City Parkway in Escondido and State Route (SR) 56/Ted Williams Parkway opened in two segments in late 2008 and early 2009. A second phase will extend the Express Lanes north from Centre City Parkway to SR 78, with completion slated for 2011. The third and final phase of the project involves the retrofit and redesign of the existing eight-mile segment of Express Lanes between SR 56/Ted Williams Parkway and Kearny Mesa. This piece will be operational in 2012.
SOUTH BAY BRT PROJECT
The South Bay BRT project will provide high-speed transit connections between downtown San Diego and the Otay Mesa Border Crossing along the future I-805 Managed Lanes and a dedicated transitway through eastern Chula Vista. Use of the managed lanes and transitway will provide travel priority for the service allowing it to bypass traffic congestion.
This new BRT will provide access to regional employment centers in downtown San Diego, the Otay Mesa Business Park, and the future Eastern Urban Center, as well as serving residential communities in Chula Vista and National City.
In the long term, the BRT will operate on HOV lanes on SR 94 and along the I-805 Managed Lanes, with DARs connecting freeway stations/park-and-ride lots. As the route exits I-805 at Palomar Street in Chula Vista, it will travel on a dedicated right-of-way, with stations in the Otay Ranch transit-oriented villages of Heritage, Lomas Verdes, and Santa Venetia. From there, the BRT will continue southbound with stations at the new Otay Ranch Town Center, the Eastern Urban Center, and a future university station. The BRT will then use SR 125 to tie into the Otay Mesa Border crossing.
The next phase of work will include environmental analyses and preliminary engineering. This project will receive funding from the TransNet Extension Ordinance that was approved by voters in November 2004. Additional federal funding may be sought for the project. The project is scheduled for completion in 2014.
ESCONDIDO RAPID BUS PROJECT
SANDAG, NCTD, and the City of Escondido, are jointly developing the Escondido Rapid Bus project, which makes improvements to Route 350, a six-mile local bus route serving major activity centers in the City of Escondido. The route provides 15-minute headways from the Escondido Transit Center, along the Escondido Boulevard business corridor to Bear Valley Parkway and Westfield’s North County Fair, terminating at the future I-15 Del Lago BRT Station.
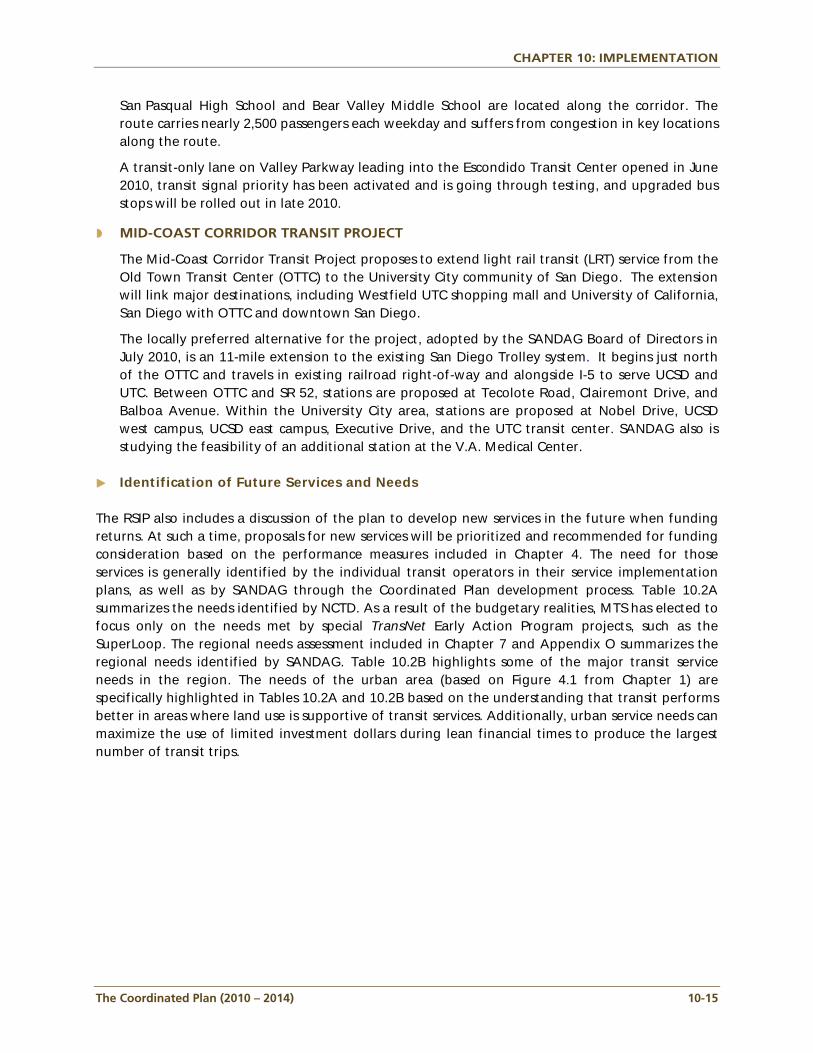
CHAPTER 10: IMPLEMENTATION
The Coordinated Plan (2010 – 2014) 10-15
San Pasqual High School and Bear Valley Middle School are located along the corridor. The route carries nearly 2,500 passengers each weekday and suffers from congestion in key locations along the route.
A transit-only lane on Valley Parkway leading into the Escondido Transit Center opened in June 2010, transit signal priority has been activated and is going through testing, and upgraded bus stops will be rolled out in late 2010.
MID-COAST CORRIDOR TRANSIT PROJECT
The Mid-Coast Corridor Transit Project proposes to extend light rail transit (LRT) service from the Old Town Transit Center (OTTC) to the University City community of San Diego. The extension will link major destinations, including Westfield UTC shopping mall and University of California, San Diego with OTTC and downtown San Diego.
The locally preferred alternative for the project, adopted by the SANDAG Board of Directors in July 2010, is an 11-mile extension to the existing San Diego Trolley system. It begins just north of the OTTC and travels in existing railroad right-of-way and alongside I-5 to serve UCSD and UTC. Between OTTC and SR 52, stations are proposed at Tecolote Road, Clairemont Drive, and Balboa Avenue. Within the University City area, stations are proposed at Nobel Drive, UCSD west campus, UCSD east campus, Executive Drive, and the UTC transit center. SANDAG also is studying the feasibility of an additional station at the V.A. Medical Center.
Identification of Future Services and Needs
The RSIP also includes a discussion of the plan to develop new services in the future when funding returns. At such a time, proposals for new services will be prioritized and recommended for funding consideration based on the performance measures included in Chapter 4. The need for those services is generally identified by the individual transit operators in their service implementation plans, as well as by SANDAG through the Coordinated Plan development process. Table 10.2A summarizes the needs identified by NCTD. As a result of the budgetary realities, MTS has elected to focus only on the needs met by special TransNet Early Action Program projects, such as the SuperLoop. The regional needs assessment included in Chapter 7 and Appendix O summarizes the regional needs identified by SANDAG. Table 10.2B highlights some of the major transit service needs in the region. The needs of the urban area (based on Figure 4.1 from Chapter 1) are specifically highlighted in Tables 10.2A and 10.2B based on the understanding that transit performs better in areas where land use is supportive of transit services. Additionally, urban service needs can maximize the use of limited investment dollars during lean financial times to produce the largest number of transit trips.
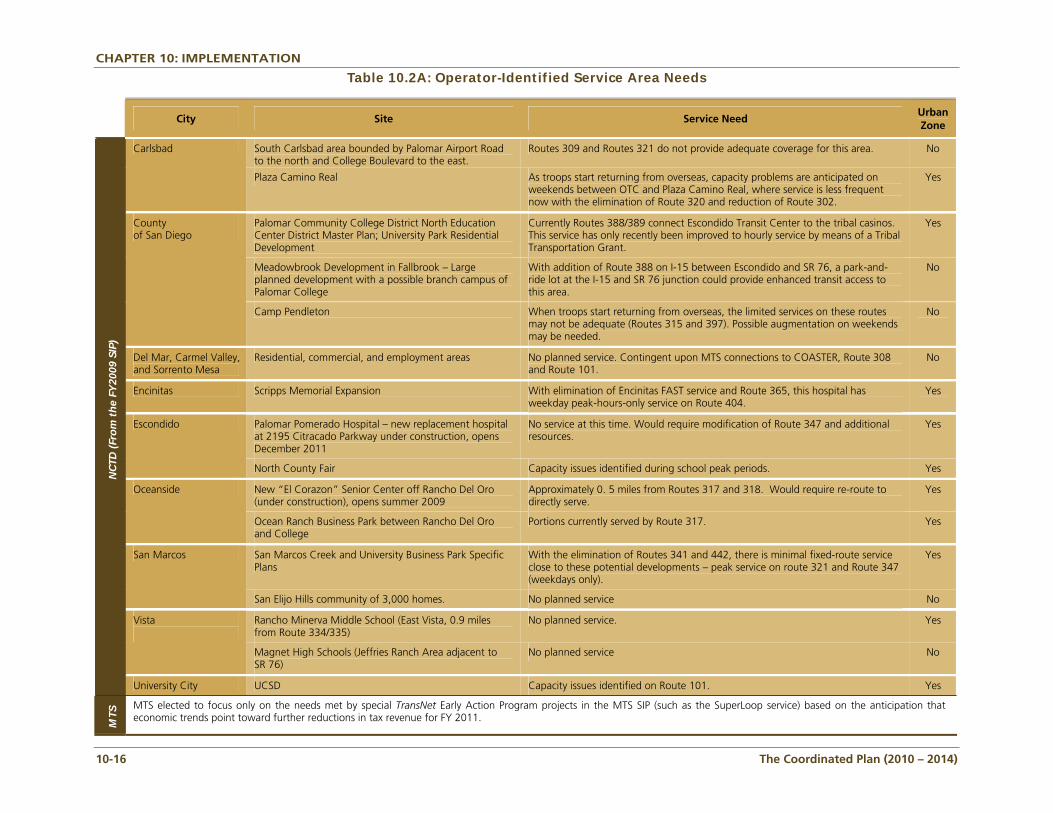
CHAPTER 10: IMPLEMENTATION
10-16 The Coordinated Plan (2010 – 2014)
Table 10.2A: Operator-Identified Service Area Needs
City Site Service Need
Urban Zone
South Carlsbad area bounded by Palomar Airport Road to the north and College Boulevard to the east.
Routes 309 and Routes 321 do not provide adequate coverage for this area. No Carlsbad
Plaza Camino Real As troops start returning from overseas, capacity problems are anticipated on weekends between OTC and Plaza Camino Real, where service is less frequent now with the elimination of Route 320 and reduction of Route 302.
Yes
Palomar Community College District North Education Center District Master Plan; University Park Residential Development
Currently Routes 388/389 connect Escondido Transit Center to the tribal casinos. This service has only recently been improved to hourly service by means of a Tribal Transportation Grant.
Yes
Meadowbrook Development in Fallbrook – Large planned development with a possible branch campus of Palomar College
With addition of Route 388 on I-15 between Escondido and SR 76, a park-and-ride lot at the I-15 and SR 76 junction could provide enhanced transit access to this area.
No
County of San Diego
Camp Pendleton When troops start returning from overseas, the limited services on these routes may not be adequate (Routes 315 and 397). Possible augmentation on weekends may be needed.
No
Del Mar, Carmel Valley, and Sorrento Mesa
Residential, commercial, and employment areas No planned service. Contingent upon MTS connections to COASTER, Route 308 and Route 101.
No
Encinitas Scripps Memorial Expansion With elimination of Encinitas FAST service and Route 365, this hospital has weekday peak-hours-only service on Route 404.
Yes
Palomar Pomerado Hospital – new replacement hospital at 2195 Citracado Parkway under construction, opens December 2011
No service at this time. Would require modification of Route 347 and additional resources.
Yes Escondido
North County Fair Capacity issues identified during school peak periods. Yes
New “El Corazon” Senior Center off Rancho Del Oro (under construction), opens summer 2009
Approximately 0. 5 miles from Routes 317 and 318. Would require re-route to directly serve.
Yes Oceanside
Ocean Ranch Business Park between Rancho Del Oro and College
Portions currently served by Route 317. Yes
San Marcos Creek and University Business Park Specific Plans
With the elimination of Routes 341 and 442, there is minimal fixed-route service close to these potential developments – peak service on route 321 and Route 347 (weekdays only).
Yes San Marcos
San Elijo Hills community of 3,000 homes. No planned service No
Rancho Minerva Middle School (East Vista, 0.9 miles from Route 334/335)
No planned service. Yes Vista
Magnet High Schools (Jeffries Ranch Area adjacent to SR 76)
No planned service No
NC
TD (
Fro
m t
he
FY20
09 S
IP)
University City UCSD Capacity issues identified on Route 101. Yes
MTS
MTS elected to focus only on the needs met by special TransNet Early Action Program projects in the MTS SIP (such as the SuperLoop service) based on the anticipation that economic trends point toward further reductions in tax revenue for FY 2011.
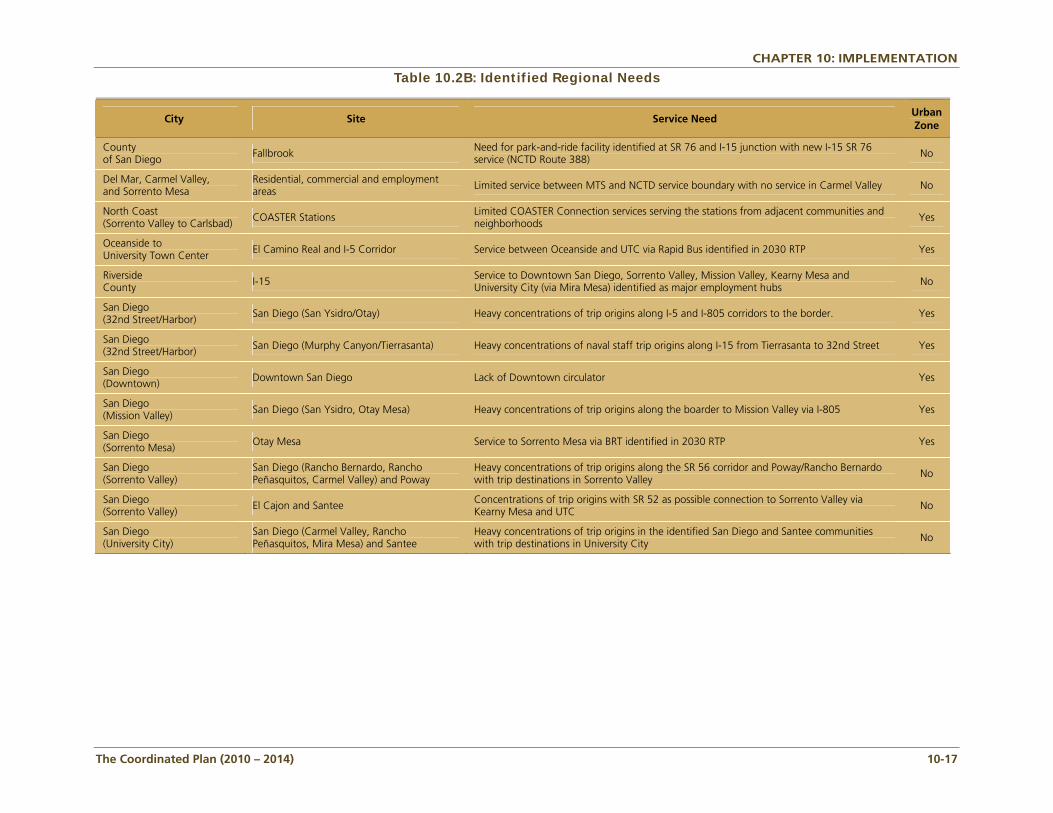
CHAPTER 10: IMPLEMENTATION
The Coordinated Plan (2010 – 2014) 10-17
Table 10.2B: Identified Regional Needs
City Site Service Need Urban Zone
County of San Diego Fallbrook Need for park-and-ride facility identified at SR 76 and I-15 junction with new I-15 SR 76
service (NCTD Route 388) No
Del Mar, Carmel Valley, and Sorrento Mesa
Residential, commercial and employment areas Limited service between MTS and NCTD service boundary with no service in Carmel Valley No
North Coast (Sorrento Valley to Carlsbad)
COASTER Stations Limited COASTER Connection services serving the stations from adjacent communities and neighborhoods
Yes
Oceanside to University Town Center
El Camino Real and I-5 Corridor Service between Oceanside and UTC via Rapid Bus identified in 2030 RTP Yes
Riverside County I-15 Service to Downtown San Diego, Sorrento Valley, Mission Valley, Kearny Mesa and
University City (via Mira Mesa) identified as major employment hubs No
San Diego (32nd Street/Harbor) San Diego (San Ysidro/Otay) Heavy concentrations of trip origins along I-5 and I-805 corridors to the border. Yes
San Diego (32nd Street/Harbor)
San Diego (Murphy Canyon/Tierrasanta) Heavy concentrations of naval staff trip origins along I-15 from Tierrasanta to 32nd Street Yes
San Diego (Downtown) Downtown San Diego Lack of Downtown circulator Yes
San Diego (Mission Valley) San Diego (San Ysidro, Otay Mesa) Heavy concentrations of trip origins along the boarder to Mission Valley via I-805 Yes
San Diego (Sorrento Mesa)
Otay Mesa Service to Sorrento Mesa via BRT identified in 2030 RTP Yes
San Diego (Sorrento Valley)
San Diego (Rancho Bernardo, Rancho Peñasquitos, Carmel Valley) and Poway
Heavy concentrations of trip origins along the SR 56 corridor and Poway/Rancho Bernardo with trip destinations in Sorrento Valley
No
San Diego (Sorrento Valley) El Cajon and Santee Concentrations of trip origins with SR 52 as possible connection to Sorrento Valley via
Kearny Mesa and UTC No
San Diego (University City)
San Diego (Carmel Valley, Rancho Peñasquitos, Mira Mesa) and Santee
Heavy concentrations of trip origins in the identified San Diego and Santee communities with trip destinations in University City No
CHAPTER 10: IMPLEMENTATION
10-18 The Coordinated Plan (2010 – 2014)
10.3 Looking Ahead SANDAG and the transit agencies have continued to evaluate the need for enhanced services based on the knowledge of changing development, demographics, fuel prices, or gaps in service from current service cuts. Additionally, the CTSA also is developing ways to serve other passengers in the region in areas outside of the transit coverage area. MTS developed a comprehensive operations analysis (COA) in 2005, with the full implementation period occurring through FY 2007. MTS will continue to monitor operations consistent with MTS Policy 42, which was amended in 2007 to incorporate the vision for MTS services developed in the COA: services that are productive; customer-focused; competitive with other travel options; integrated; and sustainable. Additionally, MTS conducted a weekend service analysis in 2009 and utilized the results to adjust weekend services in 2010. NCTD is currently in the process of preparing its Mobility Plan that will recommend a restructuring of existing services to develop a financially sustainable route network in North County. The recommendations adopted as a result of completing the Mobility Plan will provide significant information that will be required to develop the FY 2012 SIP. SANDAG completed a transit impediments study in FY2009 which explored alternative funding sources for transit in the San Diego region. The results of this study are summarized in the Chapter 9 (Funding), with the various options currently being explored by SANDAG executive leadership. Additionally, SANDAG has significantly enhanced its technical transit database with the purchase of an advanced software program (RideCheck Plus). This program allows for the rapid delivery to planners and schedulers, transit statistics on a region, agency, route-by-route, or even stop-by-stop level, including GIS capabilities. Furthermore, SANDAG has the ability to significantly fund the planning, construction, and operations of regional transit services through the extension of the TransNet half-cent sales tax measure. This measure will fund the SuperLoop, Mid-City Rapid Bus, I-15 Managed Lanes BRT, and South Bay BRT projects discussed in the “Service Enhancements or Additions” section.
10.4 Post Implementation Monitoring The Coordinated Plan includes the evaluation of transportation system performance using the performance measures and indicators developed in the original plan. In the future, the document will add more quantitative analysis on a regional basis as more data becomes available on public transit and supplementary transportation providers. New technologies also are being implemented in transit, including automatic vehicle location devices, the Compass Card, and automatic passenger counting devices. These new technologies will increase the amount of data available when future plans are being produced. The timeliness of the data and the accuracy also should be improved. Future plans will address the data priorities and recommend where efforts should be made to improve the flow of information.
CHAPTER 10: IMPLEMENTATION
The Coordinated Plan (2010 – 2014) 10-19
Currently, very little data is available on transportation coordination or the human service transportation system. As SANDAG becomes more involved in funding these services, it is expected that more information will become available on the performance of these systems. The performance data will be fed back into the planning process, and priorities may be adjusted.
10.5 Unforeseen Events This plan has been prepared based on the best information available and the current guidance and priorities from senior levels of government. Unforeseen events, such as escalations in fuel prices, changes to funding formulae, or annual appropriations, could impact local transportation operations. All publicly funded transportation operations in San Diego are operating in a financially constrained environment and have very little room to maneuver. The transit agency budget cycles were more constrained over the past fiscal year with Transportation Development Act and TransNet funding estimates significantly revised downward due to less than anticipated sales tax revenue. It was hoped that public transit would receive additional state “spillover” funds that result when higher gasoline prices and related sales taxes increase at a faster rate than other taxable items. Unfortunately, the state legislature diverted these public transportation funds to the state’s general fund leaving transit agencies with major funding deficits in their operating budgets. In FY 2010 some of these funds began to return to transit in the form of the gas tax “swaps” embedded in ABs 6 and 9 (March 2010). In addition, the success of the future projects or plans, such as the NCTD Mobility Plan, the I-15 and South Bay BRT, and Mid-City Rapid Bus projects later in this plan period, have the potential to significantly change the baseline levels of transit ridership and performance in San Diego. The combined impact of these changes may cause significant changes to this plan over next five years.