Embed Size (px)
Citation preview
The copyright © of this thesis belongs to its rightful author and/or other copyright
owner. Copies can be accessed and downloaded for non-commercial or learning
purposes without any charge and permission. The thesis cannot be reproduced or
quoted as a whole without the permission from its rightful owner. No alteration or
changes in format is allowed without permission from its rightful owner.
i
THE MODERATING EFFECT OF ENVIRONMENTAL
REGULATION AND POLICY ON THE RELATIONSHIP
BETWEEN TOTAL QUALITY MANAGEMENT (TQM)
AND ORGANIZATIONAL PERFORMANCE IN THE
MALAYSIAN FOOD AND BEVERAGE COMPANIES
AKANMU MUSLIM DIEKOLA
MASTER OF SCIENCE
UNIVERSITI UTARA MALAYSIA
JUNE 2016
ii
THE MODERATING EFFECT OF ENVIRONMENTAL
REGULATION AND POLICY ON THE RELATIONSHIP
BETWEEN TOTAL QUALITY MANAGEMENT (TQM)
AND ORGANIZATIONAL PERFORMANCE IN THE
MALAYSIAN FOOD AND BEVERAGE COMPANIES
By
AKANMU MUSLIM DIEKOLA
Thesis Submitted to
School of Technology Management and Logistics,
Universiti Utara Malaysia,
In Fulfillment of the Requirement for the Degree of Master of
Science.
iii
PERMISSION TO USE
In presenting this thesis in fulfillment of the requirements for a Post Graduate degree
from the Universiti Utara Malaysia (UUM), I agree that the Library of this university
may make it freely available for inspection. I further agree that permission for copying
this thesis in any manner, in whole or in part, for scholarly purposes may be granted by
my supervisor(s) or in their absence, by the Dean of School of Technology Management
and Logistics where I did my thesis. It is understood that any copying or publication or
use of this thesis or parts of it for financial gain shall not be allowed without my written
permission. It is also understood that due recognition shall be given to me and to the
UUM in any scholarly use which may be made of any material in my thesis.
Requests for the grant permission to copy or to make other use of the material in this
thesis, in whole or in part should be addressed to:
Dean of School of Technology Management and Logistics
Universiti Utara Malaysia
06010, UUM Sintok
Kedah Darul Aman
iv
ABSTRACT
There have been inconsistent findings in the literature concerning the relationships between
TQM and organizational performance. Hence this research has prompted further
investigation on the effect of other variables that may better explain the nature of these links.
In the related literatures, many theories have suggested that the compatibility between
strategies, resources, and capabilities are the keys for organizational success. The main
purpose of this study is to investigate the moderating effects of environmental regulation and
policy (ERP) on the relationship between total quality management (TQM) and
organizational performance (OP). Quality assurance (QA) and continuous process
improvement (CPI) as TQM elements considered in this study were moderated with their
respective relationships with organizational performance. Therefore, to achieve this purpose,
this study has integrated different theories such as the contingency and the institutional
theories in order to provide the effect of QA and CPI on successful strategy implementation.
Questionnaires were distributed to 250 Malaysian food and beverages companies. 71
questionnaires were returned and used in the analysis using the PLS-SEM. Studies revealed
that TQM can be divided into the management or soft aspects (management concepts and
principles) of TQM and the technical or hard aspects (management tools and techniques)
of TQM . This study is exclusively based on the soft elements of TQM. The results of this
study revealed that QA and CPI have always been significant predictors of organizational
performance by following the regulations and policy related to environment. More
importantly, the results have also confirmed the moderating effect of environmental
regulation and policy on the relationships between TQM and organizational performance.
This study also supported the premises of the contingency theory and the institutional theory
by reaffirming the importance of the supportive ERP for any successful strategy
implementation in enhancing organizational performance through the implementation of
innovative practices. However, this result cannot be generalized as data were collected
through a cross-sectional approach. Future research can extend it to longitudinal research.
Keywords: total quality management, quality assurance, continuous process
improvement, organizational performance, environmental regulation and policy.
v
ABSTRAK
Terdapat penemuan yang tidak konsisten dalam literatur mengenai hubungan antara TQM
dan prestasi organisasi. Oleh itu kajian ini telah mendorong penyelidikan lanjut mengenai
kesan pemboleh ubah lain yang boleh menjelaskan sifat pautan ini dengan lebih baik.
Dalam literatur yang berkaitan, banyak teori mencadangkan bahawa keserasian antara
strategi, sumber, dan keupayaan adalah kunci bagi kejayaan organisasi. Tujuan utama
kajian ini adalah untuk mengkaji kesan pengantara peraturan alam sekitar dan dasar
(ERP) mengenai hubungan antara pengurusan kualiti menyeluruh (TQM) dan prestasi
organisasi (OP). Jaminan kualiti (QA) dan peningkatan proses yang berterusan (CPI)
sebagai elemen TQM yang dipertimbangkan dalam kajian ini menjadi pengantara dalam
hubungan masing-masing dengan prestasi organisasi. Oleh itu, untuk mencapai tujuan
ini, kajian telah menyepadukan teori yang berbeza iaitu teori kontingensi dan teori
institusi untuk mendapatkan kesan QA dan CPI dalam pelaksanaan strategi yang berjaya.
Borang soal selidik telah diedarkan kepada 250 buah syarikat makanan dan minuman di
Malaysia. 71 soal selidik telah dikembalikan dan digunakan dalam analisis menggunakan
PLS-SEM. Kajian mendedahkan bahawa TQM boleh dibahagikan kepada aspek
pengurusan atau insaniah (konsep pengurusan dan prinsip) TQM dan aspek teknikal atau
tekal (alat pengurusan dan teknik) TQM. Kajian ini adalah berdasarkan unsur-unsur
insaniah TQM semata-mata. Dapatan kajian ini menunjukkan bahawa QA dan CPI
sentiasa menjadi peramal yang signifikan bagi prestasi organisasi dengan mematuhi
peraturan-peraturan dan dasar yang berkaitan dengan alam sekitar. Lebih penting lagi,
dapatan kajian juga telah mengesahkan kesan pengantara peraturan dan dasar alam
sekitar ke atas hubungan antara TQM dan prestasi organisasi. Kajian ini juga menyokong
premis teori kontingensi dan teori institusi dengan menegaskan kepentingan ERP
sokongan terhadap mana-mana pelaksanaan strategi yang berjaya dalam meningkatkan
prestasi organisasi melalui pelaksanaan amalan inovatif. Walau bagaimanapun, dapatan
ini tidak dapat diitlak memandangkan data hanya dikumpulkan melalui pendekatan
keratan rentas. Kajian masa hadapan boleh dilanjutkan kepada kajian longitud.
Kata kunci: pengurusan kualiti menyeluruh, jaminan kualiti, peningkatan proses yang
berterusan, prestasi organisasi, peraturan dan dasar alam sekitar.
vi
ACKNOWLEDGEMENT
All Praise is due to ALLAH, the Lord of the whole universe, and may His blessing be
upon the noblest Prophet Muhammad, his households, companions and the entire Muslim
populace till the Day of Judgment. First and foremost, I would like to express my
heartfelt thanks and gratitude to Allah S.W.T for His mercy on the successful completion
of this project.
In completing this research, I would like to acknowledge the effort of my supervisors, Dr.
Ahmad Yusni Bahahdin and Dr. Roslan Jamaludin for their professional guidance and
precious times spent with me to reach this level. I would also like to express my
appreciations to all my friends and colleagues for their intellectual sharing of knowledge
and constructive comments plus suggestions to make this project a reality.
Undoubtedly, this thesis would have been impossible to complete without the assistance
of the top management and other employees of Malaysian food and beverage companies.
Special thanks to my father, mother, brothers, sisters and all my family members, your
support and prayer is appreciated.
vii
TABLE OF CONTENT
PERMISSION TO USE ................................................................................................... iii
ABSTRACT ...................................................................................................................... iv
ABSTRAK ......................................................................................................................... v
ACKNOWLEDGEMENT ............................................................................................... vi
TABLE OF CONTENT .................................................................................................. vii
LIST OF FIGURES ......................................................................................................... xi
LIST OF TABLES .......................................................................................................... xii
LIST OF ABBREVIATION.......................................................................................... xiii
CHAPTER ONE ............................................................................................................... 1
INTRODUCTION............................................................................................................. 1
1.1 Research Background ............................................................................................... 1
1.2 Problem Statement .................................................................................................... 5
1.3 Research Questions ................................................................................................. 11
1.4 Research Objectives ................................................................................................ 11
1.5 Research Methodology ........................................................................................... 12
1.6 Significance of the Study ........................................................................................ 12
1.7 Scope of the study ................................................................................................... 16
1.8 Summary .................................................................................................................. 17
CHAPTER TWO ............................................................................................................ 18
LITERATURE REVIEW .............................................................................................. 18
2.1 Introduction ............................................................................................................. 18
2.2 The State of Food and Beverage Companies in Malaysia ...................................... 18
2.3 Organizational Performance (OP) ............................................................................... 22
2.3.1 Measurement of Organizational Performance ...................................................... 24
2.3.1.1 Customer Satisfaction .................................................................................... 26
2.3.1.2 Operational Performance ............................................................................... 29
2.3.1.3 Financial Performance ................................................................................... 31
2.4 Total Quality Management (TQM) .......................................................................... 34
2.4.1 Total Quality Management (TQM) Definitions ................................................... 42
viii
2.4.2 The Benefits of Total Quality Management (TQM) ............................................ 45
2.4.3 The Elements of Total Quality Management (TQM)........................................... 46
2.4.3.1 Continuous Process Improvement ................................................................. 49
2.4.3.2 Quality Assurance .......................................................................................... 51
2.5 Environmental Regulation and Policy (ERP) ............................................................. 54
2.5.1 Environmental Legislations in Malaysia .............................................................. 56
2.5.2 Environmental Quality Act (EQA) of 1974 in Malaysia ..................................... 57
2.6 The Relationship between TQM, OP & ERP ........................................................... 60
2.6.1 TQM-OP Research ............................................................................................... 61
2.6.2 TQM-ERP Research ............................................................................................. 65
2.6.3 ERP-OP Research ................................................................................................ 67
2.7 Related Theories ....................................................................................................... 71
2.8 The Connection of Contingency Theory, Institutional Theory and this Study ......... 72
2.9 Research Constructs and Measuring Dimensions ..................................................... 74
2.9.1 Operational Definition and Measuring Dimensions on Organizational
Performance (OP) .......................................................................................................... 74
2.9.2 Operational Definition and Measuring Dimensions of TQM .............................. 75
2.9.2.1 Quality Assurance .......................................................................................... 75
2.9.2.2 Continuous Process Improvement ................................................................. 76
2.9.3 Operational Definition and Measuring Dimensions of ERP ................................ 76
2.10 Conceptualizing the Theoretical Framework .......................................................... 77
2.11 Hypothesis Formulation ............................................................................................ 78
2.12 Summary ................................................................................................................... 79
CHAPTER THREE ........................................................................................................ 80
RESEARCH METHODOLOGY .................................................................................. 80
3.1 Introduction ............................................................................................................... 80
3.2 Research Paradigm.................................................................................................... 80
3.3 Research Design........................................................................................................ 81
3.4 Research Approach ................................................................................................... 82
3.5 Data Collection Procedure ........................................................................................ 84
3.5.1 Instrumentation................................................................................................... 85
ix
3.5.1.1 The Questionnaire Structure .......................................................................... 85
3.5.1.2 Scale of the Questionnaire ............................................................................. 86
3.5.2 Reliability and Validity of Measurement Items ................................................... 94
3.5.3 Population of the Study ...................................................................................... 94
3.5.3.1 Sample of the Study ..................................................................................... 95
3.5.3.2 Sample Size ................................................................................................... 96
3.5.3.3 Sampling Technique ...................................................................................... 97
3.5.4 Unit of Analysis ................................................................................................... 98
3.5.5 Technique of Data Analyses ................................................................................ 98
3.6 Summary ................................................................................................................... 100
CHAPTER FOUR ......................................................................................................... 101
DATA ANALYSIS AND FINDINGS .......................................................................... 101
4.1 Introduction ............................................................................................................... 101
4.2 Demographic Distribution of the Respondents ......................................................... 102
4.3 The Rationale behind Choosing PLS SEM for this Study ........................................ 103
4.3.1 Test of Linearity ................................................................................................. 104
4.3.2 Multicollinearity Test ......................................................................................... 104
4.4 Testing the Goodness of the Measurements ............................................................. 105
4.4.1 Testing the Measurement, Outer, Model Using PLS Approach ........................ 105
4.4.1.1 The Construct Validity ................................................................................ 106
4.4.2 The First-Order Constructs................................................................................. 112
4.4.3 The Assessment of the Inner Model and Hypotheses Testing Procedures ........ 113
4.4.4 Testing the Moderating Effect of Environmental Regulations and Policy ........ 115
4.4.5 The Predictive Relevance of the Model ............................................................. 116
4.4.5.1 Cross-Validated Redundancy ...................................................................... 116
4.4.5.2 R-square ....................................................................................................... 117
4.4.5.3 Effect size .................................................................................................... 118
4.4.6 The Goodness of Fit of the Whole Model .......................................................... 119
4.5 Summary of the findings ........................................................................................... 120
CHAPTER FIVE .......................................................................................................... 122
DISCUSSIONS, CONCLUSIONS AND RECOMMENDATIONS ......................... 122
x
5.1 Introduction ............................................................................................................... 122
5.2 Discussion ................................................................................................................. 122
5.3 Discussion on Research Objectives .......................................................................... 128
5.3.1 Relationship between TQM and Organizational Performance .......................... 128
5.3.2 Quality Assurance and Organizational Performance ......................................... 130
5.3.3 Continuous Process Improvement and Organization Performance.................... 131
5.3.4 The Moderating Role of Environmental Regulation and Policy between Total
Quality Management (TQM) and Organizational Performance (OP) ......................... 133
5.4 Conclusions ............................................................................................................... 134
5.4.1 Contributions of the Study ................................................................................. 134
5.4.1.1 Contributions to the Literature .................................................................... 134
5.4.1.2 Practical Contributions ................................................................................ 137
5.4.1.3 Contributions to Knowledge ........................................................................ 139
5.5 Limitations of the Study............................................................................................ 141
5.6 Recommendations for Future Research .................................................................... 142
REFERENCES .............................................................................................................. 146
Appendix A .................................................................................................................... 188
xi
LIST OF FIGURES
Figure 1.1: Previous researches on effects of different moderating variables
on relationship between TQM and organizational performance
8
Figure 2.1: Conceptual Research Model linking Total Quality Management,
Organizational Performance and Environmental regulation and
policy
70
Figure 3.1: Research Methodological Framework 76
Figure 4.1:
The Research Model
98
Figure 4.2:
First Order Measurement Model of TQM- CP
104
Figure 4.3:
Path Model Significance Results
105
Figure 5.1: The Research Empirical Model linking Supported Quality
Assurance’s and Continuous Process Improvement’s Dimensions,
with Organizational Performance and Environmental Regulation
and policy
125
xii
LIST OF TABLES
Table 1.1: Limitations of the past works on TQM and organizational
performance.
13
Table 2.1: Sample of Previous Studies on OP Measures
24
Table 2.2: Different stages of TQM and their characteristics. 33
Table 3.1: Quality assurance Coding
82
Table 3.2
Continuous Process Improvement Coding 84
Table 3.3:
Environmental regulation and policy Coding 85
Table 3.4:
Organizational Performance Coding
87
Table 3.5:
Determination of Sample Size through G-Power Analysis
(Green.1991)
91
Table 4.1
Participants’ Demographic Information
95
Table 4.2
Multicollinearity Test
98
Table 4.3
Factor Analysis and Loading of the items (Cross Loadings)
100
Table 4.4
The Convergent Validity Analysis
102
Table 4.5
The Discriminant Validity Matrix (Latent Variable Correlation)
104
Table 4.6
The Results of the Inner Structural Model
105
Table 4.7
Testing the Moderating Effect of Environmental Regulation and
Policy
108
Table 4.8
Predictive Quality Indicators of the Model
110
Table 4.9
Direct Effect IV-DV
111
Table 4.10
Direct Effect MV- IV
112
Table 4.11
Summary of the Results
113
xiii
LIST OF ABBREVIATION
AFP
Aggressive Financing Policy
AFTA
Asean Free Trade Agreement
ASEAN
Association of South East Asian Nations
CEO
Central Executive Officer
CEP
Corporate Environmental Performance
CFP
Corporate Financial Performance
CI
Continuous Improvement
CIIPM
Continuous Improvement of International Project Management
CLD
Causal Loop Diagram
CSR
Corporate Social Responsibility
DEA
Data Envelopment Analysis
EFQM
European Foundation Quality Management
ERP
Environmental Regulation and Policy
EUI
Energy Use Intensity
xiv
EVA
Economic Value Added
GLS
Generalized Least Squares
IFAC
International Federations of Accountants
ISO
International Standard Organization
KBS
Knowledge Based System
KM
Knowledge Management
LPS
Lean Production System
MCS
Management Control Systems
NAM
Norm Activation Model
OCP
Organizational Culture Profile
OEE
Overall Equipment Effectiveness
OP
Organizational Performance
PLS
Partial Lean Squares
PM
Performance Measurement
QMEA
Quality Management Excellence Award
xv
ROA
Return on Asset
ROE
Return on Equity
ROI
Return on Investment
SAP
Structural Adjustment Plan
SCM
Supply Chain Management
SCS
Sustainability Control Systems
SEM
Structural Control Modelling
SME
Small and Medium Enterprises
SPI
Sustainability Performance Indicator
SSCM
Sustainable Supply Chain Management
TPM
Total Productivity Management
TQEM
Total Quality Environmental Management
TQM
Total Quality Management
TSR
Total Shareholder Return
WWF World Wide Fund
1
CHAPTER ONE
INTRODUCTION
1.1 Research Background
Malaysia is known as one of the well informed countries on policies of agriculture due to
inextricable connection between technological dash and critical research that are funded
by the different sectors with enough budgetary allocation (Adebowale, 2013). According
to research conducted by Ahmad (2009) on marketing practices in Malaysian Agro-based
industry, it is posited that agro-based products have shorter life span due to the nature of
the products and require good marketing practices to increase the sales.
Malaysia with its wealth of natural resources is one of the fastest growing economies in
the ASEAN region and the country has 41% of world supplies of natural rubber, 39% of
hardwoods, 37% of palm oil and 32% of tin. In 1971, the government developed a New
Economic Policy (NEP) which, it was hoped, would bring about a sound and wide base
for economic growth. According to Hempel (2009), on the global challenge on
environmental governance, many international actors including the International Union
for Conservation of Nature (IUCN), World Wide Fund (WWF) have been playing critical
role in promoting environmental sustainability issues; even though the study finds some
constraints and potentialities towards the sustainability context.
According to the report from Federation of Malaysian Manufacturers in joint
collaboration with Malaysia External Trade Development Corporation directory (FMM-
MATRADE Industry Directory, Food & Beverage, 2005/06, p. A13) on food and
2
beverage industry group profile, the food processing sector accounts for about 10% of
Malaysia’s manufacturing output; processed foods are exported to 80 countries, with an
annual export value of more than RM5 billion (USD 1.3 billion) that amounts to two-
thirds of the total food exports of over RM10 billion. It should be noted that Malaysia is a
fast developing economy, where the contribution of the agro-based sector is very
significant, both in Gross Domestic Product (GDP) and employment. According to
Ahmed, Hassan, and Taha (2004), without having sustainable environment, Total
Quality Management (TQM), lean production or just in time (JIT) environment cannot be
attained. And sustainable environment cannot be obtained without environmental
regulation and policy (ERP).
TQM provides an overall integrated, systematic approach in ensuring that customers and
suppliers alike have an effective and sound quality system in for achieving sustainability.
Implementation of TQM is complex and broad, involving organizational efforts like
increasing the participation of employees and fulfilling the customer satisfaction to meet
the ethics of continuous development (Catalin, Bogdan, & Dimitrie, 2014). According to
Baird, Hu, and Reeve (2011), TQM is an integrated organizational-wide philosophy
aimed towards continuously improving the quality of products/services and process in
order to meet or exceed customer expectations. In another word, TQM is an approach for
continuously improving the quality of goods and services delivered through participation
of individuals at all levels and functions of an organization (Siddiqui, Haleem, &
Wadhwa, 2009).
Hoque (2003) explained TQM as a set of management concepts and tools that aims to
involve managers, employees and workers to yield continuous performance
3
improvement. Also, it is known by various names like continuous improvement, total
quality and process improvement (Allen & Kilmann, 2001). During the past two decades,
TQM programs have been implemented in many organizations. A strategy of high quality
leads to a sustainable competitive advantage. The findings suggest that TQM and its
adoptions have significant correlations with production performance and customer-
related performance Agus & Hassan, (2011). Tarí, et al. (2010) stated that TQM and
Corporate Social Responsibility (CSR) are relevant management philosophies in the hotel
industry to be able to generate a sustainable competitive advantage. Duran, Çetindere,
and Şahan (2014) discovered that, at statistical significance, the enterprises having the
TQM and ISO 9000 certificates are better in the fields of degree of knowledge obtained
from the customer, participation of employees in dissemination of knowledge, the quality
process, the quality culture and the quality performance than those not having the
mentioned certificates.
TQM implementation in terms of human resources management has a positive impact on
the sustainability and competitiveness of the enterprise and the presented models that
offer a holistic view on the positive impact of TQM in conjunction with human resources
management and ISO on the sustainability and competitiveness of the enterprise
(Izvercian, et al., 2014; Benavides-Chicón & Ortega, 2014). Bon and Mustafa (2013)
hypothesized and conceptualized the relationship between TQM practices and innovation
in a model to show that implementation of TQM system enhances the innovation process
in organizations due to elements such as continual improvement or customer focus. This
proves that the importance of TQM is unquantifiable in every aspect of management
whether soft or hard.
4
Ahire and Dreyfus (2000) established a framework for two components of TQM efforts.
Design and process managements are used in designing quality into products and
managing production quality. Sharma, Lawrence, and Lowe (2010) theorized the changes
of surrounding, the introduction of a management control innovation, TQM techniques,
within Telecom Fiji Limited. According to Ahmad, et al. (2014), the concept of TQM has
been developed as a result of intense global competition. Implementation of a TQM
system enhances the innovation process in organizations due to TQM elements such as
continual improvement or customer focus. Setyadi and Anggayana (2013) showed that
the final goal of exploration is to discover an economic deposit in the certain area;
generally by using the three main stages of exploration which are to find, to prove and
then to evaluate the presence of minerals deposit which in return used in measuring the
economic growth of an industry.
To ensure quality and standards in working and production conditions throughout the
supply chains, conceptualization was done by mapping the current situation of
sustainable supply chain management (SSCM) in the fast fashion industry to prevent
production problems in developing countries, improve overall performance and set
sustainability criteria for their suppliers (Turker & Altuntas, 2014). Agro-based
companies are involved in mechanized cultivation in macro level with a capital intensive
system. These companies include a wide range of agricultural products such as cereals,
industrial crops, fruits, vegetables, meat and diaries (Khatir & Rezaei-Moghaddam,
2014). Small food processing companies contribute substantially to the production,
manufacture and retail of food in the periphery of most countries (Kokkinakis, et al.,
2011).
5
Finally, as it is widely known that food and beverages constitute a major source of energy
in most countries, to have a sustainable development through dynamic social and
economic environment, every industry must implement a complex management which
combines TQM to their philosophy principles (Johann, 2006). In Malaysia, the food
manufacturing industry registered on output growth of 4.2% in 2004; the highest growth
was recorded in cocoa, chocolate and sugar confectionery (15.2 %), biscuits (11.5%) and
other products (11.4%) in response to increased domestic and external demand; while
negative growth was recorded in rice milling (-23.8%) due to demand being increasingly
met by imports (FMM-MATRADE Industry Directory, Food & Beverage, 2005/06, p.
A14). The industry depends on agricultural produces as raw materials but this study
exclusively focuses on food and beverage companies.
1.2 Problem Statement
Notably, many studies have found that, in general, TQM has a great effect on
organizational performances (Baird, Hu & Reeve, 2011; Chong & Rundus, 2004;
Laxmikumari, Kumar & Ramana, 2014; Agus & Hassan, 2011; Corredor & Goñi, 2011;
Kannana & Tan, 2005). Yet reports of low sustainable performance are surprisingly
common in the Malaysian food and beverage companies, with global comparison,
Malaysia’s sales of agricultural products are relatively low , which can be attributed to
the low responsiveness of entrepreneurs in producing a quality and competitive agro-
based products (Ahmad, 2009). Studies have examined the impact of TQM as
incorporated into system management in order to create a bigger view of exploration data
base design (Setyadi & Anggayana, 2013) and environmental management levels with
quality performance (Tarí et al., 2010).
6
However, several considerations are required to improve the companies’ performance
with the rapid growth of population in Malaysia, and equally the demand of food
especially agro-based products. Historically, Malaysia is one of the environmentally rich
countries in the world with abundant mineral resources and high biodiversity but
presently its tradition and heritage have been facing numerous environmental problems
such as air pollution, water pollution, and exploitation of natural resources. In order to
cope with the environmental problems, the Government of Malaysia has passed some
important environmental law and policy such as the Environment Quality Act 1974 and
its Regulations 1989, the Environmental Quality Order 1989, the Protection of Wildlife
Act, the National Forestry Act 1984, the Fisheries Act 1985, the National Parks Act 1980
, the International Environmental Laws, the Civil Law Act 1972, the Principles of the
English Laws, the Federal Law, Shariah Laws, the Malay Customary Laws with some
international environmental obligations ; have also been implemented in order to attain
sustainable environment and development in the country. But in contrast, these laws and
policies have not been properly implemented due to some problems such as non –
coordination, weak enforcement, customary attitudes (Mohammad, 2011).
According to Adebowale (2013) , underdevelopment is not limited to third world
countries because developing countries like Malaysia also negotiated an enduring public
development policy and solved fundamental problems of food production and agricultural
declination. In other words, the innovation capacity is weak, and consequently,
opportunities for growth and development are limited in critical sectors of the economy.
Boosting indigenous technological capability thus remains a major development
challenge in Malaysia. In addition, Sangodoyin and Ipadeola (2000) stated that,
7
continuing advancement in science and technology is contributing to the increase in
volume and toxicity of waste generated due to the advent of industrialization and
urbanization. Rose (2014) opined that though natural resources are in abundance but
highly restrained in some circumstance. Thus, there is need to tackle food production and
agricultural declination in food and beverage companies in order to boost technology
capability and economy through abiding the Environmental Regulation and Policy.
It is noteworthy that the Agro-business sector is one of the major generators of
employment and income worldwide. In recent years, food and beverage companies has
grown significantly which affects agricultural development policies to change from a
pure production-oriented approach to a wider systems that emphasizes agrifood chain
coordination, value creation and institutional strategies under which chains operate
(Konig, Silva & Mhlanga, 2013). Foods and beverages manufacturing firms are finding
it difficult to survive because of global economic recession and unfriendly operating
environmental in which they operate. In Malaysia, SMEs comprise more than 99% of
business establishments and 80% of them are categorized as micro level; despite the great
potentials of agro-based products, several issues need to be overcome in order to sustain
the industry and enable the entrepreneurs to remain competitive (Ahmad, 2009).
More so, series of empirical studies attempted to link TQM to organizational
performance i.e. business planning and firm size (Temtime, 2003; Haar & Spell, 2008);
information capability (Zarraga-Rodriguez & Alvarez, 2014); financial policy (Ademola,
2010); market competition (Chong & Rundus, 2004); organizational culture(Rad, 2006;
Baird, Hu & Reeve , 2011) and none of those researches has attempted to use
environmental regulation and policy. So, the need for a comprehensive study that will
8
capture the relationship between TQM, organizational performance and environmental
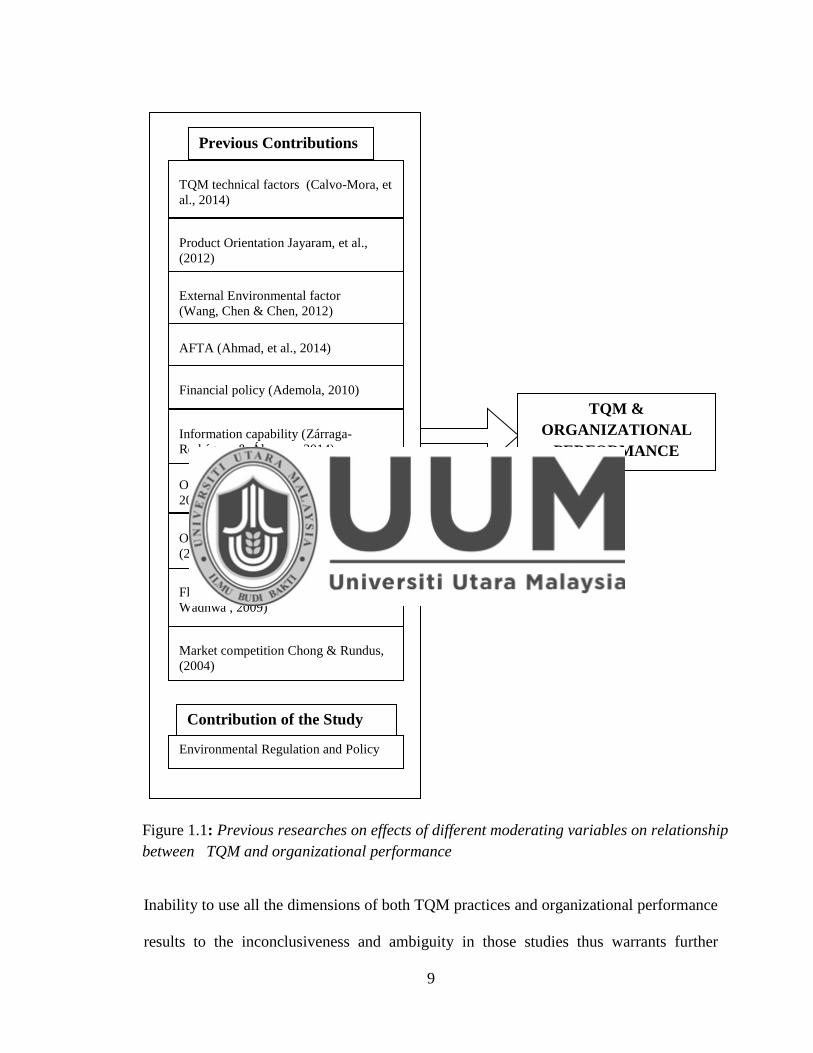
regulation and policy becomes necessary (Chervinski, 2014). The figure 1.1 below shows
different studies linking TQM and organizational performance.
With the above past research studies on TQM, Organizational Performance and
Environmental Regulation and Policy of food and beverage companies in Malaysia, the
problems in agro-allied industries were found to be low in sustainable performance, weak
in innovation capacity, limited in opportunities for growth and development; unfriendly
operating environment; unavailability of product readily throughout the year; low level of
disposable income; poor infrastructure; and increase in toxicity of waste generated.
In addition, several studies are conducted mostly on small and medium-sized enterprises
(SME) level and hospital sector as in the studies of Allen and Kilmann (2001),
Benavides-Chicón and Ortega (2014), Chen (2013), Abdullah (2010) and Abu-Hamatteh
et al. (2003) with no study in the area of food and beverage companies to the best
knowledge of the researcher.
9
Inability to use all the dimensions of both TQM practices and organizational performance
results to the inconclusiveness and ambiguity in those studies thus warrants further
Figure 1.1: Previous researches on effects of different moderating variables on relationship
between TQM and organizational performance
)
Previous Contributions
TQM technical factors (Calvo-Mora, et
al., 2014)
Flexible systems (Siddiqui, Haleem &
Wadhwa , 2009)
Organizational culture (Rad,
2006;Baird,Hu and Reeve(2011)
Organizational learning Hung, et al.,
(2011)Mahmud & Hilmi (2014)
Market competition Chong & Rundus,
(2004)
Information capability (Zárraga-
Rodríguez & Álvarez , 2014)
Financial policy (Ademola, 2010)
External Environmental factor
(Wang, Chen & Chen, 2012)
AFTA (Ahmad, et al., 2014)
Product Orientation Jayaram, et al.,
(2012)
Contribution of the Study
Environmental Regulation and Policy
TQM &
ORGANIZATIONAL
PERFORMANCE
10
researches. In addition, there is always issue of lack of sophistication of techniques used
for analysis. Also, since most studies are concentrated on manufacturing sectors, this
study attempts to fill the gaps in the literature by extending the existing research to food
and beverages industry in Malaysia. This has prompted a need for deeper understanding
of the elements that form a conducive and enabling environment for the development of
agribusiness, agro-industries and agro-food value chains in general. The food and
beverage companies have a pressing need to implement immediate and longer term
sustainable practices. The quest for more studies on the relationship between TQM and
organizational performance for provisions in an extensive review of the quality of a
factory’s existing system management, implementation of standards, procurements and
current manufacturing procedures in conjunction with economic, social and
environmental development in Malaysian food and beverage companies are issues that
provoked the essence of this study
Based on the aforementioned practical flaws and theoretical gaps identified in the
previous studies, this study will investigate the following three aspects: 1) the effect of
TQM on the organizational performance of food and beverages companies; 2) the
theoretical and empirical evidence that established the relationship between TQM,
environmental regulation and policy and organizational performance; and 3) the
moderating effect of environmental regulation and policy on practical relationship
between TQM and organizational performance in the Malaysian food and beverage
company context.
11
1.3 Research Questions
For the problem statement of this study to be properly addressed, the following are the
research questions to be answered:
1. What is the impact of quality assurance as a TQM element on organizational
performance of Malaysian food and beverage companies?
2. What is the impact of continuous process improvement as a TQM element on
organizational performance of Malaysian food and beverage companies?
3. What is the moderating effect of environmental regulation and policy on the
relationship between quality assurance and organizational performance of
Malaysian food and beverage companies?
4. What is the moderating effect of environmental regulation and policy on the
relationship between continuous process improvement and organizational
performance of Malaysian food and beverage companies?
1.4 Research Objectives
The purpose of the study is to examine empirically the effect of environmental regulation
and policy on the relationship between TQM and Organizational performance. This major
objective is divided into four objectives as follows:
1. To investigate the impact of quality assurance as a TQM element on
organizational performance of Malaysian food and beverage companies.
2. To investigate the impact of continuous process improvement as a TQM element on
organizational performance of Malaysian food and beverage companies.
12
3. To examine the moderating effect of environmental regulation and policy on the
relationship between quality assurance and organizational performance of
Malaysian food and beverage companies.
4. To examine the moderating effect of environmental regulation and policy on the
relationship between continuous process improvement and organizational
performance of Malaysian food and beverage companies.
1.5 Research Methodology
This sub section is divided into two parts: data collection and data analysis. It explains
briefly, how the data was obtained and consequently analyzed. This research work
employed the use of primary data which provide organizational performance records and
accounts in a workable format. Questionnaires shall be provided to the top managers or to
the companies’ representatives in care of that. The instrument to be used for this research
shall be primary in nature as quantifiable quality management data will be obtained from
the top managers of various food and beverages companies located in Malaysia. The
method used was based largely on deductive method and the use of primary data was
done after the collection of the data from various aforementioned companies in Malaysia
through questionnaires. The data was then analyzed through SEM PLS.
1.6 Significance of the Study
In recent years, green economy has emerged as the concept that will enable progress in a
sustainable manner, ensuring that natural capital that gives goods and services like raw
materials, clean water and air, carbon sequestration and waste decomposition is properly
recognized, accounted for and safeguarded (MENGO, 2013). Due to economic, social
13
and environmental problems in developing countries, companies increasingly focus on
sustainability and try to ensure the same quality and standards in working and production
conditions throughout their supply chains. The tension in the exchange of resources
between developing and developed countries lies at the heart of current sustainability
activities, but what these companies are actually doing to manage their supply chain has
not yet been explored in depth in the literature (Turker & Altuntas, 2014).
Besides that, TQM was incorporated into knowledge management when knowledge
management became a current issue to which the organizations were required to pay
attention in order to increase performance, productivity and competitiveness of the
organization (Duran, Cetindere & Sahan, 2014). According to Izvercian et al. (2014), it is
highly competitive for environment forces of enterprises to pay attention to quality and
human resources needs in order to be sustainable without investigating the impact of the
relationship existing between TQM, human resources management, competitiveness and
ISO 9000 on sustainability of an enterprise. Admittedly, both TQM and sustainable
development are crucial to the competitive and value creation processes, few empirical
studies have explicitly analyzed the relationship between them (Benavides-Chicón, and
Ortega, 2014).
Furthermore, Hung et al. (2011) reported that organizational learning expedites
innovation performance and plays a big role between TQM and innovation performance.
Also, Haar and Spell (2008) identified the moderating role and effect of organizational
size in determining adoption rate in firms and on the adoption rates of TQM in firms. In
the same view, Jayaram, et al. (2012) explained the moderating effect and influence of
product orientation on coordination mechanisms in total quality management combined
14
to influence quality performance in industries. Mahmud and Hilmu (2014) explored the
pertinent issues in the relationship between TQM and Small and medium enterprises
performance with the mediating roles of organization learning with the anticipation that
TQM shall support both organization learning and performance of SMEs.
In another end, Siddiqui, Haleem and Wadhwa, (2009) stated that in global market
conditions, the growing field of point of attraction for many researchers and practitioners
from the last few years in the integration of TQM and Supply Chain Management (SCM)
with Flexible System(FS). In the same way, Wang, Chen, and Chen (2012) identified the
moderating effects of external environment factors on TQM, market orientation and
performance; the marketing orientation is being used as mediating effect between TQM
and organizational performance. Likewise, Temtime (2003) investigated the moderating
impacts of business planning and firm size on TQM practices in developing countries of
small- and medium-sized enterprises.
Therefore, more researches are needed on mechanism by which TQM operates and its
influences across multiple level of organizational development and competitiveness
advantages measured by customer satisfaction, financial and operational performance in
conjunction with the impacts assessment of social, economic and environmental
development in food and beverage companies as a sub-set of Agro-allied industry.
Table 1.1:
Limitations of the Past Works on TQM and Organizational Performance.
Reference Future Research Recommended
Bolívar-Ramos, García-
Morales, & García-
Sánchez, (2012)
An explicit integration of the influences of external factors.
15
Camisón & Villar-López,
(2014)
Analysis of how the radical character of organization
innovation and innovation capability influences their
interrelationship and firm performance
Valmohammadi, (2011)
Data should be from both manufacturing and service
industries.
Fotopoulos & Psomas,
(2010)
Focus on the specification of a quality management model
that will be based on subjective business evidence and
opinions held not only by top managers but also by
employees.
Draghici, Popescu, &
Gogan, (2014)
The proposed model for the organizational performance
will prove to be useful tool for empirical researchers and
will help them in documenting and defining the
performance management
systems for both profit and non-profit organizations.
García-Morales, Jiménez-
Barrionuevo, & Gutiérrez-
Gutiérrez, (2012)
Examination of other consequences of introducing learning
and innovation processes in organizations (e.g. quality
improvement, staff satisfaction, and improvements in
relational capacity).
Abor & Biekpe, (2007) Further development on some of the insights delivered by
this study and to be confident that there is any simple and
systematic structure that provides best service guide .
Perdomo-Ortiz, González-
Benito, & Galende, (2006)
Comparison of TQM and Business innovation capability
measurements with the firms results in particular with
16
quality and innovation results and business results.
Velasco, Quintana-Garcia
& Marchante-
Lara (2014)
Incorporation of interviews to stakeholders (employees,
customers and society) is needed to fully understand the
relationships.
Table 1.1 above presents the limitation of the past researches on the relationship TQM
and organizational performance. The study shall expose the full utilization of corporate
resources and improvement in the whole production system which will also eventually
identify preventable and corrective measures to establish defined and detailed traceability
systems, from raw material procurements to marketing of the products in enhancing
organizational performance.
1.7 Scope of the study
This research was conducted in the Malaysian food and beverage companies, as a subset
of Agro-based industry working in full symbiosis operation with the Agricultural industry
by providing or deriving goods or a service from agricultural produces. This study
covered 250 food and beverage companies in Malaysia in which most of them are
situated at Kuala Lumpur, the capital city of the country. Also, a review of the literatures
suggested a combination of soft and hard quality element of TQM. Studies (Vouzas &
Psychogios, 2007 ; Chen, 2013) revealed that TQM can be divided into: the management
or soft aspects of TQM; and the technical or hard aspects of TQM . The hard refers to
management tools and techniques, while the soft or philosophical is connected with
17
management concepts and principles. This study is exclusively based on the soft elements
of TQM being the core elements.
1.8 Summary
The fundamentals of this study are explained in this chapter, and it serves as the
introductory chapter. It outlines the reasons and highlights the events that necessitated
this study through the significance of the study. This is further extended and specifically
addressed as the study’s problem statement. The research questions and objectives are
also elicited in relationship with each other and the outlined problem statement. While the
conceptual framework gives the overview of the connection between the variables and
sub-variables with their respective roles of dependent, independent and moderating.
In essence, the chapter serves as gateway to this study by briefly introducing each of the
components of the chapter. The research methodology to be employed is clearly
discussed by stating how the data shall be collected and analyzed. Also, the scopes to be
covered by this study and its contributions to the knowledge practically and theoretically
are discussed. Lastly, operational definition of terms is introduced to this chapter to give
a clear view of the connections existing between the variables and the domain of the
study.
18
CHAPTER TWO
LITERATURE REVIEW
2.1 Introduction
This chapter presents the foundation for this study. It reviews previous related studies and
literatures so as to justify the developed research questions and hypotheses. To achieve
this, literatures of past related studies on TQM and its core elements, organizational
performance and environmental regulation and policy are discussed. The chapter presents
the concepts of TQM, environmental regulation and policy and organizational
performance. Other sections that follow in this chapter discussed the empirical studies
and established linkages between the variables of TQM and organizational performance
as well as the moderating role of environmental regulation and policy. Regarding the
underpinning theories, Contingency theory, Institutional theory and all other related
theories were discussed and the chapter explains the reason for the choice of the theories.
2.2 The State of Food and Beverage Companies in Malaysia
The concern for the environment and sustainability was aggressively rooted way back in
the Third Malaysia Plan (1976-1980) as Malaysia built its economic foundation. It is
revealed by WWF-Malaysia in 2007 on Environmental Stewardship also that 57% of the
populace can be said to have good environmental behavior. Food and agro-processing
industries are becoming prominent in recent times with the prohibition of importation of
some grades of food stuff enacted by government policy.
According to Department of Statistics, Malaysia (2004), the production index for food
and beverage industry increased by 4.4% due to strong domestic demand. Among the
19
sub-sectors which recorded significant increase in production were cocoa, chocolate and
sugar confectionery (15.5 percent), biscuits (12.2%), other processed food (8.8%), flour
milling (3.4%) and sugar refineries (1.4 %). Although, the export performance of this
sector has doubled over the last ten years, Malaysia continues to be a net importer of food
products with annual imports of more than RM 12 billion/USD 3.2 billion (FMM-
MATRADE Industry Directory, Food & Beverage, 2005/06, p. A13).
Abd.Aziz and Yassin (2010) examined the market practices and the marketing
orientation-business performance of relationship among SMEs in agro-food sector in
Malaysia by investigating the role of external environment in the market orientation-
performance linkage. The study seeks to contribute to the knowledge concerning quality
management and organizational performance by applying the environmental regulation
and policy control effort to food and beverage organizations in Malaysia.
Buniamin (2010) revealed that generally, business organizations are facing the
challenges of disseminating environmental information as public concerns regarding
these issues have significantly increased. Environmental reporting is exclusively a
voluntary initiative in Malaysia and has emerged in the last decade. Even though the
Association of Chattered Certified Accountants (ACCA) with the conjunction of the
Malaysian Department of Environment (DOE) published the paper named
“Environmental Reporting Guidelines for Malaysian Companies” in March 2003. The
study concludes the environmental reporting in Malaysia is still at infancy stage.
Farinda et al. (2009) stated that in Malaysia, SMEs are divided into two categories which
is: manufacturing, manufacturing-related services and agro-based industries; and
20
secondly, services, primary agriculture and information and communication technology.
Irrespective of the categories and sector, all the SMEs contribute to the Malaysian
economy tremendously which includes; contribution of output in terms of products and
services; creation of job opportunities; developing a pool of skilled and semi-skilled
workers; provide opportunities for technological development; and offer an attractive
ground for entrepreneurial and managerial talent. Hear and Hasan (2006) examined the
evolution of environmental policy in Malaysia. The study analyses the interaction
between domestic and international drivers in relation to the broader goal of sustainable
development, which is defined here as ‘non-declining utility’ of the natural endowment
while Malaysia’s impressive economic achievement has advanced human development
and reduced poverty, the impact of rapid environmental change raises doubts as to its
sustainability and inter-generational equity. The study shows that the trajectory of
Malaysia’s policy on natural resources and environmental issues bears the characteristics
of path-dependent evolution.
Undoubtedly, the agro-allied sector in Malaysia plays a significant role in the Malaysia
economy and therefore it is worthwhile to expand the body of knowledge on this sector
as a target population for this study. Lee (2004) revealed in his study on econometric
analysis at the firm level in Malaysia that large firms are more likely to innovate
compared to small firms. This means, a research study in large firms would be more
significant compared to small firms. Rasyikah and Suhaimi (2010) discussed the
sustainable development and the role of the Malaysian law and policy issues. It is
reported from the study that Malaysia has the bigger role in conserving its natural
resources to mitigate the global warming effects as well as to ensure sustainable
21
development. This study aims to identify any enabling or hampering structures for
effective policies on sustainable water resources management in Malaysia. The study
concludes that the fragmented laws and division of powers over water resources
management will impede the implementation of sustainability policies in the country.
In addition, the Community-based Natural Resource Management Facility (2008) in
Malaysia stated Danida Funded Programme has been working and aiming at enhancing
the capacity of Malaysian Non-Government Organization and community based
organization in influencing sustainable development policies and practices related to
natural resource management and biodiversity conservation including the recognition of
the importance of indigenous peoples and gender equity. Jamaluddin et al. (2009) argued
that there are some relationships in development, environmental degradation,
environmental management systems in the world without which the sustainable
development cannot be possible in the world as the environment and development issues
go along with the natural resource management and administration. The study opined that
the role of legislations and policy are essential in this regard. The total budget for 2010 is
RM6 billion that was exclusively earmarked on agriculture alone. A major portion of it is
for the Ministry of Agriculture and Agribusiness industries. The allocation relates to the
advancement and improvement of agriculture is that it is spread out across the
development of farm infrastructure, irrigation facilities and drainage requirements,
particularly in rice-growing areas.
As presented above, there are serious and imminent problems related to the performance
state of Malaysia agro-based industry. Therefore, it is necessary to redefine solid
22
performance improvement strategies with environmental regulation and policy of the
Malaysia food and beverage companies.
2.3 Organizational Performance (OP)
The increase in challenges of numerous organizations in achieving and sustaining
competitive advantage through finance, operations and customer satisfaction have made
organizational performance to gain utmost attention to survive in a highly competitive
environment. As a result organizational performance is simply considered to be an
outcome of a firm’s activities over a given period of time (Osundina & osundina, 2012).
Organizational performance has been explained in different ways, methods, and manners
and from different perspectives. Gomez and Manzanares (2007) studied the relationship
between firm performance, knowledge management strategies, and innovation. Firm
performance being conceptualized as a dimension in the study was measures based on
financial results with variables such as return on asset (ROA), return on equity (ROE),
sales growth and market share. The study revealed significant relationships that exist
between the performance of some firms and their efficiency in the transmission and
application of existing knowledge. In addition, tacit knowledge and knowledge
management practice are used as measurable quantity for firms to maximize performance
(Harlow, 2008; Nawaz, Hassan, & Shaukat, 2014).
Sheikh, Wang, and Khan (2013) studied the impact of internal attributes of corporate
governance on firm performance. The purpose of the study is to investigate whether
internal attributes of corporate governance such as board size, outside directors, CEO
duality, managerial ownership, and ownership concentration affect the performance of
23
Pakistani firms. A pooled ordinary least square was used to estimate the relationship
between internal governance mechanisms and performance measures, which are ROA,
ROE earnings per share and market-to-book ratio using the data obtained from non-
financial firms listed on the Karachi stock exchange Pakistan during 2004-2008. The
findings showed that internal governance mechanisms have material effects on firm
performance.
Similarly, Adeoye and Elegunde (2012) explained organizational performance to be a
corollary combination of productive assets made up of human, physical and capital
resources, purposely to fulfill a dream, vision or accomplishing a shared aim and
objective. In this study, OP is viewed as a term that is made up of three areas: firstly, the
financial performance that is made up of profits, return on assets (ROA), return on
investment (ROI); second one which is product market performance such as sales, market
share; and lastly the shareholders return such as total shareholder return (TSR), economic
value added (EVA). The study revealed that the external business environment have
impact on organizational performance.
According to Ehikioya (2009) in examining the link between corporate governance
structure and firm performance, the ownership concentration has a great positive
influence on performance. Even though there are no evidence to support the impact of
board composition on performance, the results of the study showed that, there is
significant evidence to support the fact that CEO duality adversely impact firm
performance. However, it is recently found out by research that organizational
performance can also be seen from four perspectives: financial, customer, internal
process and innovation and learning (Rasula, Vuksic, & Indihar, 2012).
24
2.3.1 Measurement of Organizational Performance
Measurement of organizational performance varies across industries and companies.
According to John and Ngoasong, (2008) Customer satisfaction, employee and/or
shareholders satisfaction, sales growth, market share, return on capital invested are the
measurement of performance. In addition , firm performance in comparison to
competitors have more return on investment, market share, sales, profitability, earnings,
gross margin and market value (Akgün, Keskin, & Byrne, 2009; Kim, Lee, & Yu, 2004).
Kilic, et al. (2014) , explained further that the best corporate performance is obtained
when leading innovators simultaneously compete effectively on multiple operations
priorities. Also, Wu and Chiu (2014) said from recourse-based view perspective, IT
innovation capabilities are considered to be valuable resources for competitive
performance. The study opined that competitive performance is the ability to earn above
the average return on investment for the industry. In order word , Tvorik, Tvorik, and
Mcgivern (2006) defined performance in terms of synergistic contributions by using
inter-firm variables as economic rates of return for both economic and organizational
factors. Using contingency and configuration theory, a connection was asserted between
organizational alignment and performance.
Pavlov and Bourne (2011) explained the effects of performance measurement on
performance in an organizational routines perspective. The purpose of the study is to
address the conflicting results of the effect of performance measurement (PM) on
performance by proposing a theoretical model of the effects of PM on performance. This
conceptual paper is based on review of PM and management control system literature by
extracting the factors that help to explain the effect of PM on performance. The
25
theoretical model proposed by the study revealed that PM has three distinct effects on the
organizational processes that deliver performance – the trigger, guidance, and
intensification effects.
Meanwhile, an organizational performance is considered to be a multidimensional
umbrella concept that includes all aspects related to that organization’s success and
activities such as efficiency, quality, productivity, quality of work life, innovations and
profitability (Sillanpää, 2011). In another vein, the performance of an organization is
measured by top management commitment, process management, employee training and
empowerment, quality measurement, product design, customer involvement and
satisfaction and vendor quality management (Sohail & Hoong, 2003). This study is
going to exclusively conceptualize organizational performance into three dimensions
namely customer satisfaction, operational performance and financial performance. Table
2.1 below presents some of the past studies on OP measures.
Table 2.1:
Sample of previous Studies on OP Measures
Organizational
Performance Measures
Author/s
Customer Satisfaction John & Ngoasong, 2008, ; Sillanpää, 2011; Agus & Hassan,
2011; Akgün, et al., 2014; Alomaim, Tunca, & Zairi, 2003;
Fatima & Razzaque, 2013; Assaf, et al., 2015; Chang,
Wong, & Fang, 2014; Chen, Martin, & Merchant, 2014;
Eren, et al., 2013
Financial Performance Akgün et al., 2009; Kim et al., 2004; Tvorik et al., 1997;
Goh, Elliott, & Quon, 2012 ; Sillanpää, 2011; John &
26
Ngoasong, 2008; Argilés-Bosch, et al., 2014; Ujunwa,
2012; Endrikat, Guenther, & Hoppe, 2014; Epstein,
Buhovac, & Yuthas, 2012.
Operational
Performance
Sillanpää, 2011; Baird et al., 2011; Capkun, Messner, &
Rissbacher, 2013; Yu, et al., 2014; Chung, Tsai, & Hsu,
2005; Crilley & Sharp, 2006; Fawcett, Smith, & Cooper,
1997; Feng, et al., 2013; Forza, Salvador, & Trentin, 2008;
Mansour, et al., 2013.
In literature of measurement of performance, many studies suggested a connection
between the implementation of TQM and organizational performance. For example Baird
et al., (2011) in their attempt to examine TQM implementation on financial performance,
their study supported the idea of the existed relationship between financial performance
and TQM practices. Additionally, John and Ngoasong, (2008) examined the impact of
TQM implementation on organizational performance, and their findings supported the
effectiveness implementing TQM which leads to optimum performance. In this case,
improvement of any process can be measured without measuring the results that
represents the outcomes (Demings, 1986). Therefore, measurement tools needed to be
known in order to know to what extent the organization achieve its objectives in terms of
performance.
2.3.1.1 Customer Satisfaction
Filip (2013) examined customer satisfaction learning process in relation to complaint
management. According to by study, it is posited that complaint should be considered as
27
indicator of organizational performance assessment, pointing to some problems or
challenges in internal processes that need immediate recovery in order to avoid migration
of profitable customers. The purpose of the study is to present the key features of an
effective complaint management process, as a relatively cheap system of diagnosing and
learning a company’s shortcomings. The study conclusively reveal that with the design of
an integrated complaint management system, organizations have the chance to learn
from customer feedback and to exploit this information in order to alleviate weakness,
rejuvenate business performance, avoid future unbecoming experiences, and finally
establish customer satisfaction, loyalty and relationship commitment.
In addition, Jeon and Choi, (2012) opined that employee satisfaction leads to customer
satisfaction in the context of the relationship between employee satisfaction and
customer satisfaction . The authors of this study conducted an empirical test on this
relation in educational organization context by using structural equation modeling to test
the hypothesis. The study concludes that the relationship between employee satisfaction
and customer satisfaction is unilateral rather than bilateral. Jung and Yoon (2013) stated
in their study that customer satisfaction is clearly a mediating variable between
employees’ satisfaction and customer loyalty. The aim of the study is to understand the
interrelationships among employees’ satisfaction and customer’s satisfaction and loyalty
in a foodservice organization. Data was obtained from 69 employees and 258 customers.
The findings show that employee satisfaction has no significant or direct impact on
customer loyalty, but showed an indirect influence through customer satisfaction.
Ooi, et al. (2011) investigated the relationship between TQM practices and customer
satisfaction within the context of Malaysia’s small service organizations. Collection of
28
data was done from the perceptions of sales and marketing managers in 108 small service
organizations in Malaysia. Analysis of data was consequently done by employing
correlation and multiple regression analysis to test the relationship between TQM
practices, customer satisfaction and service quality. The result showed that TQM
practices are significantly and positively linked to customer satisfaction and service
quality of the small service business firms.
Lewin, Biemans, and Ulaga (2010) investigated what the influence cultural differences
may have on business customers’ evaluations of satisfaction with and loyalty toward
downsized suppliers. The aim of the study is to examine the impact in which downsizing
of suppliers’ sales and support personnel has on business customers’ satisfaction.
Through survey, data was obtained from 435 purchasing professionals in the United
States, France and the Netherlands to provide answer to the research questions. The study
concludes that customer satisfaction is an important source of competitive advantages
that leads to customer loyalty and repeat purchase. Other studies like (Pan, 2015;
Prud’homme & Raymond, 2013; Saeidi, Sofian, Saeidi, Saeidi, & Saaeidi, 2014; Mehra
& Ranganathan, 2008; Sun & Kim, 2013) also shed more light on the customer
satisfaction being a significant indicator for organizational performance.
To this end, customer satisfaction is considered one of the most successful tools that
measures the performance and widely used by many organizations. Therefore, this study
will apply customer satisfaction to evaluate F&B Companies’ performance.
29
2.3.1.2 Operational Performance
Baird et al. (2011) conducted an empirical analysis on the relationships between
organizational culture, TQM practices and operational performance. The purpose of the
study is to examine the direct and indirect relationship of Kaynak’s four core TQM
practices namely (quality data and reporting, supplier quality management,
product/service design and process management) with operational performance. In this
study, operational performance was measured in terms of the level of inventory
management performance and the level of quality performance. Data was obtained from a
survey of 364 business units, comprising both the manufacturing and service industries in
Australia. The findings showed that quality data and reporting was positively associated
with supplier quality management and product/service design.
Also , Capkun et al. (2012) stated their study that operational focus is expected mainly to
bring developments in operational performance ; a developmental improvement that
account only for part of the potential performance effects on the organizational level. In
addition , Yu et al. (2014) examined the effect of internal lean practices on multiple
operational performance dimensions and equally investigate the contingency perspective
of these relationships with respect to industry clock speed. The study was based on
empirical data collection from 228 manufacturing companies in the republic of Ireland
and the constructs were consequently analyzed using regression analysis. The findings
revealed that the connection between internal lean practices and quality, delivery,
flexibility and cost were found to be positive and significant while internal lean practices
can improve operational performance. Cost and flexibility are the two dimensions used in
measuring operational performance in the study.
30
Chung et al. (2005) opined in their study using descriptive statistics, T-test, and single
factor analysis of variance to analyze the effects of the location, history, industry, number
of employees, amount of capital, and revenue of a total of 35 indices on performance that
performance effectiveness is measured considering five dimensions namely marketing
management, production management, human resources management, financial
management and overall company. The study examined the operational performance of
ISO 14000-certified Taiwan’s Manufacturers with the conclusion that the indications are
that ISO 14001 favors all manufacturers but the level of benefits differs from company to
company.
Moreover, Crilley and Sharp (2006) proposed a model for managerial and operational
performance with the purpose of examining the need for consensus on a model that
comprises the relationship between the manager and the effective operational
performance of leisure facilities. Data were obtained through the distribution of
questionnaires to 140 managers, 71 peers, and 277 staff of Australian sports and leisure
center managers and the performance of their operations. The data obtained were
consequently analyzed to develop an empirical model of the relationship. The proposed
models give a new basis for reviews and changes to current practice in the development
of managers, and of professional practice.
In another vein, Feng et al. (2013) stated in their study of relationship between external
involvement and operational performance with the mediating role of internal integration
that customer and supplier involvement are both important for improving organizational
performance, which provides guidelines and procedures for top managers to innovate
business model in the product development process. A survey data were obtained from
31
176 Chinese manufacturing companies and structural equation modeling was used to
examine the hypothesis. The result shows that internal integration partially mediates the
relationship between customer and supplier involvement and operational performance
thereby proves that customer and supplier involvement are important, having significant
effects on operational performance.
Operational performance is studied in different form in an organization from existing
past literatures like : postponement effects on operational performance , Forza et al.
(2008); evaluation of operational performance based on measurement of overall
equipment effectiveness(OEE) , Mansour et al. (2013), maintenance practices impact on
operational performance, Mitchell, Robson, and Prabhu, (2002); gauging strategies for
operational performance through benchmarking Padavano, (2005); measuring the
operational performance of a public transit company , Parkan, (2002) and operational
performance gaps in business relationship, Staughton and Johnston, (2005) which are in
line with the conceptualized context of this research study.
Therefore, this current study will focus also on operational performance in F&B
companies as it has been proved and suggested by the previous research to be an effective
measurement for organizational performance.
2.3.1.3 Financial Performance
Many previous studies have considered financial performance to be a great indicator in
organizational performances ( Argilés-Bosch, et al., 2014; Ujunwa, 2012; Endrikat,
Guenther, & Hoppe, 2014; Epstein, Buhovac, & Yuthas, 2012; Argilés-Bosch et al.,
2014; Yusoff, Mohamad, & Darus, 2013; Yesil & Kaya, 2013; Su & Sun, 2011;
32
Shaverdi, Heshmati, & Ramezani, 2014; Saeidi et al., 2014; Nikzad & Maryam, 2012;
Nawaz, Hassan, & Shaukat, 2014; Nasrallah & Qawasmeh, 2009). Performnace is simply
defined as the measure of attainment achieved whether by an individual, team, or
organization (Eriksson & Hansson, 2003)
Länsiluoto, et al. (2004) explained financial benchmarking as a popularly used tool for
comparison in financial performance of competing companies. Using sel-organizing
maps, the study examined industry-specific cycles and companies’ financial performance
comparison. The study provides an effective dimensional reduction and visualization
capabilities, making it a reliable tool for the visual analysis of large amounts of high-
dimensional financial data. Also , Kanghwa (2010) stated that the risk side of financial
performance is more importatnt than the return in terms of perpurual growth of a
company. The purpose of the study is to assess the conceptual realtionship between
operational, competitive market and financial performance of a company. To achieve that
, a model presented is designed on hand data envelopment analysis (DEA) and causal
loop diagram(CLD). The result reveals that : an organization which is found closer to the
operational frontier will also be located closer to the market frontier; an organization that
is located closer to the market frontier will also be located closer to the financial frontier;
the relationship of operational performance on financial performance is no weaker
compared to that of market performance; and lastly the firm-specific financial risk is
more influenced by variables such as quality, speed and flexibility than by just cost-
related variables.
In other word, Argilés-Bosch et al. (2014) examined an emperical analysis on the
incidence of labor accidents on firm financial performance. The study used a collection of
33
data obtained from 299 spanish firms for 6 different years . A panel data estimation was
cariied out and the outcome result revealed that there is a negative influence of accident
rate on rate on assets, as well as on abnormal return on assets. In addition, Ujunwa (2012)
investigated the impact of corporate board characteristics on financial performance on
quoted firms. The study employed random effects and fixed-effects generalised least
squares(GLS) regression to test the hypotheses formulated for the study. After obtaining
panel data from 122 quoted firms in Nigeria between 1991 and 2008, it was discovered
that board size, CEO duality and gender diversity are negatively linked with firm
performance. The study adopted accounting based measure, viz., return on assets (ROA).
On the other hand, Endrikat et al. (2014) employed meta analytic review of 149 studies to
draw a hybrid theoretical framework by combining the theoretical reasoning of the
natural-resource based view (NRBV) with instrumental stakeholder and slack resources
arguments to investigate the relationship between corporate environmental
performance(CEP) and corporate financial performance(CFP). The purpose of the study
is to find out the inconsisent empirical findings between CEP and CFP that makes overall
picture of the previous research to remain vague. By focusing on the casuality and the
multidimensionality of the focal constructs, the meta-analytic results shows that the
relationship is stronger when the startegic approach underlying CEP is proactive rather
than reactive.
Also, Epstein et al. (2012) developed a multiple embedded case study design to carry out
research on how social, environmental and financial performance are managed
simultaneously. The purpose of the study is to enhance managers in understanding how
to cope with trades-offs and simultaneous management of social, environmental and
34
financial performance. Four corporations with high reputation in mangement of
sustainability were targetted and a new perspective on the implementation of corporate
sustainability was proposed. The research found out that while the companies’ informal
systems strongly promote sustainability, their formal systems seemingly have a
traditional focus on financial performance.
Pursuing this further, Eriksson and Hansson (2003) opined that there is disagreement
concerning the effective adoption of TQM on financial performance . In their study ,
percentage change in sales, return on assets, return on sales, percentage change in total
assets and percentage change in total number of employees are used as financial
performance indicators. The research conclude that financial performance, measured by
the stated indicators, develop more advantages for companies that have successfully
implemented TQM, than other branches’ indices and competitors.
Other studies are the internal strategic factors that influence company financial
performance, as discussed by Gursoy and Swanger (2007); managing competence
acquisition and financial performance, Malmström et al. (2013); innovation capability for
SME success from the financial and operational performance perspective ( Minna, 2014;
Nasrallah & Qawasmeh, 2009 ; Nawaz et al., 2014; Yusoff et al., 2013; Nikzad &
Maryam, 2012). This affirms the fact that financial performance is essential to measure or
evaluate the organizational performance in any context.
2.4 Total Quality Management (TQM)
Notably, many studies have been conducted to measure TQM and organizational
performance (Abu-Hamatteh, Al-Azab, & El-Amyan, 2003; Agus & Hassan, 2011; Allen
35
& Kilmann, 2001; Abdullah, 2010; Baird, Jia Hu, & Reeve, 2011; Basu, 2014;
Benavides-Chicón & Ortega, 2014; Bon & Mustafa, 2013; Brun, 2011;Catalin, Bogdan,
& Dimitrie, 2014; Christofi, et al., 2008; Williams, Babatunde, & Jeleel, 2012; Wei,
Zhao, & Zhang, 2014; Vural, Vardarlier, & Aykir, 2012; Vatalis, Manoliadis, &
Mavridis, 2012; Tarí, et al., 2010; Mishra & Mohanty, 2014; Stanciu, Constandache, &
Condrea, 2014; Sahai & Srivastava, 2012; Rodrigue, Magnan, & Boulianne, 2013;
Adeoye & Elegunde, 2012; Malmström, Wincent, & Johansson, 2013) generally.
The Gurus of quality management such as Deming (1986); Juran (1988); and Crosby
(1979) contributed the fundamental frameworks of the major studies of TQM practices.
The development of TQM from 1950 onwards is credited to these American experts; they
contributed immensely to the continuous improvement of the subject. In addition, Brun
(2011) posited that historically, TQM has evolved in four stages from the contribution of
Dr. Edward Deming, Dr. Joseph Juran and Philip Crosby, categorizing them into: Quality
inspection, Quality control, Quality assurance and TQM. Table 2.2 shows the various
stages towards development of TQM.
Table 2.2
Different stages of TQM and their characteristics
Stage Characteristics
Quality Inspector (1910) Salvage
Sorting
Identify Sources of non-conformance
Corrective action
Quality control (1924) Quality manual
36
Stage Characteristics
Self-inspection
Product testing
Quality planning
Use of statistics
Quality Assurance (1950) Third party approval
Quality planning
Quality manuals
Process control
Non production operation
Failure mode and effect analysis
TQM (1980) Focused vision
Continuous improvements
Performance measure
Management leadership
Interdepartmental barriers
Abu-Hamatteh et al. (2003) explained that for TQM to be achieved at enhancing the
competitiveness and performance excellence in SMEs , businesses and manufacturing
companies, five areas of TQM which are leadership, strategic planning, process
management, resources management and results must be focused. The concept of TQM
has been adopted since 1980 together with a strategic approach to quality with the aim of
focusing on all the resources in achieving excellence (Benavides-Chicón & Ortega,

37
2014). Therefore, it is recognized as one of the major innovations of the last decades in
the field of management (Izvercian, et al., 2014)
Ahire and Dreyfus (2000) stated that design management and process management are
two important elements of TQM that are drastically different in their targets of
improvement and visible techniques. Allen and Kilmann (2001), reported that the
evolution and rise of TQM made on of the biggest changes in the past two decades in the
way companies are managed but was known by various names like TQM, continuous
improvement, total quality and process improvement. Meanwhile , Catalin et al. (2014)
stated that the first step in the implementation of TQM is for the organization to identify
the level of her quality provided through its products and services. The study listed
training, planning, evaluation and implementation as the stages in TQM evaluation.
Christofi et al. (2008) explained that theory and practice of TQM have evolved over the
last three decades from the technical aspects of quality control and employee training to a
supply-chain-wide delivery of excellent products and services. The concept of TQM
reinforces the companies to perceive the quality from the customer perspective and the
focal point of TQM is the definition given to quality by the customers. The reinforcement
categories of the employees being the basis of the concept of TQM are: sharing
knowledge regarding the organizational performance with the employees; awarding
related to the organizational performance; providing the required knowledge to the
employees for them to comprehend the organizational performance and participate in it;
and reinforcing the employees in order for them to take decisions in the organizational
management effectively (Duran et al., 2014).
38
Researches on the critical factors related to TQM implementations are highly needed as
the search for the genuine keys to success in TQM implementation has become a matter
of deep concern to management of companies in the world. Insufficient organizational
data and information on the critical factors is a hindrances to implementation of TQM in
an effective way (Psomas & Fotopoulos, 2010). Töremen, Karakuş, and Yasan (2009)
give a breakdown and comprehensive explanation of TQM by explaining its concepts of
such as Total, Quality and Management. The study explains that TQM engages all
divisions, departments and levels of the organization with its strategies and operations
around the customer needs and develops culture with high employee participation.
In contrast, stated that TQM has been widely adopted as an integrative management
philosophy (Fok, Fok, & Hartman, 2001; Kahreh, Shirmohammadi, & Kahreh, 2014);
that focusses on continuously improving the quality of products and processes to meet
customer expectation; it is an alternative approach to improve competitiveness as many
companies have come to realize that improved quality is an essential ingredient for
successful global competition. However not all organizations that employed TQM in their
undertaking were successful due to primary reasons like lack of top management
commitment, unrealistic expectations within the time frame, lack of employee
cooperation, failure to develop and sustain a quality-oriented culture , lack of motivation
and cost of TQM implementation. In general, TQM requires cross-functional thinking
planning and doing (Svensson & Wood, 2005); it has become worldwide management
topic and its most emphasized concepts include continuous improvement, customer
focus, human resources management and process management (Isaksson, 2006).
39
Furthermore, Izvercian et al. (2014) examined the special relationship between TQM and
human resources management when it comes to systems for continuous improvement.
The study stated that human resources management is practiced as part of quality
planning at enterprise level and directed to the needs of the closest customers. The
purpose of the relationship is to improve performance – both the quality of the system
and people’s performance. Tarí (2005) explained the successful components of TQM to
be: customer-based approach; quality planning; management commitment and leadership;
management based on facts; and continuous improvement. The study states that those
components must be implemented by managers in order to develop TQM to its full
extent, as a management system developing quality and competitiveness. Kahreh et al.
(2014) explained further that TQM evolved as an increasingly fashionable management
innovation in response to the lack of competitiveness in US manufacturing companies
during the 1980s and the emergence of superiority of Japanese firms in delivering high
quality products and services in consonant with customer demands and gaining
operational efficiency. The TQM movement advocates for developing and implementing
a corporate wide culture emphasizing customer satisfaction, continuous improvement,
employee empowerment, and data driven policy decision (Kannan & Tan, 2005).
The adoption of TQM and corporate social responsibility approaches improve the
capacity of hotels to create benefits for their stakeholders, and these results have a
positive effect on their organizational performance (Velasco, Quintana-Garcia &
Marchante-Lara, 2014). To support companies in facing both the ever-growing
environmental and social pressure and the fulfillment of customers’ needs, the use of
Design Management for Sustainability is an effective design management tool that allow
40
us to perform design activities incompliance with the goal of sustainability (Fargnoli, De
Minicis, & Tronci, 2014).
Sharma, Lawrence, and Lowe (2010) stated that the introduction of TQM routines within
the organization has been identified as being part of a broader process to enact and add
legitimacy to management control systems (MCS) changes within organizations. TQM is
developed as a result of global competition (Ahmad et al., 2014). The study shall
investigate the impacts of TQM on sustainable development to ensure that it meets the
needs of the present without compromising the ability of the future to meet their own
needs. Moreover, the quest for more study to fill the void on sustainable development
study, its specific need in food and beverage companies, the proposed theoretical
extension of involving TQM in the assessment framework, the conceptualization and
generalizability of key elements of TQM to meet the peculiarities of social, economic and
environmental growth are the issues that provoked the essence of this study.
This study is extensively motivated by limitations derived from the previous studies on
TQM and organizational performance. Siddiqui, Haleem and Wadhwa (2009) opined that
many empirical studies have been carried out on TQM and flexibility in organizational
systems has been studies to a great depth in the past. Also, Ahmed, et al. (2014)
conducted an explorative study of moderating effect of ASEAN “Association of South
East Asian Nations” Free Trade Agreement (AFTA) on TQM practices and business
performance due to today’s highly competitive market which demands for quality for
companies to survive in global workplace. In the same way, the impact of organizational
culture on the successful implementation of TQM was determined through cross-cultural
context on organizational structure (Rad, 2006).
41
In addition, Calvo-Mora, et al. (2014) examined the relationship between TQM social
and technical factors and their effect on organizational results making European
Foundation Quality Management (EFQM) model as a reference. Zárraga-Rodríguez and
Álvarez (2014) also opined that TQM models and practices help organizations to achieve
significantly in their results, performance and increase competitiveness when EFQM
model is employed with introduction of information capability. Chong and Rundus,
(2004) stated that the higher the degree of market competition, the more positive the
relationship that exists between TQM practices and organizational performance. Al-
khalifa and Aspinwall (2000) explained the transformation of TQM from evolution of
Quality from inspection, through quality control and quality assurance, finally to TQM.
The study explained that the continuous revolution has transformed organizations from
an inefficient environment with dependence on inspection, an autocratic leadership and
hierarchical control by paying attention to customer needs and satisfaction, receiving
quality right first time and continuously developing processes.
Historically, the roots of TQM can be traced back from 1920s when statistical theory was
first applied to product quality management. Later developed by Americans such as
Deming, Juran and Feigenbaum in Japan by widening the focus from quality of products
to quality of all issues within an organization (Laxmikumari, Kumar, & Ramana, 2014).
Rungtusanatham, Ogden, and Wu (2003) , examined the advancing theory development
of TQM from ‘Deming management method’ perspective. The study explained the
scientific research related to the Deming management method and the contributions of
such research to theory development in TQM by highlighting two streams of research
42
related to the Deming management method, namely the concept of profound knowledge
and the Deming-based theory of TQM.
In all these views of scholars about TQM approaches, it was evidently established that
TQM practices required team work, quality planning, quality training, continuous process
improvement, management commitment, focus on customers, benchmarking, quality
assurance , focus on processes and prevention. Some of all these elements are equally
regarded as the core of TQM elements in this study.
2.4.1 Total Quality Management (TQM) Definitions
TQM is defined in different ways and manners; no single definition can capture the
whole picture of TQM as different authors have numerous perceptions about TQM which
influence the way they define it (Eriksson & Hansson, 2003). TQM definitions vary
according to the approach. According to Agus and Hassan (2011) , TQM provides set of
practices that encompasses continuous improvement, meeting customer’s requirement,
work reduction, long-range thinking, increased employee involvement and teamwork,
constant measurement of results , good intimacy with suppliers, process design ,
competitive benchmarking and team-based problem-solving.
Baird et al. (2011) defined TQM as an integrative organizational-wide philosophy which
is aimed at continuous improving the quality of products/services and processes in order
to meet customer satisfaction. The authors conducted an analysis of the association
between the dimensions of organizational culture profile (OCP) measure with the intent
of use of TQM practices, measured Kaynak’s four core TQM practices which are: quality
data and reporting, supplier quality management, product/service design and process
43
management. TQM emphasized the importance of people related issues as a dimension of
quality (Basu, 2014). TQM can also be defined as a continual method, techniques used in
sustaining the continuous improvement and satisfying customers’ demands (Bon &
Mustafa, 2013). Brun (2011) explained that TQM involves the understanding and
implementation of quality management principles and concepts in every parts of business
activities. He opined that TQM requires that the principles of quality management must
be applied at every level, every stage, unit and every department of the organization.
According to Brun (2011), TQM is a vision which a firm can only achieve through long-
term planning, by scheduling and implementing the annual quality plans that lead the
firm towards the achievement of the vision. Also Christofi et al. (2008) defined TQM as
a supply-chain-wide quality commitment from the supplier, to the producer and finally to
the consumers of an organization in order to achieve excellence in production and service
management. On the other hand the study defined TQM as a process a management
philosophy or a culture that promotes and values the customers’ needs, expectations and
satisfaction. Also, Corredor and Goñi (2011) added that TQM advocates for a universal
application to organizations and organizational activities which makes it almost
prescriptive in orientation. In other word, TQM is a managerial process and a set of
disciplines that are coordinated to ensure that the organization consistently meets and
exceeds customer requirements (Töremen et al., 2009).
In other word, TQM is a continuous endeavor to fulfill and preferably exceed, the
customer needs and expectations at the lowest cost, by continuous improvement work
and labour, to all those which involved are diligently committed, focusing on the
processes in the organization (Izvercian et al., 2014; Isaksson, 2006). TQM is a holistic
44
management philosophy, which struggles for continuous organizational improvement
(Kahreh et al., 2014). In addition, TQM is seen as a management philosophy that covers
both the needs to satisfy external and internal customers’ needs and expectations and the
significance of doing right things first in the right time (Al-khalifa & Aspinwall, 2000).
Laxmikumari et al. (2014) stated that TQM is a comprehensive, participative, and
structured approach to planning and implementing a constant organizational
improvement process in order to improve the quality of products and services through
ongoing refinements in response to continuous feedback. Within the education context,
literatures like Sallis, (2002); Militaru, Ungureanu, and Creţu (2013) explained that TQM
is a holistic approach out of which seven elements which are philosophy, vision, strategy,
aptitude, resources, rewards and organization should not be left out; each element should
be seen as an indispensable tool in order to avoid jeopardy. Mohammed, Tibek, and
Endot (2013) defined TQM as the evaluation of the needs, requirements and expectations
of individuals and organizational coherence through continuous development work as the
organizational level in entirety.
Whereas Naghshbandi, et al. (2012) defined in from different perspective as a key
strategy to hold a competitive superiority and a management method to improve
productivity and efficiency finally leading to utmost quality. The study emphasizes on the
assessment of military force staff’s willingness for TQM approval in Tehran Province.
Perdomo-Ortiz, González-Benito, and Galende (2006) regarded TQM as multi-
dimensional concept that acts beyond quality standards, procedures, techniques and tools
for controlling quality and quality itself understood as a business outcome. TQM can be
concluded to be an effective resource that can be adopted to pursue other types of
45
competitive performance that quality and innovation (Prajogo & Sohal, 2006) . Sharma,
Lawrence, and Lowe (2010) mentioned TQM to be set of practices that follow
management concepts and techniques that seek to involve managers and employees in
achieving continuous performance improvement.
From the several definitions given by scholar in the field of TQM, one most important
thing mentioned in all the definitions is continuous process improvement. Unarguably, if
the continuous improvement can be attained by any organization, such organization can
maintain the competitive advantage in performance, which eventually lead to high
organizational performance. In summary, the researcher then comes up with the
following operational definition of TQM in food and beverage companies’ context which
captures all the above stated definitions.
TQM in this study is defined as a management philosophy with systematic approach of
managing quality purposely established in achieving high performance in terms of
financial, customer satisfaction and production achievement which requires commitment
from the company leadership by adopting effective core quality elements (quality
assurance and continuous process improvement) to develop a productive and sustainable
environment, which expedites the continuous improvement for all agro-allied processes
and activities.
2.4.2 The Benefits of Total Quality Management (TQM)
Generally, TQM is considered to be beneficial as regarded its results got from successful
implementation. The successful results can be measured using a number of approaches;
and the commonest approach is estimating benefits of TQM through the cost of poor
46
quality (Huang & Lin, 2002; Ahire & Dreyfus, 2000; Basu, 2014; Svensson & Wood,
2005). In other word, many researchers revealed that the most paramount goal of TQM is
improving organizational performance (Tannock, Krasachol, & Ruangpermpool, 2002;
Benavides-Velasco, Quintana-García, & Marchante-Lara, 2014; Kumar, et al., 2009;
Abdullah, 2010 ; Corredor & Goñi, 2011; Duran et al., 2014; Kannan & Tan, 2005;
Laxmikumari et al., 2014).
Similarly , it is revealed that adopting TQM has benefit of improving sustainable
development (Todorut, 2012; Christofi , et al., 2008; Isaksson, 2006; Izvercian et al.,
2014); enhancing production performance and customer performance (Agus & Hassan,
2011); direct association of TQM on operational performance (Baird et al., 2011);
positive impact on labour productivity (Benavides-Chicón & Ortega, 2014; Mohammed
et al., 2013); impact on innovation in services organizations (Bon & Mustafa, 2013;
Perdomo-Ortiz et al., 2006; Prajogo & Sohal, 2006) ; and impacts on educational system
(Töremen et al., 2009; Militaru et al., 2013).
2.4.3 The Elements of Total Quality Management (TQM)
Many studies have been carried out to identify those core elements used in constituting
TQM paradigm (Gonzalez-Padron, Akdeniz, & Calantone, 2014; Hua & Lee, 2014;
Adina-Petruţa & Roxana, 2014; Walsh, Hughes, & Maddox, 2002; Karapetrovic &
Willborn, 2000). In Huang & Lin, (2002) the successful implementation of TQM are
influenced by three key reasons which are: top management commitment; all level and
employee involvement; and continuous improvement. According to the study, the
concept of TQM was developed to convey the total, organizational wide efforts, which
comprises the whole workforce concentrating on continuous improvements for customer
47
satisfaction. The elements are observed from three different point of views as follows:
empirical studies, contributions from quality gurus and quality award models (Tarí,
2005). In consonance with this approach, in this current study, the study researcher will
identify the core elements of TQM.
In other words, the commonest core values of TQM are customer focus, continuous
improvement, focus on facts, focus on processes, participation of everybody and
leadership commitment (Isaksson, 2006). It is noteworthy that Quality management has
evolved through five stages namely Quality Inspection, Quality Control, Quality
Assurance, TQM, Excellence models including Six Sigma and Lean manufacturing
(Tran, Cahoon, & Chen, 2011).
In addition, ISO standards in identifying the core elements of TQM generally focusses on
ensuring that the organization can continuously deliver products and services, which can
meet the customer’s requirements. The eight quality management principles according to
ISO 9000 include customer focus, leadership, and involvement of people, process
approach, system approach to management, beneficial supplier relationship, and factual
approach to decision-making and continual improvement (ISO 9000: 2008). These
principles can always be employed as a guide to control an organization towards
improved performance. Also, Ho (2010) mentioned that over the last century, the
Japanese formalized a technique called 5S practice which is the first step towards TQM.
The 5-S stands for structurise, systematize, sanitize, standardize and self-discipline.
Through the formalization of this technique, a framework which allowed a successfully
convey of message, achieve total participation and systematic implementation of the
practice was established.
48
According to Abdullah (2010) a research was conducted concerning TQM practices and
organizational performance with the performance criteria of employee training and
development, process management, quality measurement and benchmarking, top
management commitment, customer involvement and satisfaction and planning and
strategy with positive impact as a result on organizational performance. Meanwhile, Fok,
Fok and Hartman (2001) used the word TQM maturity in a qualitative sense as a
construct developed from TQM implementations. The study stated that TQM
implementation can be measured by examining three dimensions: the perceived use of
TQM programs; employees’ perceived influence on quality issues and employees’
understanding of specific TQM techniques.
Based on comprehensive review from TQM literatures, empirical studies and models of
quality award (Tran, Cahoon & Chen,2011; Toremen , Karakus and Yasan, ,2009; Sun &
Cheng, 2002; Chen, 2013; Militaru et al., 2013; Rungtusanatham et al., 2003; Kahreh et
al., 2014; Izvercian, et al ,2014 and others), the researcher has identified two initial core
elements of TQM . Table 2.3 summarizes the elements as dimensions of TQM. A
discussion of the two core elements follows.
Table 2.3:
Summary of TQM Core Elements Development Studies
Core elements Author/s (Year)
Continuous
Process
Improvement.
Adina-petruta and Roxana, 2014; Walsh, Hughes and Maddox,
2002; Atkinson, 1994; Barber, Munive-hernandez, & Keane,
2006; Cachay & Abele, 2012; Choi, 1995; Christofi et al., 2008;
Ellis & Castle, 2010; Intra & Zahn, 2014; Irani, Beskese, & Love,
49
2004; Jonsdottir, Ingason and Jonasson, 2014; Frances, Boer, &
Gertsen, 2003; Jung & Wang, 2006; Krittanathip, et al., 2013;
Krittanathip, et al., 2013.
Quality Assurance Abdous, 2009; Alkafaji, 2007; Cheng, 2003; Lim, 2008; Cukier,
et al., 2012; Jabnoun, 2002; Karapetrovic and Willborn, 2000; Lau
& Tang, 2009; Law, 2010; Timothy, 2008; Mergenthaler,
Weinberger, & Qaim, 2009; Moldovan, 2012; Moore, et al., 2007;
George, 2008.
2.4.3.1 Continuous Process Improvement
One of the commonly discussed TQM elements in literatures is continuous improvement
or continuous process improvement (Intra & Zahn, 2014; Irani, Beskese & Love, 2004;
Jonsdottir, Ingason & Jonasson, 2014; Frances, Boer, & Gertsen, 2003). Continuous
improvement has proven to be a very powerful tool in organization (Krittanathip, et al.,
2013). And also, from the elements of TQM, all are highly structured towards one
philosophy that is continuous improvement, in order to enhance the better performance of
an organization (Suárez‐Barraza, Ramis‐Pujol, & Llabrés, 2009).
According to Adina-Petruta and Roxana (2014), competitiveness, innovation and
performance are the goals of the present business environment under the given
circumstances concepts such as quality and continuous improvement become important
catalysts in achieving this goals. Their study focuses on integrating six-sigma with
quality management for the development and continuous improvement of higher
education institutions. The finding shows that continuous improvement is achieved by
50
measuring the quality of processes and outcomes of research and educational products
and services. In addition, it is argued that for continuous improvement to be efficiently
manifested, teamwork has to be maintained (Atkinson, 1994)
Christofi, Sisaye and Bodnar (2008) stated that, continuous process improvement is
regarded as one of the TQM principles’ three main dimensions after customer focus and
total involvement or universal responsibility by proponents of quality movement. Ellis
and Castle (2010), conceptualized a parallel relationship between continuous process
improvement and teacher research by outlining the underlying characteristics, processes
and sub-process employed by teacher researchers. The study revealed that a defensible
analytical case has been built where teacher research is conducted; the teacher’s practice
and the education of the students is undergoing continuous process improvement.
In other words, Intra and Zahn (2014) opined that a holistic continuous process
improvement must be given in today’s business environment for enterprises to
successfully implement Lean Production System (LPS). In this research paper, the state
of the art for continuous process improvement concepts is described. It is therefore
concluded that continuous process improvement is a very helpful brick for a sustainable
vitalization and evolution of the LPS. Jung and Wang (2006) explicitly studied the
relationship between TQM and continuous improvement of international project
management. A cross sectional survey was obtained from 100 middle levels to senior
level international managers is used to validate the hypotheses formulated in this study.
The study finally suggests that the mutual relationship between soft TQM elements and
continuous improvement of international project management (CIIPM) is more
significant than the relationship between hard TQM elements and CIIPM.
51
From the perspectives of the three renowned quality Gurus, Crosby (1979), Deming
(1986) and Juran (1988), continuous improvement has been a point of encouragement
that necessitated worldwide competitiveness, distinguished by rapidly changing
technology advancement and customer demand for higher ground of value. In the same
way, Jonsdottir, Ingason and Jonasson (2014) examined continuous improvement
projects in certified organizations in Iceland. The study stated that benchmarking
organizations place importance on continuous improvement and systematic approach to
projects. The literature therefore analyzed how certified organizations support continuous
improvement by studying what kind of process is in place to support continuous
improvement; whether continuous improvement is handled formally; who is responsible
of carrying out continuous improvement projects; and which tools are explored for these
project management.
Summarily, continuous process improvement is conceptualized in terms of systematic
improvement approach for organizational process, continuous look for ways to improve
the manufacturing process, effective feedback system, standardized documentation of
quality assurance, continuous review of organizational performance related issues,
continuous evaluation of quality-related strategies, and complete integration of the
quality assurance system (Barber, Eduardo & Keane, 2006; Krittanathip, et al., 2013;
Suarez-Barraza, Ramis-Pujol & Llabres , 2009; Walsh , Hughes & Maddox, 2002 ;
Mandal, 2012).
2.4.3.2 Quality Assurance
This second element of TQM involves the concept of systematic management and
assessment procedures used to ensure achievement of quality outputs or improved
52
quality. Quality assurance, based on clarification and comprehensive review is structured
around three sequential non-linear phases namely: planning and analysis; design,
prototype; and production; and post production and delivery (Abdous, 2009).
To start with, Alkafaji (2007) examined quality assurance review programs of auditing
firms from international perspective. The purpose of the study is to compare and contrast
quality assurance review programs in different parts of the world in order to identify
similarities and distinctions in these programs. A survey for information request was sent
to the accounting regulatory bodies who are members of the international federations of
accountants (IFAC). The result was consequently analyzed to identify similarities and
differences in the design and implementation of such programs. The result showed that
countries with significant stock markets tend to require quality assurance programs of
their accounting firms while countries of less significant stock markets tend not to require
such programs.
Toremen, Karaku, and Yasan (2009) posited that in TQM , the responsibility for quality
is located in both the individuals and team through some developmental processes which
represents an approach to quality assurance to be more accordant with the structures and
fundamental ethics of educational organizations than many of the more mechanistic and
hierarchical processes. Procedures for quality assurance on goods and services have
evolved perpetually in accordance with the socio-cultural and technological changes that
have marked the rapid evolution of society (Catalin, Bogdan, & Dimitrie 2014). Tran,
Cahoon and Chen (2011) explained that ISO was developed from Quality Assurance;
Quality Assurance enabled the occurrence of quality management during the new-product

53
development process and focused on continuous improvement as a key quality
management practice.
Cheng (2003) explained quality assurance in relation to internal, interface and future
education. The study opined that quality assurance is divided into three different
paradigms in education. The first wave paradigm is the internal quality assurance that
improves the internal environment and process such that the effectiveness of learning and
teaching can be ensured to achieve the planned goals; while the second wave paradigm
which is interface quality assurance ensures that education services satisfy the needs of
stakeholders and are reckonable to the public accessibility. And lastly, the third wave
paradigm, future quality assurance which emphasizes on ensuring the relevance of aims,
content, practices and outcomes of education to the future of new generations in a new
era of globalization , information technology and the knowledge-driven economy.
In understanding quality assurance, Lim (2008), conducted a cross country case study
research on understanding quality assurance. The purpose of the study is to highlight the
dynamics of quality assurance policy implementation within and across institutions for an
offshore degree. Interviews were conducted and data were obtained from a business
school of a private university college in Malaysia that is a major exporter of higher
education degrees and its offshore business partner. The study revealed that there is
heavy reliance on the university for quality assurance might not be healthy, especially
when the university’s own policy implementation is suffering from internal problems.
In a few words, quality assurance is conceptualized in terms of systematic approach , a
type of quality management practice and primarily involves establishing organizational
54
procedures and standards for quality (Cukier, et al., 2012); an activity providing to all
concerned, the evidence needed to establish confidence that the quality function is being
performed properly (Karapetrovic & Willborn, 2000 ; Lau & Tang, 2009; Law, 2010;
Timothy, 2008; Mergenthaler, Weinberger & Qaim, 2009; Moldovan, 2012; Moore, et
al., 2007; Rady , 2005; Seip, Frich, & Hoff, 2012; Manorama & Jeevan, 2009).
2.5 Environmental Regulation and Policy (ERP)
Environmental quality is measured by the level in which ERP is being properly followed.
It is an attribute of the regulatory socio-natural relationship, the functional significance of
which depends in the ability to reflect the maximum processes of environmental safety
(Chervinski, 2014). The high demand for compelling environmental regulation on
product end-of-life and production processes is enhanced by customer concerns for
environmental protection (Santos-Reyes & Lawlor-Wright, 2001). Daniel and Arthur
(2005) discussed the environmental issues based on environmental sustainability index.
The study showed that no environmental conservation and laws issues have been
discussed extensively in terms of environmental pollution issues. The study proved that
the environmental information, transparency and accountability, adequate capacity for
credible enforcement and other policies would promote the better environmental
performance of the activities done by the concerned institutions at home and abroad.
Leshinsky (2012) stated that the use of planning agreements to support sustainability and
environmental preservation through a contextual framework that will draw collaborative
planning theory and practice for planning agreements together can be used as a tool to
preserve environmental values and principles generally. The study explored a case study
of municipality of Casey located in the state of Victoria and measures are introduced
55
through planning agreements between the municipality and estate developers in order to
preserve green values and the flora and fauna located in the surrounds of the Royal
Botanical Gardens in Cranbourne. The finding revealed that planning may have
established excellent procedure and practice to preserve the environment of the botanic
gardens but the effectiveness of the planning agreements as an environmental
preservation tool has limitations like lack of resources for more effective information
distribution and enforcement.
In other words, Madu, Kuei and Winokur (1995) opined that many corporations have not
yet realized the potential of natural environmental quality planning and its impact on a
company’s product quality, competitive advantage and growth in market share. The study
posited that after embarking on the policy of TQM, the next step for corporations is the
implementation of a natural environmental quality planning programme. The study
concludes that Japanese companies that have embraced this marketing theory are quietly
gaining a competitive advantage over the US firms. Environmental Quality Act 1974 in
Malaysia defines environment to be the visible factors of the environs of human beings
which comprise land, water, atmosphere, climate, sound, the biological and the social
factors of aesthetics. Environment is regarded as all things that surround a matter and
having a direct impact on it. The environment in which man is encapsulated is affected by
factors which may be natural, artificial, social, and biological or psychological (Birnie,
Patricia & Boyle, 1994). A natural environment is one in which human impact is kept
under a certain limited level, also can know as Human survival and economic activity
dependent of this specific type of climate, weather and natural resources. In addition, the
natural environment is referred to as everything present at the surface of the earth like the
56
land, water, plants and animals, and are considered as what can affect the human activity.
Such example is the industrial development that is causing widespread pollution to our
immediate environment (Marquita, 2010).
2.5.1 Environmental Legislations in Malaysia
Historically, one of the richest countries in terms of environmental resources in the world
is Malaysia with abundant mineral resources and high biodiversity but presently her
tradition faces a lot of environmental problems like pollution by air and water, and natural
resources exploitation. The Malaysian government passed some laws in order to tackle
the environmental problems such as the National Parks Act Law, Civil Law Act 1972,
and Environmental Quality Act 1974 with some obligations form international bodies.
Environmental quality is a general term which can refer to varied characteristics that
relate to the natural environment as well as the built environment, such as air and water
purity or noise pollution, and the potential effects which such characteristics may have on
physical and mental health (Meinrat, 1991). Environmental Quality Act provides for the
prevention, abatement, and control of pollution through licensing, and mandates the
conducting of an Environmental Assessment Report for proposed public and private
sector projects to determine and prevent or prepare for the environmental consequences of
the project (Rafia, Hassan & Ibrahim, 2003). It was brought into effect in 1974 with the
implementation of a subsequent set of specific regulations and laws. The emission
standards for air pollutants are laid down in Environmental Quality by Ministry of
Natural Resources and Environment, Malaysia. The Regulations came into force on 1st
October, 1978. The Regulations set maximum permissible emission values for various air
pollutants from particular trade, industry or process. And also, emissions of Sulphuric
57
oxides and nitrogen oxides from combustion process which are not properly regulated
(Awang et al. 2000).
Environmental quality can be described under several views while air pollution index is
being used in Malaysia. For air pollution indices in general, where Air Pollution Index
(API) is a simple and generalized way to describe the air quality, which is used in
Malaysia. It is calculated from several sets of air pollution data (Rani, 1995). It was
formerly used in mainland China and Hong Kong. In mainland China the API was
replaced by an updated Air Quality Index in early 2012, and on 30 December 2013 Hong
Kong moved to a health based index. API is used by the Malaysian government to
describe the air quality and its value is calculated based on average concentrations of air
pollutants, namely sulphur dioxide, nitrogen dioxide, carbon monoxide and ozone. The
API is reported on a scale starting from 0, a score of 0 to 50 is considered good, 51 to 100
is moderate, 101 to 200 is unhealthy, 201 to 300 is very unhealthy and anything higher
than 300 is hazardous. A state of emergency is declared in the reporting area if the API
exceeds 500 (Awang et al. 2000).
In conclusion, this section affirms the fact as referred by the literatures that
Environmental Regulation and policy are set in place by Malaysian government to
preserve the natural environment from any form of pollution.
2.5.2 Environmental Quality Act (EQA) of 1974 in Malaysia
One of the laws that serves as the legal tool is the Environmental Quality Act 1974
implemented by the Federal Department of Environment (DOE) in Malaysia to protect
the natural resources. The act serves as regulatory body for pollution caused by industries
58
and alleviates the effect of environmental degradation through bodies that form the model
of the act which is exclusively a pollution law with a focus on coordinating the industrial
pollution through official licensing with the addition of an EIA order for the management
of the activity development. EIA Act is being regulated through federal legislation and
guidelines of the environmental quality order 1987. Environmental problems in Malaysia
were handled well when they arose before the introduction of the Environmental Quality
Act 1974. It formed a part of the administrative responsibility of governmental agencies
from the federal, state to local authority levels. Subsequently, in an attempt to formulate
an integrated approach in managing the environment, the EQA was enacted in 1974. This
was intended to regulate, prevent, abate and control pollution (Mustafa, 2009).
The EQA is primarily a pollution control law and forms foundation of legislation for
attaining national environmental objectives and policies. EQA applies to the whole of
Malaysia. It also establishes powers to be exercised exclusively by the federal
government, and it does not depend on parallel state enactments for its effectiveness
within state boundaries. It is to be noted that the Environmental Quality Act 1974 is a
framework law which means that for its provisions to take effect there is a need for the
making of rules and regulations on that provision. DOE was formulated in Malaysia in
1976 under the supervision of the Ministry of Natural Resources and Environment. The
department aims is to administer environmental management functions including the EIA
processes. Section 51 of the Act further delegates the power upon Minister to make
regulations aimed at environmental protection and pollution control (Mustafa, 2009).
59
The local legislation amended the existing Environmental Quality Act (EQA) 1974 with
the insertion of Section 34A which introduced an intensive power of the environment to
the director general in charge to safeguard, promote and protect the accessibility of the
environment through licensing, coordination and dissemination of reliable information for
public consumption (Briffett, Obbard & Mackee, 2004). Thus, for the first time, a
preventive approach was introduced within the EQA as a new environmental measure to
support the existing one. The implementation of EIA is meant to promote Malaysia's
policy objective of sustainable development. In general, it is a concept that seeks to check
and balance between economic protection and development and to incorporate
considerations on environmental decisions (Mustafa, 2009).
At the first stage, under the Quality Act of environment, 1974, the punishment are severe
with Section 2 providing Rm100,000 fine and/or imprisonment up to 5 years, which is a
conviction under the Act to prove challenging in the case of no confession or
environmental information with reliable evidence of Actus reus. To comprehend the law
as stipulated in the context of inland water resources management for the sustainability
and related provisions in the Environmental Quality Act, 1974. There is need to analyze
in the context of the definitions for pollutants and pollution itself. The Environmental
Quality Act, 1974 under section 2 gives different points that are related to interpretation
of Section 25 on restriction on pollution of inland water. There is a reinforcement of the
meanings to establish a model in preventing damages to the environment. Thus, there
may a consideration to depart from conventional reasoning to form a certain standard to
determine whether or not an offence is taken place under the environmental quality act,
60
1974 or not. The Act referring to the pollution defines it as to be a change in terms of
biological, physical or chemical features existing in any part depositing harmful
pollutants, substances or waste that adversely affect the beneficial use leading to a
situation which is harmful to public health safety including the aquatic and wild life or
leading to a violation of human right and causing infringement in which license under this
Act is subjected (Sharon, 1998).
The Environmental Quality Act, under Section 2 gives a definition that are related to the
interpretation given by section 25 on pollution of land water. It gives an affirmative
support in frame working the prevention of environmental damage to land water.
Meanwhile, the act might be considered to depart from conventional knowledge to create
a clear determination of whether or not an offence committed under the Environmental
Quality Act, 1974 (Memon, 2000). In 1974, the EQA controls pollution and also in
control of other activities like biological diversity preservation and habitat restoration and
protection. Essentially, EQA gives recognition to different environmental measures that
control pollution and prevent any environmental damage through system of licensing.
Inland water pollution with no accountability to license is an offence punishable
according to section 25 of the Act.
2.6 The Relationship between TQM, OP & ERP
There is no doubt; both TQM and ERP have gained people more attention in both
academic and business environment (Ahmad & Schroeder, 2002; Besseris, 2012). Such
popularity can be referred back to the unprecedented high number of published articles in
both fields in an attempt of the scholars in the fields to substantiate its concepts and
61
theories. In addition, the implementation success gained so far by ES also makes it to be
more renowned. This has led to a pronouncement of KM as an organization’s critical
success indicator in today’s technology-driven society. This has also opened a significant
number of opportunities for environmentalists such as environment managers and
sustainable environment creating teams in many organizations.
Thus, if ERP can be considered as organization’s critical success factors, one can then
infer that TQM can be best achieved through effective ERP, which eventually lead to a
sustainable organizational performance. In view of this fact, the researcher is interested in
investigating how combining TQM and ERP will improve organizational performance.
2.6.1 TQM-OP Research
Corredor and Goñi (2011), in his study explored the relationship between TQM and firm
performance by taking TQM as an internally consistent system of practices. The study
tested the relationship between the two variables using the universal approach to analyze
whether the most competitive firms are those adopting TQM, and equally test for an
isomorphic effect on other firms. The study used a sample of Spanish firms that have
received TQM prizes between 1997 and 2003. The study revealed TQM pioneers
experience performance gains; however, late adopters do not experience similar results.
The study concluded that firms using TQM are not necessarily better than their
counterparts are, before putting the system into action.
Also, Azizan (2010) explained the understanding of total quality management (TQM)
practices at the small to medium-sized enterprise (SME) level within the under-
researched context of the Malaysian economy. The objectives of this study were
62
designed through extensive literature review and interviews with academics experts in the
field of TQM. The objectives of this research were to determine differences in
performance and the differences in features engaged at high and lower performing
businesses. The findings of this research show those three levels of TQM application
starting with quality control, then a broader application of management involvement with
quality assurance process and finally a system-wide application of TQM that involves a
high degree of strategic integration of TQM principles. This research focuses on eight
SME businesses that employed simple technology such as plastic injection molding and
metal stamping. This paper provides an understanding of TQM practices offering design
advice for professional managers and academia who work within SME businesses. The
paper finds that there is a logic and structure to high performance businesses and the
application of TQM.
On the other hand, Changiz (2011) provided in his study, reliable and valid constructs of
total quality management (TQM) and a measurement instrument in the context of Iranian
manufacturing small to medium- sized enterprises (SMEs). Statistical analysis revealed
that a number of significant relationships between TQM practices and organizational
performance of the manufacturing SMEs. The result found that leadership plays an
important role in enhancing organizational performance of the Iranian manufacturing
SMEs. The limitation of the study is that the sample is restricted to only a single region
and manufacturing in his data collection methodology. This study has the potential to
enhance the understanding of TQM practices impact on organizational performance of
the Iranian manufacturing SMEs amongst researches and practitioners. Also the research
adds knowledge in the field of quality management within the context of developing
63
countries and gives a particular focus on the Iran manufacturing SMEs; as a review of
literature, has identified no studies that have undertaken a comprehensive analysis of
TQM practices and organizational performance of manufacturing SMEs in the Iranian
context.
Likewise, Christos, and Evangelos (2010) examined the relationships between the total
quality management (TQM) factors and organizational performance. Exploratory and
Confirmatory Factor Analysis were applied to assess the measurement model reliability
and validity. The TQM factors revealed by the study were the quality practices of the top
management, employee involvement in the quality management system, customer focus,
process and data quality management and quality tools and techniques implementation.
According to the study, these factors significantly affect the companies’ performance
with respect to their internal procedures, customers, market share and the natural and
social environment. The subjective data being dependent on the perceptions of the quality
managers and the fact that the sample companies came from different sectors constitute
the limitations of the study. The paper describes a reliable and a valid TQM model and a
way for a company to lay the foundations for business performance improvement.
However, David and Lynne (2007) explored the influence of a total quality management
(TQM) programme on the level of focus in project management practices. The theme of
the study is that those in organizations with a TQM programme in place are more
customer-focused in their project management practices than those in organizations with
no TQM programme. Given the exploratory nature of the research reported in this paper
there is the opportunity for further work on larger populations to confirm the
generalizability of the findings. The existence of a link between a TQM programme and
64
customer-focused project management practice provides a potential route for those
looking to improve project performance through placing a greater emphasis on satisfying
the customer. The exploratory research in this paper focuses on the link between TQM
and an area of operational practices, namely, project management-related that has
received limited attention in prior studies.
According to Fatih, Mehmet and Tezcan (2009), the extent of total quality management
(TQM) practices in primary schools based on teachers’ perceptions, and how their
perceptions are related to different variables were determined. This study was carried out
in Malatya city centre on teachers working at primary schools. There were significant
differences among teachers’ perceptions on TQM practices depending upon the variables
of branch, level of education and tenure, while there were no meaningful differences
according to the gender variable. The findings reveal the need for an effective change
management, educating staff and utilizing human resources to attain a system-wide
quality improvement, to implement the principles of TQM. Quality improvement is a
continual process that should be taken up from the operational level to senior
management. The journal would be instrumental for teachers, headmasters and principals
of primary and high colleges generally as TQM efforts at primary schools are
fundamentally important to achieve a high quality education system. This paper sheds
light on how to improve quality at this basic level.
Furthermore, Mehra and Ranganathan (2008) examined the role of total quality
management (TQM) towards enhancing customer satisfaction. It is found in this research
that TQM substantially increases customer satisfaction across diverse industrial and
cultural settings. This research broadens the scope of TQM applicability across varied
65
industrial and cultural settings to achieve higher customer focus, increased customer
satisfaction, and stresses the need for more meta-analytic studies on the subject. In the
same way, Huang and Lin (2002) besides the financial factor discussed by economists,
the authors proved that quality management should also be considered as a major factor
in this development. The research investigates how industry in Taiwan implemented
quality issues, especially total quality management, within the last decade. The result can
be used to study the comparative impacts of quality management in the area of the Asia
pacific. In addition to that, TQM, ISO 9000, total productivity management (TPM),
participation in an organizational excellence award like quality management excellence
awards (QMEA) are activities encouraged by Malaysian government in order for SMEs
to be more competitive in the global market (Abdullah, 2010).
Therefore, these aforementioned research works found that the successful implementation
of TQM can lead to improvements in organizational performance. The results showed
that TQM when consistently implemented with organizational design postulates can
increase the organizational performance benefits of TQM.
2.6.2 TQM-ERP Research
Environmental issues are business issues and that has led them playing, increasingly, a
more significant role within organizations. Christofi et al. (2008) stated in their study that
TQM has to incorporate sustainability in order to maintain and strengthen an
organization’s competitiveness, services and productivity. It should be noted that the
global and national regulations are the force attracting businesses to take into
consideration the environmental impacts of all their processes, products and services
(Stainer & Stainer, 1997).
66
In their study, Yang et al. (2013) investigated the mediating effect of an environmental
information system on top management’s commitment and environmental performance
through responses from a survey of chief financial officers or chief management
accountants in the top 200 listed companies in Australia. The purpose of the study is to
examine the antecedent factor, top management’s commitment to environmental issues,
for the adoption of a well sophisticated internal environment information system that are
measured by the broad-scope, timeliness, aggregation and integration of the information.
The result showed that top management commitment to environmental sustainability was
associated with the adoption of a sophisticated internal environmental information
system.
Also, Sarkis (2001) stated that organizational environmental regulation and policy has
been the key factor of many management theorists and progressive thinking practitioners
throughout the early part of the 1990s. The study researched on the manufacturing’s role
in corporate environmental sustainability. He posited that the natural environment and the
manufacturing functions are becoming extremely connected. From total quality
environmental management (TQEM) point of view, United States Environmental
Protection Agency approved the categorization of TQEM into seven elements namely:
environmental leadership; strategic environmental quality planning; environmental
quality management systems; human resources development; stakeholder emphasis;
environmental measurements; and environmental quality assurance. The research study
concluded that integration and development of environmental concerns into corporate
practice ranging from industrial ecology to green purchasing will be influenced by
environmental pressures and practices.
67
In the same trend, Rebelo, Santos, and Silva (2014) examined a generic model for
integration of quality, environment and safety management systems . The purpose of this
study is to propose a generic model of Integrated Management System of Quality,
Environment and Safety (IMS-QES) which can be adapted to adopt numerous
management systems. A survey was carried out in a real environment from 160
employees of a Portuguese organization where the conceived model was implemented in
a first phase for the integration of Quality, Environment and Safety Management
Systems. The result of this study highlighted: the reduction of conflicts between
individual systems with resources optimization; creation of additional values to the
business by eliminating several types of wastes; the integrated management of
sustainability components in a global market; the improvement of partnerships with
suppliers of goods and services; reducing the number of internal and external audits.
Despite, the fact that the studies conducted to show the relationship between TQM and
ERP in food and beverage company context are limited; the researcher found through the
reviewed literature that, there are some related studies (Konig, Silva, & Mhlanga, 2013;
Sangodoyin & Iipadeola, 2000; Psomas & Fotopoulos, 2010). Although these studies
contain valuable and resourceful information that can help understand the relationship
between TQM and ERP, it is important to extend these works using a more
methodologically rigorous research to distinguish the pattern of the interrelationship
between TQM and ERP empirically.
2.6.3 ERP-OP Research
Only a few researchers have studied the relationship between ERP and OP despite the
global view of the impact that environmental rules and regulation can have on an
68
organization; thereby determining its performance (Aigner & Lloret, 2013). The
insinuation about the potential impact of ERP on OP is derived from ERP’s ability to
create pro-active environmental system (Bracci & Maran, 2013). This has made ERP to
be identified as a strategic resource in the design and implementation of organizational
strategies. Dam and Petkova (2014) equally posited that ERP is directly related to OP.
Thus, establishing all these impacts of ERP on OP makes it incomplete to study OP
through TQM without considering ERP in this information and technology era.
Dutta, Lawson and Marcinko (2013) revealed that meaningful incorporation of
environmental and social responsibility goals into organizational strategic plans
contribute to performance. In the same vein, Endrikat et al. (2014) studied the
relationship between corporate environmental performance(CEP) and corporate financial
performance(CFP) through a meta-analytic review of 149 studies. Their study exclusively
showed that a positive and partially bidirectional between CEP and CFP is stronger when
the strategic approach underlying CEP is proactive rather than reactive.
In addition, Gadenne, et al. (2012) investigated the influence of sustainability
performance management practices on organizational sustainability performance in
organizations operating in Australia. Using a mailed printed questionnaires to obtained
data from 314 medium to large organizations and personal interview with 20 senior
executives, the findings revealed that the organizations apply eight sustainability
performance management practices (SPMP) to enhance seven (customer value, new
product development, information capital performance, environmental, employee value,
social responsibility and financial performance) different sustainability performance
indicators (SPIs).
69
On another end, Goosen (2012) elaborately studied the multidisciplinary
interrelationships between sustainable development, human health and the environment.
The study specifically placed emphasis on globalization and sustainable growth, bioethics
and poverty, organizational performance and sustainability, environmental management
and individual progress, human and ecosystem health and water resources and recycling.
The study posited that top management will become more informed that environmental
concerns need to be addressed and tackled within their organizations as more business
around the world incorporate ecological activities and performance in their financial
statements and reports; and also as more stakeholders require modern and better ways to
communicate green issues.
Similarly, dimensions of Global Environmental Policy Standardization is identified in
three ways from a review of the literature on the cross-country organization of
Multinational Companies (MNC)’s environmental policies: the level at which an MNC
sets minimum worldwide environmental performance standards; the extent to which an
MNC standardizes its operational environmental policies globally; and the extent to
which an MNC standardizes the content of its environmental communication globally.
Global standardization of all aspects of an MNC's environmental policy is complicated
by differences among the countries in which it operates, which include differences in
environmental regulations, in existing environmental infrastructure, and in education of
the workforce (Brown et al., 1993; Rappaport & Flaherty, 1992).
Therefore, many MNCs aim at standardizing the environmental impact of their operations
across countries, while allowing their country subsidiaries to adapt policies, procedures,
and technologies to local conditions. MNCs can achieve these goals by setting minimum
70
environmental performance standards for all their operations worldwide. Alternatively,
MNCs can focus on standardizing the content of their environmental policies. In
accordance with the literatures reviewed, two content dimensions of environmental
policies that MNCs can standardize globally are revealed (Brown et al., 1993; Rappaport
& Flaherty, 1992; United Nations, 1993).
The first dimension includes operational environmental policies, such as environmental
management practices, environmental control and auditing procedures, management
incentives for environmental performance, and environmental technologies used in
operations (Rappaport & Flaherty, 1992). The second dimension includes the content of
environmental messages in advertising and in communications to the public (United
Nations, 1993). MNCs can implement each of these environmental policy standardization
dimensions on a continuum ranging from national differentiation, in which country
subsidiaries determine their environmental standards and policies, to global
standardization, in which corporate headquarters set high global environmental
performance standards and establish environmental policies for all facilities worldwide.
Only two of these three global environmental policy standardization dimensions - setting
stringent minimum global environmental performance standards and standardizing
operational environmental policies - reduce MNCs' ability to take advantage of cross-
country differences in environmental regulations, and thus constitute self-regulation. The
third dimension, global standardization of environmental communication, aims to inform
and influence external constituencies but does not affect the environmental impact of
operations. Thus, standardization of communication can be seen as a public relations
strategy rather than a self-regulation strategy.
71
In line with the previous authors, as might be expected for ES application in
organizational performance context, little qualitative empirical research has been
conducted (Green, et al. 2012). And also, empirical research conducted by Hirsh (2014)
and López‐Rodríguez (2009) were lacking in terms of theory-building and rigorous
methodology. This therefore justifies the research gaps in the recent study.
2.7 Related Theories
There are several theories that explain how organization make use of quality management
to maximize performance such as organization and administrative theory, resources based
view (RBV), progressive utilization theory (PROUT), contingency theory and
institutional theory. The PTROUT enhances economic self-reliance, cooperatives
environmental balance, RBV explains an art of utilizing organizational resources for
sustained organizational performance and the organization and administrative theory
explains rationalization of organization activities. The PROUT lacks practical value and
relevance as clearly stated by Maheshvarananda and Branch (2010). Also the
organization and administrative theory has a huge shortcoming for focusing more on
structures and less resources (Acedo et al., 2006). The contingency theory suggests that
the appropriateness of an organizational system depends on the specific organization and
the condition under which the organization operates (Burns & Stalker, 1961; Thompson,
1967; Dent, 1990). Meanwhile according to the institutional theory, external, social,
political and economic pressures influence firms’ strategies and organizational decision-
making as firms seek to adopt legitimate practices or legitimize their practices in the view
of other stakeholders (North, 1990; Jennings & Zandbergen, 1995). The contingency
theory here has an edge over all other stated theories because it has the ability of
72
capturing resources, structure and capability of an organization, and firm strategies and
decision-making to attain sustained organizational performance. It is on the basis of this
argument that this study adopts the contingency theory as the major underpinning theory.
Meanwhile, in this study, institutional theory and contingency theory are applied to
examine the moderator because according to institutional theory, organizations create
structures to look legitimate to the important stakeholders such as TQM and ISO 9000
(Sila, 2007).
2.8 The Connection of Contingency Theory, Institutional Theory and this Study
Successful organizations employ structures and process characteristics that are suitable to
the uncertainty of their environment (Miller et al., 1992; Duncan, 1972). In this study,
environment is selected for comparative study of the relationships - the impact of
environmental regulation and policy as moderator. In accordance with contingency
theory, environment is one of the contingency factors that influence the selection of
management practices (Doty et al., 1993). Based on reviewed literatures, it is expected
that environmental regulation and policy will have much stronger relationship between
TQM and organizational performance (Ahmad, et al., 2014). Contingency theory
proposes that organizations can create congruence between organizational structure and
environmental uncertainty will achieve higher performance result (Ellis et al., 2002).
Examples for contingencies are the environment, organizational size, and organizational
strategy (Miller et al., 1992). In this study, environment is selected for comparative study
of the relationships. And also, Contingency theory is of the opinion that no theory or
method can be applied in all instances. In another vein, there is no one best way to
design, lead or manage an organization because much in business life is situational and
73
subject to a variety of environmental influences (Lau, 2014). Also, the framework of firm
resource-based theory as proposed by Barney (1991) which hypothesized that there
would be a significant and positive relationship between the acquisition of technology
innovations and organizational performance (Irwin, Hoffman, & Lamont, 1998).
Institutional Theory provides a theoretical lens through which researchers can identify
and examine influences that promote survival and legitimacy of organizational practices,
including factors such as culture, social environment, regulation (including the legal
environment), tradition and history, as well as economic incentives, whilst
acknowledging that resources are also important (Baumol et al., 2009; Brunton et al.,
2010; Hirsch, 1975; Lai et al., 2006; Roy, 1997). Institutional Theory is traditionally
concerned with how groups and organizations better secure their positions and legitimacy
by conforming to the rules (such as regulatory structures, governmental agencies, laws,
courts, professions, and scripts and other societal and cultural practices that exert
conformance pressures) and norms of the institutional environment (DiMaggio & Powell,
1983, 1991; Meyer & Rowan, 1991; Scott, 2007). Consider the issue of early
implementers or late implementers. Institutional Theory (Di Maggio & Powell, 1983;
Meyer & Rowen, 1977) tries to account for homogeneity between organizations. Indeed,
a number of authors use Institutional Theory in the analysis of TQM (Mueller & Carter,
2005; Sila, 2007; Staw & Epstein, 2000; Westphal & Shortell, 1997; Zeitz et al., 1999).
This study focuses on the relationship between the relationship between TQM practices
and organizational performance among food and beverage companies in Malaysia using
environmental regulations and policy under environmental regulation and policy as the
moderators. Institutional theory was chosen for this study to complement contingency
74
theory because it offers a theoretical connection between TQM and organizational
performance (Mueller & Carter, 2005).
2.9 Research Constructs and Measuring Dimensions
This is to conceptualize each of the constructs involved in this study’s model with
highlight of the explicit dimensions to be used in measuring each of the constructs.
Constructs to be conceptualized are given the befitting metric as the direction of this
study suggests are Organizational performance, Environmental regulation and policy and
TQM. Under TQM, Quality assurance, and Continuous process improvement are the sub-
variables.
2.9.1 Operational Definition and Measuring Dimensions on Organizational
Performance (OP)
In review of literature in the past studies, it is understood that there are discrepancies in
the way the constructs of OP were measured. The constructs for measuring OP was based
on how Organizational Performance was mostly defined by previous studies in terms of
Customer satisfaction, financial performance , employee and/or shareholders satisfaction,
operational performance, sales growth, market share, return on capital invested
(Sillanpää, 2011; John & Ngoasong, 2008; Epstein, Buhovac, & Yuthas, 2012; Argilés-
Bosch et al., 2014; Akgün, et al., 2014; Alomaim, Tunca, & Zairi, 2003; Fawcett, Smith,
& Cooper, 1997; Feng, et al., 2013). However, this study employs financial performance,
customer satisfaction, and operational performance as the dimensions in measuring
organizational performance of food and beverage companies as focused by this study as
the measurements have been tested and validated to effectively measure organizational
performance
75
Respondents are required to indicate their views on how organizational performance is
influenced by TQM with or without the presence of the moderators based on five-point
Likert scale from “1” =Strongly Disagree to “5”= Strongly Agree.
2.9.2 Operational Definition and Measuring Dimensions of TQM
Baird et al. (2011) argued that TQM is a management philosophy with systematic
approach of managing quality purposely established in achieving high performance in
terms of financial, customer satisfaction and production achievement which requires
commitment from the company leadership by adopting effective core quality elements
(quality assurance and continuous process improvement) to develop a productive and
sustainable environment, which expedites the continuous improvement for all agro-allied
processes and activities. Furthermore, in this present day, TQM practices refer to those
responsibilities and duties performed in organizations regardless of size or goal, to
effectively enhance organizational performance (Aurelie & Fallery, 2010). Although
there are many disputations and inconsistencies on what comprises TQM practices as
extensively discussed in many previous studies (Stanciu, Constandache, & Condrea,
2014; Sahai & Srivastava, 2012; Rodrigue, Magnan, & Boulianne, 2013). This study
under this heading, investigates quality assurance and continuous process improvement
as they are more elaborate and comprehensive as justified in previous sections. Their
operational definitions and attending dimensions are discussed below.
2.9.2.1 Quality Assurance
Quality assurance basically is the maintenance of a desired level of quality in a service or
product, especially by means of attention to every stage of the process of delivery or
production. It involves systematic management and assessment procedures used to ensure
76
achievement of quality outputs or improved quality. This study employs planning and
analysis, design, production, post production and delivery (Abdous, 2009 ; Tran,
Cahoon, & Chen, 2011; Cukier, et al., 2012) as befitting sub-variables to investigate
Quality assurance in Food and Beverage companies of Malaysia.
2.9.2.2 Continuous Process Improvement
Continuous Process Improvement, also often called continuous improvement is an
ongoing effort to improve products, services, or processes. Organizations are now
employing this philosophy as it seeks incremental improvement over time or
breakthrough improvement all at once. This study encapsulates the associated efforts of
continuous improvement under the use TQM to impact organizational performance.
Quality of processes, company products and services and effective feedback system
(Adina-Petruţa & Roxana, 2014 ; Jonsdottir, Ingason, & Jonasson, 2014 ; Barber,
Munive-hernandez, & Keane, 2006) are used as sub-variables of Continuous Process
Improvement.
2.9.3 Operational Definition and Measuring Dimensions of ERP
Several attempts have been made from past studies to conceptualize ERP ; such as,
Bracci and Maran (2013) and Dutta, Lawson and Marcinko (2013) . Moreover, one thing
that appeared to be very common in those interpretations is that they referred ERP as an
important rules and requirement that generally covers two things: pollution control:
regulating how much pollution such as chemicals and undesirable materials in achieving
organizational performance. This has made many organizations to consider it as a
necessity with the rate at which environmental regulation and policy improves
organizational performance through environmental management (Krechovská &
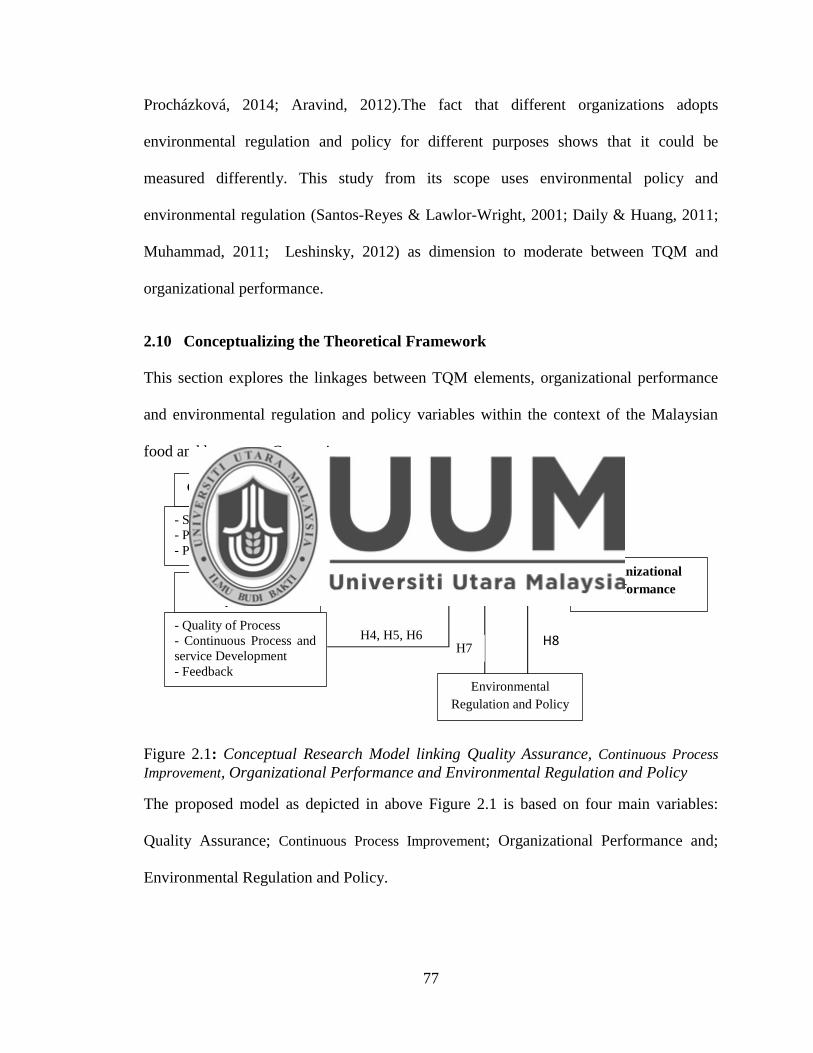
77
Procházková, 2014; Aravind, 2012).The fact that different organizations adopts
environmental regulation and policy for different purposes shows that it could be
measured differently. This study from its scope uses environmental policy and
environmental regulation (Santos-Reyes & Lawlor-Wright, 2001; Daily & Huang, 2011;
Muhammad, 2011; Leshinsky, 2012) as dimension to moderate between TQM and
organizational performance.
2.10 Conceptualizing the Theoretical Framework
This section explores the linkages between TQM elements, organizational performance
and environmental regulation and policy variables within the context of the Malaysian
food and beverages Companies.
Figure 2.1: Conceptual Research Model linking Quality Assurance, Continuous Process
Improvement, Organizational Performance and Environmental Regulation and Policy
The proposed model as depicted in above Figure 2.1 is based on four main variables:
Quality Assurance; Continuous Process Improvement; Organizational Performance and;
Environmental Regulation and Policy.
Quality Assurance
Continuous Process
Improvement
Organizational
Performance
Environmental
Regulation and Policy
- Strategic Planning
- Process focus
- Production and delivery
- Quality of Process
- Continuous Process and
service Development
- Feedback
H1, H2, H3
H4, H5, H6 H7
H8
78
2.11 Hypothesis Formulation
Hypotheses to be tested in the research study are formulated and presented below:
H1: Quality assurance as a TQM element has a significant effect on financial performance
of an organization
H2: Quality assurance as a TQM element has a significant effect on operational
performance of an organization
H3: Quality assurance as a TQM element has a significant effect on customer satisfaction
of an organization
H4: Continuous process improvement as a TQM element has a significant effect on
financial performance of an organization
H5: Continuous process improvement as a TQM element has a significant effect on
operational performance of an organization
H6: Continuous process improvement as a TQM element has a significant effect on
customer satisfaction of an organization
H7: Environmental regulation and policy moderates the effect of quality assurance on the
organizational performance significantly
H8: Environmental regulation and policy moderates the effect of continuous process
improvement on the organizational performance significantly
79
2.12 Summary
This chapter presents the scholarly foundation for this study by providing a broad
literature review. From the literature review provided, the conceptualization of all the
constructs involved; TQM, organizational performance and environmental regulation and
policy are done. This chapter exclusively presents the interconnectivity and relationship
among the variables, and presented the theoretical, practical and methodological gaps that
are to be justified by this study. Some of the previous researches in the area of TQM
delved into issues that relate to organizational performance positively and from the
negative angle to be able to provide an opener to curtailing their intensity. Similarly,
those researches revealed that QA and CPI are important elements in promoting positive
changes and attaining effective organizational performance. This study argues that
organizations should be able to synthesize issues both from TQM angle and from the
point of view of Environment Regulation and Policy because focusing on one angle may
not provide a lasting solution to issues related to organizational performance. In reference
to that, the research framework to be validated by this study is presented. Lastly, the
dimensions and variables to be used in this study are educed and hypotheses to be tested
are outlined.
80
CHAPTER THREE
RESEARCH METHODOLOGY
3.1 Introduction
This chapter presents the research methodology employed in this study. This chapter is
divided into four main parts. The first part elucidates the research paradigm of the study.
The second part exclusively describes research design. The third part discusses the
research approach employed by the study. The final part focuses on the data collection,
instrumental design, sampling and, reliability and validity of measurement items.
3.2 Research Paradigm
This research is categorized under the correlational research as it is in accordance with
testing of the formulated research hypotheses (Creswell, 2009). The approach to the
research is post-positivism which is regarded as a pattern of research conducted with
research activities ranging from identification of problem, literature review, and
specification of research purpose, collection of data, analysis and interpretation and then
reporting (John, 2008). These steps are followed in their strict terms so as to achieve the
research objectives. Since the purpose of this study is to measure the impacts and effects
with a view of analyzing and predicting the nature using statistical computations and
hypotheses testing, a quantitative approach is appropriate for this study (Zikmund et al.,
2010). In achieving this, the study is also guided by underpinning theories as explained in
chapter two. This study represents a formal research to empirically investigate the
influence of continuous process improvement and quality assurance as TQM elements on
organizational performance (financial and operational performance and customer
satisfaction) of food and beverage companies, with the use of environmental regulation
81
and policy as a moderator. Due to the highlighted objectives of this study, it is
exclusively a quantitative research with methods for the realization of the objectives
(Sekeran, 2000).
3.3 Research Design
This study is of exploratory research design because it focuses on an aspect of study
where previous studies have been conducted, but still require further study to attend other
questions that are yet to be given answers. The choice of this research design is based on
the methods and techniques used for the conduct of the research because it elucidates
how data would have been gathered and analyzed towards the realization of the research
objectives.
Many previous studies have undoubtedly investigated the impacts of TQM on
organizational performance although mainly in corporate enterprises with sub-variables
that are peculiar to such domains. Apart from the fact that this research study
contextualizes the dimensions of TQM in view of meeting the specificity of food and
beverage companies, environmental regulation and policy is newly introduced as a
moderator to be tested in the research model. This is the importance of the quantitative
type exploratory study done by this study. The significance of a study being an
exploratory type is that it helps in understanding the situation being studied more
comprehensively and accurately (Sekeran, 2003).
In the course of employing the exploratory research design of this study, the following
are to be achieved accordingly:
82
i. Definition of the problem of the domain and consequent formulation of the
hypotheses to be investigated;
ii. Identification of the concepts and challenges in the research techniques;
iii. Presentation of belief concepts and approach that can implement effective data
interpretation, especially in multivariate data analysis;
iv. Exploring quantitative data to reveal unknown relationship between the variables
studied.
The issues educed in this study are addressed by the application of the exploratory
research study as listed above. Figure 3.1 presented the summary of the whole research
from research paradigm to analysis, interpretation and reporting.
3.4 Research Approach
Generally, there are two main approaches to research: qualitative and quantitative. The
third approach, commonly referred to as mixed approach is the combination of
quantitative and qualitative, and it is currently getting more attention (Creswell, 2009).
This study employs the quantitative method to identify the impact of all the elicited TQM
core elements on organizational performance, and the moderating role of environmental
regulation and policy.
Therefore, study is much of regression, studying the effect of one variable on the other
(Sekeran, 2003). Quantitative design gives the befitting opportunity to effectively test the
research hypotheses, and practically solve the pointed research problem. And also,
taking into consideration of the methodology employed by past studies, especially their
statistical analysis process, this study makes a methodological contribution.
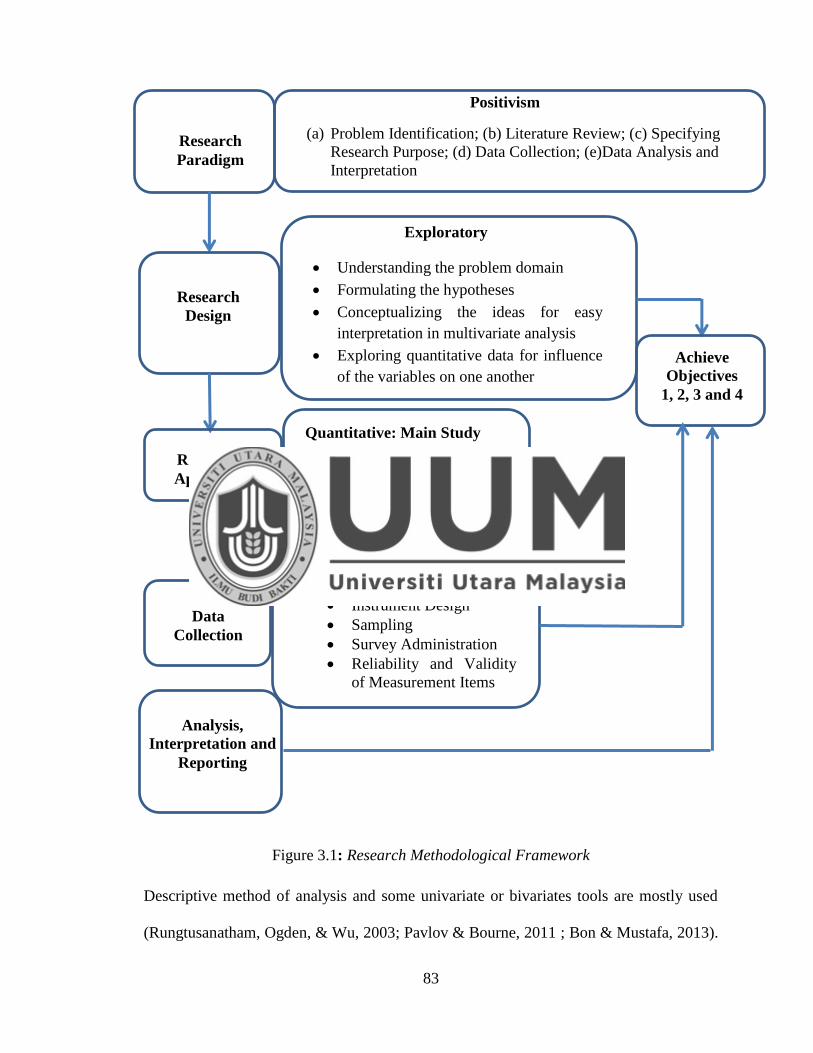
83
Figure 3.1: Research Methodological Framework
Descriptive method of analysis and some univariate or bivariates tools are mostly used
(Rungtusanatham, Ogden, & Wu, 2003; Pavlov & Bourne, 2011 ; Bon & Mustafa, 2013).
Positivism
(a) Problem Identification; (b) Literature Review; (c) Specifying
Research Purpose; (d) Data Collection; (e)Data Analysis and
Interpretation
Research
Paradigm
Exploratory
Understanding the problem domain
Formulating the hypotheses
Conceptualizing the ideas for easy
interpretation in multivariate analysis
Exploring quantitative data for influence
of the variables on one another
Research
Design
Quantitative: Main Study
Correlation
Regression
Factor Analysis
Goodness of Fit
Research
Approach
Data
Collection
Quantitative: Primary Data
Instrument Design
Sampling
Survey Administration
Reliability and Validity
of Measurement Items
Analysis,
Interpretation and
Reporting
Achieve
Objectives
1, 2, 3 and 4
84
To the best knowledge of the researcher, none of the studies ascribed to multivariate
statistical analysis using Structural Equation Modeling (SEM).
3.5 Data Collection Procedure
This study is using a survey research as its quantitative approach of study. Thus,
questionnaire is suitably appropriate as a gathering instrument. All the variables to be
investigated in this study are a continuous variable. They are: Quality assurance and
Continuous Process Improvement, with each of them different sub-variables. The other
variables are Organizational Performance as the dependent variable, and the
Environmental Regulation and Policy as the moderating variable (Zikmund, et al., 2010).
Also, due to the suitability of quantitative research data to be numeric, administering
questionnaires serves as the most reliable approach of data collection that will fit in with
these features. This is undoubtedly justified because this study is interested in capturing
the opinions of managers of the food and beverage companies in Malaysia. It means the
information expected to be deducted from the respondents can best be derived from the
individuals’ reflection of the work environment reality and its differences.
The data was collected from company employees who are managers of the food and
beverage producing companies, as covered by this study in view of attending to issues
raised in the background of this study – as shown in chapter one. This survey was also
done offline, individually administered to the companies’ respondents through Post Mail.
The items designed are as questions to be asked under each of the constructs studied by
this study. This was administered to the company employees that are of managerial
positions (Creswell, 2009; Neuman, 2007; Babbie, 2010).
85
3.5.1 Instrumentation
This study employs survey questionnaire as the instrument of data collection. Therefore,
it is important to carefully design the items of the questionnaire with due simplicity in
view of reflecting the dimensions used in measuring the constructs of the research model.
It should be noted that items of the questionnaire’s questions are designed based on
conceptual explanation from the literature, adapted or adopted. This is justifiable
according to Zikmund, et al. (2010). Items addressing questions to measure the
company’s Organizational Performance, Environmental regulation and policy, Quality
Assurance and Continuous Process Improvement are into parts of the questionnaire. The
development of the survey instruments is guided by relevant literatures. In cases where
the items are newly developed i.e. where primary data collection method has not been
previously used, the supporting literatures are adequately cited also.
3.5.1.1 The Questionnaire Structure
Using questionnaires in survey researches is as important as structuring the questionnaire
(Organ et al., 2006). Perhaps, this is true as there are a lot of challenges that may
adversely tamper the validity of the data and the rate of responses (Hair et al., 2007). In
order to get rid of those challenges, this study followed the suggestions by Organ et al.
(2006) and Gutpa (2006) and took different precautions such as abiding by the research
ethics of protecting the respondent’s identity, appropriate and unambiguous scaling of
items and separating items according to constructs. The following section discussed the
scales of the questionnaire.
86
3.5.1.2 Scale of the Questionnaire
There are series of patterns of designing a questionnaire but depends on what researcher
intends to measure and why. The scholars believe that patterns to be used should be
common and universally acceptable. For example, the statements used in the
questionnaire must be easily understood by the respondents (Oppenheim, 1992; Warwick
& Lininger, 1975); the statements in the questionnaire should not be leading the
respondents (Parten, 1950; Young, 1939). Also, researchers should try the most effective
way or manner to maximize the items validity, lessen the stress of answering the
questions from the respondents and be very economical in terms of cost of data
collection. On this basis, this study therefore uses Likert scale type of questionnaire.
Likert scale is a psychometric type of scale used in instruments to tap respondents’
extent of agreement or otherwise in a given statement. Likert scale was originally 5-point
scale that ranges from “strongly disagree” to “strongly agree” with “neither disagree” nor
agree in between. Many researchers will prefer to use longer scales by adding options
(i.e. a 7-point 9-point or 10-point scales). Other researchers rather use an even number
scale like 4-point and 6-point scales. According to Malhotra (2004) longer scales allows
the respondents to independently choose the options without been compelled. Also,
Martin and Polivka, (1995) mentioned that respondents prefer to be given a no opinion
option or neutral for them to feel free from been restricted to researcher’s choice. From
another perspective, Malhotra, and Peterson (2006) and Robert (2009) hold the opinion
that providing a no opinion or neutral option tampers with the value of the data which is
perhaps very obvious in various researches conducted across the globe. The participants
are quietly stimulated to think over a given item before they finally make decisions.
87
In this study, the selection of an odd scale particularly the 5-point scale is appropriate
because it will increase the reliability of the data as well as lessen social desirability bias
(Krosnick, 1999). Respondents shall be asked to respond to the items by indicating their
level of agreement using five-point Likert scale. In addition, five-point scale is used
because the scale can make compromise between the conflicting goals of offering enough
choice since only two or three options means measuring only direction rather than also
strength of opinion and making things manageable for respondents. And lastly, it is
mostly recommended from previous studies (i.e. Fink, 1995; Dawes, 2008; Dilman, et al.
2009)
a. Quality Assurance Dimension
The explanations of Abdous (2009) and Bayraktar et al., (2008) given on the concept of
quality assurance was adopted and modified into this 15-item construct description. This
study categorizes quality assurance to planning, process focus and production and
delivery, with 5-item each. The quality assurance items and their coding identities are
shown in Table 3.1 below.
Table 3.1
Quality Assurance Coding
Authors Item Code
Abdous(2009)
& Bayraktar
et al., (2008)
Planning
In our organization, the leadership provides sufficient internal
communication facilities for effective planning
QA01
88
In our organization, employees ensures using the best planning
and learning method for achieving quality
QA02
Our organization encourages innovative plan to achieve best
practice
QA03
Our organization has a collective way of planning QA04
Our organization considers quality planning a top priority in
their regular meeting
QA05
Process Focus
The production process is designed in such a way that it adds
value to our products
QA06
Newly introduced process is critically examined prior to its
actual implementation
QA07
The necessity of learning process are totally provided to
guarantee value creation for customers
QA08
Good relationship between employees and customers is
maintained
QA09
The organization is committed to the review of traditional
technique to meet the current standard
QA10
Production and Delivery
Our employees are frequently trained to ensure quality in jobs-
specific skills
QA11
Our employees are able to learn from each other on how to
improve production quality of its services
QA12
89
Our employees are able to learn from each other on how to
improve production quality of its goods
QA13
Emphasis is placed on effective service delivery with regards
to quality
QA14
Emphasis is placed on effective product delivery with regards
to quality
QA15
b. Continuous Process Improvement Dimension
The Continuous Process Improvement, as used in this study, is of three sub-variables;
namely, quality of process, continuous process and service development, and feedback.
This is in support of Siew (2013), and the items were designed using Adina-Petruţa and
Roxana (2014) on similar domain as a guide for adoption. These items are presented in
table 3.2.
Table 3.2
Continuous Process Improvement Coding
Authors Item Code
Siew (2013)
and Adina-
Petruţa &
Roxana (2014)
Quality of Process
Continuous improvement of the production process is based
on a systematic approach
CIP01
Our organization continually looks for ways to improve the
quality processes
CIP02
90
Quality assurance as a mechanism for continuous
improvement is integrated in all aspects of the organizational
process
CIP03
There is a continuous evaluation of the organizational quality
of process
CIP04
The necessities of process quality are totally provided to
guarantee valuable goods and services for the customers
CIP05
Continuous Product and Service Development
My organization develops new product for the customers CIP06
My organization develops new services for the customers CIP07
Our organization always provides new services for its
employees
CIP08
Compared to past years, our organization has developed new
products and services overall.
CIP09
There is significant increase in effectiveness of our research
products
CIP10
Feedback
There is an effective feedback system for organization
product quality improvement and assurance
CIP11
Quality assurance system of improvement is documented
properly
CIP12
There is a continuous review of the feedback from the
customers
CIP13
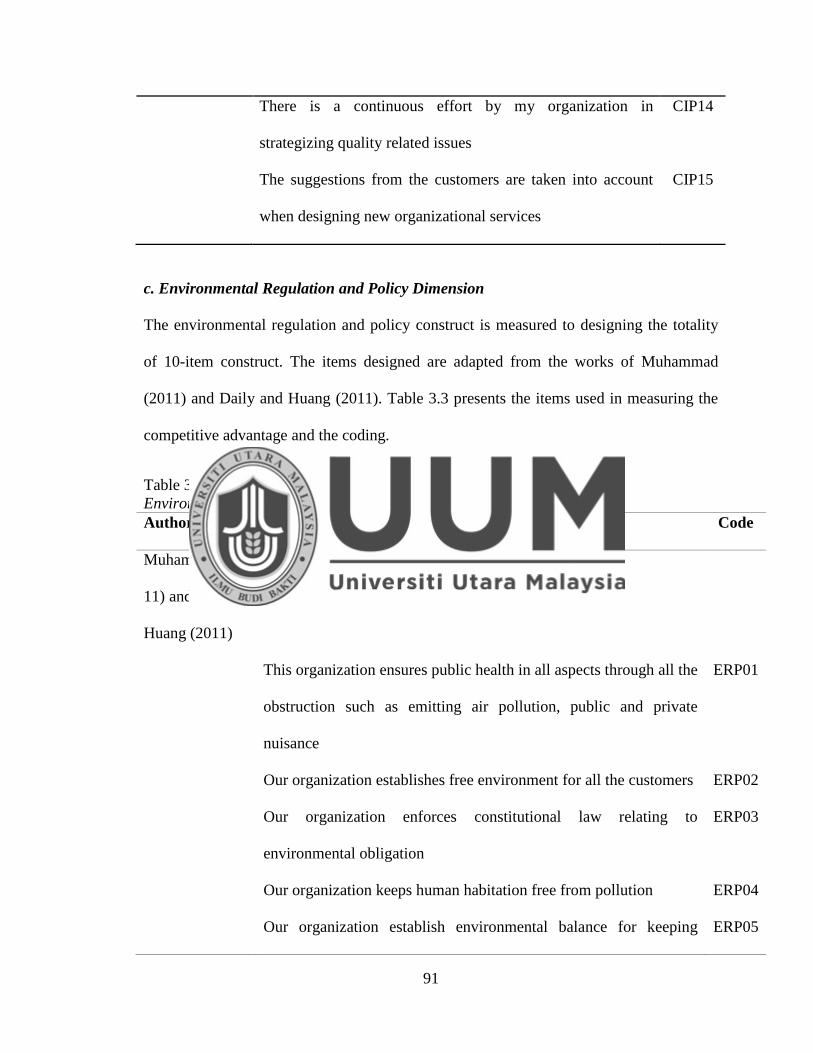
91
There is a continuous effort by my organization in
strategizing quality related issues
CIP14
The suggestions from the customers are taken into account
when designing new organizational services
CIP15
c. Environmental Regulation and Policy Dimension
The environmental regulation and policy construct is measured to designing the totality
of 10-item construct. The items designed are adapted from the works of Muhammad
(2011) and Daily and Huang (2011). Table 3.3 presents the items used in measuring the
competitive advantage and the coding.
Table 3.3
Environmental Regulation and Policy Coding
Authors Items Code
Muhammad(20
11) and Daily &
Huang (2011)
Environmental Regulations and Policy
This organization ensures public health in all aspects through all the
obstruction such as emitting air pollution, public and private
nuisance
ERP01
Our organization establishes free environment for all the customers ERP02
Our organization enforces constitutional law relating to
environmental obligation
ERP03
Our organization keeps human habitation free from pollution ERP04
Our organization establish environmental balance for keeping ERP05
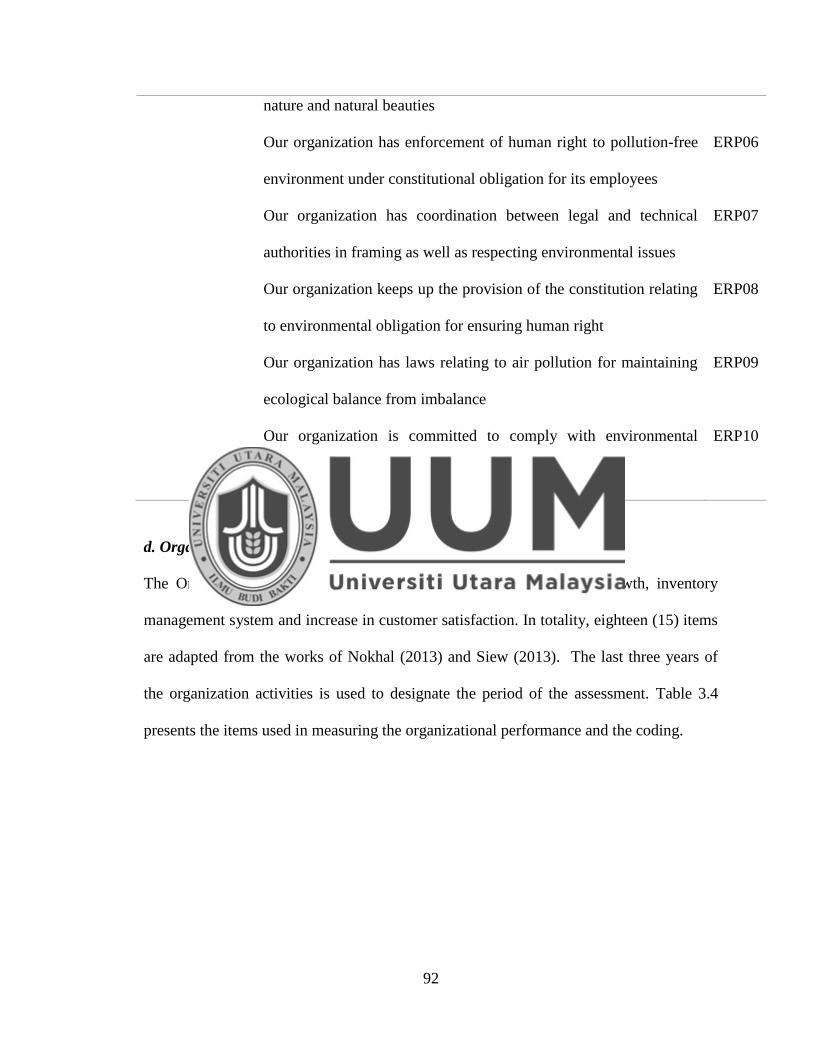
92
nature and natural beauties
Our organization has enforcement of human right to pollution-free
environment under constitutional obligation for its employees
ERP06
Our organization has coordination between legal and technical
authorities in framing as well as respecting environmental issues
ERP07
Our organization keeps up the provision of the constitution relating
to environmental obligation for ensuring human right
ERP08
Our organization has laws relating to air pollution for maintaining
ecological balance from imbalance
ERP09
Our organization is committed to comply with environmental
legislation and regulation
ERP10
d. Organizational Performance Dimension
The Organizational performance construct is measured using sales growth, inventory
management system and increase in customer satisfaction. In totality, eighteen (15) items
are adapted from the works of Nokhal (2013) and Siew (2013). The last three years of
the organization activities is used to designate the period of the assessment. Table 3.4
presents the items used in measuring the organizational performance and the coding.
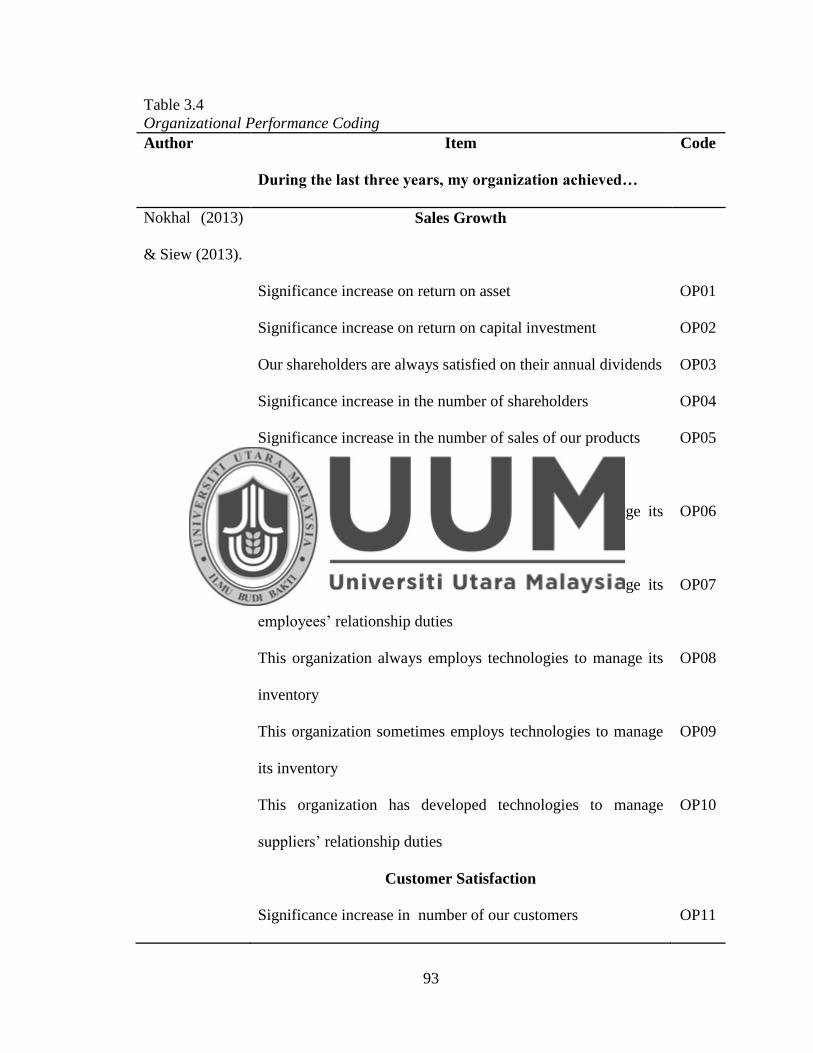
93
Table 3.4
Organizational Performance Coding
Author Item
During the last three years, my organization achieved…
Code
Nokhal (2013)
& Siew (2013).
Sales Growth
Significance increase on return on asset OP01
Significance increase on return on capital investment OP02
Our shareholders are always satisfied on their annual dividends OP03
Significance increase in the number of shareholders OP04
Significance increase in the number of sales of our products OP05
Inventory Management System
This organization has developed technologies to manage its
customers’ relationship duties
OP06
This organization has developed technologies to manage its
employees’ relationship duties
OP07
This organization always employs technologies to manage its
inventory
OP08
This organization sometimes employs technologies to manage
its inventory
OP09
This organization has developed technologies to manage
suppliers’ relationship duties
OP10
Customer Satisfaction
Significance increase in number of our customers OP11
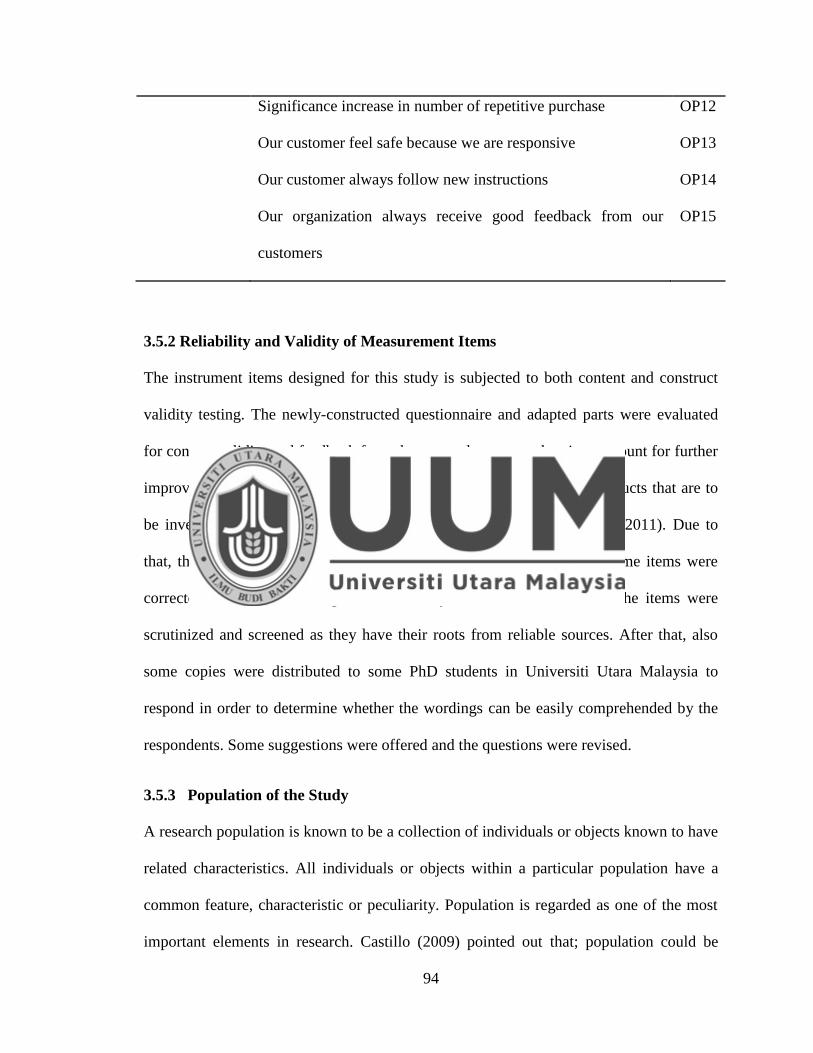
94
Significance increase in number of repetitive purchase OP12
Our customer feel safe because we are responsive OP13
Our customer always follow new instructions OP14
Our organization always receive good feedback from our
customers
OP15
3.5.2 Reliability and Validity of Measurement Items
The instrument items designed for this study is subjected to both content and construct
validity testing. The newly-constructed questionnaire and adapted parts were evaluated
for content validity and feedback from the respondents was taken into account for further
improvement. Also, a pilot study to test the internal validity of the constructs that are to
be investigated by this study is recommended (Creswell, 2009; Kumar, 2011). Due to
that, the questionnaire passed through phases of transition processes. Some items were
corrected to increase the degree of reliability of their sources and all the items were
scrutinized and screened as they have their roots from reliable sources. After that, also
some copies were distributed to some PhD students in Universiti Utara Malaysia to
respond in order to determine whether the wordings can be easily comprehended by the
respondents. Some suggestions were offered and the questions were revised.
3.5.3 Population of the Study
A research population is known to be a collection of individuals or objects known to have
related characteristics. All individuals or objects within a particular population have a
common feature, characteristic or peculiarity. Population is regarded as one of the most
important elements in research. Castillo (2009) pointed out that; population could be
95
classified into two: target population and accessible population. Target population is the
whole group of individuals or objects in which researchers are interested in drawing the
conclusions – it is referred to as theoretical population. The accessible population on the
other hand is the population in which the researchers can apply their conclusions. In the
same vein, it is called the subset of the target population and it is also known as the study
population. It is from the accessible population that researchers draw their samples to be
used. Based on this foundation, the target population for this study is all food and
beverage companies in Malaysia which is a subset of agro-based industry. A total number
of 250 companies are gotten from food and beverage Federation of Malaysian
Manufacturers in joint collaboration with Malaysia External Trade Development
Corporation directory (FMM-MATRADE Industry Directory, Food & Beverage,
2005/06, p. A34-37). The information like postal, e-mail addresses and telephone
numbers of the targeted population will be derived from the directory of the Federation of
Malaysian Agro-based Manufacturers (Ahmad, 2012). The following segment discussed
the sample of the study.
3.5.3.1 Sample of the Study
According to Sridhar (2009), sample depicts a selection of some part of an aggregate on
the basis of which a statistical inference is made about the aggregate. The fact is that
researchers usually cannot make the option of a sample inevitable (Herek et al., 2010).
Undoubtedly, the sample corresponds to the larger population on the characteristics of
interest. In those circumstances, the researcher’s assumptions from the sample are
perhaps applicable to the entire population.
96
3.5.3.2 Sample Size
Since this study is employing SEM-PLS as the analysis technique, the sample size is
gotten through the Rule of 10. With respect to PLS, the literature frequently uses the “10
times” rule of thumb as the guide for estimating the minimum sample size requirement.
This rule of thumb suggests that PLS only requires a sample size of 10 times the most
complex relationship within the research model. The most complex relationship is the
larger value between:
1. The construct with the largest number of formative indicators if there are
formative constructs in the research model (i.e., largest measurement
equation(LME) ; and
2. The dependent latent variable (LV) with the largest number of independent LVs
influencing it (i.e., the largest structural equation (LSE).
In summary, the Rule of 10 states that the minimum sample size for a model is based on
the maximum number of arrows pointed at any latent variable in the model. From Figure
2.1 at page 68, the research model shows the conceptual model of this research where
Quality Assurance (QA) dimensions: strategic planning, process focus, and production
and delivery making three arrows to be pointed towards organizational performance
being the latent variable. And also continuous process improvement (CPI) with three
dimensions: quality of focus, continuous process and service development and feedback
has three arrows in general pointing to organizational performance. And lastly, ERP
being the moderating variable is pointing towards organizational performance, making all
the arrows to be 7. Using the Rule of Thumb, a minimum number of 70 is required for the
sample size of the study.
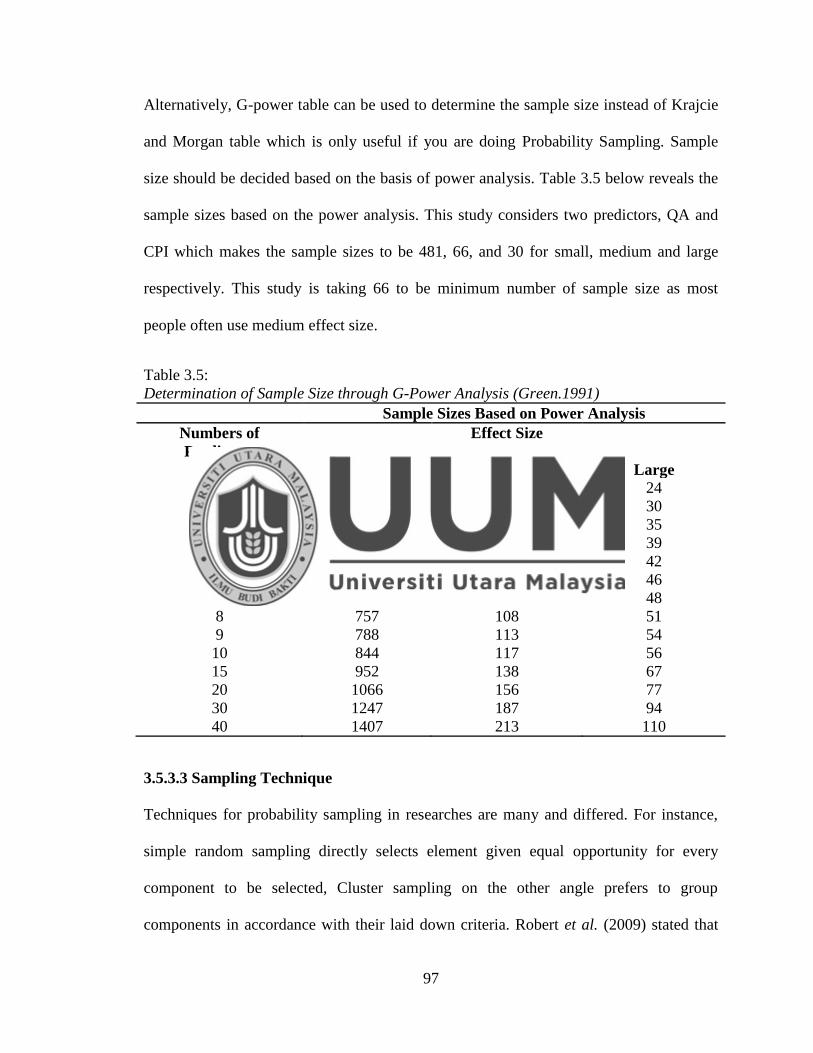
97
Alternatively, G-power table can be used to determine the sample size instead of Krajcie
and Morgan table which is only useful if you are doing Probability Sampling. Sample
size should be decided based on the basis of power analysis. Table 3.5 below reveals the
sample sizes based on the power analysis. This study considers two predictors, QA and
CPI which makes the sample sizes to be 481, 66, and 30 for small, medium and large
respectively. This study is taking 66 to be minimum number of sample size as most
people often use medium effect size.
Table 3.5:
Determination of Sample Size through G-Power Analysis (Green.1991)
Sample Sizes Based on Power Analysis
Numbers of
Predictors
Effect Size
Small Medium Large
1 390 53 24
2 481 66 30
3 547 76 35
4 599 84 39
5 645 91 42
6 686 97 46
7 726 102 48
8 757 108 51
9 788 113 54
10 844 117 56
15 952 138 67
20 1066 156 77
30 1247 187 94
40 1407 213 110
3.5.3.3 Sampling Technique
Techniques for probability sampling in researches are many and differed. For instance,
simple random sampling directly selects element given equal opportunity for every
component to be selected, Cluster sampling on the other angle prefers to group
components in accordance with their laid down criteria. Robert et al. (2009) stated that
98
some researches combine more than one sampling technique at a time. Multistage
sampling occurs when sampling procedures were carried out in different stages where
researcher breaks down the sample into smaller sampling component at each stage.
This study employed simple random under non-probability sampling technique because
every individual in the population is known and each has a certain probability of being
selected. A random process decides the sample based on each individual’s probability. A
list of all the companies of the population is created and used to obtain participants by
random selection. This random selection guarantees that each individual has an
independent and equal chance of being selected.
3.5.4 Unit of Analysis
Sample is a representative of a particular population for a purpose of a study (Creswell,
2009). The companies’ personnel are the unit of analysis, implying that they will
administer the questionnaires, and their responses are computed using the normal 5-point
Likert scale. This study focuses on Food and Beverage companies in Malaysia as shown
in chapter one of this study. The study shall be conducted in 250 food and beverage
companies of Malaysia. The respondents are drawn from the organization’s managerial
and operational personnel. The following discussion is on the technique of data analysis
to be employed.
3.5.5 Technique of Data Analyses
This research shall use SmartPLS 2.0 M3 (Ringle et al., 2005) as tools of analysis.
SmartPLS 2.0 M3 (Ringle et al., 2005) is a powerful multivariate analysis technique that
comprises specific versions of a number of other analysis methods as special cases. Fox
99
(2006), SmartPLS 2.0 M3 (Ringle et al., 2005) reflects an informal thinking about causal
relationship that is common in social science theorizing, and facilitates translating such
theories into data analysis though in courses such as economics, structural-equation
models may stem from formal theory. SmartPLS 2.0 M3 (Ringle et al., 2005) is a
promising method that avails researchers with vast opportunities. It is a regression like
approach that is capable of reducing the residual variances and has the unique ability to
work efficiently with both larger and fewer samples unlike AMOS SEM that does not
work well with some samples (Hair et al., 2011).
In terms of reliability, SmartPLS 2.0 M3 (Ringle et al., 2005) takes measurement errors
into account by clearly including measurement error variables that correspond to the
measurement error portions of observed variables. Hence, conclusions about relationship
between constructs are not biased by measurement error, and are similar to connections
between variables of perfect reliability. This is actually very important as data in the
social sciences frequently contain a lot of measurement errors. SmartPLS 2.0 M3 (Ringle
et al., 2005) is widely known for its ability to test the hypotheses and their compatibility;
their assumptions about parameters, the variances and co-variances of all the observed
variables. Few studies on TQM and organizational performance with the moderating
effect of environmental policy and regulation used structural equation modeling (SEM).
SEM approaches are superior to bivariate correlations or regression analyses, because
SEM allows simultaneous estimation of causal relationships between variables (Hair, et
al. 2010).
100
3.6 Summary
This chapter discussed the methods to be employed in achieving the objectives set for this
study and their supporting justifications. As highlighted, the research will be a type of
quantitative research using survey questionnaire administration with SmartPLS 2.0 M3 as
the statistical techniques for the data analysis. The design of the items involved in the
questionnaire design is discussed extensively with discussion on the measurement of the
variables to be studied. The chapter also discussed detailed procedure for data
collection, population sample, sampling techniques and unit of analysis.
101
CHAPTER FOUR
DATA ANALYSIS AND FINDINGS
4.1 Introduction
This chapter reports the results from the data analyzed. Firstly, this study examined the
distribution of the demographic variables (Gender, Age, Years of Experience and
Qualifications) for all respondents. The demographic variables are considered because
the data are collected from company employees who are employees of the food and
beverage producing companies or those who are in the best positions to answer the
questionnaire like the top managers. This is undoubtedly justified because this study is
interested in capturing the opinions of managers of the food and beverage companies in
Malaysia. It means the information expected to be deducted from the respondents can
best be derived from the individuals’ reflection of the work environment reality and its
differences. Also, this study discusses the descriptive analysis of the variables and the
normality testing. The study employed the Partial Least Squares Structural Equation
Modeling (PLS-SEM) to examine the outer measurement model before the inner
structural model assessment and hypotheses testing.
The goodness of the outer model connected to the constructs of this study namely total
quality management (with Quality assurance and continuous process improvement as
dimensions), environmental regulation and policy and organizational performance (with
financial performance, operational performance and customer satisfaction as dimensions.
Next is the examination of the quality of the structural model through construct validity.
Finally, the results of the hypotheses testing procedures were reported and the moderating
effect of environmental regulation and policy were equally reported.
102
4.2 Demographic Distribution of the Respondents
The data was collected using the survey questionnaire over the period of five months
from May 2015 to September 2015 from 71 food and beverage companies after 250
questionnaires were sent out. The demographic variables have been categorized into four,
which are gender, age, years of experience and qualifications. In table 4.1, the
respondents who responded to this study from male gender are 52 which represent 73.2%
and female are 19 with 26.8%. The majority of the respondents are holding degree
qualification (47) which represents 66.2% , Secondary (9.9%), Primary (1.4%) , no
certification held (2) which represent 2.8% and the rest of 14 respondents (19.7%)
possess graduate degree (Master or Doctorate). In terms of years of experience of the
respondents, majority of them are having 4-6 years of experience (42.3%), 7 for
respondents having Below 3 years of experiences (9.9%), 9 for respondents having 7-9
years of experience (12.7%) and the rest (25) were having experiences above 10 years
(35.2%).
Table 4.1
Participants’ Demographic Information
Demographic
Variable
Category Frequency
(N=71)
Percent
(%)
Gender
Male
Female
52
19
73.2
26.8
Age
18-34
35-44
45-60
13
38
20
18.3
53.5
28.2
Quality of
Education
Postgraduate 14
47
19.7
66.2
103
First degree
Secondary
Primary
No certification held
7
1
2
9.9
1.4
2.8
Years of
Experiences
Below 3 years
4-6 years
7-9 years
Above 10 years
7
30
9
25
9.9
42.3
12.7
35.2
4.3 The Rationale behind Choosing PLS SEM for this Study
The purpose of this study is to investigate the relationships among the latent variables;
therefore, the latent analysis technique is considered to be the most suitable option. There
was an option to use covariance-based SEM technique such as AMOS but the data must
be normally distributed (Byrne, 2010; Hair et al., 2010). The assumptions have been
previously tested in SPSS before choosing the technique of the analysis. Researchers’
arguments for choosing PLS as the statistical means for testing structural equations
models (Urbach & Ahleman, 2010) are as follows:
1. PLS makes fewer demands regarding sample size than other methods;
2. PLS does not require normal-distributed input data;
3. PLS can be applied to complex structural equation models with a large number of
constructs;
4. PLS is able to handle both reflective and formative constructs; and
5. PLS is especially useful for prediction.
104
4.3.1 Test of Linearity
Linearity testing locates the relationship of independent variables with dependent
variables which predicts the hypotheses’ right way; therefore, the positive values show
the relationship is considered to be positive. According to suggestion of Hair et al.
(2006), the partial regression plot was employed for each variable when there is more
than one independent variable to guarantee the accurate representation in the equation. To
achieve this aim, the normal P-P plot of regression standardized residual plot was
imposed for independent variables on dependent variables. The outcome results revealed
that the normal distribution was readily achieved.
4.3.2 Multicollinearity Test
It is highly recommended, the test of Multicollinearity among variables before the
beginning of testing the proposed model (Hair et al., 2010). It indicates the existence of
relapse in the correlation matrix where the independent variable is high and significantly
correlated with another independent variable. Also, the revelation of Multicollinearity can
be revealed when the correlation value is more than 0.90 (Hair et al., 2010). The test of
Multicollinearity is examined by assessing the variance influence factor (VIF) and the
tolerance value also.
Furthermore, the value of VIF is the amount of variability of the chosen independent
variable which is explained by other independent variables whereas the tolerance is
simply the inverse of VIF (Hair et al., 2010). The VIF and tolerance values cut-off points
are 10 and 0.10 respectively which shows that VIF closer to 1.00 represents little or no
Multicollinearity.
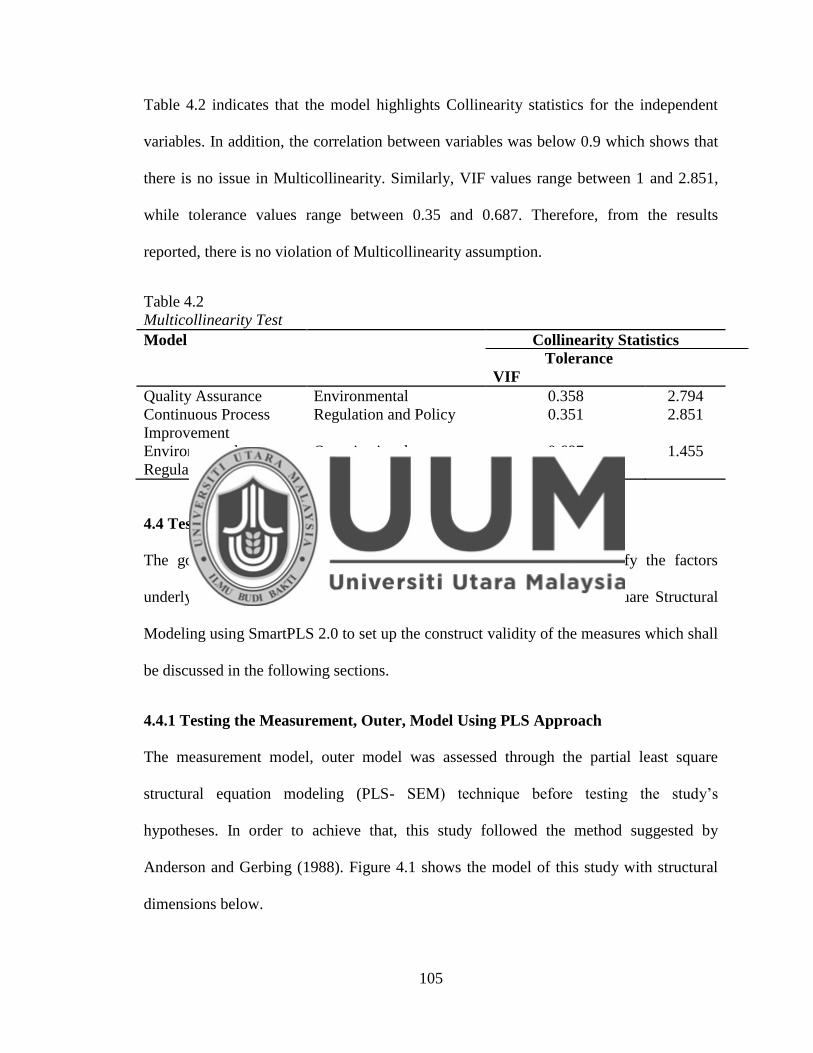
105
Table 4.2 indicates that the model highlights Collinearity statistics for the independent
variables. In addition, the correlation between variables was below 0.9 which shows that
there is no issue in Multicollinearity. Similarly, VIF values range between 1 and 2.851,
while tolerance values range between 0.35 and 0.687. Therefore, from the results
reported, there is no violation of Multicollinearity assumption.
Table 4.2
Multicollinearity Test
Model Collinearity Statistics
Tolerance
VIF
Quality Assurance
Continuous Process
Improvement
Environmental
Regulation and Policy
0.358
0.351
2.794
2.851
Environmental
Regulation and Policy
Organizational
Performance
0.687 1.455
4.4 Testing the Goodness of the Measurements
The goodness of the measures of this study was examined to identify the factors
underlying the variables (in chapter 5) and utilized the Partial Least Square Structural
Modeling using SmartPLS 2.0 to set up the construct validity of the measures which shall
be discussed in the following sections.
4.4.1 Testing the Measurement, Outer, Model Using PLS Approach
The measurement model, outer model was assessed through the partial least square
structural equation modeling (PLS- SEM) technique before testing the study’s
hypotheses. In order to achieve that, this study followed the method suggested by
Anderson and Gerbing (1988). Figure 4.1 shows the model of this study with structural
dimensions below.
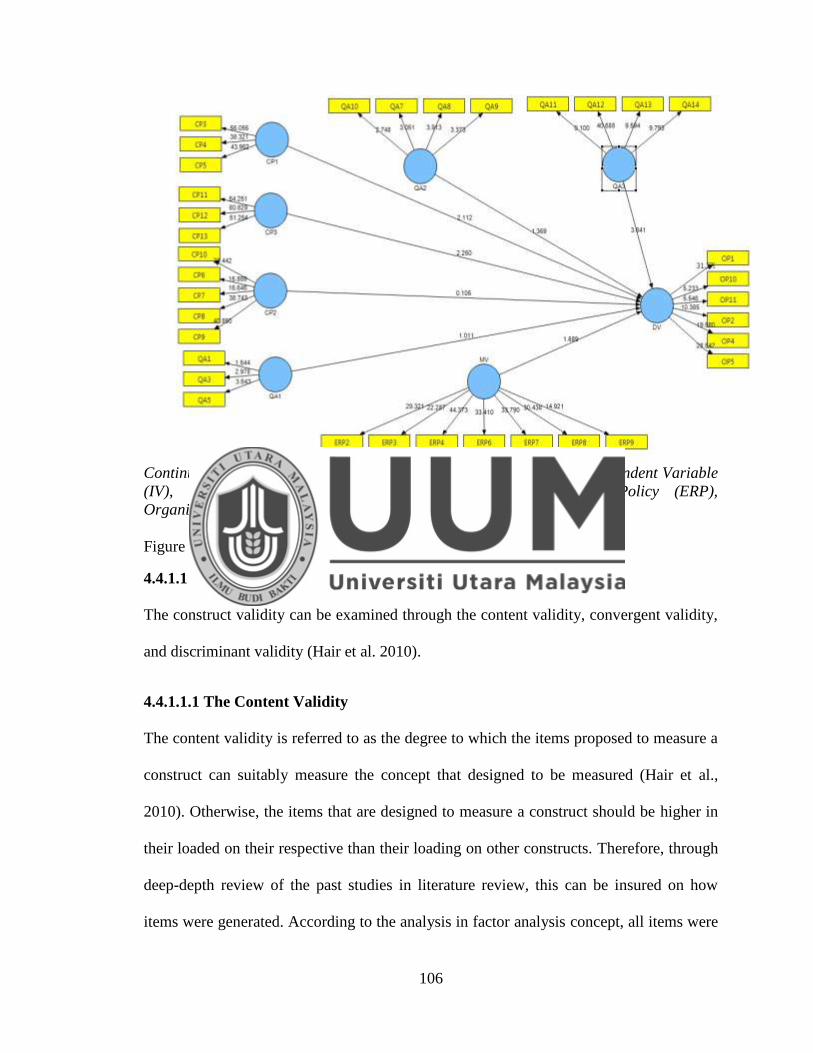
106
Continuous Process Improvement (CP), Dependent Variable (DV), Independent Variable
(IV), Quality Assurance (QA), Environmental Regulation and Policy (ERP),
Organizational Performance (OP), Moderating Variable (MV).
Figure 4.1: The Research Model
4.4.1.1 The Construct Validity
The construct validity can be examined through the content validity, convergent validity,
and discriminant validity (Hair et al. 2010).
4.4.1.1.1 The Content Validity
The content validity is referred to as the degree to which the items proposed to measure a
construct can suitably measure the concept that designed to be measured (Hair et al.,
2010). Otherwise, the items that are designed to measure a construct should be higher in
their loaded on their respective than their loading on other constructs. Therefore, through
deep-depth review of the past studies in literature review, this can be insured on how
items were generated. According to the analysis in factor analysis concept, all items were
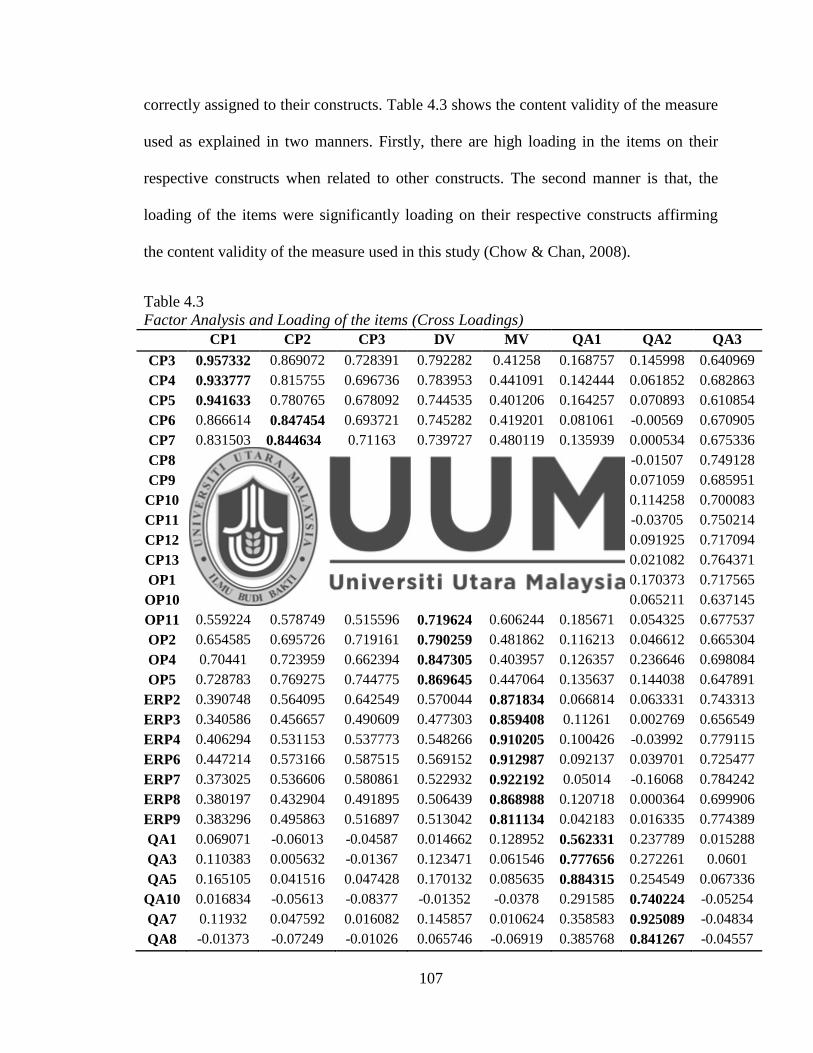
107
correctly assigned to their constructs. Table 4.3 shows the content validity of the measure
used as explained in two manners. Firstly, there are high loading in the items on their
respective constructs when related to other constructs. The second manner is that, the
loading of the items were significantly loading on their respective constructs affirming
the content validity of the measure used in this study (Chow & Chan, 2008).
Table 4.3
Factor Analysis and Loading of the items (Cross Loadings)
CP1 CP2 CP3 DV MV QA1 QA2 QA3
CP3 0.957332 0.869072 0.728391 0.792282 0.41258 0.168757 0.145998 0.640969
CP4 0.933777 0.815755 0.696736 0.783953 0.441091 0.142444 0.061852 0.682863
CP5 0.941633 0.780765 0.678092 0.744535 0.401206 0.164257 0.070893 0.610854
CP6 0.866614 0.847454 0.693721 0.745282 0.419201 0.081061 -0.00569 0.670905
CP7 0.831503 0.844634 0.71163 0.739727 0.480119 0.135939 0.000534 0.675336
CP8 0.742009 0.923804 0.867928 0.765379 0.621193 -0.07199 -0.01507 0.749128
CP9 0.709439 0.916451 0.855384 0.75794 0.542413 -0.05969 0.071059 0.685951
CP10 0.716971 0.899171 0.935465 0.765208 0.529195 0.038831 0.114258 0.700083
CP11 0.720308 0.898874 0.963009 0.783333 0.575022 -0.07779 -0.03705 0.750214
CP12 0.709199 0.859821 0.963752 0.793612 0.582693 0.026247 0.091925 0.717094
CP13 0.707166 0.881715 0.94925 0.799993 0.645647 0.113972 0.021082 0.764371
OP1 0.792183 0.813416 0.836644 0.882627 0.493803 0.12179 0.170373 0.717565
OP10 0.455912 0.462312 0.433159 0.693796 0.535631 0.181491 0.065211 0.637145
OP11 0.559224 0.578749 0.515596 0.719624 0.606244 0.185671 0.054325 0.677537
OP2 0.654585 0.695726 0.719161 0.790259 0.481862 0.116213 0.046612 0.665304
OP4 0.70441 0.723959 0.662394 0.847305 0.403957 0.126357 0.236646 0.698084
OP5 0.728783 0.769275 0.744775 0.869645 0.447064 0.135637 0.144038 0.647891
ERP2 0.390748 0.564095 0.642549 0.570044 0.871834 0.066814 0.063331 0.743313
ERP3 0.340586 0.456657 0.490609 0.477303 0.859408 0.11261 0.002769 0.656549
ERP4 0.406294 0.531153 0.537773 0.548266 0.910205 0.100426 -0.03992 0.779115
ERP6 0.447214 0.573166 0.587515 0.569152 0.912987 0.092137 0.039701 0.725477
ERP7 0.373025 0.536606 0.580861 0.522932 0.922192 0.05014 -0.16068 0.784242
ERP8 0.380197 0.432904 0.491895 0.506439 0.868988 0.120718 0.000364 0.699906
ERP9 0.383296 0.495863 0.516897 0.513042 0.811134 0.042183 0.016335 0.774389
QA1 0.069071 -0.06013 -0.04587 0.014662 0.128952 0.562331 0.237789 0.015288
QA3 0.110383 0.005632 -0.01367 0.123471 0.061546 0.777656 0.272261 0.0601
QA5 0.165105 0.041516 0.047428 0.170132 0.085635 0.884315 0.254549 0.067336
QA10 0.016834 -0.05613 -0.08377 -0.01352 -0.0378 0.291585 0.740224 -0.05254
QA7 0.11932 0.047592 0.016082 0.145857 0.010624 0.358583 0.925089 -0.04834
QA8 -0.01373 -0.07249 -0.01026 0.065746 -0.06919 0.385768 0.841267 -0.04557
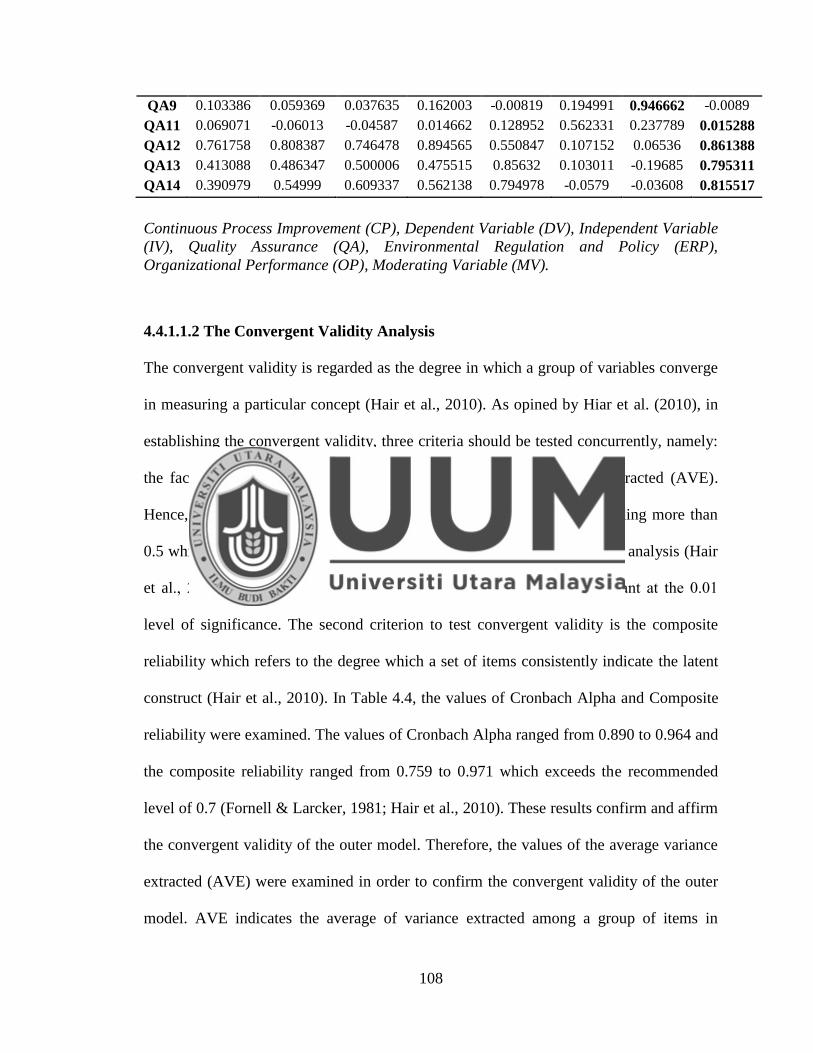
108
QA9 0.103386 0.059369 0.037635 0.162003 -0.00819 0.194991 0.946662 -0.0089
QA11 0.069071 -0.06013 -0.04587 0.014662 0.128952 0.562331 0.237789 0.015288
QA12 0.761758 0.808387 0.746478 0.894565 0.550847 0.107152 0.06536 0.861388
QA13 0.413088 0.486347 0.500006 0.475515 0.85632 0.103011 -0.19685 0.795311
QA14 0.390979 0.54999 0.609337 0.562138 0.794978 -0.0579 -0.03608 0.815517
Continuous Process Improvement (CP), Dependent Variable (DV), Independent Variable
(IV), Quality Assurance (QA), Environmental Regulation and Policy (ERP),
Organizational Performance (OP), Moderating Variable (MV).
4.4.1.1.2 The Convergent Validity Analysis
The convergent validity is regarded as the degree in which a group of variables converge
in measuring a particular concept (Hair et al., 2010). As opined by Hiar et al. (2010), in
establishing the convergent validity, three criteria should be tested concurrently, namely:
the factor loadings, composite reliability (CR) and average variance extracted (AVE).
Hence, the loading of all items were examined where all items have loading more than
0.5 which is an acceptable level by following the literature of multivariate analysis (Hair
et al., 2010). Table 4.4 shows that all the factors’ loading were significant at the 0.01
level of significance. The second criterion to test convergent validity is the composite
reliability which refers to the degree which a set of items consistently indicate the latent
construct (Hair et al., 2010). In Table 4.4, the values of Cronbach Alpha and Composite
reliability were examined. The values of Cronbach Alpha ranged from 0.890 to 0.964 and
the composite reliability ranged from 0.759 to 0.971 which exceeds the recommended
level of 0.7 (Fornell & Larcker, 1981; Hair et al., 2010). These results confirm and affirm
the convergent validity of the outer model. Therefore, the values of the average variance
extracted (AVE) were examined in order to confirm the convergent validity of the outer
model. AVE indicates the average of variance extracted among a group of items in
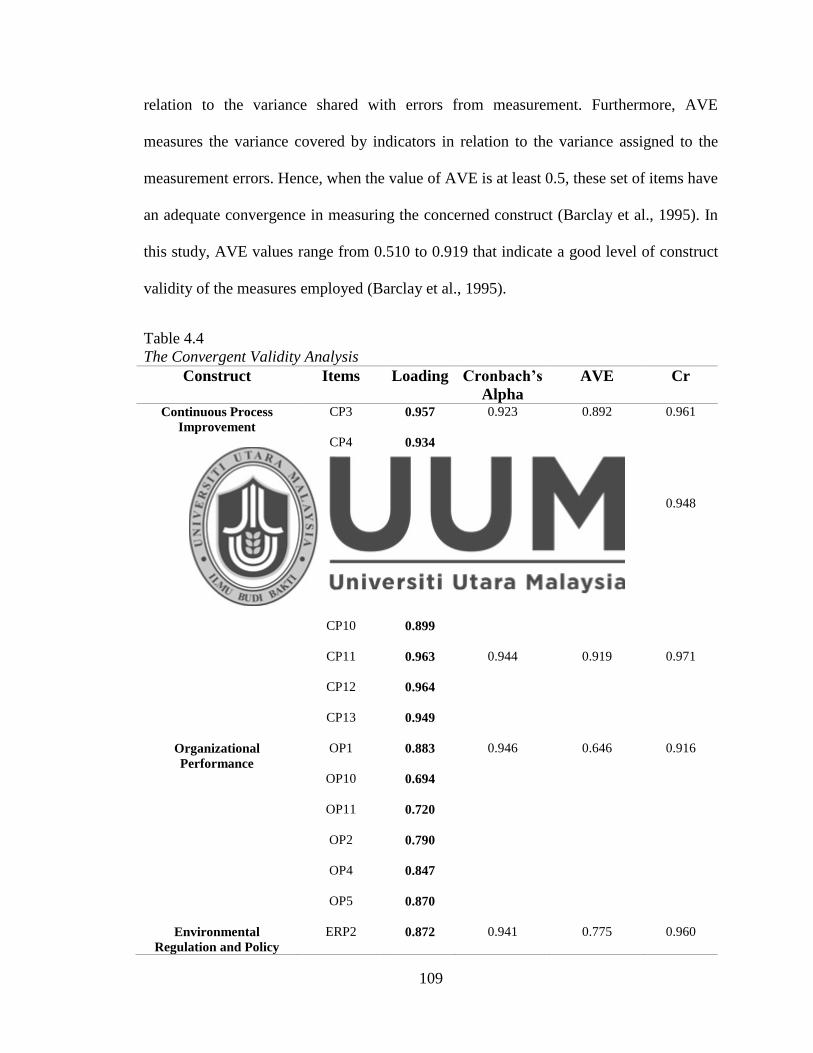
109
relation to the variance shared with errors from measurement. Furthermore, AVE
measures the variance covered by indicators in relation to the variance assigned to the
measurement errors. Hence, when the value of AVE is at least 0.5, these set of items have
an adequate convergence in measuring the concerned construct (Barclay et al., 1995). In
this study, AVE values range from 0.510 to 0.919 that indicate a good level of construct
validity of the measures employed (Barclay et al., 1995).
Table 4.4
The Convergent Validity Analysis
Construct Items Loading Cronbach’s
Alpha
AVE Cr
Continuous Process
Improvement
CP3 0.957 0.923 0.892 0.961
CP4 0.934
CP5 0.942
CP6 0.847 0.928 0.787 0.948
CP7 0.845
CP8 0.924
CP9 0.916
CP10 0.899
CP11 0.963 0.944 0.919 0.971
CP12 0.964
CP13 0.949
Organizational
Performance
OP1 0.883 0.946 0.646 0.916
OP10 0.694
OP11 0.720
OP2 0.790
OP4 0.847
OP5 0.870
Environmental
Regulation and Policy
ERP2 0.872 0.941 0.775 0.960
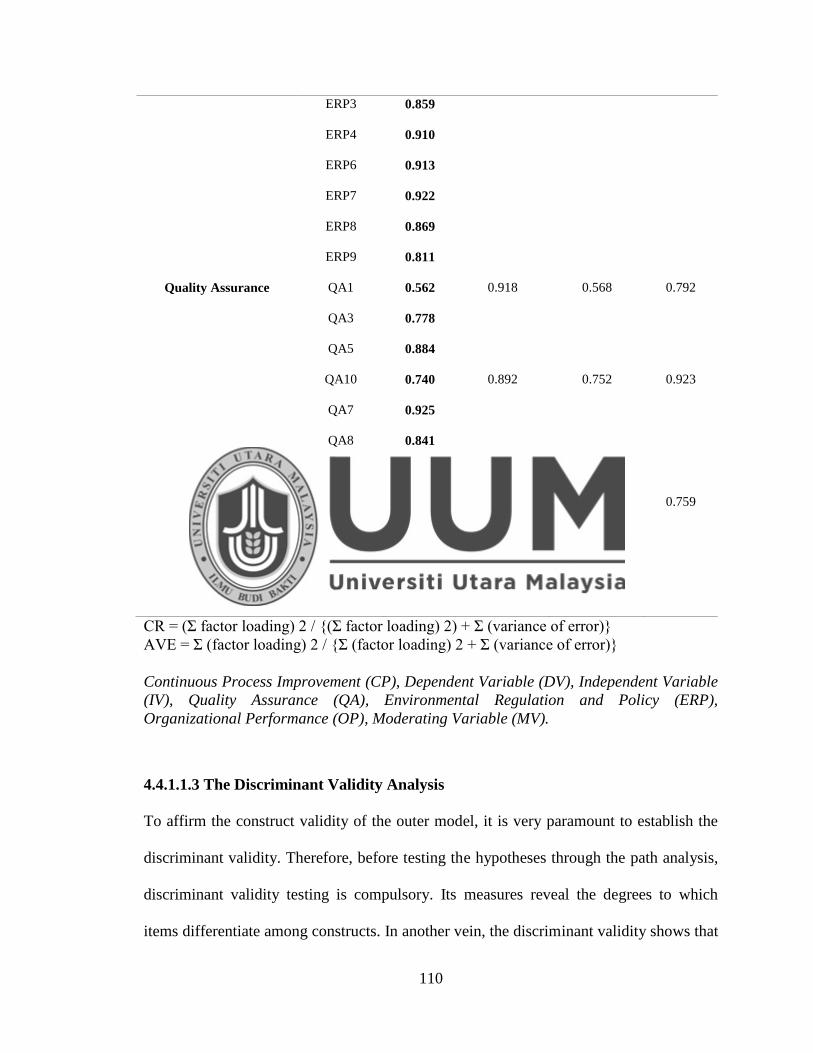
110
ERP3 0.859
ERP4 0.910
ERP6 0.913
ERP7 0.922
ERP8 0.869
ERP9 0.811
Quality Assurance QA1 0.562 0.918 0.568 0.792
QA3 0.778
QA5 0.884
QA10 0.740 0.892 0.752 0.923
QA7 0.925
QA8 0.841
QA9 0.947
QA11 0.015 0.891 0.510 0.759
QA12 0.861
QA13 0.795
QA14 0.816
CR = (Σ factor loading) 2 / {(Σ factor loading) 2) + Σ (variance of error)}
AVE = Σ (factor loading) 2 / {Σ (factor loading) 2 + Σ (variance of error)}
Continuous Process Improvement (CP), Dependent Variable (DV), Independent Variable
(IV), Quality Assurance (QA), Environmental Regulation and Policy (ERP),
Organizational Performance (OP), Moderating Variable (MV).
4.4.1.1.3 The Discriminant Validity Analysis
To affirm the construct validity of the outer model, it is very paramount to establish the
discriminant validity. Therefore, before testing the hypotheses through the path analysis,
discriminant validity testing is compulsory. Its measures reveal the degrees to which
items differentiate among constructs. In another vein, the discriminant validity shows that
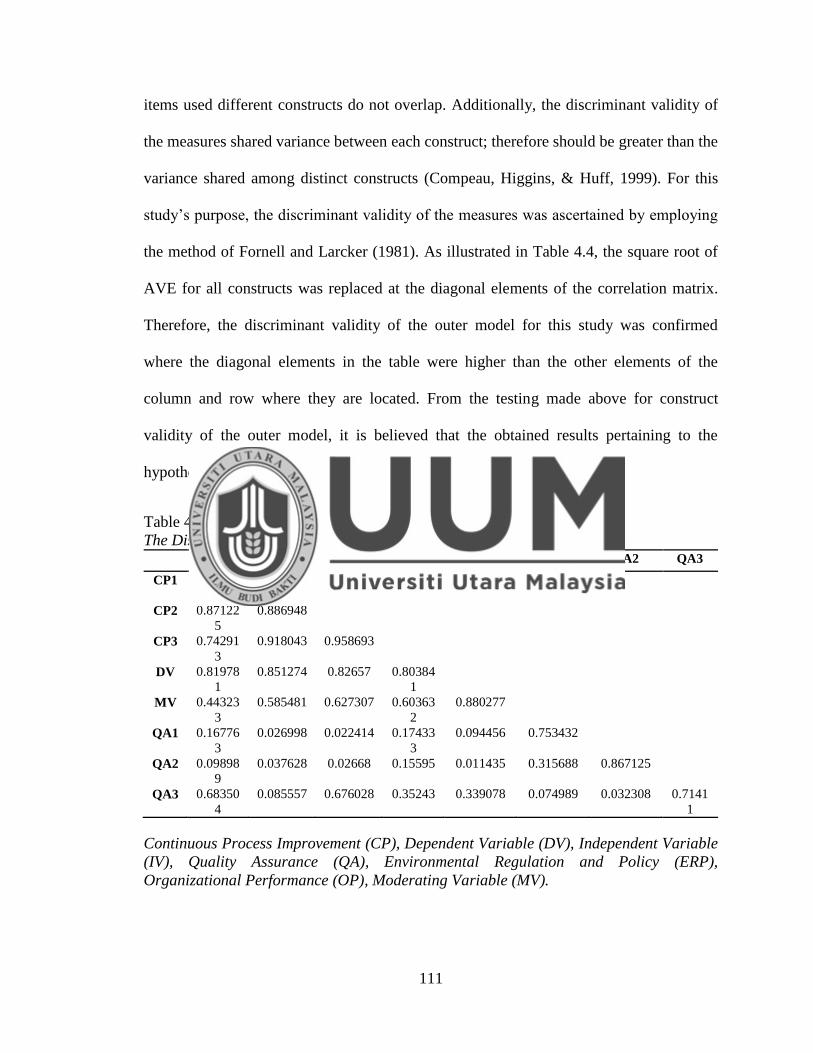
111
items used different constructs do not overlap. Additionally, the discriminant validity of
the measures shared variance between each construct; therefore should be greater than the
variance shared among distinct constructs (Compeau, Higgins, & Huff, 1999). For this
study’s purpose, the discriminant validity of the measures was ascertained by employing
the method of Fornell and Larcker (1981). As illustrated in Table 4.4, the square root of
AVE for all constructs was replaced at the diagonal elements of the correlation matrix.
Therefore, the discriminant validity of the outer model for this study was confirmed
where the diagonal elements in the table were higher than the other elements of the
column and row where they are located. From the testing made above for construct
validity of the outer model, it is believed that the obtained results pertaining to the
hypotheses testing should be highly reliable and valid.
Table 4.5
The Discriminant Validity Matrix (Latent Variable Correlation) CP1 CP2 CP3 DV MV QA1 QA2 QA3
CP1 0.94429
8
CP2 0.87122
5
0.886948
CP3 0.74291
3
0.918043 0.958693
DV 0.81978
1
0.851274 0.82657 0.80384
1
MV 0.44323
3
0.585481 0.627307 0.60363
2
0.880277
QA1 0.16776
3
0.026998 0.022414 0.17433
3
0.094456 0.753432
QA2 0.09898
9
0.037628 0.02668 0.15595 0.011435 0.315688 0.867125
QA3 0.68350
4
0.085557 0.676028 0.35243 0.339078 0.074989 0.032308 0.7141
1
Continuous Process Improvement (CP), Dependent Variable (DV), Independent Variable
(IV), Quality Assurance (QA), Environmental Regulation and Policy (ERP),
Organizational Performance (OP), Moderating Variable (MV).
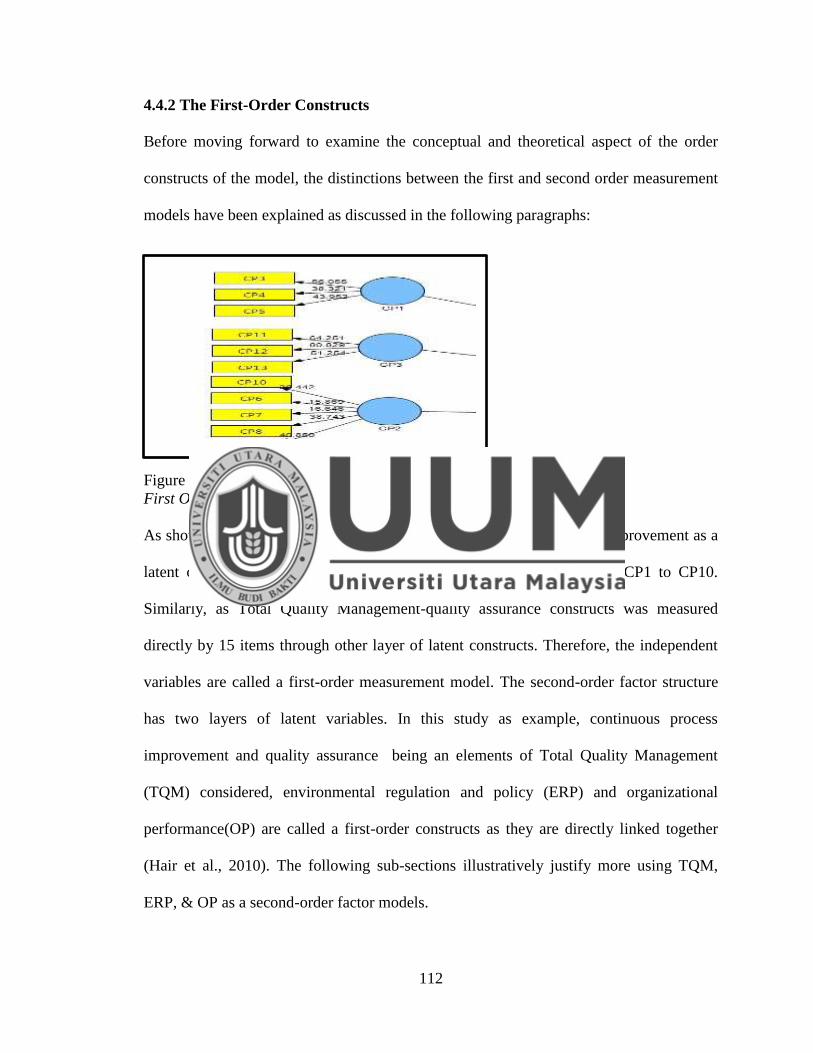
112
4.4.2 The First-Order Constructs
Before moving forward to examine the conceptual and theoretical aspect of the order
constructs of the model, the distinctions between the first and second order measurement
models have been explained as discussed in the following paragraphs:
Figure 4.2
First Order Measurement Model of TQM- CP
As shown in Figure 4.2, Total quality management-continuous process improvement as a
latent construct was measured by a set of measured variables namely CP1 to CP10.
Similarly, as Total Quality Management-quality assurance constructs was measured
directly by 15 items through other layer of latent constructs. Therefore, the independent
variables are called a first-order measurement model. The second-order factor structure
has two layers of latent variables. In this study as example, continuous process
improvement and quality assurance being an elements of Total Quality Management
(TQM) considered, environmental regulation and policy (ERP) and organizational
performance(OP) are called a first-order constructs as they are directly linked together
(Hair et al., 2010). The following sub-sections illustratively justify more using TQM,
ERP, & OP as a second-order factor models.
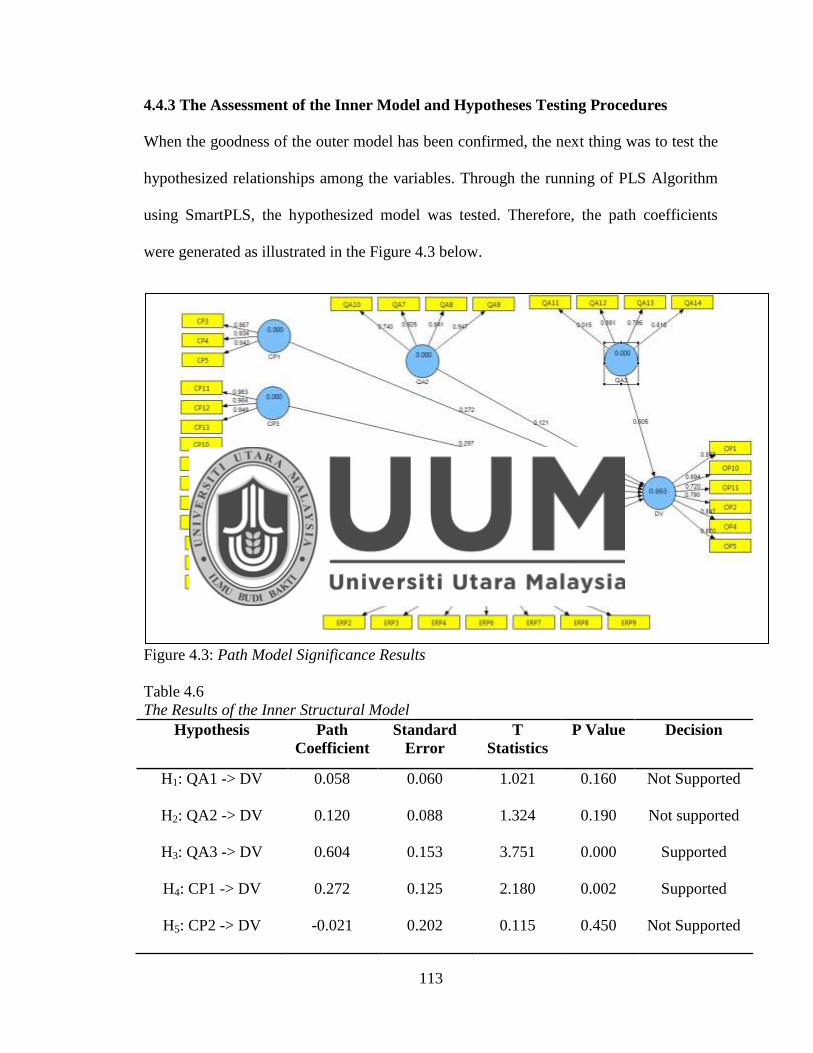
113
4.4.3 The Assessment of the Inner Model and Hypotheses Testing Procedures
When the goodness of the outer model has been confirmed, the next thing was to test the
hypothesized relationships among the variables. Through the running of PLS Algorithm
using SmartPLS, the hypothesized model was tested. Therefore, the path coefficients
were generated as illustrated in the Figure 4.3 below.
Figure 4.3: Path Model Significance Results
Table 4.6
The Results of the Inner Structural Model
Hypothesis Path
Coefficient
Standard
Error
T
Statistics
P Value Decision
H1: QA1 -> DV 0.058 0.060 1.021 0.160 Not Supported
H2: QA2 -> DV 0.120 0.088 1.324 0.190 Not supported
H3: QA3 -> DV 0.604 0.153 3.751 0.000 Supported
H4: CP1 -> DV 0.272 0.125 2.180 0.002 Supported
H5: CP2 -> DV -0.021 0.202 0.115 0.450 Not Supported
114
H6: CP3 -> DV 0.296 0.139 2.248 0.001 Supported
H7&H8: MV -> DV -0.202 0.113 1.689 0.005 Supported
Continuous Process Improvement (CP), Dependent Variable (DV), Independent Variable
(IV), Quality Assurance (QA), Environmental Regulation and Policy (ERP),
Organizational Performance (OP), Moderating Variable (MV).
For the purpose of drawing conclusion whether the path coefficients are statistically
significant or not, bootstrapping techniques embedded in this study with SmartPLS 2.0.
As reported in table 4.6, the T-Values with each path coefficient were determined using
bootstrapping technique and P-Values subsequently were generated. The results showed
that Quality assurance as Total Quality management (TQM) element has no significant
effect on Organizational Performance (β = 0.058, t = 1.021, p>0.1). Therefore the
hypothesis H1 of the effect of QA (Strategic Planning) on organizational performance
was not supported. The other hypothesis H2 (Process Focus) does not also have
significant effect on organizational performance (β = 0.120, t = 1.324, p>0.1) while H3 (β
= 0.604, t = 3.751, p<0.01) of QA (Production and delivery) has a significant effect on
organizational performance. Also, Continuous Process Improvement, CP: CP1, Quality
process (β = 0.272, t =2.180, p< 0.01) has significant effect, CP2, Continuous product
and service development (β = -0.021, t = 0.115, p>0.1) has no significant effect, while
CP3, Feedback (β = 0.296, t = 2.248, p< 0.01) has a positive significant effect on
Organizational performance making the hypotheses H4 H5 and H6: supported, not
supported and supported respectively. Lastly, the result (β = -0.202, t = 1.689, p< 0.01)
showed that ERP has a positive significant effect on organizational performance making
hypotheses H7 and H8 to be supported.
115
As it is normal that the self-assessment showed high performance, this study revealed that
the respondents criticized the current performance in food and beverage companies which
is a reflection of the problem of the study. Also, the small values of standard deviation
indicated the fact that this perception is virtually agreed upon among most managing
directors of food and beverage companies.
4.4.4 Testing the Moderating Effect of Environmental Regulations and Policy
According to the theoretical framework of this study, the moderating effect of
environmental regulation and policy has been proposed between TQM (i.e. QA and CP)
and Organizational performance. For testing the moderating effect of environmental
regulation and policy, SmartPLS 2.0 was used to examine the effect. As illustrated in
table 4.7, the results showed that there is a full moderating effect of environmental
regulation and policy in the relationship between QA and organizational performance at
the 0.01 level of significant (β = 0.374, t = 1.000, p< 0.01) according to the bootstrapping
method. Therefore, the result supports hypotheses of the study as postulated in H7. In
addition, the moderating effect of ERP in the relationship between CP and organizational
performance has been found to be significant (β = 0.743, t = 0.757, p< 0.01) and
therefore, hypotheses H8 supported this study.
Table 4.7
Testing the Moderating Effect of Environmental Regulation and Policy
Hypothesis Path
Coefficient
Standard
Error
T Statistics P value Bootstrapping
Effect
CP1 -> DV 0.743 0.981 0.757 0.450
CP1 * MV -> DV -0.705 1.341 0.525 0.300 Moderating
effect
CP2 -> DV 0.524 1.833 0.285 0.390
CP2 * MV -> DV -0.700 2.551 0.274 0.390 Moderating
effect
116
CP3 -> DV -1.150 1.222 0.941 0.170
CP3 * MV -> DV 1.994 1.624 1.227 0.110 Moderating
effect
MV -> DV 0.374 0.374 1.001 0.160
QA1 -> DV 0.0329 0.328 0.100 0.460
QA1 * MV -> DV 0.133 0.474 0.281 0.390 Moderating
effect
QA2 -> DV 0.622 0.407 1.528 0.070
QA2 * MV -> DV -0.628 0.486 1.291 0.100 Moderating
effect
QA3 -> DV 1.024 0.563 1.817 0.040
QA3 * MV -> DV -0.828 1.087 0.761 0.220 Moderating
effect
Continuous Process Improvement (CP), Dependent Variable (DV), Independent Variable
(IV), Quality Assurance (QA), Environmental Regulation and Policy (ERP),
Organizational Performance (OP), Moderating Variable (MV).
4.4.5 The Predictive Relevance of the Model
In the study of multivariate data analysis, R square of the endogenous variable is
explained by the predictor variables. Therefore, the R square’s magnitude for the
endogenous variables were considered to be an indicator of predictive power of the
model. In addition, the technique of reapplying sample was implemented as developed
by Stone (1975) and Geisser (1975) to confirm the predictive validity of the model. As
convincingly argued by Wold (1985), PLS is employed as very well and fit software for
the sample’s reuse technique for this purpose (Gotz, Liehr-Gobbers, & Krafft, 2011).
4.4.5.1 Cross-Validated Redundancy
The model predictive relevance can be examined using the stone-Geisser non-parametric
test (Chin, 1998; Fornel & Cha, 1994; Geisser, 1975; Stone, 1975). Using Smart-PLS
package, the blindfolding procedure can be performed to examine the predictive of the
117
model. Blindfolding step is then designed to discard some data while handle them as a
missing values for parameters estimation. Therefore, the estimated parameters are
employed again to rebuild the raw data that are supposed earlier to be missed. Due to this
blindfolding process, a general cross-validating metrics Q2
is produced.
In general, there are several Q2
that can be gotten based on the form of the chosen
prediction. A cross-validated communality is obtained when the points of the data are
predicted using the underlying latent variable scores. While the prediction of the data
points is acquired by the LVs that predict the block in question, a cross-validated
redundancy Q2 is the output. It has been opined by Fornell and Cha (1994) that the cross-
validated redundancy measure can be considered as a reliable indicator of the model
predictive relevance under control. Fornell and Cha (1994) stated that the redundancy
communality was discovered to be larger than 0 for all endogenous variables. Thus, the
model is regarded to have predictive validity, but if not, the predictive relevance of the
model cannot be concluded. As indicated in table 4.8, the cross-validated redundancy for
organizational performance is 0.550. Thus, according to the criteria suggested by Fornell
and Cha (1994), all value is more than zero which shows that there is an adequate
predictive validity of the model.
Table 4.8
Predictive Quality Indicators of the Model
Total SSO SSE 1-SSE/SSO
DV 762 342.440801 0.550603
4.4.5.2 R-square
According to literatures, R square is the indicator that shows the amount of variance
examined in the endogenous variable by its exogenous variable. R square reflects the
118
quality of the variables included in the model (Hair et al. 2010). However, there are many
criteria that can be employed as guidelines in assessing the level of R square. For
example, Cohen (1988) criterion opine that R square value equal 0.26 or more is
considered to be substantial, 0.13 moderate, and 0.02 weak. Meanwhile, Chin (1998)
criterion state that R square value equal or more than 0.67 is substantial, 0.33 moderate,
and 0.19 weak.
From the criteria mentioned above, the R square of the endogenous variables namely
environmental regulation and policy and organizational performance are 0.651 and 0.663
respectively as provided in Table 4.9.
4.4.5.3 Effect size
In accordance with criterion suggested by Cohen (1988), the effect size is less than 0.02
(0.02 = small, 0.15= medium, 035=high). From table 4.9, the effective size of
organizational performance , and the interaction terms , some interaction are above 0.1
while some other are less and considered to be small. The interaction was large only with
CP which is considered as small.
R2
incl - R2
excl
Effect size (f) =
1 - R2
incl
Table 4.9
Direct Effect IV-DV
R-squared Included Excluded f-squared Effect size
QA2 0.663 0.649 0.1022 Small
MV 0.663 0.651 0.0876 Small
QA1 0.663 0.66 0.0219 Small
CP2 0.663 0.662 0.0073 Non
CP1 0.663 0.648 0.1095 Small
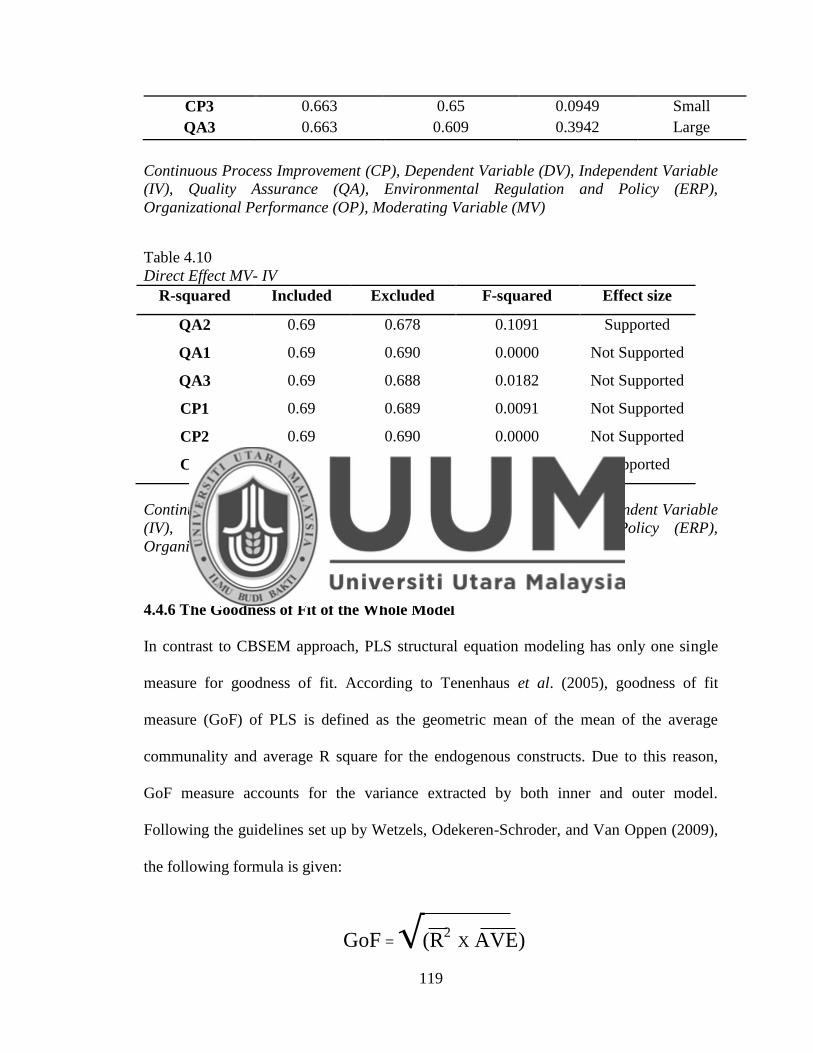
119
CP3 0.663 0.65 0.0949 Small
QA3 0.663 0.609 0.3942 Large
Continuous Process Improvement (CP), Dependent Variable (DV), Independent Variable
(IV), Quality Assurance (QA), Environmental Regulation and Policy (ERP),
Organizational Performance (OP), Moderating Variable (MV)
Table 4.10
Direct Effect MV- IV
R-squared Included Excluded F-squared Effect size
QA2 0.69 0.678 0.1091 Supported
QA1 0.69 0.690 0.0000 Not Supported
QA3 0.69 0.688 0.0182 Not Supported
CP1 0.69 0.689 0.0091 Not Supported
CP2 0.69 0.690 0.0000 Not Supported
CP3 0.69 0.686 0.0364 Supported
Continuous Process Improvement (CP), Dependent Variable (DV), Independent Variable
(IV), Quality Assurance (QA), Environmental Regulation and Policy (ERP),
Organizational Performance (OP), Moderating Variable (MV).
4.4.6 The Goodness of Fit of the Whole Model
In contrast to CBSEM approach, PLS structural equation modeling has only one single
measure for goodness of fit. According to Tenenhaus et al. (2005), goodness of fit
measure (GoF) of PLS is defined as the geometric mean of the mean of the average
communality and average R square for the endogenous constructs. Due to this reason,
GoF measure accounts for the variance extracted by both inner and outer model.
Following the guidelines set up by Wetzels, Odekeren-Schroder, and Van Oppen (2009),
the following formula is given:
GoF = √(R2
X AVE)
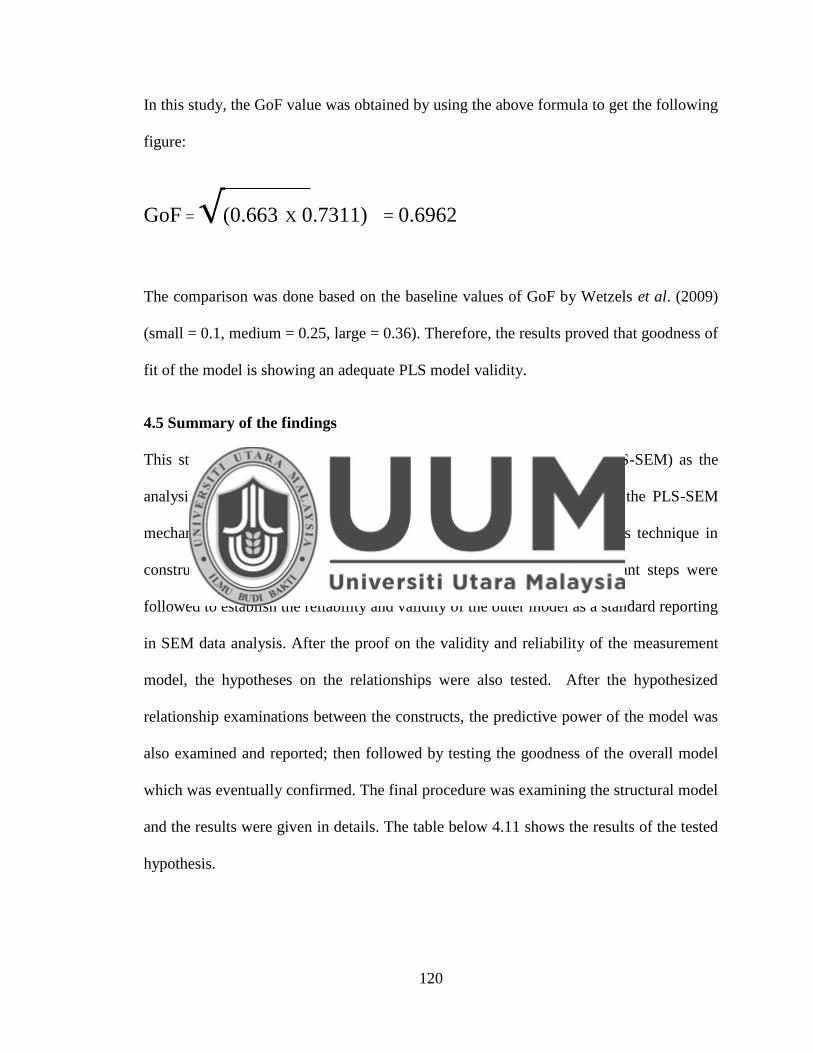
120
In this study, the GoF value was obtained by using the above formula to get the following
figure:
GoF = √(0.663 X 0.7311) = 0.6962
The comparison was done based on the baseline values of GoF by Wetzels et al. (2009)
(small = 0.1, medium = 0.25, large = 0.36). Therefore, the results proved that goodness of
fit of the model is showing an adequate PLS model validity.
4.5 Summary of the findings
This study used Partial Least Square Structural Equation Modeling (PLS-SEM) as the
analysis technique. In this particular chapter, an exclusive treatment of the PLS-SEM
mechanism technique of analysis was unfolded as PLS is a new analysis technique in
construction. Before the model of this research is tested, some important steps were
followed to establish the reliability and validity of the outer model as a standard reporting
in SEM data analysis. After the proof on the validity and reliability of the measurement
model, the hypotheses on the relationships were also tested. After the hypothesized
relationship examinations between the constructs, the predictive power of the model was
also examined and reported; then followed by testing the goodness of the overall model
which was eventually confirmed. The final procedure was examining the structural model
and the results were given in details. The table below 4.11 shows the results of the tested
hypothesis.
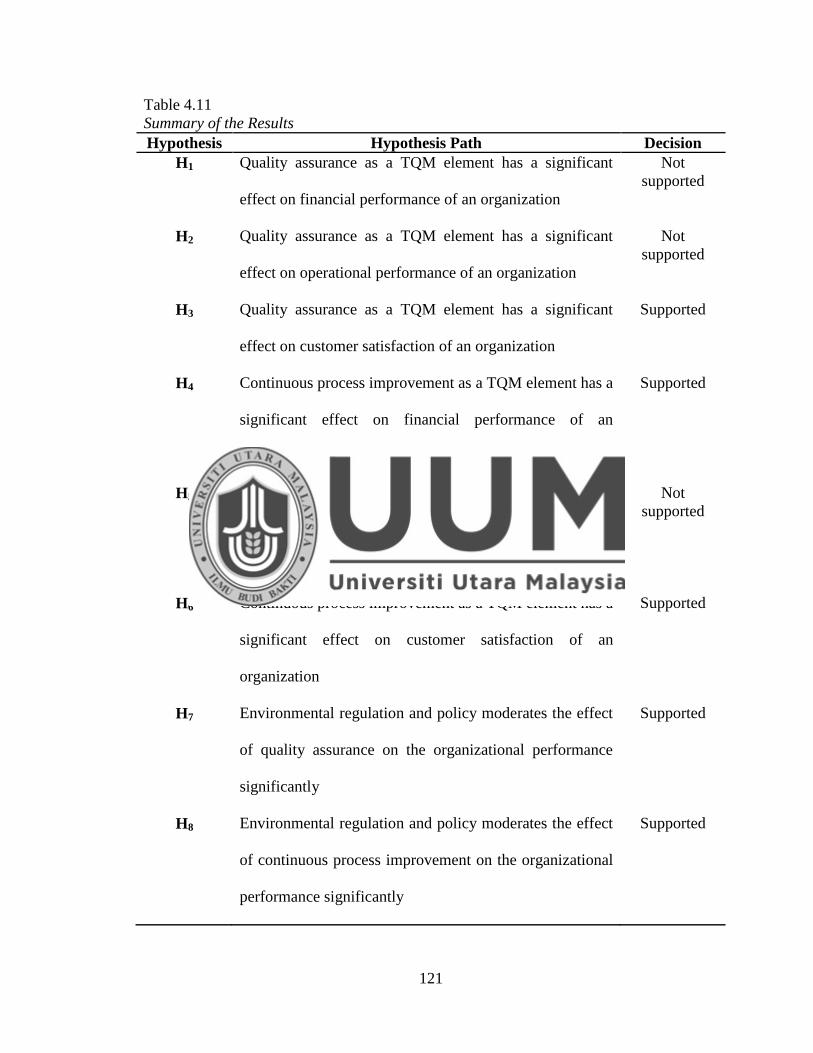
121
Table 4.11
Summary of the Results
Hypothesis Hypothesis Path Decision
H1 Quality assurance as a TQM element has a significant
effect on financial performance of an organization
Not
supported
H2 Quality assurance as a TQM element has a significant
effect on operational performance of an organization
Not
supported
H3 Quality assurance as a TQM element has a significant
effect on customer satisfaction of an organization
Supported
H4 Continuous process improvement as a TQM element has a
significant effect on financial performance of an
organization
Supported
H5 Continuous process improvement as a TQM element has a
significant effect on operational performance of an
organization
Not
supported
H6 Continuous process improvement as a TQM element has a
significant effect on customer satisfaction of an
organization
Supported
H7 Environmental regulation and policy moderates the effect
of quality assurance on the organizational performance
significantly
Supported
H8 Environmental regulation and policy moderates the effect
of continuous process improvement on the organizational
performance significantly
Supported
122
CHAPTER FIVE
DISCUSSIONS, CONCLUSIONS AND RECOMMENDATIONS
5.1 Introduction
This chapter presents the summary of the study. The first part of this chapter discusses
the beginning with the issues and motivations behind the research, and then followed by
the research design; conclude with the statistical analysis techniques employed and
outcomes of statistical tests in the previous chapter, the contribution of the study and the
results’ possible implications. The end parts report the limitations of this study and
highlight the potential directions for future research.
5.2 Discussion
In the last few years, TQM has been considered to be one of the most important
management instrument and a managerial philosophy that leads to the organization’s
continuous improvement and increase customers’ satisfaction and ultimately achieve
financial performance (Dean & Bowen, 1994; Shiba, Graham & Walden, 1993; Flynn,
Schroeder & Sakakibara, 1994; Grant, Shani & Krishnan, 1994). In the literature, there
are several researches examining the effect of TQM in different context and types such as
services, public sector, industry, SMEs, manufacturing and higher educational institutions
(Al-Swidi & Mahmood, 2011; Douglas & Judge, 2001; Sohal & Terziovski, 2000;
Saravanan & Rao, 2006; et al., 2004; Demirbag et al., 2006; Mohd Nizam & Tannock,
2005; Sohail & Hoong, 2003)
The present literature of quality management showed that the results regarding the
relationship between TQM practices and organizational performance are inconsistent
123
(Kaynak, 2003). Most of the researches that have been conducted reported positive
results (Arawati, 2005; Flynn et al., 1995; Douglas & Judge, 2001; Kaynak, 2003;
Molina-Azorin et al., 2009; Sila & Ebrahimpour, 2005; Yasin et al., 2004), and yet on the
other hand, some other studies reported opposite results (Dooyoung, Kalinowski, & El-
Enein, 1998; Sanchez-Rodriguez & Martinez-Lorente, 2004; Sila & Ebrahimpour, 2002).
Due to this discrepancies and inconclusive results, some researchers such as Ehigie and
McAndrew (2005) suggested that more research should be done about relationship in the
light of some other potential influencing variables.
Similarly, the previous literature has conflict results on the role of quality assurance in
organizations. A relevant quality assurance literature shows that there are many studies
conducted to examine the relationship between quality assurance and organizational
performance. Despite of this extensive research work, many empirical studies reported
inconclusive results (Kang et al., 2008). Many of these studies argued that quality
assurance can increase organizational performance whether financial or non-financial,
provide many benefits, enhancing customer services, minimizing inventory, improving
sales growth, and help organizations to gain competitive advantages over competitors
(Bendoly & Kaefer, 2004; Chung et al., 2007; Florescu et al., 2010; HassabElnaby et al.,
2012; Hunton et al., 2003; Park et al., 2007; Poston & Grabski, 2001; Shatat & Udin,
2012; Velcu, 2007). In contrast, other researchers found negative results that quality
assurance may affect the organizational performance adversely (Mohmood & Mann,
1993; Weill, 1992; Wieder et al., 2006).
In line with TQM practices, although there are extensive researches conducted in
literatures of quality management, several studies pointed out that the relationship
124
between continuous process improvement and organizational performance is still
inconclusive. Many researchers found that continuous process improvement is part of
TQM element which is positively related to organizational performance (Brun,
2011;Catalin, Bogdan, & Dimitrie, 2014; Christofi, et al., 2008; Williams, Babatunde, &
Jeleel, 2012; Wei, Zhao, & Zhang, 2014; Wiklund, 1999; Zahra & Covin, 1995).
However, some others reported opposite results (Wiklund & Shepherd, 2005). However,
the effect of continuous process improvement on the performance of organizations was
not elaborately investigated in the literature. In order to resolve this inconsistency, other
factors should be considered on this relationship for further investigation (Wiklund &
Shepherd, 2005). Therefore, in this present era of fast-paced technological advancement
and globalization, organizations should inculcate continuous process improvement in
their system and practices for more development, growth and survival (Dess, Lumpkin &
McGee, 1999).
Environmental regulation and policy has been considered as a holistic approach that
improves the performance of an organization (Chervinski, 2014), and has high impact on
business performance (Santos-Reyes & Lawlor-Wright, 2001). Abiding by the rules and
regulations is the main driver of excellence that can enhance and promote the
organizations from TQM to business excellence level (Mele & Colurcio, 2006). In this
study, because of the inconclusive results of QA and CPI and their relationship with
organizational performance, environmental regulation and policy was proposed to be the
mechanism that can explain those relationships in clearer way. In other words,
environmental regulation and policy as an outstanding practice may help organizations to
125
achieve the best results in organizational performance through implementing rare
practices such as QA and CPI.
The motivation behind this study is the inconclusive findings in the recent related
literature concerning the relationship between TQM elements, ERP and organizational
performance. However, the inconsistent findings of these relationships need further study
to solve the issues and challenges behind that (Al-Swidi & Mahmood, 2011c).
In addition, this study was motivated by the fact that the variables considered in this
study being QA and CPI have similar objectives in enhancing organizational performance
and equally share important success factors. Although, there are comprehensive review of
literatures which disclosed the fact that, there has been an extensive research work
regarding the discrete effect of QA, CPI and ERP on organizational performance; the
corollary impact of all of them has been unnoticeably neglected.
The main objective of this study was to investigate the moderating role of environmental
regulation and policy between TQM elements such as QA and CPI and organizational
performance as reflected in Malaysian food and beverage companies. Also, this study
investigates the collective joint effect of QA, CPI, and ERP on organizational
performance.
Thus, based on the problem highlighted in this study from chapter one and the
comprehensive review of the relevant literature in chapter 2, this study aimed to achieve
the following main objectives:
1. To examine the relationship between Quality Assurance as TQM element and
Organizational Performance.
126
2. To examine the relationship between Continuous process improvement as TQM
element and Organizational Performance.
3. To examine the moderating effect of Environmental regulation and policy
between Quality assurance and organizational Performance.
4. To examine the moderating effect of Environmental Regulation and Policy
between Continuous Process Improvement and Organizational Performance.
For the purpose of establishing the aforementioned objectives of this study, a
comprehensive literature review was conducted in chapter 2. The previous literature
related to quality assurance and continuous process improvement revealed that total
quality management despite their wide use and practice in SMEs, public and service
organizations, there are minimal researches in agro-allied industry, specifically in food
and beverage companies. As it has been stated earlier, the majority of the previous
researches related to TQM reported positive effect on organizational performance. On the
other hand, TQM implementation and practices were not successful in all cases.
Therefore, some authors paid a considerable attention to examine the reasons behind
failure of these practices. However, other researchers opined that some other influential
variables in the relationships of these variables for better explanation and findings.
As discussed in chapter 2, the theoretical framework of this study could be grounded and
underpinned by many theories such as organization and administrative theory, resources
based view (RBV), progressive utilization theory (PROUT), contingency theory and
institutional theory. However, contingency theory is the main theory in this study while
127
institutional theory is employed to complement it. Contingency theory underlies on the
match between available opportunities and organizational capabilities which will lead to
achieve and increase organizational performance. Institutional theory provides a
theoretical lens through which researchers can identify and examine influences that
promote survival and legitimacy of organizational practices, including factors such as
culture, social environment, regulation (including the legal environment), tradition and
history, as well as economic incentives, whilst acknowledging that resources are also
important (Baumol et al., 2009; Brunton et al., 2010; Hirsch, 1975; Lai et al., 2006; Roy,
1997).
In the light of the objectives of this study in chapter 1 and chapter 2, variables are
deduced to be used and formulate the framework of this study. Thus, to test the
developed theoretical framework, a quantitative methodology approach has been applied
that was introduced in chapter 3. According to the problem statement, research questions,
research objectives, and literature review, hypotheses of this study have been developed
and suitable to be empirically tested. According to the research methodology and
research design, a survey questionnaire was used to collect the data that reflected the
constructs of the study. All the questions used in the questionnaire were either adopted or
adapted from previous and different resources to support the content validity. Also, a
Likert scale was used to measure all the items.
In collecting the data of the study, questionnaires are sent by mail and later returned by
stamped addressed envelope by postal mail. This method was adopted for the entire
population. The questionnaire was produced in two languages: English Language and
128
Bahasa Melayu. A number of 250 questionnaires have been distributed and 71 have been
returned representing 28.4% as a response rate. For the purpose of analyzing the collected
data, structural equation modeling partial least squares (PLS-SEM) has been employed
through SmartPLS software; however, SPSS was employed to obtain the descriptive data,
non-response bias, and normality testing. The results of the analyzed data were reported
in chapter 4 to be further in this chapter. Additionally, the discussion of results of the
analyzed data in this chapter, recommendation, contribution of this study, limitation,
direction of future research and conclusion has been concluded.
5.3 Discussion on Research Objectives
This section explains the theoretical and empirical analysis between the constructs
considered in the study. It further justifies how the research objectives of this study are
met and achieved.
5.3.1 Relationship between TQM and Organizational Performance
For the main objective of this study to be achieved regarding the effect of TQM on
organizational performance, the relationship between TQM and organizational
performance were examined through quality assurance and continuous process
improvement. As illustrated in chapter 4, the relationship between TQM, as a composite
construct, and the organizational performance was found positive in some of the QA and
CP dimensions, while negative in some. This result is consistent with the finding of the
exsiting studies (Flynn et al., 1995; Douglas & Judge, 2001; Irfan, Ijaz, Kee, & Awan,
2012; Kaynak, 2003; Kumar et al, 2009; Llorens Montes & Verdu Jover, 2004; Molina-
Azorin et al., 2009; Munizu, 2013; Pinho, 2007). The results suggested that TQM
practice is crucial for Malaysian food and beverage companies to attain its objectives and
129
achieve the intended performance. Without doubt, food and beverage companies in
Malaysia with an effective and efficient TQM implementation would be able to mitigate
customers’ and society complaints, increase their satisfaction, produce good delivery
system and eventually lead to high performance.
The result supported the positive and significant impact of TQM on organizational
performance which is broadly reported in the literature of quality management; and also
the importance of TQM as a management philosophy and a determinant for any
organization to survive, develops, and delights its customers (Khamalah & Lingaraj,
2007; Kumar et al., 2009). In addition, successful implementation of TQM can help food
and beverage companies to improve the services and avoid many defects in their daily
work. Successful TQM initiatives lead to reduction in competitive work, improvement in
services offered, increase in number of employees and customers’ satisfaction and also
improve the entire organization performance. Therefore, TQM successful initiatives can
reduce and maintain the rate of errors (Al-Mansour, 2007).
Since the contribution degree of each TQM critical factor varies (Llorens Montes &
Verdu Jover, 2004), this study hereby conducted more examinations of the importance of
each TQM factor. The comprehensive understanding of TQM factors can help the
managers of food and beverage companies for a better utilization of the available
resources. Therefore, towards a successful practical implementation of TQM, more
attention must be paid and more investment should be allocated for highly contributing
TQM elements when compared to less contributing factors. Past studies reported mixed
results regarding the relationships between TQM dimensions and organizational
performance (Rahman & Bullock, 2005). Table 4.6 in Chapter 4 showed that the TQM
130
elements are significant predictors of the organizational performance which will be
discussed in the following sub-sections.
5.3.2 Quality Assurance and Organizational Performance
The results of this study showed that quality assurance has insignificant effect on
organizational performance as shown in Table 4.11 in Chapter 4, page 110. Therefore the
hypothesis H1 (β = 0.058, t = 1.021, p>0.1) of the effect of QA (Strategic Planning) on
organizational performance was not supported. The other hypothesis H2 (Process Focus)
does not also have significant effect on organizational performance (β = 0.120, t = 1.324,
p>0.1) while H3 (β = 0.604, t = 3.751, p<0.01) of QA (Production and delivery) has a
significant effect on organizational performance. In general, it shows quality assurance
does not have significant effect on organizational performance. These finding is
inconsistent with other studies that found a strong relationship between quality assurance
and organizational performance (Lau & Tang, 2009; Law, 2010; Timothy, 2008;
Mergenthaler, Weinberger & Qaim, 2009; Llorens-Montes & Verdu-Jover, 2004; Talib et
al., 2013). Lakhe and Mohanty (1995) argued that consistent quality assurance would
improve the organizational performance.
The insignificant effect of quality assurance on organizational performance in food and
beverage companies (FBC) could be explained by the fact that customer‘s voice still
absent. The impact of customers on organizational quality assurance is still not effective
(AL-Zamany et al., 2002). In other words, the traditional performance measures of FBC
towards focusing on the customers‘ services requirements had become outdated and
needs to be improved and changed (Langworthy, 1999). For the sake of improving the
assurance of quality, FBC of Malaysia should look again at their policies and reengineer
131
them if needed, and in turn link them to the capabilities of their employees to enhance the
quality of their service.
Furthermore, the results showed the lack of reviewing the quality assurance before
introducing and marketing which reflects unsatisfied beneficiaries. In addition, the results
also indicated the lack of participation when planning and designing the new service from
employees in different departments of Malaysian FBC.
5.3.3 Continuous Process Improvement and Organization Performance
Continuous process improvement is considered one of the most important factors that
search for never-ending improvement the output performance (Talib et al., 2013). Based
on the results illustrated in Table 4.6 in Chapter 4, at page 103 Continuous Process
Improvement was found to be significant with organizational performance in all
dimensions. That is Continuous Process Improvement, CP: CP1, Quality process (β =
0.272, t =2.180, p< 0.01) has significant effect, CP2, Continuous product and service
development (β = -0.021, t = 0.115, p>0.1) has no significant effect, while CP3, Feedback
(β = 0.296, t = 2.248, p< 0.01) has a significant effect on Organizational performance
making the hypotheses H4 H5 and H6: supported, not supported and supported
respectively. This result is in contrast to other previous study (Yusuf et al., 2007;
Benavent et al., 2005; Christos et al., 2010; Gatchalian, 1997; Lakshman, 2006; Powell,
1995; Talib et al., 2013), however, in line with the study of Burli et al. (2012) that found
continuous process improvement to be significantly affecting organizational
performance.
132
The result shows that the continuous process improvement practices are not given
attention and not implemented effectively in Malaysian food and beverage companies
(FBC). FBC as a sub-set of an agro-based industry focuses more on achieving the daily
jobs that related to issues happening within the unit of organizations and how it affects
the employees and customers. Therefore, they do not pay more attention on how they can
improve such service through implementing the continuous process improvement. The
continuous process improvement should not only concern on some practices but cover all
management practices (Benavent et al., 2005). In rapid urbanization needs, FBC should
be continuously sensitive to the constituent needs for more successful implementation of
TQM practices, managers and employees; FBC should plan and implement a
comprehensive continuous process improvement programs that involve all members and
levels in the organization. The TQM practice in FBC should involve all the processes and
functions integrated to meet customer needs and achieve the desired continuous process
improvement (Ganiyu, Uche, & Elizabeth, 2012). The lack of training which was
explained above also leads to reduction in the speed of improvement. Therefore, training,
involvement, process quality, company products and services, feedback system are the
best practices to enhance the continuous process improvement to cover all management
practices (Benavent, Ros, & Moreno-Luzon, 2005).
Furthermore, the results indicated that activities and operations in FBC are not given the
proper improvement that can focus more on quality as a long-term goal rather than the
short-run. Therefore, FBC should increase the awareness among top managers and
employees in departments to practice improvement as a strategy that can enable them to
serve customers in a better way to fulfill the desired competitive advantages.
133
5.3.4 The Moderating Role of Environmental Regulation and Policy between Total
Quality Management (TQM) and Organizational Performance (OP)
In order to answer the questions raised on this study and meet the research objectives, the
researcher investigated the moderating effect between TQM (using Quality assurance and
continuous process improvement) and organizational performance. As it can be seen in
Table 4.7 in Chapter 4, page 105, the moderating effect of Environmental regulation and
policy between TQM and organizational performance was confirmed at the 0.01 level of
significance (β = 0.374, t = 1.001, p< 0.01) according to the bootstrapping method. This
result supported the hypotheses H7 and H8 of the study. Moreover, this finding confirmed
the logical use of environmental regulation and policy as a practice that can help
organizations to improve performance through TQM implementation through quality
assurance and continuous process improvement (Kaur, Singh, & Ahuja, 2013). In other
words, ERP in this study plays the role of the mechanism that explains the effect of TQM
on organizational performance.
Some studies previously confirmed the positive relationship between TQM and
organizational performance from one view, and ERP from other view. Therefore, the
collective impacts of these variables on organizational performance is logically proposed
and confirmed in this study. The result also reflects the importance of the regulation and
policy as a mechanism that can explain the effect of TQM practices to improve
organizational performance through quality assurance and continuous process
improvement. Lastly, the result reflects the awareness of FBC in following regulations
and policy in their daily work.
134
5.4 Conclusions
After the discussion on the relationships between the constructs involved in this study,
with the result analysis and findings subsequently, the following contributions of the
research work carried out conclude the research undertaken.
5.4.1 Contributions of the Study
In this study, many insights and ideas concerning the issues related to the organizational
performance of Malaysian food and beverage companies have been raised. The current
study, as to date is one of very few studies conducted in the Asian world to examine the
joint effect of TQM and ERP on organizational performance under agro-allied sector.
Additionally, this study is an attempt to expand and strengthen the boundary of the
current existing knowledge in the literature by investigating the moderating effect of
environmental regulation and policy on the organizational performance using PLS-SEM
analysis. Therefore, by incorporating the effect of QA, CPI, and ERP, this study has
many contributions in the literature and practice. In the following sub-sections, some
contributions of this study are elaborated.
5.4.1.1 Contributions to the Literature
This study is conducted to increase the understanding of the connection existing between
TQM, ERP and organizational performance. According to the results of the past studies,
the framework of the study was developed and employed as a tool to examine the
hypothesized relationships. In chapter 1, the significance of this study has been clearly
discussed. So many contributions are discussed as follows:
135
Firstly, this study demonstrated the importance of TQM in agro-allied industries,
particularly in the food and beverage companies. Additionally, it contributed theoretically
to the TQM literature by reexamining the unresolved matter concerning the relationship
between TQM and organizational performance. The inconsistency among researchers in
the literature regarding the impact of TQM on organizational performance called for
further discussion and investigation. Moreover, this study contributed significantly to the
literature by integrating the effective ERP as the innovative strategies and practices to the
theoretical model to better explain the variance in the construct of organizational
performance.
Second, this study reported the significance of CPI for enhancing the overall
organizational performance. However, the direct effect of CPI on organizational
performance was not confirmed as some of the CPI’s items showed a negative effect on
organizational performance. The previous studies in the literature reported inconsistent
results. Some of these results showed that CPI can enhance the performance positively,
but other argued that CPI can affect the performance negatively and sometimes
considered as the main reason for collapsing (Chervinski, 2014; Leshinsky, 2012;
Marquita, 2010). Therefore, in this study CPI was examined with other strategic element
to prove its significance level.
Third, the current study showed the significance of QA on the organizational
performance. Due to the inconsistent results about this relationship, this study contributed
to the management literature by reexamining the effect of QA on organizational
performance. However, there are bulk research works in the literature that tested the
effect of QA on organizational performance; still there is no agreement among the
136
researchers. As a result of the inconclusiveness in results, many practitioners and
academics questioned the suitability of QA strategy for organizational performance
(Wiklund & Shepherd, 2005). The findings of this study, however, confirmed the positive
significant impact of QA on the organizational performance.
Fourth, the results of the current study revealed that the joint effect of QA, CPI and ERP
on the organizational performance was stronger than the separate effect of each of these
strategies alone. In addition to that, this study suggested that QA, CPI and ERP should be
practiced and implemented as integrated strategies. This can be noticed from the inter-
dependent exhibited among the dimensions of every construct. Moreover, when
comparing the impact of QA, CPI and ERP as composite variables with their
measurements on organizational performance, they are hardly recommended that these
practices and strategies should be considered as bundles rather a grouping of strategies
and practices.
Fifth, this study provided an important examination about the role played by
Environmental regulation and policy in increasing the organizational performance. The
moderating effect of Environmental regulation and policy as a mechanism that can
explain the relationships more between QA, CPI and organizational performance was
examined. The results revealed that Environmental regulation and policy plays an
important role in creating and enhancing organizational performance. In addition, the
significance of Environmental regulation and policy contributes to the contingency theory
as environment is one of the contingency factors that influence the selection of
management practices and adding it as an important resource to achieve the
organizational competitive advantages (Doty et al., 1993).

137
Sixth, the majority of previous studies concentrated on the public and services sectors.
However, this study in contrary extends the existing literatures concerning TQM, ERP
and organizational excellence in the manufacturing sector, taking the food and beverage
companies as a case. Most of studies in manufacturing sector in general were conceptual,
observational, and descriptive in nature. Therefore, this study on the food and beverage
companies in Malaysia has been an attempt to add to existing empirical literatures.
Finally, in addition to the hypotheses testing and the model testing, this study conducted a
rigorous analysis on the validation instrument. Majority of the previous studies depended
on the traditional instrument validation such as factor analysis and Cronbach alpha
coefficient. These kinds of instruments are not sufficient in the current complex needed
analysis. More specifically, the present study used Partial Least Squares Structural
Equation Modeling (PLS-SEM) approach to validate the measurement model and testing
the hypothesized relationships. Thus, this study can be considered as one the very few
thesis and studies that employed the approach of PLS-SEM to analyze the measurement
model goodness of fit and testing the proposed hypotheses.
5.4.1.2 Practical Contributions
The present study‘s results have significant contributions and implications for managers,
practitioners, and policy makers. There are many advantageous insights on how TQM
and ERP can enhance the overall organizational performance. Some of these practical
contributions are the following:
First, the findings of this study suggested that Continuous Process Improvement should be
effectively incorporated in Malaysian food and beverage companies. In addition, the
138
industry policy-makers should pay an attention to restructure the strategies, practices, and
policies to be aligned with the technological advancements and implementing managerial
strategies. The integration of strategies such as Process quality, company products and
services, feedback system can help agro-allied industry as a whole to increase its
performance and achieve the optimum competitive advantages.
Secondly, due to the inconsistent in the previous study about the effect of TQM on
organizational performance, environmental regulation and policy intervened in this study
to explain the practices in a better way. The results show the importance of
environmental regulation and policy as a practice to follow in order to increase and
enhance organizational performance. In addition, the results increase the awareness in
food and beverage industry to follow rules and regulations which involves life safety,
innovation and customer focus when implementing TQM. Environmental regulation and
policy as a practice in food and beverage companies can lead to higher performance, but
also at the same time can be a desire and a result from practicing other initiatives.
Moreover, FBC should excel when dealing with other strategies and practices to have the
successfulness and obtain the planned goals.
Finally, this study can also give some insights to public, manufacturing and service
organizations in Malaysian and Asean region. For example, other industries in Malaysia
or other Asian countries can take this study as a guideline when striving for excellence. In
other words, FBC whether in Malaysia or outside can have many practical benefits from
this study. The extensive literature and arguments, and the results should be taken into
consideration from other industries to enhance their performance. In this study, the most
important factors were discussed such as QA, CPI and ERP that are necessary nowadays
139
for any organization that wants to achieve success and competitive advantages. In some
companies, TQM practice was implemented but without having information system to
link the whole departments, others have systems but not having strategies and practices
such as QA and CPI. Therefore, the integration of these strategies and practices will help
food and beverage companies to enhance their performance through implementation of
the suggested constructs in this study concurrently. In addition, also other private sectors
can also have a great value from the findings of this study.
5.4.1.3 Contributions to Knowledge
First, the results of this study can raise the awareness among decision makers and
managers in Malaysian food and beverage companies on the significance of
implementing TQM in their organizations. TQM as a management philosophy which
comprises Quality assurance and Continuous process improvement is considered as a
prerequisite for any organization which want to achieve the competitive advantages and
increase the organizational performance. In other words, if Malaysian food and beverage
companies want to implement any strategies or initiate new system, TQM is needed
before that to the problems that can be come out later.
In addition, QA as an element of TQM is an important integrated system, this study
highlighted the importance of QA for organizations to align with the competitive
environment and achieve the advantages over competitors. As revealed from this study,
effective production and delivery is very essential for any organization that has a willing
to be global. Also, as reported in the last chapter, the integration between CPI and
organization can lead the industry to achieve the desired objectives. The result of this
study supporting the impact of quality process on organizational performance will help
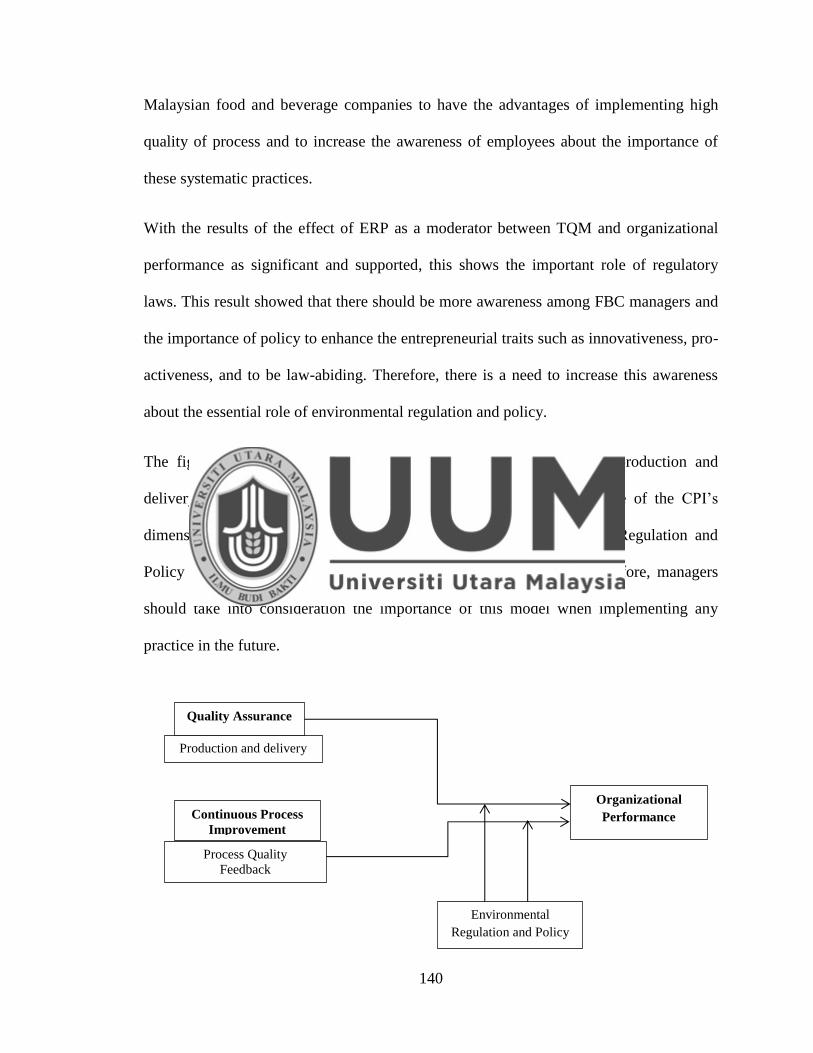
140
Malaysian food and beverage companies to have the advantages of implementing high
quality of process and to increase the awareness of employees about the importance of
these systematic practices.
With the results of the effect of ERP as a moderator between TQM and organizational
performance as significant and supported, this shows the important role of regulatory
laws. This result showed that there should be more awareness among FBC managers and
the importance of policy to enhance the entrepreneurial traits such as innovativeness, pro-
activeness, and to be law-abiding. Therefore, there is a need to increase this awareness
about the essential role of environmental regulation and policy.
The figure 5.1 below therefore summarizes the fact that: effective “production and
delivery” as one of the QA’s dimensions, “Quality of process” as one of the CPI’s
dimensions ; and the incorporation of and abiding by Environmental Regulation and
Policy are very much significant to organizational performance. Therefore, managers
should take into consideration the importance of this model when implementing any
practice in the future.
Continuous Process
Improvement
Organizational
Performance
Environmental
Regulation and Policy
Production and delivery
Process Quality
Feedback
Quality Assurance
141
Figure 5.1: The Research Empirical Model linking Supported Quality Assurance’s and
Continuous Process Improvement’s Dimensions, with Organizational Performance and
Environmental Regulation and policy
5.5 Limitations of the Study
Despite the fact that this study provides good insights and contributions; there are still
some limitations that should be put into consideration when discussing the results of the
study.
First, the scope of the present study was limited to food and beverage companies only and
not included other agro-allied companies in Malaysia. This limitation is pertained to
generalizability of the results of the study. In addition, the unit of analysis in this study
was any top personnel in the companies which could replace the role of managers.
Although, the FBC is one of the main industries in Malaysia, it would be difficult to
generalize the results on other sectors or public organizations, and even to other private
companies due to the technology advancement and leadership support.
Secondly, in the methodology part, this study followed a cross-sectional research design
to examine the hypothesized relationships at a single point of time which is considered as
another limitation. The changes in the psychological human aspects and approaches to
issues could be changed from time to another. Based on that, the conclusion generated
from this study could be different if the research design was longitudinal rather than
cross-sectional study. In other words, a review of TQM and ERP revealed that they are
long term strategies in nature. Therefore, studying the relationship between them at one
point of time will not be justifiable enough to its accuracy and that is why it is strongly
142
recommended that the longitudinal studies should be conducted to examine the effect of
TQM and ERP on organizational performance.
Third, as the case of quantitative research methods, the respondents were requested to
translate their perception based on statement in the survey questionnaire into numbers
through Likert scale. These answers may be influenced by the biased perception of the
situation (Macinati, 2008). Therefore, this study recommends that future research design
should consider mixed research design. In other words, quantitative and qualitative
research designs to be employed in the future research to complement each other.
Finally, another important limitation of the present study was the lack of other studies
tackling the same factors in Malaysian with the best knowledge of the researcher. The
lack of availability of these researchers, limit the research’s results to be compared with
other results of a study in the same context. In other words, in the context of Malaysia,
there has been no researches previously examined the relationships of the constructs of
this study; the researcher had to proceed in the study without having the advantages of
other findings to be benchmarked or to be used as “compare and contrast” for more
explanations.
5.6 Recommendations for Future Research
The current study provides many future research opportunities. Firstly, the data of this
study was collected through a cross-sectional approach at a point of time. Due to the
complex joint effect in the study strategies such as TQM, ERP and organizational
performance, a longitudinal research could be extended. The longitudinal research
approach could explain the complex relationship over long period of time and could
143
explain better the variables development over time for the sake of detecting the changes
the relationships between variables through the process.
Secondly, the previous limitation regarding the research design approach limited the
researcher to observe the subsequently dynamic nature of the relationships and effect
between the research‘s variables in long-term strategies. Therefore, to be able to examine
the dynamic effect of QA and CPI on organizational performance, case study approach
could be considered as a better potential choice. This approach can enable the researcher
to investigate in a deeper way on the complex relation between variables, and
consequently the results could be different and provide insights into the potential
successful factors.
Third, the results of this study were based on the gathered data from a particular officer in
FBC. However, they are the best authoritative representatives to answer and describe the
TQM and ERP and their effect on organizational performance. In some future studies,
these constructs could be evaluated by other respondents such as customers and
employees.
Fourth, the limitation of generalizability that has been discussed previously can be
improved by conducting more studies about the effect of TQM on organizational
performance with the existence of ERP. Some studies can be conducted separately to
focus more on each construct. In addition, the model of this study can also be examined
through data collected from all manufacturing organizations in Malaysia Government.
Moreover, some other studies can be conducted in Malaysia examining the same model
144
in different sectors. Furthermore, this model can be also examined empirically using data
collected from other countries in the region that have strong and unique cultural practices.
Finally, in chapter five, the R-square of organizational performance was 60%. This
means that the model’s variables contribute to 60% of organizational performance. Based
on this result, it can be safely conclude that there are some other variables that may
increase the rate of performance which can be considered for future study.
In conclusion, the company organizational performance will remain one of the main
issues related to the development of a country. Therefore, the enhancement of the overall
organizational performance of an organization has been the attention of all managers and
decision makers in the developing countries, including Malaysia. In the literature, it has
been widely acknowledged that the important roles of TQM and ERP as the most
effective strategies can assist organizations to enhance their performance and achieve
competitive advantages over competitors. These strategies have been recognized in
Malaysia in general despite the short history of these practices and strategies in Malaysia.
However, the mixed results in this study of supporting or not supporting the proposed
hypotheses, the impact of TQM through QA, CPI and ERP and their dimensions
confirmed their importance and significant effect on the organizational performance. In
spite of the origin of these strategies as Western source, they can be helpful in developing
countries for enhancing the organizational performance of the agro-based industries of
Malaysia in general and FBC in particular.
This study examined the moderating role of environmental regulation and policy as a
mechanism that can explain in a better way the relationship between TQM and
145
organizational performance. The results confirm that ERP can enhance the role of TQM
to achieve higher organizational performance. As a heart of excellence, following the
rules and regulations related to environment plays an important role in enhancing the
organizational performance through implementing the policies on innovative strategies
and practices.
In summary, the results of this empirical study highlight new insights about how TQM
and ERP can improve the organizational performance of food and beverage companies in
Malaysia.
146
REFERENCES
Abd.Aziz, N., & Yassin, N. M. (2010). How Will Market Orientation and External
Environment Influence the Performance among SMEs in the Agro-Food Sector in
Malaysia ? International Business Research, 3(3), 154–164.
Abdous, M. (2009). E-learning Quality Assurance: a process oriented lifecycle model.
Quality Assurance in Education, 17(3), 281–295.
AbdRahman, Khalid, M. Rasyikah Suhaimi, (2010). ‘Legal analysis of sustainable
development and water management in Malaysia. The 16th International
Sustainable Development and Research Conference, 2010, university of Hong
Kong.
Abdullah, A. (2010). Measuring TQM implementation: a case study of Malaysian SMEs.
Measuring Business Excellence, 14(3), 3–15.
Abor, J., & Biekpe, N. (2007). Corporate governance, ownership structure and
performance of SMEs in Ghana: implications for financing opportunities. Corporate
Governance: The International Journal of Business in Society, 7(3), 288–300.
Abu-Hamatteh, Z. S. H., Al-Azab, T. a., & El-Amyan, M. (2003). Total quality
management achievement: King Abdullah II Award for Excellence of Jordan as a
model. Technovation, 23(7), 649–652.
147
Adebowale, A.-S. (2013). Food Production, Hunger and Poverty of Public Policy in
Nigeria: A Political Economic Analysis. International Journal of Research in Social
Science, 2(2), 20–25.
Adeoye, A., & Elegunde, A. (2012). Impacts of External Business Environment on
Organisational Performance in the Food and Beverage Industry. British Journal of
Arts and Social Sciences, 6(2), 194–201.
Adina-Petruţa, P., & Roxana, S. (2014). Integrating Six Sigma with Quality Management
Systems for the Development and Continuous Improvement of Higher Education
Institutions. Procedia - Social and Behavioral Sciences, 143, 643–648.
Agus, A., & Hassan, Z. (2011). Enhancing Production Performance and Customer
Performance Through Total Quality Management (TQM): Strategies For
Competitive Advantage. Procedia - Social and Behavioral Sciences, 24, 1650–1662.
Ahire, S. L., & Dreyfus, P. (2000). The impact of design management and process
management on quality: an empirical investigation. Journal of Operations
Management, 18(5), 549–575.
Ahmad, A. (2009). Marketing Practices Among Malaysian SME’s in Agro-based
Industry. Persidangan Kebangsaan Ekonomi Malaysia, 2, 145–150.
Ahmad, K. (2012). The Use of Management Accounting Practices in Malaysian SMEs,
1–24.
148
Ahmad, M. F., Zakuan, N., Jusoh, a., Yusof, S. M., & Takala, J. (2014). Moderating
Effect of Asean Free Trade Agreement between Total Quality Management and
Business Performance. Procedia - Social and Behavioral Sciences, 129, 244–249.
Ahmad, S., & Schroeder, R. G. (2002). The importance of recruitment and selection
process for sustainability of total quality management. International Journal of
Quality & Reliability Management, 19(5), 540–550.
Ahmed, S., Hassan, M. H., & Taha, Z. (2004). State of implementation of TPM in SMIs:
a survey study in Malaysia. Journal of Quality in Maintenance Engineering, 10(2),
93–106.
Ahmed Sheikh, N., Wang, Z., & Khan, S. (2013). The impact of internal attributes of
corporate governance on firm performance. International Journal of Commerce and
Management, 23(1), 38–55.
Aigner, D. J., & Lloret, A. (2013). Sustainability and competitiveness in Mexico.
Management Research Review, 36(12), 1252–1271.
Akgün, A. E., İmamoğlu, S. Z., Koçoğlu, İ., İnce, H., & Keskin, H. (2014). Bridging
Organizational Learning Capability and Firm Performance through Customer
Relationship Management. Procedia - Social and Behavioral Sciences, 150, 531–
540.
149
Akgün, A. E., Keskin, H., & Byrne, J. (2009). Organizational emotional capability,
product and process innovation, and firm performance: An empirical analysis.
Journal of Engineering and Technology Management, 26(3), 103–130.
Alkafaji, Y. a. (2007). Quality assurance review programs of auditing firms: an
international perspective. Managerial Auditing Journal, 22(7), 644–660.
Al-khalifa, K. N., & Aspinwall, E. M. (2000). The development of total quality
management in Qatar Research and concepts The development of total quality
management in Qatar. The TQM Magazine, 12(3), 194–204.
Al-Swidi, A. K., & Mahmood, R.(2011a). Fostering the Performance of Banks Through
Total Quality Management (TQM) Practices: A Bank Branches Perspective.
European Journal of Social Sciences,19(2), 268-285.
Allen, R. S., & Kilmann, R. H. (2001). Aligning Reward Practices in Support of Total
Quality Management. Business Horizons, 44(3), 77–84.
Alomaim, N., Zihni Tunca, M., & Zairi, M. (2003). Customer satisfaction @ virtual
organizations. Management Decision, 41(7), 666–670.
Anderson, J.C., & Gerbing, D.W. (1988). Structural equation modeling in practice: A
review and recommended two-step approach. Psychological bulletin, 103(3), 411.
Aravind, D. (2012). Learning and innovation in the context of process-focused
management practices: The case of an environmental management system. Journal
of Engineering and Technology Management, 29(3), 415–433.
150
Argilés-Bosch, J. M., Martí, J., Monllau, T., Garcia-Blandón, J., & Urgell, T. (2014).
Empirical analysis of the incidence of accidents in the workplace on firms’ financial
performance. Safety Science, 70, 123–132.
Arthur Dahl, C. Esty and Daniel, (2005). Environmental Sustainability Index, Yale
Center for Environmental Law and Policy & Yale University & Center for
International Earth Science Information Network, Columbia University.
Assaf, a. G., Josiassen, A., Knežević Cvelbar, L., & Woo, L. (2015). The effects of
customer voice on hotel performance. International Journal of Hospitality
Management, 44, 77–83.
Atkinson, C. (1994). Continuous Improvement : The Ingredients of Change. International
Journal of Contemporary Hospitality Management, 6(1/2), 06–08.
Azahan Awang, Jahi, M. Jamaluddin, Kadaruddin Aiyub, Kadir Arifin, (2009).
‘Development, Environmental Degradation and Environmental Management in
Malaysia. European Journal of Social Sciences – Volume 9, Number 2 (2009).
Badar, A. Iqbal, (2002). The State of the Natural Resources in Malaysia title’
Development strategy for Malaysian natural Resources’. Vol. 12, Issue. 2,
Faculty of Commerce Aligarh Muslim University Aligarh, India.
Baird, K., Hu, K. J., & Reeve, R. (2011). The relationships between organizational
culture, total quality management practices and operational performance.
International Journal of Operations & Production Management, 31(7), 789–814.
151
Barber, K. D., Munive-hernandez, J. E., & Keane, J. (2006). Process based knowledge
management systems for continuous improvement. International Journal of Quality
& Reliability Management, 23(8), 1002–1018.
Barclay, D., Higgins, C., & Thompson, R. (1995). The partial least squares (PLS)
approach to
causal modeling: personal computer adoption and use as an illustration. Technology
studies, 2(2), 285-309.
Basu, R. (2014). Managing quality in projects: An empirical study. International Journal
of Project Management, 32(1), 178–187.
Benavent, F. B., Ros, S. C., & Moreno-Luzon, M. (2005). A model of quality
management self-assessment: An exploratory research. International Journal of
Quality & Reliability Management, 22(5), 432-451.
Benavides-Chicón, C. G., & Ortega, B. (2014). The impact of quality management on
productivity in the hospitality sector. International Journal of Hospitality
Management, 42, 165–173.
Benavides-Velasco, C. a., Quintana-García, C., & Marchante-Lara, M. (2014). Total
quality management, corporate social responsibility and performance in the hotel
industry. International Journal of Hospitality Management, 41, 77–87.
152
Bendoly, E. & Kaefer, F. (2004). Business Technology Complementarities: Impacts of
the Presence and Strategic Timing of ERP on B2B E-commerce Technology
Efficiencies. Omega, 32(5), 395-406.
Besseris, J. G. (2012). Ecodesign in total environmental quality management. The TQM
Journal, 24(1), 47–58.
Bilge, P., Badurdeen, F., Seliger, G., & Jawahir, I. S. (2014). Model-based Approach for
Assessing Value Creation to Enhance Sustainability in Manufacturing. Procedia
CIRP, 17, 106–111.
Bolívar-Ramos, M. T., García-Morales, V. J., & García-Sánchez, E. (2012).
Technological distinctive competencies and organizational learning: Effects on
organizational innovation to improve firm performance. Journal of Engineering and
Technology Management, 29(3), 331–357.
Bon, A. T., & Mustafa, E. M. a. (2013). Impact of Total Quality Management on
Innovation in Service Organizations: Literature Review and New Conceptual
Framework. Procedia Engineering, 53, 516–529.
Bracci, E., & Maran, L. (2013). Environmental management and regulation: pitfalls of
environmental accounting. Management of Environmental Quality : An
International Journal, 24(4), 538–554.
153
Brook, J. W., & Pagnanelli, F. (2014). Integrating sustainability into innovation project
portfolio management – A strategic perspective. Journal of Engineering and
Technology Management, 34, 46–62.
Brown, H. S., Derr, P., Renn, O., & White, A. L. (1993). Corporate environmentalism in
a global economy: Societal values in international technology transfer. Westport,
CT: Quorum Book.
Buniamin, S. (2010). The Quantity and Quality of Environmental Reporting in Annual
Report of Public Listed Companies in Malaysia. Issues in Social and Environmental
Accounting, 4(2), 115–135.
Byrne, B. (2010). Structural Equation Modeling With AMOS (Second edition ed.): Taylor
& Francis Group.
Cachay, J., & Abele, E. (2012). Developing Competencies for Continuous Improvement
Processes on the Shop Floor through Learning Factories–Conceptual Design and
Empirical Validation. Procedia CIRP, 3, 638–643.
Calvo-Mora, A., Ruiz-Moreno, C., Picón-Berjoyo, A., & Cauzo-Bottala, L. (2014).
Mediation effect of TQM technical factors in excellence management systems.
Journal of Business Research, 67(5), 769–774.
Camisón, C., & Villar-López, A. (2014). Organizational innovation as an enabler of
technological innovation capabilities and firm performance. Journal of Business
Research, 67(1), 2891–2902.
154
Capkun, V., Messner, M., & Rissbacher, C. (2012). Service specialization and
operational performance in hospitals. International Journal of Operations and
Production Management, 32(4), 468–495.
Castillo, J.J. (2009). Population Sampling Techniques. Retrieved 05 Feb. 2012 from
Experiment Resources: http://www.experiment-resources.com
/populationsampling. Html
Catalin, S. H., Bogdan, B., & Dimitrie, G. R. (2014). The existing barriers in
implementing total quality management. Annals of the University of Oradea,
Economic Science Series, 23(1), 1–8.
Cathy, R. (2005). Using Quality Management as a Bridge to Environmental
Sustainability in Organizations. Advanced Management Journal, 4(70), 54.
Chang, H. H., Wong, K. H., & Fang, P. W. (2014). The effects of customer relationship
management relational information processes on customer-based performance.
Decision Support Systems, 66, 146–159.
Chen, C. X., Martin, M., & Merchant, K. a. (2014). The effect of measurement timing on
the information content of customer satisfaction measures. Management Accounting
Research, 25(3), 187–205.
Chen, S.-H. (2013). Integrated analysis of the performance of TQM tools and techniques:
a case study in the Taiwanese motor industry. International Journal of Production
Research, 51(4), 1072–1083.
155
Cheong Cheng, Y. (2003). Quality assurance in education: internal, interface, and future.
Quality Assurance in Education, 11(4), 202–213.
Chervinski, A. (2014). Ecological Evaluation of Economic Evaluation of Environmental
Quality. Procedia Economics and Finance, 8(14), 150–156.
Chin, W. W. (1998). The Partial Least Squares Approach for Structural Equation
Modeling. In GA Marcoulides (ed.), Modern Methods for Business Research, pp.
295–336. Lawrence Erlbaum Associates, London.
Choi, T. (1995). Conceptualizing continuous improvement: Implications for
organizational change. Omega, 23(6), 607–624.
Chong, V. K., & Rundus, M. J. (2004). Total quality management, market competition
and organizational performance. The British Accounting Review, 36(2), 155–172.
Chow, W.S., & Chan, L.S. (2008). Social network, social trust and shared goals in
organizational knowledge sharing. Information & Management, 45(7), 458-465.
Christofi, Petros, Sisaye, S., & Bodnar., G. (2008). The integration of total quality
management into sustainability. Internal Auditing-Boston-Warren Gorham and
Lamont Incorporated, 23(1), 33–39.
Chung, Y., Tsai, C., & Hsu, Y. (2005). Research on the operational performance of ISO
14000 Certified Taiwan’s anufacturers. Asian Journal on Quality, 6(1), 24–34.
156
Coakes, S. J. & Steed, L. G. (2003). SPSS: analysis without anguish: version 11.0 for
Windows. Brisbane: Jacaranda Wiley.
Cohen, J. (1988). Statistical power analysis for the behavioral sciences (2nd ed.).
Hillsdale, NJ: Lawrence Erlbaum.
Compeau, D., Higgins, C.A., & Huff, S. (1999). Social Cognitive Theory and individual
Reactions to Computing Technology - A Longitudinal-Study. MIS quarterly,
23(2), 145-158.
Community-based Natural Resource Management Facility, (2008). Funded by Danida
Funded programme. MENGO-Support Unit, Petaling Jaya, Selangor, Malaysia.
Corredor, P., & Goñi, S. (2011). TQM and performance: Is the relationship so obvious?
Journal of Business Research, 64(8), 830–838.
Creswell, John W. Research Design: Qualitative, Quantitative, and Mixed Methods
Approaches. 3rd Edition. Los Angeles: Sage Publications, Inc., 2009.
Crilley, G., & Sharp, C. (2006). Managerial qualities and operational performance: a
proposed model. Measuring Business Excellence, 10(2), 4–18.
Crosby, P. B. (1979). Quality is Free: The Art of Making Quality Certain. New York:
Hodder & Stoughton.
Cukier, W., Barkel, E., Vaughan, T., & Gekas, G. (2012). Quality assurance in Canadian
police services. The TQM Journal, 24(4), 295–309.
157
Daily, B. F., & Huang, S. (2001). Achieving sustainability through attention to human
resource factors in environmental management. International Journal of Operations
& Production Management, 2(12), 1539–1552.
Dam, L., & Petkova, B. N. (2014). The impact of environmental supply chain
sustainability programs on shareholder wealth. International Journal of Operations
& Production Management, 34(5), 586–609.
Dean, J.W., & Bowen, D.E. (1994). Management theory and total quality: improving
research and practice through theory development. The Academy of Management
Journal, 19(3), 392-418.
Deming, W. E. (1986). Out of the Crisis, MIT Center for Advanced Engineering Study.
Massachusetts Institute of Technology, Cambridge, MA.
Demirbag, M., Koh, S. C. L., Tatoglu, E., & Zaim, S.(2006). TQM and market
orientation‘s impact on SMEs‘ performance. Industrial Management & Data
System, 106(8), 1206-1228.
Dess, G. G., Lumpkin, G. T., & McGee, J. E. (1999). Linking Corporate
Entrepreneurship to Strategy, Structure, and Process: Suggested Research
Directions. Entrepreneurship Theory and Practice, 24(1), 85-102.
Doty, D. H., Glick, W. H., & Huber, G. P. (1993). Fit, equifinality, and organizational
effectiveness: a test of configurational theory. Academy of Management Journal,
36(6), 1196–1250.
158
Draghici, A., Popescu, A.-D., & Gogan, L. M. (2014). A Proposed Model for Monitoring
Organizational Performance. Procedia - Social and Behavioral Sciences, 124(0),
544–551.
Duncan, R. B. (1972). Characteristics of organizational environments and perceived
environmental uncertainty. Administrative Science Quarterly, 17(3), 313-327.
Duran, C., Çetindere, A., & Şahan, Ö. (2014). An Analysis on the Relationship Between
Total Quality Management Practices and Knowledge Management: The Case of
Eskişehir. Procedia - Social and Behavioral Sciences, 109, 65–77.
Dutta, S. K., Lawson, R. a., & Marcinko, D. J. (2013). Alignment of performance
measurement to sustainability objectives: A variance-based framework. Journal of
Accounting and Public Policy, 32(6), 456–474.
Ehikioya, B. I. (2009). Corporate governance structure and firm performance in
developing economies: evidence from Nigeria. Corporate Governance: The
International Journal of Business in Society, 9(3), 231–243.
Ellis, C., & Castle, K. (2010). Teacher research as continuous process improvement.
Quality Assurance in Education, 18(4), 271–285.
Endrikat, J., Guenther, E., & Hoppe, H. (2014). Making sense of conflicting empirical
findings: A meta-analytic review of the relationship between corporate
environmental and financial performance. European Management Journal, 32(5),
735–751.
159
Epstein, M. J., Buhovac, A. R., & Yuthas, K. (2012). Managing Social, Environmental
and Financial Performance Simultaneously. Long Range Planning, 1–11.
Eren, S. S., Eren, M. Ş., Ayas, N., & Hacioglu, G. (2013). The Effect of Service
Orientation on Financial Performance: The Mediating Role of Job Satisfaction and
Customer Satisfaction. Procedia - Social and Behavioral Sciences, 99, 665–672.
Eriksson, H., & Hansson, J. (2003). The impact of TQM on financial performance.
Measuring Business Excellence, 7(1), 36–50.
Fargnoli, M., De Minicis, M., & Tronci, M. (2014). Design Management for
Sustainability: An integrated approach for the development of sustainable products.
Journal of Engineering and Technology Management, 34, 29–45.
Farinda, A. G., Kamarulzaman, Y., Abdullah, A., & Ahmad, S. Z. (2009). Building
Business Networking : A Proposed Framework for Malaysian SMEs. International
Review of Business Research Papers, 5(March), 151–160.
Fatima, J., & Razzaque, M. (2013). Roles of customer involvement in rapport and
satisfaction. Asia Pacific Journal of Marketing and Logistics, 25(3), 452–471.
Fawcett, S. E., Smith, S. R., & Cooper, M. B. (1997). Strategic intent , measurement
capability , and operational success : making the connection. International Journal
of Physical Distribution and Logistics Management, 27(7), 410–421.
Feng, T., Li, T., Sun, L., & Wang, D. (2013). External involvement and operational
performance. Chinese Management Studies, 7(3), 488–507.
160
Filip, A. (2013). Complaint Management: A Customer Satisfaction Learning Process.
Procedia - Social and Behavioral Sciences, 93, 271–275.
Flynn, B.B., Schroeder, R.C. & Sakakibara, S. (1994). A framework for quality
management research and an associated measurement instrument. Journal of
Operations Management, 11, 339-405.
FMM Directory (2005/06), Member Directory, Federation of Malaysian Manufacturers,
Selangor
Fok, L. Y., Fok, W. M., & Hartman, S. J. (2001). Exploring the relationship between total
quality management and information systems development. Information &
Management, 38(6), 355–371.
Fornell, C., & Cha, J. (1994). Partial least squares. Advanced methods of marketing
research, 407, 52-78.
Fornell, C. & Larcker, D. F. (1981). Evaluating structural equation models with
unobservable variables and measurement error. Journal of Marketing Research,
18(1), 39-50.
Forza, C., Salvador, F., & Trentin, A. (2008). Form postponement effects on operational
performance: a typological theory. International Journal of Operations and
Production Management, 28(11), 1067–1094.
Fotopoulos, C. V., & Psomas, E. L. (2010). The structural relationships between TQM
factors and organizational performance. The TQM Journal, 22(5), 539–552.
161
Fox, J. (2006).Structural Equation Modeling with the SEM Package in R. Structural
Equation Modeling, 13(3), 465–486.
Frances, J., Boer, H., & Gertsen, F. (2003). Jump starting continuous improvement
through self assessment. International Journal of Operations & Production
Management, 23(10), 1260–1278.
Gadenne, D., Mia, L., Sands, J., Winata, L., & Hooi, G. (2012). The influence of
sustainability performance management practices on organizational sustainability
performance. Journal of Accounting & Organizational Change, 8(2), 210–235.
Ganiyu, R. A., Uche, I. I., & Elizabeth, A. O. (2012). The building blocks of total quality
management: processes, people, performance measurement, and management
systems. Interdisciplinary Journal Of Contemporary Research In Business, 4(7),
629-640.
García-Morales, V. J., Jiménez-Barrionuevo, M. M., & Gutiérrez-Gutiérrez, L. (2012).
Transformational leadership influence on organizational performance through
organizational learning and innovation. Journal of Business Research, 65(7), 1040–
1050.
Geisser, S. (1975). A predictive approach to the random effect model. Biometrika, 61(1),
101- 107.
162
George, O. (2008). Elusive search for quality education: The case of quality assurance
and teacher accountability. International Journal of Educational Management,
22(5), 417–431.
Glover, J. L., Champion, D., Daniels, K. J., & Dainty, a. J. D. (2014). An Institutional
Theory perspective on sustainable practices across the dairy supply chain.
International Journal of Production Economics, 152, 102–111.
Goh, S., Elliott, C., & Quon, E. (2012). The relationship between learning capability and
organizational performance: A meta- analytic examination. The Learning
Organization, 19(2), 92–108.
Gomez, F. G., & Manzanares, M. D., (2007) . Knowledge management strategies ,
innovation and firm performance . An empirical study.
Gond, J.-P., Grubnic, S., Herzig, C., & Moon, J. (2012). Configuring management
control systems: Theorizing the integration of strategy and sustainability.
Management Accounting Research, 23(3), 205–223.
Gonzalez-Padron, T., Akdeniz, M. B., & Calantone, R. J. (2014). Benchmarking sales
staffing efficiency in dealerships using extended data envelopment analysis. Journal
of Business Research, 67(9), 1904–1911.
Goosen, M. F. a. (2012). Environmental management and sustainable development.
Procedia Engineering, 33, 6–13.
163
Götz, O., Liehr-Gobbers, K., & Krafft, M. (2011). Evaluation of structural equation
models using the partial least squares (PLS) approach. Handbook of Partial Least
Squares: Concepts, Methods and Applications, 691-711.
Grant, R.M., Shani, R. & Krishnan, R. (1994). TQM‘s challenge to management theory
and Practice. Sloan Management Review, 25-35.
Green, K. W., Zelbst, P. J., Bhadauria, V. S., & Meacham, J. (2012). Do environmental
collaboration and monitoring enhance organizational performance? Industrial
Management & Data Systems, 112(2), 186–205.
Gursoy, D., & Swanger, N. (2007). Performance-enhancing internal strategic factors and
competencies: Impacts on financial success. International Journal of Hospitality
Management, 26(1), 213–227.
Gupta, C. (2006). Human Resource Management (Rev. edition, ed.). New Delhi: Sultan
Chand & Sons.
Haar, J. M., & Spell, C. S. (2008). Predicting total quality management adoption in New
Zealand. Journal of Enterprise Information Management, 21(2), 162–178.
Hair, J. F., Anderson, R. E., Tatham, R. L. & Black, W. C. (2010). Multivariate Data
Analysis. Seventh Edition. Prentice Hall. New Jesey.
Hair, J. F., Black, W. C., Babin, B. J., Andersen, R. E., & Tatham, R. (2006).
Mutilvariate data analysis (6th ed.). Upper Saddle River, N J: Pearson Prentice
Hall.
164
Hair, J. F., Money, A. H., Samouel, P., & Page, M. (2007). Research methods for
business. WestSussex: John Wiley & Sons Ltd.
Harlow, H. (2008). The effect of tacit knowledge on firm performance. Journal of
Knowledge Management, 12(1), 148–163.
HassabElnaby, H. R., Hwang, W., & Vonderembse, M. A. (2012). The impact of ERP
implementation on organizational capabilities and firm performance.
Benchmarking: An International Journal, 19(4/5), 618-633.
Hasan, Nordin, A.A. Hear and Mohd, (2006). The evolution of environmental policy in
Malaysia. Natural Resources Forum 30 (2006) 37–50).
Hede, S., Nunes, M. J. L., Ferreira, P. F. V., & Rocha, L. A. (2013). Incorporating
sustainability in decision-making for medical device development. Technology in
Society, 35(4), 276–293.
Hempel, C. Lamont, (2009). Environmental Governance: the Global Challenge, (USA:
Washington.D.C 2009, ISBN: 1-55963-447-2).
Hirsh, J. B. (2014). Environmental sustainability and national personality. Journal of
Environmental Psychology, 38, 233–240.
Ho, S. K. M. (2010). Integrated lean TQM model for global sustainability and
competitiveness. The TQM Journal, 22(2), 143–158.
165
Hoque, Z. (2003). Total Quality Management and the Balanced Scorecard Approach: a
Critical Analysis of Their Potential Relationships and Directions for Research.
Critical Perspectives on Accounting, 14(5), 553–566.
Hua, N., & Lee, S. (2014). Benchmarking firm capabilities for sustained financial
performance in the U.S. restaurant industry. International Journal of Hospitality
Management, 36, 137–144.
Huang, Y.-S., & Lin, B. M. T. (2002). An empirical investigation of total quality
management: a Taiwanese case. The TQM Magazine, 14(3), 172–180.
Hung, R. Y. Y., Lien, B. Y.-H., Yang, B., Wu, C.-M., & Kuo, Y.-M. (2011). Impact of
TQM and organizational learning on innovation performance in the high-tech
industry. International Business Review, 20(2), 213–225.
Hunton, J. E., Lippincott, B., & Reck, J. L. (2003). Enterprise resource planning systems:
comparing firm performance of adopters and nonadopters. International Journal of
Accounting Information Systems, 4(3), 165–184.
Intra, C., & Zahn, T. (2014). Transformation-waves – A Brick for a Powerful and
Holistic Continuous Improvement Process of a Lean Production System. Procedia
CIRP, 17, 582–587.
Irani, Z., Beskese, a., & Love, P. E. D. (2004). Total quality management and corporate
culture: constructs of organisational excellence. Technovation, 24(8), 643–650.
166
Irwin, J. G., Hoffman, J. J., & Lamont, B. T. (1998). The effect of the acquisition of
technological innovations on organizational performance: A resource-based view.
Journal of Engineering and Technology Management, 15(1), 25–54.
Isaksson, R. (2006). Total quality management for sustainable development. Business
Process Management Journal, 12(5), 632–645.
ISO 9000. (2008). Quality management principles International Standards for Business,
Government and Society: International Organization for Standardization (ISO),
Geneva.
Izvercian, M., Radu, A., Ivascu, L., & Ardelean, B.-O. (2014). The Impact of Human
Resources and Total Quality Management on the Enterprise. Procedia - Social and
Behavioral Sciences, 124, 27–33.
Jabnoun, N. (2002). Control processes for total quality management and quality
assurance. Work Study, 51(4), 182–190.
Jayaram, J., Ahire, S., Nicolae, M., & Ataseven, C. (2012). The moderating influence of
product orientation on coordination mechanisms in total quality management.
International Journal of Quality & Reliability Management, 29(5), 531–559.
Jeon, H., & Choi, B. (2012). The relationship between employee satisfaction and
customer satisfaction. Journal of Services Marketing, 26(5), 332–341.
John, A., & Ngoasong, L. (2008). Budgetary and Management Control Process in a
Manufacturing : Case of Guinness Nigerian PLC .
167
Jonsdottir, S., Ingason, H. T., & Jonasson, H. I. (2014). Continuous Improvement
Projects in Certified Organizations in Iceland: Traditional Projects or not? Procedia
- Social and Behavioral Sciences, 119, 142–151.
Jung, H. S., & Yoon, H. H. (2013). Do employees’ satisfied customers respond with an
satisfactory relationship? The effects of employees’ satisfaction on customers’
satisfaction and loyalty in a family restaurant. International Journal of Hospitality
Management, 34, 1–8.
Jung, J., & Wang, Y. (2006). Relationship between total quality management (TQM) and
continuous improvement of international project management (CIIPM).
Technovation, 26(5-6), 716–722.
Juran, J. M. (1988). Juran’s quality control handbook (4 ed.). New York: McGraw-Hill.
Kahreh, Z. S., Shirmohammadi, A., & Kahreh, M. S. (2014). Explanatory Study Towards
Analysis the Relationship between Total Quality Management and Knowledge
Management. Procedia - Social and Behavioral Sciences, 109, 600–604.
Kanghwa, C. (2010). From operational efficiency to financial efficiency. Asian Journal
on Quality, 11(2), 137–145.
Kannan, V., & Tan, K. (2005). Just in time, total quality management, and supply chain
management: understanding their linkages and impact on business performance.
Omega, 33(2), 153–162.
168
Karapetrovic, S., & Willborn, W. (2000). Quality assurance and effectiveness of Audit
systems. International Journal of Quality & Reliability Management, 17(6), 679–
703.
Kaur, M., Singh, K., & Ahuja, I. S. (2012). An evaluation of the synergic implementation
of TQM and TPM paradigms on business performance‘, International Journal of
Productivity and Performance Management, 62(1), 66-84.
Khatir, A., & Rezaei-Moghaddam, K. (2014). Analysis of agro industries dissolution:
The case of Fars Industrial Meat Complex in Iran. Journal of the Saudi Society of
Agricultural Sciences, 13(2), 116–129.
Kilic, K., Ulusoy, G., Gunday, G., & Alpkan, L. (2014). Innovativeness, operations
priorities and corporate performance: An analysis based on a taxonomy of
innovativeness. Journal of Engineering and Technology Management, 1–19.
Kim, S., Lee, J., & Yu, K. (2004). Corporate culture and organizational performance.
Journal of Managerial Psychology, 19(4), 340–359.
Kline, R. B. (1998). Principles and Practice of Structural Equation Modeling. New
York: The Guilford Press.
Kokkinakis, E., Kokkinaki, A., Kyriakidis, G., Markaki, A., & Fragkiadakis, G. a. (2011).
HACCP implementation in local food industry: a survey in Crete, Greece. Procedia
Food Science, 1, 1079–1083.
169
Konig, G., Silva, C. A., & Mhlanga, N. (2013). Enabling environments for agribusiness
and agro-industries development (pp. 1–62).
Krechovská, M., & Procházková, P. T. (2014). Sustainability and its Integration into
Corporate Governance Focusing on Corporate Performance Management and
Reporting. Procedia Engineering, 69, 1144–1151.
Krittanathip, V., Rakkarn, S., Cha-um, S., & Jindawattana, A. (2013). Implementation of
Self-assessment Evaluation for Total Quality Management: A Case Study of
Wholesale Sectors. Procedia - Social and Behavioral Sciences, 88, 81–88.
Krittanathip, V., Rakkran, S., Cha-um, S., & Klamdej, I. (2013). Development of
Weighting on Self-assessment Evaluation for Total Quality Management: A Case
Study of Wholesale Sectors. Procedia - Social and Behavioral Sciences, 88, 49–60.
Krosnik, J.A. (1999). Maximizing Questionnaire Quality. In P.R. John, P.R. Shaver, &
L.S.Wrightsman (Eds).San Diego, CA: Academic Press.
Kumar, V., Choisne, F., de Grosbois, D., & Kumar, U. (2009). Impact of TQM on
company’s performance. International Journal of Quality & Reliability
Management, 26(1), 23–37.
Länsiluoto, A., Eklund, T., Back, B., Vanharanta, H., & Visa, A. (2004). Industry‐
specific cycles and companies’ financial performance comparison using self‐
organizing maps. Benchmarking: An International Journal, 11(3), 267–286.
170
Lateh, H., & Ahmad, J. (2011). Landslide issues in Penang , Malaysia : Students ’
environmental knowledge , attitude and practice, 4(4), 65–72.
Lau, A. W. T., & Tang, S. L. (2009). A survey on the advancement of QA (quality
assurance) to TQM (total quality management) for construction contractors in Hong
Kong. International Journal of Quality & Reliability Management, 26(5), 143–158.
Law, D. (2010). Quality assurance in post secondary education: Some common
approaches. Quality Assurance in Education, 18(1), 64–77.
Laxmikumari, Kumar, V., & Ramana, V. (2014). TQM : A Quality and Performance
Enhancer. International Journal of Engineering and Science, 4(8), 91–94.
Lee, C. (2004). The Determinants of Innovation in the Malaysian Manufacturing Sector:
An Econometric Analysis at the Firm Level. Asean Economic Bulletin, 21(3), 319–
329.
Leshinsky, R. (2012). Use of planning agreements to support sustainability and
environmental preservation. International Journal of Law in the Built Environment,
4(2), 157–172.
Lewin, J. E., Biemans, W., & Ulaga, W. (2010). Firm downsizing and satisfaction among
United States and European customers. Journal of Business Research, 63(7), 697–
706.
Lim, F. (2008). Understanding Quality Assurance: a cross country case study. Quality
Assurance in Education, 16(2), 126–140.
171
López‐Rodríguez, S. (2009). Environmental engagement, organizational capability and
firm performance. Corporate Governance: The International Journal of Business in
Society, 9(4), 400–408.
Lovrić, M., Li, T., & Vervest, P. (2013). Sustainable revenue management: A smart card
enabled agent-based modeling approach. Decision Support Systems, 54(4), 1587–
1601.
Madu, C. N., Kuei, C., & Winokur, D. (1995). Environmental Planning Quality A
Strategic Total Quality ( Stqm ) approach management. Futures, 27(8), 839–856.
Malmström, M., Wincent, J., & Johansson, J. (2013). Managing competence acquisition
and financial performance: An empirical study of how small firms use competence
acquisition strategies. Journal of Engineering and Technology Management, 30(4),
327–349.
Mandal, P. (2012). Improving process improvement: executing the analyze and improve
phases of DMAIC better. International Journal of Lean Six Sigma, 3(3), 231–250.
Manorama, T., & Jeevan, V. K. J. (2009). Quality assurance in distance learning libraries.
Quality Assurance in Education, 17(1), 45–60.
Mansour, H., Munir Ahmad, M., Dhafr, N., & Ahmed, H. (2013). Evaluation of
operational performance of workover rigs activities in oilfields. International
Journal of Productivity and Performance Management, 62(2), 204–218.
172
Martin, A., Romero, F., Valle, C., & Dolan, S. (2001). Corporate business strategy, career
management and recruitment: Do Spanish firms adhere to contingency model?
Career Development International, 6(3), 149 - 155.
McAdam, R., & Leonard, D. (2003). Corporate social responsibility in a total quality
management context: opportunities for sustainable growth. Corporate Governance:
The International Journal of Business in Society, 3(4), 36–45.
Mehra, S., & Ranganathan, S. (2008). Implementing total quality management with a
focus on enhancing customer satisfaction. International Journal of Quality &
Reliability Management, 25(9), 913–927.
Menichini, T., & Rosati, F. (2013). A Managerial Tool for Environmental Sustainability.
APCBEE Procedia, 5, 551–556.
Merad, M., Dechy, N., & Marcel, F. (2014). A pragmatic way of achieving Highly
Sustainable Organisation: Governance and organisational learning in action in the
public French sector. Safety Science, 69, 18–28.
Mergenthaler, M., Weinberger, K., & Qaim, M. (2009). Quality assurance programs and
access to international markets: the case of horticultural processors in Vietnam.
Supply Chain Management: An International Journal, 14(5), 359–368.
Militaru, M., Ungureanu, G., & (Creţu), A. Ş. C. (2013). The Prospects of Implementing
the Principles of Total Quality Management (TQM) in Education. Procedia - Social
and Behavioral Sciences, 93, 1138–1141.
173
Miller, J. C., Meyer, A. D., & Nakane, J. (1992). Benchmarking Global Manufacturing.
Irwin, Homewood, IL: Business One.
Minna, S. (2014). Innovation capability for SME success: perspective of financial and
operational performance. Journal of Advances in Management Research, 11(2),
163–175.
Mishra, S., & Mohanty, P. (2014). Corporate governance as a value driver for firm
performance: evidence from India. Corporate Governance: The International
Journal of Business in Society, 14(2), 265–280.
Mitchell, E., Robson, A., & Prabhu, V. B. (2002). The impact of maintenance practices
on operational and business performance. Managerial Auditing Journal, 17(5), 234–
240.
Mohammad, N. (2011). Environmental Law and Policy Practices in Malaysia : An
Empirical Study. Australian Journal of Basic and Applied Sciences, 5(9), 1248–
1260.
Mohammed, A. S. A., Tibek, S. R. H., & Endot, I. (2013). The Principles of Total
Quality Management System in World Islamic Call Society. Procedia - Social and
Behavioral Sciences, 102(Ifee 2012), 325–334.
Mohd Nizam Ab Rahman & James D. T. Tannock. (2005) TQM 'Best Practices:
Experiences of Malaysian SMEs. Total Quality Management & Business
Excellence , 16(4), 491-504.
174
Moldovan, L. (2012). Integration of Strategic Management and Quality Assurance in the
Romanian Higher Education. Procedia - Social and Behavioral Sciences, 58, 1458–
1465.
Moore, T. D., Johnson, A. W., Rehg, M. T., & Hicks, M. J. (2007). Quality assurance
staffing impacts in military aircraft maintenance units. Journal of Quality in
Maintenance Engineering, 13(1), 33–48.
Mouri, G. (2014). An academic goal of socio-ecological sustainability: A comprehensive
review from a millennial-scale perspective. International Journal of Sustainable
Built Environment, 3(1), 47–53.
Naghshbandi, S., Yousefi, B., Zardoshtian, S., & Moharramzade, M. (2012). Assessment
of Military Force Staff’s Readiness for Total Quality Management (TQM) Approval
in Tehran Province. Procedia - Social and Behavioral Sciences, 46, 5345–5349.
Nasrallah, W. F., & Qawasmeh, S. J. (2009). Comparing multi-dimensional contingency
fit to financial performance of organizations. European Journal of Operational
Research, 194(3), 911–921.
Nawaz, M. S., Hassan, M., & Shaukat, S. (2014). Impact of Knowledge Management
Practices on Firm Performance : Testing the Mediation Role of Innovation in the
Manufacturing Sector of Pakistan. Pakistan Journal of Commerce and Social
Sciences, 8(1), 99–111.
175
Nikzad, M., & Maryam, G. (2012). The relationship between open book management and
trust with organization financial performance. Procedia Technology, 1, 340–344.
Ooi, K., Lin, B., Tan, B., & Yee‐Loong Chong, A. (2011). Are TQM practices supporting
customer satisfaction and service quality? Journal of Services Marketing, 25(6),
410–419.
Oppenheim, A.N. (1992).Questionnaire design, interviewing and attitude measurement.
London: Pinter Publishers.
Organ, D. W., Podsakoff, P. M., & MacKenzie, S. B. (2006). Organizational citizenship
behavior: Its nature, antecedents, and consequences. USA: Sage Publications,
Inc.
Osundina, & osundina. (2012). Budgeting Processes and the Performance of Food and
Beverages Manufacturing Companies in Nigeria. International Journal of Economic
Development Research and Investment., 3(3), 61–69.
Padavano, K. R. (2005). Benchmarking: Strategies for gauging operational performance.
Journal of Facilities Management, 3(2), 145–160.
Pan, F. C. (2015). Practical application of importance-performance analysis in
determining critical job satisfaction factors of a tourist hotel. Tourism Management,
46, 84–91.
Parkan, C. (2002). Measuring the operational performance of a public transit company.
International Journal of Operations and Production Management, 22(6), 693–720.
176
Pallant, J. (2005). SPSS survival manual: a step by step guide to data analysis using SPSS
for windows (2nd ed.). Maidenhead: Open University Press.
Parten, M. (1950).Surveys, polls and samples: practical procedures. New York: Harper
and Brothers.
Pavlov, A., & Bourne, M. (2011). Explaining the effects of performance measurement on
performance: An organizational routines perspective. International Journal of
Operations & Production Management, 31(1), 101–122.
Perdomo-Ortiz, J., González-Benito, J., & Galende, J. (2006). Total quality management
as a forerunner of business innovation capability. Technovation, 26(10), 1170–1185.
Poston, R. & Grabski, S. (2001). Financial impacts of enterprise resource planning
implementations. International Journal of Accounting Systems, 2(4), 271-94.
Prajogo, D. I., & Sohal, A. S. (2006). The integration of TQM and technology/R&D
management in determining quality and innovation performance. Omega, 34(3),
296–312.
Prud’homme, B., & Raymond, L. (2013). Sustainable development practices in the
hospitality industry: An empirical study of their impact on customer satisfaction and
intentions. International Journal of Hospitality Management, 34, 116–126.
Psomas, E. L., & Fotopoulos, C. V. (2010). Total quality management practices and
results in food companies. International Journal of Productivity and Performance
Management, 59(7), 668–687.
177
Qi, P., Deng, Z., & Wang, H. (2011). Energy utilization, environmental quality and
sustainable economic development: Evidence from Shandong Province in China.
Energy Procedia, 5, 314–321.
Rad, A. M. (2006). The impact of organizational culture on the successful
implementation of total quality management. The TQM Magazine, 18(6), 606–625.
Rappaport, A., & Flaherty, M. F. (1992). Corporate responses to environmental
challenges: Initiatives by multinational management. New York: Quorum Book.
Rasula, J., Vuksic, V. B., & Indihar, M. (2012). The Impact of Knowlegde Mnagement
on Organizational performance. Economic and Business Review, 14(2), 147–168.
Rebelo, manuel ferreira, Santos, G., & Silva, R. (2014). A generic model for integration
of quality, environment and safety management systems. The Learning
Organization, 26(2), 143–159.
Robert, M.G., Floyd, J. F.Jr., Mick, P., Couper, J.M., Lepkowski, E.S., Roger,T. (2009).
Survey methodology. 2nd Edit. New York: Wiley
Rodrigue, M., Magnan, M., & Boulianne, E. (2013). Stakeholders’ influence on
environmental strategy and performance indicators: A managerial perspective.
Management Accounting Research, 24(4), 301–316.
Rose, K. (2014). Adopting Industrial Organizational Psychology for Eco Sustainability.
Procedia Environmental Sciences, 20, 533–542.
178
Rungtusanatham, M., Ogden, J. a., & Wu, B. (2003). Advancing theory development in
total quality management. International Journal of Operations & Production
Management, 23(8), 918–936.
Saeidi, S. P., Sofian, S., Saeidi, P., Saeidi, S. P., & Saaeidi, S. A. (2014). How does
corporate social responsibility contribute to firm financial performance? The
mediating role of competitive advantage, reputation, and customer satisfaction.
Journal of Business Research.
Sahai, S., & Srivastava, a. K. (2012). Goal / target Setting and Performance Assessment
as Tool for Talent Management. Procedia - Social and Behavioral Sciences, 37,
241–246.
Sallis, E. (2002). Total Quality Management in Education (p. 24). Abingdon, UK: Taylor
& Francis.
Sangodoyin, A., & Iipadeola, S. (2000). Hazardous wastes: Assesing the efficacy of
structures and approaches to management in Nigeria. Environmental Management
and Health, 11(1), 39–46.
Santos-Reyes, D., & Lawlor-Wright, T. (2001). A design for the environment
methodology to support an environmental management system. Integrated
Manufacturing System, 12(5), 323–332.
Sarah, A.G.A. Aziz, (2002). The ‘Science, Law and Conservation of Natural Resources:
Some Issues’ Proceedings of the Regional Symposium on Environment and
179
Natural Resources 10-11th April 2002, Hotel Renaissance Kuala Lumpur,
Malaysia, 1: 342-348.
Sarkis, J. (2001). Manufacturing’s role in corporate environmental sustainability ‐
Concerns for the new millennium. International Journal of Operations and
Production Management, 21(5/6), 666–686.
Seip, B., Frich, J. C., & Hoff, G. (2012). Doctors’ experiences with a quality assurance
programme. Clinical Governance: An International Journal, 17(4), 297–306.
Setyadi, H., & Anggayana, K. (2013). Database Management and Quality Assurance is
Key of Success in Exploration. Procedia Earth and Planetary Science, 6, 42–49.
Seuring, S. (2013). A review of modeling approaches for sustainable supply chain
management. Decision Support Systems, 54(4), 1513–1520.
Sharma, U., Lawrence, S., & Lowe, A. (2010). Institutional contradiction and
management control innovation: A field study of total quality management practices
in a privatized telecommunication company. Management Accounting Research,
21(4), 251–264.
Shatat, A. S. & Udin, Z. M. (2012). The relationship between ERP system and supply
chain management performance in Malaysian manufacturing companies. Journal
of Enterprise Information Management, 25(6), 576 – 604.
180
Shaverdi, M., Heshmati, M. R., & Ramezani, I. (2014). Application of Fuzzy AHP
Approach for Financial Performance Evaluation of Iranian Petrochemical Sector.
Procedia Computer Science, 31(Itqm), 995–1004.
Shiba, S., Graham, A. & Walden, D. (1993). A New American TQM, Productivity Press,
Portland, OR.
Siddiqui, F., Haleem, A., & Wadhwa, S. (2009). Role of Supply Chain Management in
Context of Total Quality Management in Flexible Systems : A State-of the-Art
Literature Review. Global Journal of Flexible Systems Mnagement, 10(3), 1–14.
Sillanpää, V. (2011). Performance measurement in welfare services: a survey of Finnish
organisations. Measuring Business Excellence, 15(4), 62–70.
Sisaye, S., Bodnar, G., & Christofi, P. (2005). Tqm And Sustain : Insights From
Environmental Resources Management. Internal Auditing-Boston-Warren Gorham
and Lamont Incorporated, 20(4), 27–32.
Sohal, A. S., & Terziovski, M. (2000). TQM in Australian manufacturing: Factors critical
to success. International Journal of Quality & Reliability Management, 17(2),
158-167.
Sohail, S., & Hoong, T. (2003). TQM practices and organizational performances of
SMEs in Malaysia. Benchmarking: An International Journal, 10(1), 37–53.
Spencer, S. Y., Adams, C., & Yapa, P. W. S. (2013). The mediating effects of the
adoption of an environmental information system on top management’s commitment
181
and environmental performance. Sustainability Accounting, Management and Policy
Journal, 4(1), 75–102.
Sridhar, M.S. (2009, March 22).Research Methodology: Analysis, interpretation and
drawing inferences.
Stainer, A., & Stainer, L. (1997). Ethical dimensions of environmental management.
European Business Review, 97(5), 224–230.
Stanciu, A.-C., Constandache, M., & Condrea, E. (2014). Concerns about the Sustainable
Performance of Firm in the Context of Quality Management Systems
Implementation. Procedia - Social and Behavioral Sciences, 131, 340–344.
Staughton, R., & Johnston, R. (2005). Operational performance gaps in business
relationships. International Journal of Operations and Production Management,
25(4), 320–332.
Stone, M. (1975). Cross-validatory choice and assessment of statistical predictions.
Journal of the Royal Statistical Society, 36, 111–133.
Su, J., & Sun, Y. (2011). Informal finance, trade credit and private firm performance.
Nankai Business Review International, 2(4), 383–400.
Suárez‐Barraza, M. F., Ramis‐Pujol, J., & Tort‐Martorell Llabrés, X. (2009). Continuous
process improvement in Spanish local government. International Journal of Quality
and Service Sciences, 1(1), 96–112.
182
Sun, H., & Cheng, T. (2002). Comparing Reasons, Practices and Effects of ISO 9000
Certification and TQM Implementation in Norwegian SMEs and Large Firms.
International Small Business Journal, 20(4), 421–442.
Sun, K.-A., & Kim, D.-Y. (2013). Does customer satisfaction increase firm performance?
An application of American Customer Satisfaction Index (ACSI). International
Journal of Hospitality Management, 35, 68–77.
Svensson, G., & Wood, G. (2005). Business ethics in TQM. The TQM Magazine, 17(1),
19–34.
Talib, F., Rahman, Z., & Qureshi, M. N. (2013). An empirical investigation of
relationship between total quality management practices and quality performance
in Indian service companies. International Journal of Quality & Reliability
Management , 30(3), 280-318.
Tannock, J., Krasachol, L., & Ruangpermpool, S. (2002). The development of total
quality management in Thai manufacturing SMEs. International Journal of Quality
& Reliability Management, 19(4), 380–395.
Tarí, J. J. (2005). Components of successful total quality management. The TQM
Magazine, 17(2), 182–194.
Tarí, J. J., Claver-Cortés, E., Pereira-Moliner, J., & Molina-Azorín, J. F. (2010). Levels
of quality and environmental management in the hotel industry: Their joint influence
183
on firm performance. International Journal of Hospitality Management, 29(3), 500–
510.
Temtime, Z. T. (2003). The moderating impacts of business planning and firm size on
total quality management practices. The TQM Magazine, 15(1), 52–60.
Tenenhaus, M., Vinzi, V.E., Chatelin, Y.M., & Lauro, C. (2005). PLS path modeling.
Computational Statistics & Data Analysis, 48(1), 159-205.
Timothy, M. (2008). Standards to assure quality in tertiary education: the case of
Tanzania. Quality Assurance in Education, 16(2), 164–180.
Todorut, A. V. (2012). Sustainable Development of Organizations through Total Quality
Management. Procedia - Social and Behavioral Sciences, 62, 927–931.
Töremen, F., Karakuş, M., & Yasan, T. (2009). Total quality management practices in
Turkish primary schools. Quality Assurance in Education, 17(1), 30–44.
Tran, H., Cahoon, S., & Chen, S.-L. (2011). A Quality Management Framework for
Seaports in their Supply Chains in the 21st Century. The Asian Journal of Shipping
and Logistics, 27(3), 363–386.
Turker, D., & Altuntas, C. (2014). Sustainable supply chain management in the fast
fashion industry: An analysis of corporate reports. European Management Journal,
32(5), 837–849.
184
Tvorik, M. H. M. J., Tvorik, S. J., & Mcgivern, M. H. (1997). Determinants of
organizational performance. Management Decision, 35(6), 417–435.
Ujunwa, A. (2012). Board characteristics and the financial performance of Nigerian
quoted firms. Corporate Governance: The International Journal of Business in
Society, 12(5), 656–674.
United Nations, (2000). Voluntary initiatives: Current status, lessons learned and next
steps. Discussion paper, UNEP Multi-Stakeholder Workshop on Voluntary
Initiatives, Paris, September 20.
Valmohammadi, C. (2011). The impact of TQM implementation on the organizational
performance of Iranian manufacturing SMEs. The TQM Journal, 23(5), 496–509.
Vatalis, K. I., Manoliadis, O. G., & Mavridis, D. G. (2012). Project Performance
Indicators as an Innovative Tool for Identifying Sustainability Perspectives in Green
Public Procurement. Procedia Economics and Finance, 1(12), 401–410.
Vijver, V. De, & Laurens. (2008). In the beverage industry , sustainability matters on the
outside , too. Beverage Industry, 99(8), 2008.
Vouzas, F., & Psychogios, A. G. (2007). Assessing Managers ’ Awareness of Total
Quality Management. The TQM Magazine, 19(1), 62–75.
Vural, Y., Vardarlier, P., & Aykir, A. (2012). The Effects of Using Talent Management
With Performance Evaluation System Over Employee Commitment. Procedia -
Social and Behavioral Sciences, 58, 340–349.
185
Walsh, A., Hughes, H., & Maddox, D. P. (2002). Total quality management continuous
improvement: is the philosophy a reality? Journal of European Industrial Training,
26(6), 299–307.
Wang, C.-H., Chen, K.-Y., & Chen, S.-C. (2012). Total quality management, market
orientation and hotel performance: The moderating effects of external environmental
factors. International Journal of Hospitality Management, 31(1), 119–129.
Warwick, D.P. & Lininger, C.A. (1975).The sample survey: theory and practice. New
York: Mc Graw-Hill
Wei, Z., Zhao, J., & Zhang, C. (2014). Organizational ambidexterity, market orientation,
and firm performance. Journal of Engineering and Technology Management, 33,
134–153.
Weill, P. (1992). The Relationship Between Investment in Information Technology and
Firm Performance: A Study of the Valve Manufacturing Sector. Information
Systems Research, 3(4), 307-333.
Wetzels, M., Odekerken-Schroder, G., & Van Oppen, C. (2009). Using PLS path
modeling for assessing hierarchical construct models: Guidelines and empirical
illustration. Mis Quarterly, 33(1), 177.
Williams, O., Babatunde, A., & Jeleel, S. (2012). The impact of sales promotion on
organization effectiveness in Nigerian manufacturing industry. Universal Journal of
Marketing and Business Research, 1(4), 123–131.
186
Wiklund, J., & Shepherd, D. (2005). Knowledge-based resources, entrepreneurial
orientation, and the performance of small and medium-sized businesses. Strategic
Management Journal, 24(13).
Wold, H. (1985). Partial least squares. In S. Kotz & N. L. Johnson (Eds.), Encyclopedia
of statistical sciences (Vol. 6, pp. 581-591). New York, N.Y.: Wiley.
Wu, I.-L., & Chiu, M.-L. (2014). Organizational applications of IT innovation and firm’s
competitive performance: A resource-based view and the innovation diffusion
approach. Journal of Engineering and Technology Management.
Yesil, S., & Kaya, A. (2013). The Effect of Organizational Culture on Firm Financial
Performance: Evidence from a Developing Country. Procedia - Social and
Behavioral Sciences, 81, 428–437.
Young, P.V. (1939). Scientific social survey and research. New York: Prentice-Hall.
Yu, W., Chavez, R., Feng, M., & Wiengarten, F. (2014). Integrated green supply chain
management and operational performance. Supply Chain Management: An
International Journal, 19(5/6), 683–696.
Yusoff, H., Mohamad, S. S., & Darus, F. (2013). The Influence of CSR Disclosure
Structure on Corporate Financial Performance: Evidence from Stakeholders’
Perspectives. Procedia Economics and Finance, 7, 213–220.
187
Zárraga-Rodríguez, M., & Álvarez, M. J. (2014). Does the EFQM Model Identify and
Reinforce Information Capability? Procedia - Social and Behavioral Sciences, 109,
716–721.
Zdanytė, K., Neverauskas, B., & Sabaliauskaitė, E. (2014). Implementation of
Sustainable Development Opportunities in the Lithuanian Higher Education
Institution. Procedia - Social and Behavioral Sciences, 110, 482–493.
Zikmund, W. G., Babin, B. J., Carr, J. C., & Griffin, M. (2010). Business research
methods (8th Ed.). Canada: Nelson Education, Ltd.
Zink, K. J. (2007). From total quality management to corporate sustainability based on a
stakeholder management. Journal of Management History, 13(4), 394–401.
Zink, K. J. (2014). Designing sustainable work systems: the need for a systems approach.
Applied Ergonomics, 45(1), 126–32.
188
Appendix A
SURVEY QUESTIONNAIRE
Borang Kaji Selidik
The Moderating Effect of Environmental Regulation and Policy on the Relationship
between Total Quality Management (TQM) and Organizational Performance in the
Malaysian Food and Beverage Companies
Kesan sampingan (moderating) polisi dan peraturan persekitaran terhadap hubungan
antara keseluruhan kualiti pengurusan (kkp) serta prestasi organisasi dalam syarikat
makanan dan minuman di Malaysia
This survey is to investigate the moderating effect of environmental regulation
and policy on the relationship between Total Quality Management (TQM) and
Organizational Performance in the Malaysian Food and Beverage Companies. The TQM
investigated by this study are continuous process improvement and quality assurance.
Responses to the items posed in this inquiry are graded by a five-point interval scale. We
humbly request for your sincere and objective responses. Your responses are promised to
be treated with confidentiality and shall be exclusively used for the purpose of this
research.
Kajian ini bertujuan untuk mengkaji kesan sampingan polisi dan peraturan persekitaran
terhadap hubungan antara keseluruhan kualiti pengurusan (kkp) serta prestasi
organisasi dalam syarikat makanan dan minuman di Malaysia. Tinjauan KKP dalam
kajian merupakan proses pembaikpulihan berterusan selain jaminan kualiti. Tindak
balas terhadap item-item diklasifikasikan mengikut lima skala-likert. Kami dengan
merendah hati dan jiwa mengharapkan jawapan yang jujur daipada anda. Tindak balas
189
anda dijanji akan dirahsiakan dan akan digunakan sewajar-wajarnya bagi tujuan kajian
ini.
This questionnaire comprises five sections. The first section asks with questions
about the respondent’s demographic details, and the second section contains items
measuring organizational performance. Section three and four respectively contain items
measuring continuous process improvement and quality assurance. Finally, the last
section contains items measuring environmental regulation and policy.
Kaji selidik ini mengandungi lima bahagian. Bahagian pertama lebih melihat maklumat
demografik subjek dan bahagian kedua meninjau item-item yang menilai prestasi
organisasi. Manakala bahagian tiga dan empat meninjauan proses pembai-pulihan yang
berterusan dan jaminan kualiti . Akhir sekali, bahagian terakhir menilai polisi dan
peraturan persekitaran.
Thank you for your assistance.
Ribuan terima kasih di ucapkan atas segala kerjasama dan bantuan yang dihulurkan.
For further inquiry, you can contact my research supervisor with the following contact:
Bagi rujukan seterusnya, anda boleh menghubungi penyelia kajian saya seperti di bawah:
Dr. Ahmad Yusni bin Bahaudin(Supervisor/Penyelia)
School of Technology, Management and Logistics
Sekolah Teknologi, Pengurusan dan Logistik
Universiti Utara Malaysia
0194417678 Muslim Diekola Akanmu(Student/Pelajar)
Master Research Candidate Pelajar Sarjana(Program Kajian) School of Technology Management and Logistics Sekolah Teknologi, Pengurusan dan Logistik
Universiti Utara Malaysia Email: [email protected]
190
Section I: Demographic Details/Maklumat Demografik
1. Your Job Position/Taraf Pekerjaan
2. Gender 3.Age/Umur
Male/Lelaki Between/Di antara 18 and 34
Female/Perempuan Between/Di antara 35 and 44
Between/Di antara 45 and 60
4. Years of Experiences/Pengalaman Bekerja:
i. ( ) Below 3 years/dibawah 3 Tahun ii. ( ) 4-6 years/Tahun
iii. ( ) 7-9 years/Tahun iv. ( ) Above 10 years/Tahun
5. Qualifications/Kelayakan
Postgraduate Degree/Sarjana First Degree/Sarjana Muda
Secondary School Certificate/Sekolah Menengah
Primary School Certificate/Sekolah Rendah
Certification Held/tiada sijil
Section II: On the following scale, please indicate the appropriate number which best
reflect your perception
Sila tandakan refleksi terbaik anda pada salah satu skala
(1)
Strongly
disagree/sangat
tidak setuju
SD
(2)
Disagree/tidak
setuju
D
(3)
Neutral/neutral
N
(4)
Agree/setuju
A
(5)
Strongly
Agree/sangat
setuju
SA
Part/ bahagian I: Organizational Performance / prestasi organisasi
Please indicate your response to the following statements according to the scale above.
Sila tandakan jawapan anda mengikut skala yang disediakan
During the last three years, my organization SD D N A SA
191
achieved…
Pencapaian organisasi dalam masa 3tahun
kebelakangan ini
1 2 3 4 5
Sales growth/ Strategi perancangan
OP01 Significance increase on return on asset
Peningkatan signifikan ke atas pemulangan aset
OP02 Significance increase on return on capital investment
Peningkatan signifikan ke atas pemulangan modal
OP03 Our shareholders are always satisfied on their annual
dividends
Pemegang saham kami selalu berpuas hati dengan
dividen tahunan
OP04 Significance increase in the number of shareholders
Peningkatan signifikan dalam bilangan pemegang
saham
OP05 Significance increase in the number of sales of our
products
Peningkatan signifikan dalam jualan produk kami
Inventory management system/Inventori sistem
pengurusan
OP06 This organization has developed technologies to manage
its customers’ relationship duties
Organisasi ini telah membangunkan teknologi untuk
mengurus kerja-kerja berhubung dengan pelanggan
OP07 This organization has developed technologies to manage
its employees’ relationship duties
Organisasi ini telah membangunkan teknologi untuk
mengurus kerja-kerja berhubung dengan pekerjanya
OP08 This organization always employs technologies to
manage its inventory
Organisasi ini selalu mengambil teknologi- teknologi
untuk menguruskan inventorinya
OP09 This organization sometimes employs technologies to
manage its inventory
Organisasi ini kadang kala mengambil teknologi-
teknologi untuk menguruskan inventorinya
OP10 This organization has developed technologies to manage
suppliers’ relationship duties
Organisasi ini telah mengembangkan teknologi-
teknologi untuk mengurus kerja-kerja berhubung
192
dengan pembekal
Customer satisfaction/Kepuasan Pelanggan
OP11 Significance increase in number of our customers
Peningkatan signifikan dalam bilangan pelanggan kami
OP12 Significance increase in number of repetitive purchase
Peningkatan signifikan dalam bilangan pembelian yang
berulang kali
OP13 Our customer feel safe because we are responsive
Pelanggan kami berasa selamat atas sikap
tanggungjawab kami
OP14 Our customer always follow new instructions
Pelanggan kami selalu ikut arahan baru kami
OP15 Our organization always receive good feedback from
our customers
Organisasi kami selalu menerima maklum balas dan
pelanggan kami
Part/bahagian II: Quality Assurance/Jaminan Kualiti
Strategic Planning/ Perancangan Strategik SD
1
D
2
N
3
A
4
SA
5
QA01 In our organization, the leadership provides sufficient
internal communication facilities for effective
planning
Dalam organisasi kami kepemimpinan menawarkan
kemudahan komunikasi dalam yang mencukupi untuk
perancangan yang efektif
QA02 In our organization, employees ensures using the best
planning and learning method for achieving quality
Dalam organisasi kami kesemua pekerja
menggunakan perancangan yang terbaik dan kaedah
pembelajaran dalam mencapai kualiti
QA03 Our organization encourages innovative plan to
achieve best practice
Organisasi kami menggalakkan perancangan inovatif
untuk mencapai latihan yang terbaik
QA04 Our organization has a collective way of planning
Organisasi kami memiliki cara perancangan yang
kolektif
QA05 Our organization considers quality planning a top
193
priority in their regular meeting
Organisasi kami mempertimbankan dalam
mengutamakan perancangan kualiti yang terbaik
dalam mesyuarat-mesyuarat kebiasaanya
Process Focus/Fokus Proses
QA06 The production process is designed in such a way that
it adds value to our products
Proses hasil pengeluaran telah direka bentuk khas
sebagai nilai penabahan terhadap produk kami
QA07 Newly introduced process is critically examined prior
to its actual implementation
Proses yang baru diperkenalkan lebih kearah
penilaian kritikal analisis dalam impimentasi sebenar
QA08 The necessity of learning process are totally provided
to guarantee value creation for customers
Keperluan dalam proses pembelajaran telah di
berikan sebagai pembentukan nilai jaminan kepada
pelanggan
QA09 Good relationship between employees and customers
is maintained
Perhubungan yang baik di antara pekerja dan
pelanggan telah dikekalkan
QA10 The organization is committed to the review of
traditional technique to meet the current standard
Organisasi telah mengimbas kembali teknik-teknik
tradisional dalam menghadapi cabaran terkini
Production and delivery/penghasilan dan
penghantaran
QA11 Our employees are frequently trained to ensure quality
in jobs-specific skills
Pekerja-perkerja kami selalunya dilatih untuk
memiliki kualiti dalam kemahiran-kemahiran
pekerjaan yang khusus
QA12 Our employees are able to learn from each other on
how to improve production quality of its services
Pekerja kami berkebolehan mempelajari antara satu
sama lain untuk memperbaiki penghasilan kualiti
kemudahan
QA13 Our employees are able to learn from each other on
how to improve production quality of its goods
194
Pekerja kami berkebolehan mempelajari dari satu
sama lain untuk memperbaiki kualiti barangan
QA14 Emphasis is placed on effective service delivery with
regards to quality
Penekanan diberikan terhadap kemudahan
perkhidmaitan yang efektif sebagai unsur kualiti
QA15 Emphasis is placed on effective product delivery with
regards to quality
Penekanan diberikan terhadap kemudahan produk
yang efektif sebagai unsur kualiti
Part/bahagian III: Continuous Process Improvement/Proses Pembaikan Berterusan
Quality process/ Proses kualiti SD
1
D
2
N
3
A
4
SA
5
CPI01 Continuous improvement of the production process is
based on a systematic approach
Proses pembaikan berterusan berdasarkan
pendekatan sistematik
CPI02 Our organization continually looks for ways to
improve the quality processes
Organisasi kami berterusan dalam memperbaiki
proses kualiti
CPI03 Quality assurance as a mechanism for continuous
improvement is integrated in all aspects of the
organizational process
Jaminan kualiti merupakan salah mekanisme dalam
perkembangan kualiti berkait rapat dengan semua
perkara berkaitan organisasi
CPI04 There is a continuous evaluation of the organizational
quality of process
Wujud penilaian berterusan dalam proses kualiti
organisasi
CPI05 The necessities of process quality are totally provided
to guarantee valuable goods and services for the
customers
Keperluaan dalam proses kualiti dijamin penuh dalam
penghasilan barangan serta perkhidinatan yang
bermutu tinggi untuk pelanggan
Continuous product and service
195
development/Perkembanggan Barangan dan
Perkhidmatan yang Berterusan
CPI06 My organization develops new product for the
customers
Organisasi saya mengeluarkan barangan baru untuk
pelanggan
CPI07 My organization develops new services for the
customers
Organisasi saya mewujudkan perkhidmatan baru
untuk pelanggan
CPI08 Our organization always provides new services for its
employees
Organisasi kami selalu mewujudkan kemudahan baru
untuk pekerja
CPI09 Compared to past years, our organization has
developed new products and services overall.
Jika dibandingkan dengan tahun-tahun sebelum ini,
organisasi kami telah menghasilkan barangan dan
kemudahan baru secara keseluruhan
CPI10 There is significant increase in effectiveness of our
research products
Wujud peninggkatan signifikan yang efektif dalam
kajian produk kami
Feedback/Maklum Balas
CPI11 There is an effective feedback system for organization
product quality improvement and assurance
Wujud sistem maklum balas efektif untuk
perkembangan kualiti produk dan jaminan
CPI12 Quality assurance system of improvement is
documented properly
Menyampaikan sistem jaminan kualiti didokumentasi
dengan teliti
CPI13 There is a continuous review of the feedback from the
customers
Maklum balas pelanggan dipertimbangkan secara
berterusan
CPI14 There is a continuous effort by my organization in
strategizing quality related issues
Wujud tindakan berterusan dari organisasi saya
dalam merancang isu-isu berkaitan dengan kualiti
196
CIP15 The suggestions from the customers are taken into
account when designing new organizational services
Cadangan pelanggan dipertimbangkan ketika mereka
bentuk kemudahan organisasi baru
Part/Bahagian IV: Environmental regulation and policy/Peraturan dan Polisi
Persekitaran
Environmental regulation and policy
Peraturon dan Polisi Persekitaran
SD
1
D
2
N
3
A
4
SA
5
ERP01 This organization ensures public health in all aspects
through all the obstruction such as emitting air pollution,
public and private nuisance
Organisasi ini menjamin keutamaan kesihatan awam dari
segi semua aspek melalui semua kekangan seperti
pencemaran udara awam dan ganguan privasi
ERP02 Our organization establishes free environment and human
rights through all obstacles
Organisasi saya mengwujudkan hak-hak persekitaran dan
manusia percuma melalui semua kekangan
ERP03 Our organization enforces constitutional law relating to
environmental obligation
Organisasi yang mengimplimentasi undang-undang
berdasarkan perlembagaan berhubung dengan
tangungjawab terhadap persekitaan
ERP04 Our organization keeps human habitation free from
pollution
Organisasi kami mengutamakan keadaan persekitaran
manusia yang bebas dari pencemaran
ERP05 Our organization establish environmental balance for
keeping nature and natural beauties
Organisasi kami mengwujudkan persekitanran yang
seimbang dalam memelihara kecantikan alam semula jadi
ERP06 Our organization has enforcement of human right to
pollution-free environment under constitutional obligation
for its employees
Organisasi kami telah mengimplimentasikan hak-hak
manusia ke atas pencemaran persekitaran yang bebas di
bawah perlembagaan hak-hak pekerja
ERP07 Our organization has coordination between legal and
197
technical authorities in framing as well as respecting
environmental issues
Organisasi kami telah menyelaraskan autoriti undang-
undang dan teknikal dalam mengwujudkan kesedaran bagi
menghormati isu-isu persekitaran
ERP08 Our organization keeps up the provision of the constitution
relating to environmental obligation for ensuring human
right
Organisasi kami memegang pada peruntukan institusi
berkaitan dengan obligasi persekitaran sebagai jaminan
hak manusia
ERP09 Our organization has laws relating to air pollution for
maintaining ecological balance from imbalance
Organisasi kami mempunyai undang-undang berkaitan
pencemaran udara dalam mengekalkan keseimbangan
ekologi daripada tidak seimbang
ERP10 Our organization is committed to comply with
environmental legislation and regulation
Organisasi kami bersetuju mematuhi peraturan dan
perundangan alam sekitar.
Comments
………………………………………………………………………………………………
………………………………………………………………………………………………
………………………………………………………………………………………………
………………………………………………………………………………………………
………………………………………………………………………………………………
………………………………………………………………………………………………
………………………………………………………………………………………………
………………………………………………………………………………………………
………………………………………………………………
THANK YOU/TERIMA KASIH


![Dnevni avaz [broj 6578, 7.12.2013]](https://img.pdfslide.net/doc/110x75/577cd4ec1a28ab9e78997b4a/dnevni-avaz-broj-6578-7122013.jpg)