Embed Size (px)
Citation preview
The Correlates of Self-Reported Delinquency: An Analysis of the National Longitudinal Survey of Children and Youth
The Correlates of Self-Reported Delinquency: An Analysis of the National Longitudinal Survey of Children and Youth RR03YJ-2e Research and Statistics Division Department of Justice Canada Jeff Latimer Senior Research Officer Steven Kleinknecht Research Analyst Kwing Hung Statistical and Methodological Advisor Tom Gabor, Professor University of Ottawa
April 2003 The views expressed herein are solely those of the authors and do not necessarily reflect those of the Department of Justice Canada.
Research and Statistics Division
Executive Summary
The present study was designed to examine the correlates of self-reported delinquency among youth between the ages of 12 and 15 using Canadian data from the National Longitudinal Survey of Children and Youth (NLSCY). For the purposes of this study, a Self-Reported Delinquency Scale (SRDS) was created, which considered both the frequency and the severity of the delinquent behaviour. Multiple regression was used to determine the significant correlates of the SRDS as well as specific forms of delinquency including violent offending and drug trafficking. Partial regression analyses were also conducted for male and female delinquents. The prevalence of self-reported delinquency for the 12-month period prior to the survey was approximately 39% – this translates to more than 540,000 youth across Canada who admitted to at least one act of delinquency during the previous year. The majority, however, would be considered minor offenders. Five core concepts emerged from the analysis which were consistent across different forms of delinquency as well as for male and female youth. The five central concepts correlated with the SRDS are: 1) inconsistent and inadequate parenting; 2) history of victimization; 3) anti-social peer involvement; 4) negative school attachment; and, 5) aggression. The analysis was based on cross-sectional data from the NLSCY. It would be extremely valuable in the future to use the longitudinal aspect of the data to develop a clearer sense of the temporal relationships between variables.
i
Table of Contents
Executive Summary ............................................................................................................. i 1.0 Introduction............................................................................................................. 1 2.0 Method .................................................................................................................... 3
2.1 Weighting procedures ......................................................................................... 3 2.2 Missing data ........................................................................................................ 3 2.3 Dependent variable calculation: Self-Reported Delinquency Score.................. 3 2.4 Independent variables ......................................................................................... 4 2.5 Multiple regression ............................................................................................. 5
3.0 Results..................................................................................................................... 6 3.1 Prevalence of self-reported delinquency............................................................. 7 3.2 Delinquency and gender ..................................................................................... 8 3.3 Delinquency and age........................................................................................... 8 3.4 Aboriginal status and delinquency...................................................................... 9 3.5 Correlates of general delinquency ...................................................................... 9 3.6 Correlates of delinquency by gender ................................................................ 10 3.7 Correlates of sexual offending .......................................................................... 11 3.8 Correlates of violent offending ......................................................................... 11 3.9 Correlates of property offending....................................................................... 12 3.10 Correlates of drug trafficking............................................................................ 13
4.0 Discussion............................................................................................................. 14 5.0 Conclusion ............................................................................................................ 16
5.1 Additional future research................................................................................. 16 References......................................................................................................................... 17 Appendix A: Dependent Variable Calculation (SRDS).................................................... 21
ii
1.0 Introduction
Since the seminal work of Glueck and Glueck (1950, 1968), considerable research has been conducted in the social sciences to identify factors correlated with delinquency. One of the more important findings that has emerged is the general understanding that such factors do not operate in isolation from one another. Rather, correlates of delinquency often have additive or interactive effects that increase the risk of delinquency for youth who experience multiple factors (Thornberry, Huizinga & Loeber, 1995). Moreover, many factors tend to be involved in reciprocal relationships wherein delinquency leads to further deficits in the very factors most closely associated with it (Thornberry, Lizotte, Krohn, Farnworth & Jang, 1994). Delinquency, therefore, may perpetuate its very existence. Nevertheless, identifying individual correlates is still crucial to the prevention or reduction of criminal behavior in youth by providing direction to the development of appropriate interventions. Delinquency correlates are often grouped into static factors (i.e., factors that are not amendable to change through direct interventions) and dynamic factors (i.e., those that are amendable to change through direct interventions). This distinction is useful when developing interventions designed to reduce delinquency, as dynamic factors can be targeted for change in an effort to prevent further criminal behavior (Andrews & Bonta, 1998). The most commonly discussed static factors are gender and age. The risk for criminal involvement is significantly higher for male youth compared to female youth (Bor, Najman, O’Callaghan, Williams, & Anstey, 2001; Lipsey & Derzon, 1998; Moffitt, 1993; Smith, Visher, & Jarjoura, 1991). However, according to Statistics Canada (see Stevenson, Tufts, Hendrick, & Kowalski, 1998) the gender gap is shrinking, as an increasing number of females are engaging in criminal behaviors. Age is considered one of the more robust correlates as the prevalence of delinquency increases in early adolescence and peaks in young adulthood (Gomme, 1985; Loeber, Stouthamer-Loeber, Van Kammen, & Farrington, 1991; McCord, Widom, & Crowell, 2001; Moffitt, 1993). Two additional factors found in the literature that are often labelled static are child maltreatment and socio-economic status. A history of physical, sexual or emotional abuse, or neglect, has been found to increase the likelihood of delinquent behavior (Malinosky-Rummell & Hansen, 1993; Scudder, Blount, Heide & Silverman, 1993; Stewart, Dennison & Waterson, 2002; Widom, 1989; Zingraff, Leiter, Myers & Johsen, 1993). The relationship between socio-economic status and delinquency, however, is unclear. While some studies do indicate that youth from lower status families are at a higher risk for delinquency than those from higher status families (Farrington, 1989; Lispey & Derzon, 1998), this finding is not consistent across studies (Tittle & Meier, 1991; Wilkström & Loeber, 2000). Dynamic factors are typically considered to be of greater importance as they represent precursors of delinquency that have the potential to be changed through individual intervention (Hawkins, Herrenkohl, Farrington, Brewer, Catalano, & Harachi, 1998).
Youth Justice Research Series / Department of Justice Canada 1
The Correlates of Self-Reported Delinquency: An Analysis of the National Longitudinal Survey of Children and Youth One of the primary dynamic factors correlated with delinquency is inadequate parenting including inconsistent parenting styles (McCord et al, 2001; Hawkins, et al, 1998), lower levels of parental supervision (Loeber & Stouthamer-Loeber, 1986), and poor child-parent attachment (Blaske, Borduin, Henggeler & Mann, 1989; Rankin & Wells, 1990). A second dynamic factor correlated with delinquency is poor school attachment including repeating a grade and early withdrawal from school (McCord et al., 2001; Thornberry, Lizotte, Krohn, Farnworth, & Jang, 1991). Children who display antisocial attitudes (Andrews & Bonta, 1998) or who live with parents who demonstrate antisocial attitudes (Hawkins et al., 1998; McCord, 1991) are also at an elevated risk of becoming involved in delinquent behavior. Additionally, association with antisocial peers have been identified as contributing to participation in delinquency (Andrews & Bonta, 1998; Bell, 1999; Lawrence, 1991; McCord et al., 2001; Lispey & Derzon, 1998; Matsueda & Anderson, 1998; Warr, 1993). One of the more salient dynamic correlates of delinquency in childhood is aggression (Bor et al., 2001; Farrington, 1989; Hawkins et al., 1998; McLaren, 2000; Moffitt, 1993). In fact, Laub and Lauritsen (1993) argue that, “the stability of aggressive behavior patterns throughout the life course is one of the most consistently documented patterns found in longitudinal research” (p. 239). There are a number of additional dynamic factors associated with delinquency, including conduct disorders and Attention-Deficit Hyperactivity Disorder (Farrington, 1989; Hawkins et al., 1998; Oddone-Paolucci, Violato & Wilkes, 2000). The present study was primarily designed to identify the significant correlates of delinquency among youth between the ages of 12 and 15, using Canadian data from the National Longitudinal Survey of Children and Youth (NLSCY). This data source was also useful in providing information on the prevalence of delinquency in Canada within this age group. Previous research in this area has focused on broad definitions of delinquency, including behaviors that are not considered ‘criminal’ by today’s standards, such as truancy, general disobedience, and promiscuity. This study defined delinquency more strictly as a violation of the current Criminal Code of Canada and did not include non-criminal misbehavior.
2
2.0 Method
The National Longitudinal Survey of Children and Youth provided a useful data source for the examination of self-reported delinquency in Canadian youth. The NLSCY is a joint project between Statistics Canada and Human Resources Development Canada. The goal of the survey is, “to monitor the development and well being of Canada’s children as they grow from infancy to adulthood” (Statistics Canada, 2002, p.1). Initiated in 1994, the NLSCY was designed to follow a representative sample of Canadian children (newborns to 11 year olds) into adulthood. New interview and questionnaire data are collected every two years. The data used in this study were drawn from Cycle III, which was collected in 1998. During Cycle III, individuals between 12 and 15 years of age filled out self-administered questionnaires designed to examine a number of different aspects of their lives (e.g., friends, family, school, feelings and behaviors, delinquent behavior, health, and work). Data on each child, including items such as his or her family’s economic, labour force and health status, birth information, behavior, social relationships, school performance, and learning environment were collected from the person most knowledgeable (PMK) about the child, the PMK’s spouse (if applicable), and the child’s principal and teachers through questionnaires and interviews. In total, Cycle III provides data on 31,194 children from across the ten provinces. 2.1 Weighting procedures The principle behind estimation in a probability sample, such as the NLSCY, is that each respondent represents several other individuals in the population. Applying a weight to a respondent allows for the calculation of the number of children that respondent represents. Conceptually, the basic weight of each child in the NLSCY is roughly equal to the inverse of the child’s probability of selection. In general, one child represents approximately 300 children in the population. Given our secondary purpose of reporting on the prevalence of self-reported delinquency among youth 12 to 15 years of age in Canada, this study employs the cross-sectional weighting variable created by Statistics Canada. 2.2 Missing data In order to effectively conduct statistical analysis, it was necessary to recode certain responses within the NLSCY. If a particular individual provided responses such as ‘do not know’ or ‘not applicable’, or if the individual refused to answer the question, the response was coded as missing. A portion of the respondents also failed to answer entire sections of the survey, which, along with our recoding procedures, resulted in a substantial reduction in the sample size used in the regression analysis. 2.3 Dependent variable calculation: Self-Reported Delinquency Score In order to operationalise self-reported delinquency, 14 questions from the NLSCY were selected as dependent variables and matched with comparable Criminal Code offences.1
1 Please see Appendix A for the complete list of questions.
Youth Justice Research Series / Department of Justice Canada 3
The Correlates of Self-Reported Delinquency: An Analysis of the National Longitudinal Survey of Children and Youth
Respondents were asked to indicate the frequency of each of the criminal behaviors in the 12 months preceding the survey using the following choices: never; once or twice; three or four times; or, five or more times. Respondents were also asked about drug use (e.g., “Have you every tried marijuana and cannabis products?”), but the possible responses were dichotomous (i.e., “yes” or “no”) and the timeframe was not specified as with the 14 selected questions. Therefore, drug use was not considered within the dependent delinquency score. As it is a Criminal Code offence to possess drugs in Canada, a decision was made to also exclude drug use from the list of independent variables. In order to develop a meaningful measure of delinquency, which considered both the severity and the frequency of the behavior, weights were attached to each variable based upon the seriousness of the offence and subsequently multiplied by its frequency. Severity was defined using the mean custodial sentence length (in months) of each Criminal Code offence.2 This information was obtained from the 1998 Adult Criminal Court Survey (ACCS) managed by the Canadian Centre for Justice Statistics (CCJS). Adult court data were selected rather than youth court data in order to create more variability and to accurately rank the seriousness of the crime based upon societal norms as maximum sentences in Canadian youth court are three years for most offences. For example, the mean sentence length for sexual assault, using ACCS data, was 16 months. If a respondent in the NLSCY indicated that they had, in the past 12 months, forced someone into having sex once or twice, the score would be 16, while three or four infractions would create a score of 32 and five or more infractions would total 48 points. Once each offence was weighted according to severity and frequency, a total overall self-reported delinquency score (SRDS) was calculated by summing each individual’s score across all the offences. The SRDS can range from 0 (indicating no delinquent behavior) to 312. 2.4 Independent variables Previous studies on the correlates of delinquency were used as a guide in selecting the appropriate independent variables. The following scores3 and individual variables were included:
1. Pro-social Score 2. Parental Nurturance Score 3. Parental Monitoring Score 4. Hyperactivity/Inattention Score 5. Emotional Disorder Score 6. Indirect Aggression Score 7. General Self Score 8. Friends Score 9. School Attachment Score
2 Please see Appendix A for the severity weights. 3 For a detailed description of the scores, please see Statistics Canada (2002).
4
10. Extra-curricular Involvement Score 11. Volunteer Score 12. Victimization Score 13. Drug-use Score 14. Negative Peer Score 15. Negative School Behavior Score 16. Inconsistent Parenting Score 17. Peer Drug-use 18. Age of child 19. Gender of child 20. Household Income 21. Child witnesses abuse within the home 22. Social Economic Status 23. Child takes Ritalin 24. Child destroys own belongings 25. Child gives up easily 26. Parents hit child or threaten to 27. Parents get angry and yell at child 28. Child’s time spent with friends 29. Parents encourage child to do well 30. Child repeated grade 31. Number of close boyfriends 32. Number of close girlfriends 33. Child’s school aspirations
2.5 Multiple regression Logistic regression was used to assess the combined and individual influence of each of the independent variables on the SRDS. In addition to the general regression analysis, partial regression analyses were conducted for male youth, female youth, youth engaged in violent offences, youth engaged in property offences, youth engaged in sexual offences, and youth engaged in drug trafficking.
Youth Justice Research Series / Department of Justice Canada 5
The Correlates of Self-Reported Delinquency: An Analysis of the National Longitudinal Survey of Children and Youth
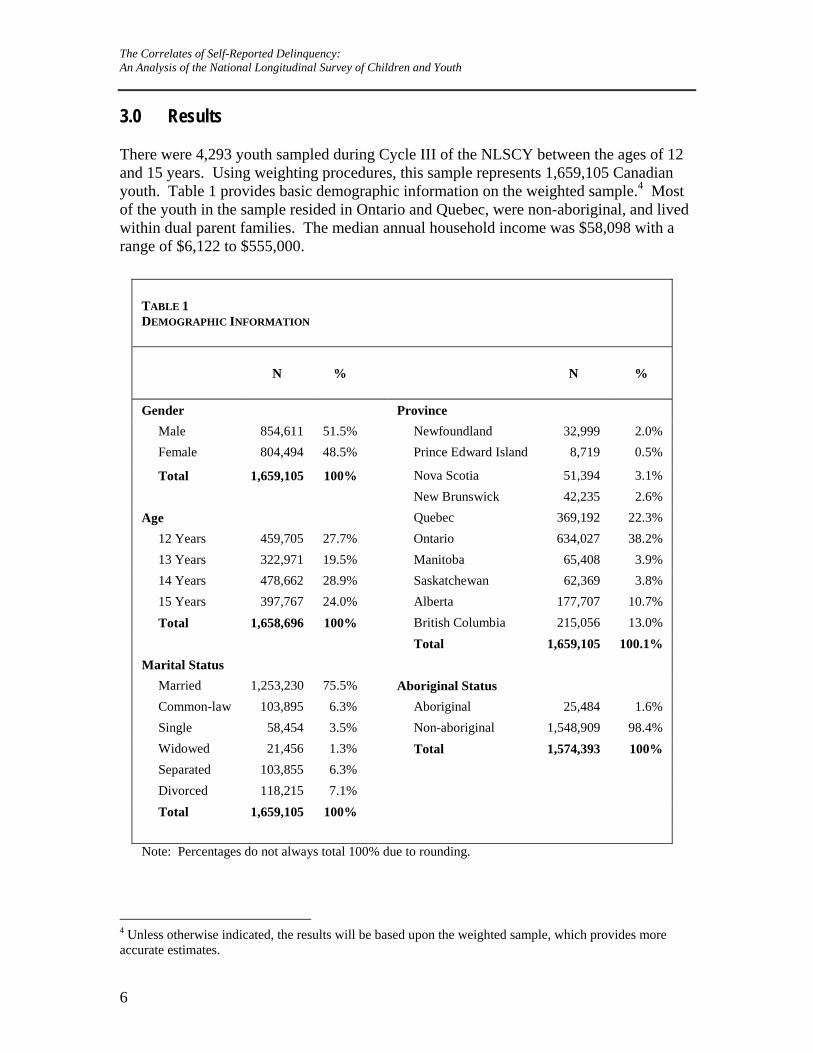
3.0 Results There were 4,293 youth sampled during Cycle III of the NLSCY between the ages of 12 and 15 years. Using weighting procedures, this sample represents 1,659,105 Canadian youth. Table 1 provides basic demographic information on the weighted sample.4 Most of the youth in the sample resided in Ontario and Quebec, were non-aboriginal, and lived within dual parent families. The median annual household income was $58,098 with a range of $6,122 to $555,000.
TABLE 1 DEMOGRAPHIC INFORMATION
N
%
N
%
Gender Province Male 854,611 51.5% Newfoundland 32,999 2.0% Female 804,494 48.5% Prince Edward Island 8,719 0.5%
Total 1,659,105 100% Nova Scotia 51,394 3.1% New Brunswick 42,235 2.6% Age Quebec 369,192 22.3% 12 Years 459,705 27.7% Ontario 634,027 38.2% 13 Years 322,971 19.5% Manitoba 65,408 3.9% 14 Years 478,662 28.9% Saskatchewan 62,369 3.8% 15 Years 397,767 24.0% Alberta 177,707 10.7% Total 1,658,696 100% British Columbia 215,056 13.0% Total 1,659,105 100.1% Marital Status Married 1,253,230 75.5% Aboriginal Status Common-law 103,895 6.3% Aboriginal 25,484 1.6% Single 58,454 3.5% Non-aboriginal 1,548,909 98.4% Widowed 21,456 1.3% Total 1,574,393 100% Separated 103,855 6.3% Divorced 118,215 7.1% Total 1,659,105 100% Note: Percentages do not always total 100% due to rounding.
4 Unless otherwise indicated, the results will be based upon the weighted sample, which provides more accurate estimates.
6
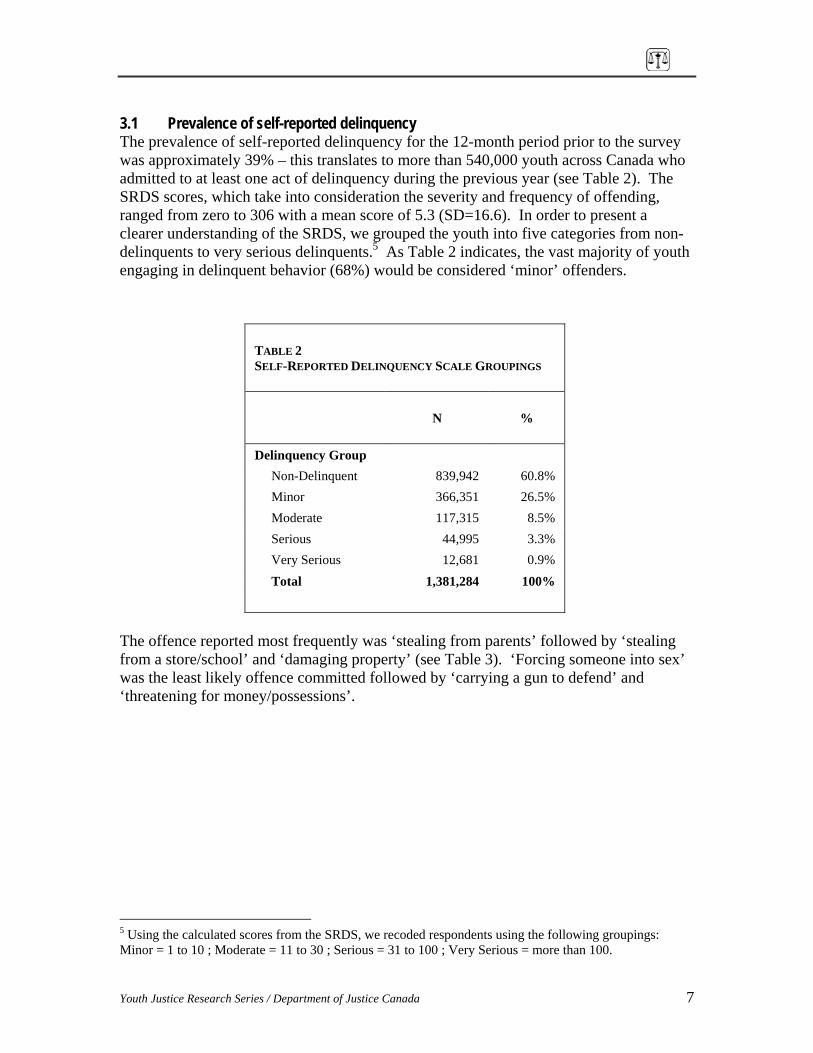
3.1 Prevalence of self-reported delinquency The prevalence of self-reported delinquency for the 12-month period prior to the survey was approximately 39% – this translates to more than 540,000 youth across Canada who admitted to at least one act of delinquency during the previous year (see Table 2). The SRDS scores, which take into consideration the severity and frequency of offending, ranged from zero to 306 with a mean score of 5.3 (SD=16.6). In order to present a clearer understanding of the SRDS, we grouped the youth into five categories from non-delinquents to very serious delinquents.5 As Table 2 indicates, the vast majority of youth engaging in delinquent behavior (68%) would be considered ‘minor’ offenders.
TABLE 2 SELF-REPORTED DELINQUENCY SCALE GROUPINGS
N
%
Delinquency Group Non-Delinquent 839,942 60.8% Minor 366,351 26.5% Moderate 117,315 8.5% Serious 44,995 3.3% Very Serious 12,681 0.9% Total 1,381,284 100%
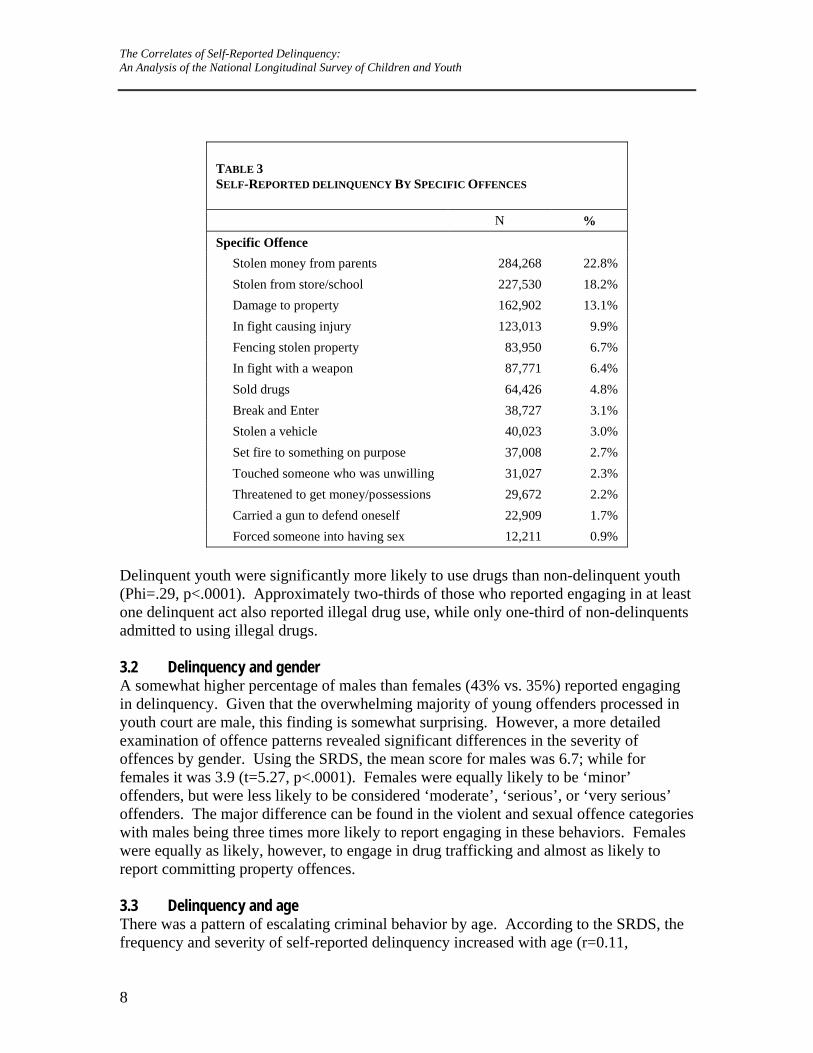
The offence reported most frequently was ‘stealing from parents’ followed by ‘stealing from a store/school’ and ‘damaging property’ (see Table 3). ‘Forcing someone into sex’ was the least likely offence committed followed by ‘carrying a gun to defend’ and ‘threatening for money/possessions’.
5 Using the calculated scores from the SRDS, we recoded respondents using the following groupings: Minor = 1 to 10 ; Moderate = 11 to 30 ; Serious = 31 to 100 ; Very Serious = more than 100.
Youth Justice Research Series / Department of Justice Canada 7
The Correlates of Self-Reported Delinquency: An Analysis of the National Longitudinal Survey of Children and Youth
8
elinquent youth were significantly more likely to use drugs than non-delinquent youth t
.2 Delinquency and gender A somewhat higher percentage of males than females (43% vs. 35%) reported engaging in delinquency. Given that the overwhelming majority of young offenders processed in youth court are male, this finding is somewhat surprising. However, a more detailed examination of offence patterns revealed significant differences in the severity of offences by gender. Using the SRDS, the mean score for males was 6.7; while for females it was 3.9 (t=5.27, p<.0001). Females were equally likely to be ‘minor’ offenders, but were less likely to be considered ‘moderate’, ‘serious’, or ‘very serious’ offenders. The major difference can be found in the violent and sexual offence categories with males being three times more likely to report engaging in these behaviors. Females were equally as likely, however, to engage in drug trafficking and almost as likely to report committing property offences. 3.3 Delinquency and age There was a pattern of escalating criminal behavior by age. According to the SRDS, the frequency and severity of self-reported delinquency increased with age (r=0.11,
TABLE 3 SELF-REPORTED DELINQUENCY BY SPECIFIC OFFENCES N % Specific Offence Stolen money from parents 284,268 22.8% Stolen from store/school 227,530 18.2% Damage to property 162,902 13.1% In fight causing injury 123,013 9.9% Fencing stolen property 83,950 6.7% In fight with a weapon 87,771 6.4% Sold drugs 64,426 4.8% Break and Enter 38,727 3.1% Stolen a vehicle 40,023 3.0% Set fire to something on purpose 37,008 2.7% Touched someone who was unwilling 31,027 2.3% Threatened to get money/possessions 29,672 2.2% Carried a gun to defend oneself 22,909 1.7% Forced someone into having sex 12,211 0.9%
D(Phi=.29, p<.0001). Approximately two-thirds of those who reported engaging in at leasone delinquent act also reported illegal drug use, while only one-third of non-delinquents admitted to using illegal drugs. 3
p<.0 1). In fact, the mean SRD00 S for 12 year-olds was 3.2, while the mean scores for 13
% vs.
th reported using illegal drugs, while only 19% of on-Aboriginal youth reported illegal drug use.
or (i.e.,
the equency of being threatened or physically attacked/assaulted both outside and inside the
e (
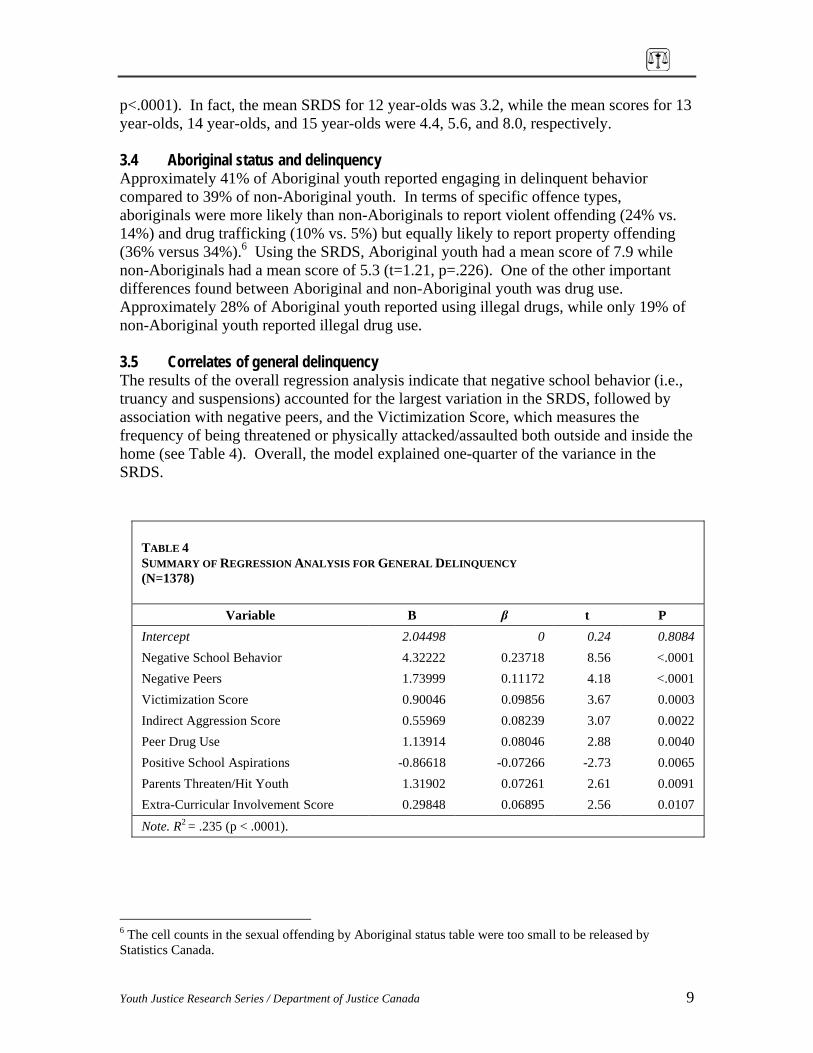
year-olds, 14 year-olds, and 15 year-olds were 4.4, 5.6, and 8.0, respectively. 3.4 Aboriginal status and delinquency Approximately 41% of Aboriginal youth reported engaging in delinquent behaviorcompared to 39% of non-Aboriginal youth. In terms of specific offence types, aboriginals were more likely than non-Aboriginals to report violent offending (2414%) and drug trafficking (10% vs. 5%) but equally likely to report property offending (36% versus 34%).6 Using the SRDS, Aboriginal youth had a mean score of 7.9 while non-Aboriginals had a mean score of 5.3 (t=1.21, p=.226). One of the other important differences found between Aboriginal and non-Aboriginal youth was drug use. Approximately 28% of Aboriginal youn 3.5 Correlates of general delinquency The results of the overall regression analysis indicate that negative school behavitruancy and suspensions) accounted for the largest variation in the SRDS, followed by association with negative peers, and the Victimization Score, which measures frhom see Table 4). Overall, the model explained one-quarter of the variance in the SRDS.
TABLE 4 SUMMARY OF REGRESSION ANALYSIS FOR GENERAL DELINQUENCY (N=1378)
Variable B β t P Intercept 2.04498 0 0.24 0.8084 N ative School Behavior eg 4.32222 0.23718 8.56 <.0001 Negative Peers 1.73999 0.11172 4.18 <.0001 Victimization Score 0.90046 0.09856 3.67 0.0003 Indirect Aggression Score 0.55969 0.08239 3.07 0.0022 Peer Drug Use 1.13914 0.08046 2.88 0.0040 Positive School Aspirations -0.86618 -0.07266 -2.73 0.0065 Parents Threaten/Hit Youth 1.31902 0.07261 2.61 0.0091 Extra-Curricular Involvement Score 0.29848 0.06895 2.56 0.0107 Note. R2 = .235 (p < .0001).
6 The cell counts in the sexual offending by Aboriginal status table were too small to be released by Statistics Canada.
Youth Justice Research Series / Department of Justice Canada 9
The Correlates of Self-Reported Delinquency: An Analysis of the National Longitudinal Survey of Children and Youth
er drug
h a more positive and nurturing parental style (see Table 5).
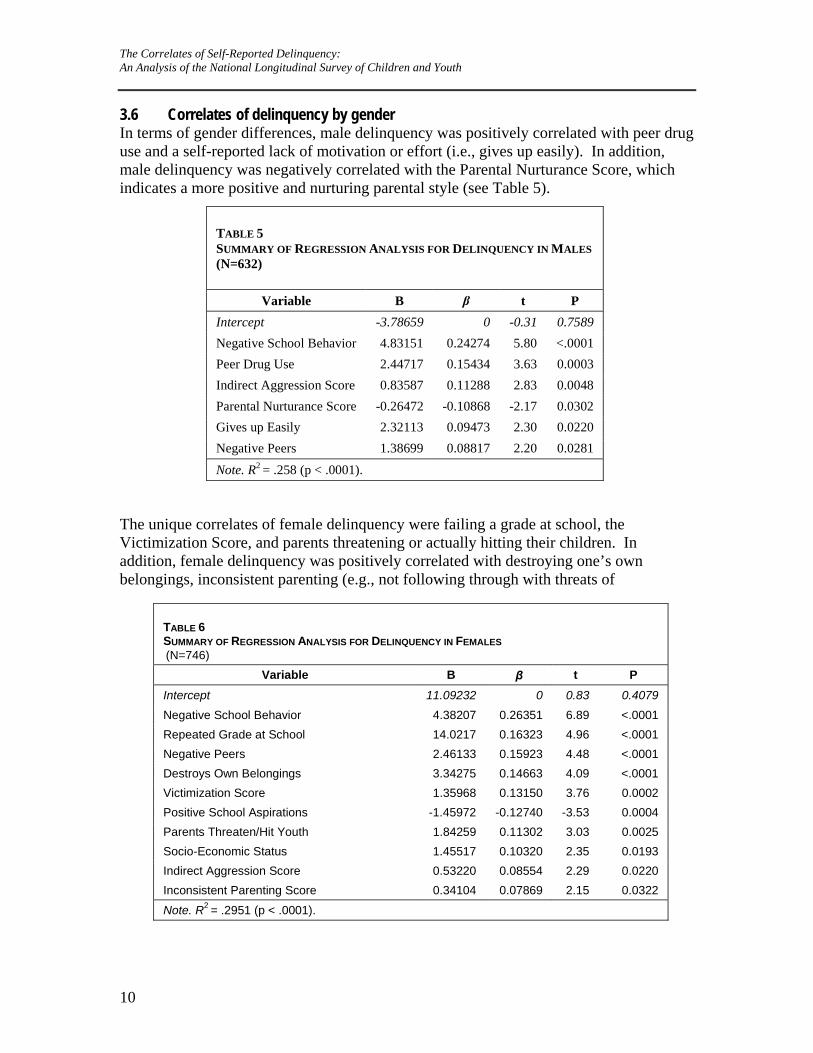
3.6 Correlates of delinquency by gender In terms of gender differences, male delinquency was positively correlated with peuse and a self-reported lack of motivation or effort (i.e., gives up easily). In addition, male delinquency was negatively correlated with the Parental Nurturance Score, whicindicates
TABLE 5 SUMMARY OF REGRESSION ANALYSIS FOR DELINQUENCY IN MALES (N=632)
Variable B β t P Intercept -3.78659 0 -0.31 0.758
The unique correlates of female delinquency were failing a grade at school, the Victimization Score, and parents threatening or actually hitting their children. In addition, female delinquency was positively correlated with destroying one’s own belongings, inconsistent parenting (e.g., not following through with threats of
9 Negative School Behavior 4.83151 0.24274 5.80 <.0001 Peer Drug Use 2.44717 0.15434 3.63 0.0003 Indirect Aggression Score 0.83587 0.11288 2.83 0.0048 Parental Nurturance Score -0.26472 -0.10868 -2.17 0.0302 Gives up Easily 2.32113 0.09473 2.30 0.0220 Negative Peers 1.38699 0.08817 2.20 0.0281 Note. R2 = .258 (p < .0001).
TABLE 6 SUMMARY OF REGRESSION ANALYSIS FOR DELINQUENCY IN FEMALES (N=746)
Variable B β t P Intercept 11.09232 0 0.83 0.4079 Negative School Behavior 4.38207 0.26351 6.89 <.0001 Repeated Grade at School 14.0217 0.16323 4.96 <.0001 Negative Peers 2.46133 0.15923 4.48 <.0001 Destroys Own Belongings 3.34275 0.14663 4.09 <.0001 Victimization Score 1.35968 0.13150 3.76 0.0002 Positive School Aspirations -1.45972 -0.12740 -3.53 0.0004 Parents Threaten/Hit Youth 1.84259 0.11302 3.03 0.0025 Socio-Economic Status 1.45517 0.10320 2.35 0.0193 Indirect Aggression Score 0.53220 0.08554 2.29 0.0220 Inconsistent Parenting Score 0.34104 0.07869 2.15 0.0322
Note. R2 = .2951 (p < .0001).
10
punishment), and socio-economic status. A negative correlation was also founpositive academic aspirations (see Table 6).
d with
Common correlates to both male and female delinquency included negative school ately
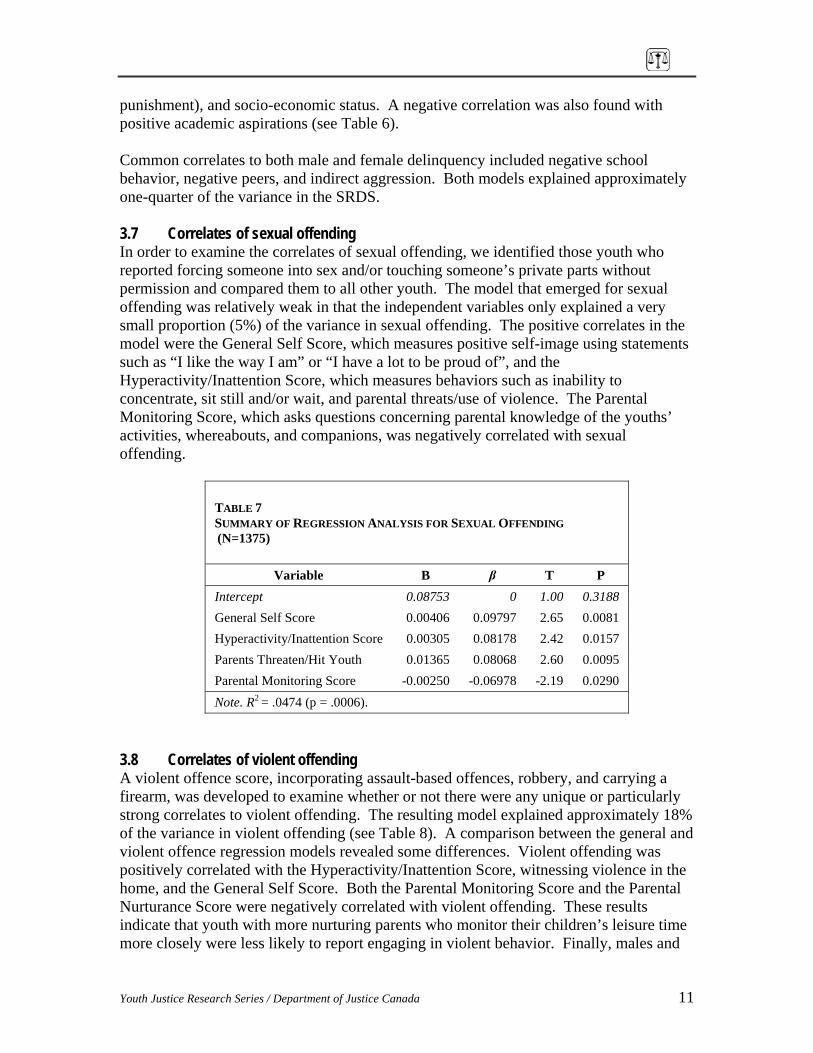
.7 Correlates of sexual offending exual offending, we identified those youth who
l
e
bility to tal
s’
ates of violent offending A violent offence score, incorporating assault-based offences, robbery, and carrying a
rm ether or not there were any unique or particularly %
al
and
TABLE 7 SUMMARY OF REGRESSION ANALYSIS FOR SEXUAL OFFENDING (N=1375)
behavior, negative peers, and indirect aggression. Both models explained approximone-quarter of the variance in the SRDS. 3In order to examine the correlates of sreported forcing someone into sex and/or touching someone’s private parts without permission and compared them to all other youth. The model that emerged for sexuaoffending was relatively weak in that the independent variables only explained a very small proportion (5%) of the variance in sexual offending. The positive correlates in thmodel were the General Self Score, which measures positive self-image using statements such as “I like the way I am” or “I have a lot to be proud of”, and the Hyperactivity/Inattention Score, which measures behaviors such as inaconcentrate, sit still and/or wait, and parental threats/use of violence. The ParenMonitoring Score, which asks questions concerning parental knowledge of the youthactivities, whereabouts, and companions, was negatively correlated with sexual offending.
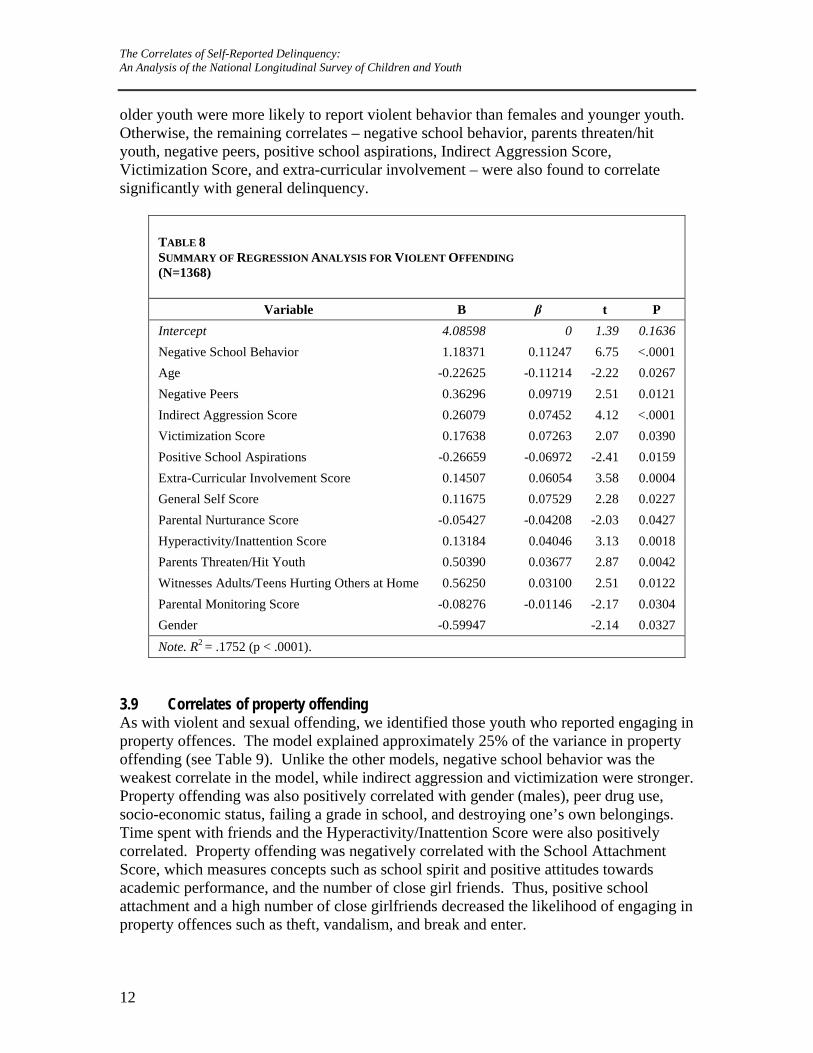
3.8 Correl
Variable B β T P Intercept 0.08753 0 1.00 0.3188 General Self Score 0.00406 0.09797 2.65 0.0081 Hyperactivity/Inattention Score 0.00305 0.08178 2.42 0.0157 Parents Threaten/Hit Youth 0.01365 0.08068 2.60 0.0095 Parental Monitoring Score -0.00250 -0.06978 -2.19 0.0290 Note. R2 = .0474 (p = .0006).
firea , was developed to examine whstrong correlates to violent offending. The resulting model explained approximately 18of the variance in violent offending (see Table 8). A comparison between the general andviolent offence regression models revealed some differences. Violent offending was positively correlated with the Hyperactivity/Inattention Score, witnessing violence in the home, and the General Self Score. Both the Parental Monitoring Score and the ParentNurturance Score were negatively correlated with violent offending. These results indicate that youth with more nurturing parents who monitor their children’s leisure time more closely were less likely to report engaging in violent behavior. Finally, males
Youth Justice Research Series / Department of Justice Canada 11
The Correlates of Self-Reported Delinquency: An Analysis of the National Longitudinal Survey of Children and Youth
identified those youth who reported engaging in property offences. The model explained approximately 25% of the variance in property
di r models, negative school behavior was the
s.
in
TABLE 8 SUMMARY OF REGRESSION ANALYSIS FOR VIOLENT OFFENDING (N=1368)
older youth were more likely to report violent behavior than females and younger youth. Otherwise, the remaining correlates – negative school behavior, parents threaten/hit youth, negative peers, positive school aspirations, Indirect Aggression Score, Victimization Score, and extra-curricular involvement – were also found to correlatesignificantly with general delinquency.
As with violent and sexual offending, we
Variable B β t P Intercept 4.08598 0 1.39 0.1636 Negative School Behavior 1.18371 0.11247 6.75 <.0001 Age -0.22625 -0.11214 -2.22 0.0267 Negative Peers 0.36296 0.09719 2.51 0.0121 Indirect Aggression Score 0.26079 0.07452 4.12 <.0001 Victimization Score 0.17638 0.07263 2.07 0.0390 Positive School Aspirations -0.26659 -0.06972 -2.41 0.0159 Extra-Curricular Involvement Score 0.14507 0.06054 3.58 0.0004 General Self Score 0.11675 0.07529 2.28 0.0227 Parental Nurturance Score -0.05427 -0.04208 -2.03 0.0427 Hyperactivity/Inattention Score 0.13184 0.04046 3.13 0.0018 Parents Threaten/Hit Youth 0.50390 0.03677 2.87 0.0042 Witnesses Adults/Teens Hurting Others at Home 0.56250 0.03100 2.51 0.0122 Parental Monitoring Score -0.08276 -0.01146 -2.17 0.0304 Gender -0.59947 -2.14 0.0327 Note. R2 = .1752 (p < .0001).
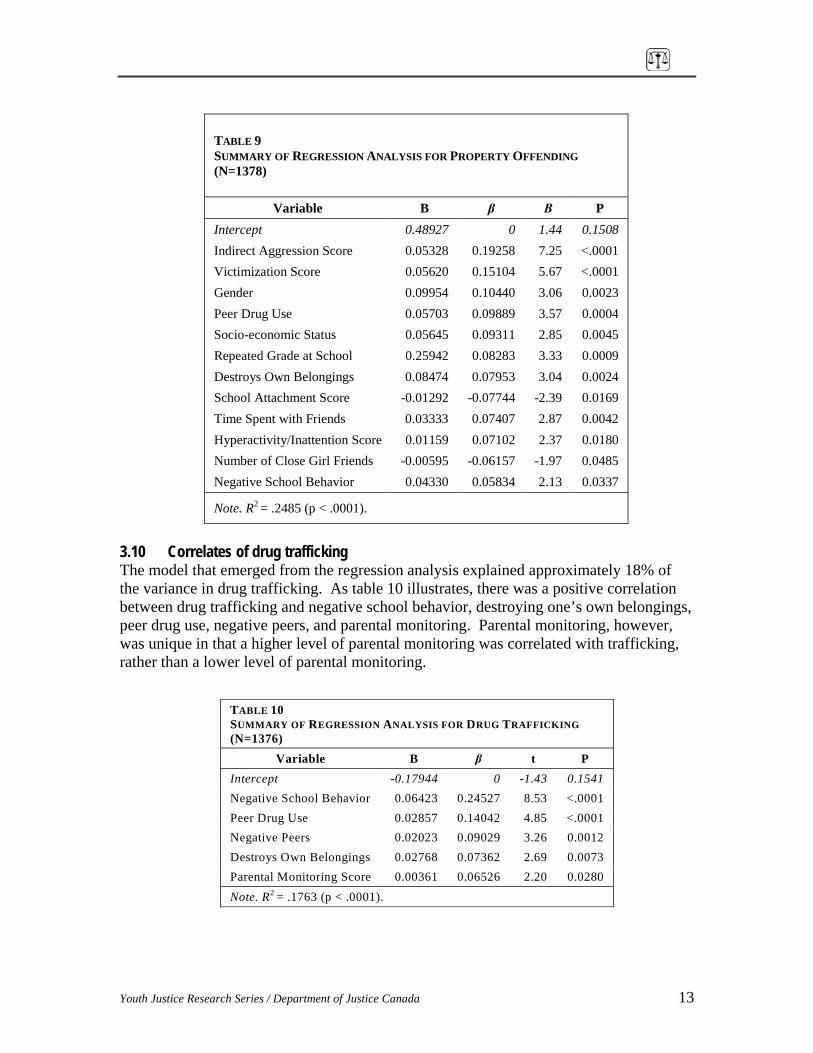
3.9 Correlates of property offending
offen ng (see Table 9). Unlike the otheweakest correlate in the model, while indirect aggression and victimization were stronger. Property offending was also positively correlated with gender (males), peer drug use, socio-economic status, failing a grade in school, and destroying one’s own belongingTime spent with friends and the Hyperactivity/Inattention Score were also positively correlated. Property offending was negatively correlated with the School Attachment Score, which measures concepts such as school spirit and positive attitudes towards academic performance, and the number of close girl friends. Thus, positive school attachment and a high number of close girlfriends decreased the likelihood of engagingproperty offences such as theft, vandalism, and break and enter.
12
Youth Justice Research Series / Department of Justice Canada 13
3.10 Correlates of drug trafficking The model that emerged from the regression analysis explained approximately 18% of the variance in drug trafficking. As table 10 illustrates, there was a positive correlation between drug trafficking and negative school behavior, destroying one’s own belongings,
r rental monitoring. Parental monitoring, however,
TABLE 9 SUMMARY OF REGRESSION ANALYSIS FOR PROPERTY OFFENDING (N=1378)
Variable B β Β P Intercept 0.48927 0 1.44 0.1508 Indirect Aggression Score 0.05328 0.19258 7.25 <.0001 Victimization Score 0.05620 0.15104 5.67 <.0001 Gender 0.09954 0.10440 3.06 0.0023 Peer Drug Use 0.05703 0.09889 3.57 0.0004 Socio-economic Status 0.05645 0.09311 2.85 0.0045 Repeated Grade at School 0.25942 0.08283 3.33 0.0009 Destroys Own Belongings 0.08474 0.07953 3.04 0.0024 School Attachment Score -0.01292 -0.07744 -2.39 0.0169 Time Spent with Friends 0.03333 0.07407 2.87 0.0042 Hyperactivity/Inattention Score 0.01159 0.07102 2.37 0.0180 Number of Close Girl Friends -0.00595 -0.06157 -1.97 0.0485 Negative School Behavior 0.04330 0.05834 2.13 0.0337
Note. R2 = .2485 (p < .0001).
peer d ug use, negative peers, and pawas unique in that a higher level of parental monitoring was correlated with trafficking,rather than a lower level of parental monitoring.
TABLE 10 SUMMARY OF REGRESSION ANALYSIS FOR DRUG TRAFFICKING (N=1376)
Variable B β t P Intercept -0.17944 0 -1.43 0.1541 Negative School Behavior 0.06423 0.24527 8.53 <.0001 Peer Drug Use 0.02857 0.14042 4.85 <.0001 Negative Peers 0.02023 0.09029 3.26 0.0012 Destroys Own Belongings 0.02768 0.07362 2.69 0.0073 Parental Monitoring Score 0.00361 0.06526 2.20 0.0280 Note. R2 = .1763 (p < .0001).
The Correlates of Self-Reported Delinquency: An Analysis of the National Longitudinal Survey of Children and Youth
4.0 iscussion
The annual self-reported delinquency rate in our sample (39%) was substantially higher
fact,
e
terms of gender, our results indicate that the official data sources also vastly ted
the
hile the Aboriginal self-reported delinquency rate (41%) was similar to non-Aboriginal
ces,
general, the correlates identified in this study provide further support to the findings
ge
hile unique correlates were identified for female and male delinquency, the broad
ly
uences of
D
than the official rate of 5% found in the Uniform Crime Reports (UCR).7 Our rates of property offending (39%) and violent offending (15%) were also substantially higher than official rates. UCR data indicated that the prevalence rate for property crime wasapproximately 3%, while the violent offence rate was less than 1% of all youth. Discrepancies between official rates and self-reported rates are to be expected. Inaccording to Moffitt (1993), although only a portion of youth come to the attention of police, deviant behavior is so prevalent during adolescence that youth who never engagin offending are considered statistical anomalies. Inunderestimate the extent of female delinquency. We found that females constituapproximately 44% of all youth who reported engaging in delinquent behavior whileofficial data from the UCR indicate that females constituted 22% of all youth charged. Female youth were less likely, however, to report serious and frequent offending, whichmay partially explain this discrepancy. Police may not be as likely to charge youth for the minor offending that is common among female youth. Wyouth (39%), Aboriginal youth were more likely to report engaging in more serious offences. Unfortunately, we were unable to compare our sample to official data souras Aboriginal status is not adequately reported to the UCR. Inwithin the literature. The primary correlates of general delinquency are negative school attachment, anti-social peers, victimization, aggression, and negative parenting. The findings are encouraging in that these are primarily dynamic factors amenable to chanthrough targeted interventions with youth and their families. Wcategories of negative school attachment, anti-social peers, aggression, and negative parenting were still present. The central difference was that victimization was strongcorrelated with female delinquency and poor motivation was uniquely correlated with male delinquency. Appropriate gender-based interventions designed to reduce recidivism, therefore, should provide an increased focus on reducing the conseqvictimization for females and increasing self-motivation for males.
7 The UCR data in this report represents all youth aged 12 to 17 charged with a common offence (Criminal Code and other federal statute offences) across all 13 provinces/territories from the same year as the NLSCY data (1998).
14
Sexual offending was not strongly related to any of the factors we tested. Clearly, the pathways into sexual offending are rather unique and may be related to a different set of independent variables. For violent offending, the same five core concepts (school, peers, aggression, victimization, and parenting) emerged with the addition of age, self-esteem, hyperactivity/inattention, and gender. That is, violent youth displayed attributes similar to other delinquents, but tended to be older, hyperactive males who presented a positive self-image. For property offending, four of the five core concepts entered the model with negative parenting being the notable exclusion. Gender, hyperactivity/inattention, and socio-economic status were also correlated with property-related offending. In other words, property offenders, as a unique group of delinquents, tended to be hyperactive males with higher socio-economic status. Drug trafficking was also correlated with four out of the five core concepts. Victimization, however, did not enter the model.
Youth Justice Research Series / Department of Justice Canada 15
The Correlates of Self-Reported Delinquency: An Analysis of the National Longitudinal Survey of Children and Youth
5.0 Conclusion
The results of the regression analyses provide clear direction for the prevention and treatment of delinquent behavior. Addressing the five core concepts identified in this study within criminal justice interventions may prove to be effective in reducing recidivism. Future research testing such a hypothesis would be warranted. Four of these five core concepts are also consistent with the comprehensive research of Andrews and Bonta (1998) who have developed an empirically-based set of treatment targets that has been linked with rehabilitation. These include: a) reducing anti-social peer involvement; b) promoting familial affection, communication and monitoring; c) preventing abuse/neglect; and, d) replacing aggression with pro-social alternatives. In addition to these, we would suggest targeting negative school attachment in order to improve behavior, attendance, performance, and attitudes towards educational achievement. 5.1 Additional future research This analysis was based on cross-sectional data from the National Longitudinal Survey of Children and Youth. It would be extremely valuable to use the longitudinal aspect of the data to develop a clearer sense of the temporal relationships between variables. As discussed, many factors demonstrate reciprocal relationships with delinquency. For example, it would be useful to determine if negative school behavior is exacerbated by delinquency and thus, further increases the likelihood of delinquency. Moreover, such an analysis would provide a glimpse into both the initiation process into criminal behavior and the abatement process out of criminal behavior. While it is understood that many youth simply age out of offending behavior (Moffitt, 1993), there may be identifiable differences between desisters and chronic offenders.
16
References
Andrews, D. A. & Bonta, J. (1998). The psychology of criminal conduct (2nd ed.). Cincinnati: Anderson Publishing. Bell, S. (1999). The influence of family, school, and peers on youth crime and delinquency. Young Offenders and Juvenile Justice A Century After the Fact. Toronto: ITP Nelson, pp. 145-164. Blaske, D., Borduin, C., Henggeler, W., & Mann, B. (1989). Individual, family, and peer characteristics of adolescent sex offenders and assaultive offenders. Developmental Psychology, 25, 846-855. Bor, W., Najman, J. M., O’Callaghan, M., Williams, G. M., & Anstey, K. (2001). Aggression and the development of delinquent behavior in children. Trends and Issues in Crime and Criminal Justice, 207. Canberra: Australian Institute of Criminology. Farrington, D. P. (1989). Early predictors of adolescent aggression and adult violence. Violence and Victims, 4(2), 79-100. Glueck, S. & Glueck, E. (1950). Unraveling juvenile delinquency. New York: Commonwealth Fund. Glueck, S. & Glueck, E. (1968). Delinquents and nondelinquents in perspective. Cambridge: Harvard University Press. Gomme, I. M. (1985). Predictors of status and criminal offences among male and female adolescents in an Ontario community. Canadian Journal of Criminology, 27(2), 147-159. Hawkins, J. D., Herrenkohl, T., Farrington, D.P., Brewer, D., Catalano, R. F., & Harachi, T. W. (1998). A review of predictors of youth violence. In Loeber, R. & Farrington, D. P. (eds.) Serious and violent juvenile offenders. Risk factors and successful interventions. Thousand Oaks: SAGE Publications, pp. 106-146. Hoge, R. D., Andrews, D. A., & Leschied, A. W. (1996). An investigation of risk and protective factors in a sample of youthful offenders. Journal of Child Psychiatry, 37(4), 419-424. Laub, J. H. & Lauritsen, J. L. (1993). Violent criminal behavior over the life course: A review of the longitudinal and comparative research. Violence and Victims, 8, 235-252. Lawrence, R. (1991). School performance, peers and delinquency: Implications for juvenile justice. Juvenile and Family Court Journal, 42(3), 59-69.
Youth Justice Research Series / Department of Justice Canada 17
The Correlates of Self-Reported Delinquency: An Analysis of the National Longitudinal Survey of Children and Youth Lipsey, M. W. & Derzon, J. H. (1998). Predictors of violent or serious delinquency in adolescence and early adulthood. In Loeber, R., & Farrington, D. P. (eds.) Serious and Violent juvenile offenders. Risk factors and Successful interventions. Thousand Oaks: SAGE publications, pp. 86-105. Loeber, R. & Stouthamer-Loeber, M. (1986). Family factors as correlates and predictors of juvenile conduct problems and delinquency. In Tonry, M. & Morris, N. (eds.). Crime and Justice. An Annual Review of Research, 7. Chicago: University of Chicago Press, 29-149. Loeber, R., Stouthamer-Loeber, M., Van Kammen, W., & Farrington, D. P. (1991). Initiation, escalation and desistance in juvenile offending and their correlates. Journal of Criminal Law and Criminology, 82(1), 36-82. Malinosky-Rummell, R.& Hansen, D. (1993). Long-term consequences of childhood physical abuse. Psychological Bulletin, 114, 68-79. Matsueda, R. L. & Anderson, K. (1998). The dynamics of delinquent peers and delinquent behavior. Criminology, 36(2), 269-308. McCord, J. (1991). Family relationships, juvenile delinquency, and adult criminality. Criminology, 29(3), 397-417. McCord, J., Widom Spatz, C., & Crowell, N. (2001). Juvenile crime, juvenile justice. Washington, D. C.: National Academy Press. Chapter 3, pp. 66-106. McLaren, K.L. (2000). Tough is not enough- Getting smart about youth crime. A review of research on what works to reduce offending by young people. Wellington, N. Z.: Ministry of Youth Affairs. Moffitt, T. E. (1993). Adolescence-limited and life-course-persistent antisocial behavior: A developmental taxonomy. Psychological Review, 100(4), 674-701. Oddone-Paolucci, E., Violato, C., & Wilkes, C. (2000). A stepwise discriminant analysis of delinquent and nondelinquent youth. In Violato, C., Oddone-Paolucci, E., & Genius, M. (eds.) The changing family and child development. Vermont: Ashgate Publishing Co. Rankin, J. H. & Wells, L. E. (1990). The effect of parental attachments and direct controls on delinquency. Journal of Research in Crime and Delinquency, 27(2), 140-165. Scudder, R. G., Blount, W. R., Heide, K. M., Silverman, I. J. (1993). Important links between child abuse, neglect, and delinquency. International Journal of Offender Therapy and Comparative Criminology, 37(4), 315-323.
18
Smith, D. A., Visher, C. A., & Jarjoura, G. R. (1991). Dimensions of delinquency: Exploring the correlates of participation, frequency, and persistence of delinquent behavior. Journal of Research in Crime and Delinquency, 28(1), 6-32. Statistics Canada. (2002). National Longitudinal Survey of Children and Youth: Cycle III Guide. Ottawa: Statistics Canada. Stevenson, K., Tufts, J., Hendrick, D., & Kowalski, M. (1998). A profile of youth justice in Canada. Catalogue no. 85-544-XPE, Ottawa: Statistics Canada, Canadian Centre for Justice Statistics. Stewart. A., Dennison, S., & Waterson, E. (2002). Pathways from child maltreatment to juvenile offending. Canberra: Criminology Research Council. Available at: www.aic.gov.au/crc/reports/stewart.html Stouthamer-Loeber, M., Loeber, R., Farrington, D. P., Zhang, Q., Van Kammen, W., & Maguin, E. (1993). The double edge of protective and risk factors for delinquency: Interrelations and developmental patterns. Developmental and Psychopathology, 5, 683-701. Thornberry, T. P., Huizinga, D., & Loeber, R. (1995). The prevention of serious delinquency and violence. Implications from the program of research on the causes and correlates of delinquency. In Howell, J., Krisberg, B., Hawkins, J., & Wilson, J. (eds.) A source book. Serious, violent and chronic juvenile offenders. Thousand Oaks: SAGE Publications, pp. 213-237. Thornberry, T. P., Lizotte, A. J., Krohn, M. D., Farnworth, M., & Jang, S. J. (1991). Testing interactional theory: An examination of reciprocal causal relationships among family, school, and delinquency. Journal of Criminal Law and Criminology, 82(1), 3-28. Thornberry, T. P., Lizotte, A. J., Krohn, M. D., Farnworth, M., & Jang, S. J. (1994). Delinquent Peers, Beliefs, and Delinquent Behavior: A longitudinal test of international theory. Criminology, 32, 601-637. Tittle, C. R. & Meier, R. F. (1991). Specifying the SES/delinquency relationship by characteristics of contexts. Journal of Research on Crime and Delinquency, 28(4), 430-455. Warr, M. (1993). Age, peers, and delinquency. Criminology, 31(1), 17-40. Widom, C. (1989). Does violence beget violence? A critical examination of the literature. Psychological Review, 106(1), 3-28.
Youth Justice Research Series / Department of Justice Canada 19
The Correlates of Self-Reported Delinquency: An Analysis of the National Longitudinal Survey of Children and Youth Wilkström, P. H., & Loeber, R. (2000). Do disadvantaged neighbourhoods cause well-adjusted children to become adolescent delinquents? A study of male juvenile serious offending, individual risk and protective factors, and neighborhood context. Criminology, 38(4), pp.1109-1142. Zingraff, M. T., Leiter, J., Myers, K. A., & Johnsen, M. C. (1993). Child maltreatment and youthful problem behavior. Criminology, 31(2), 173-202.
20
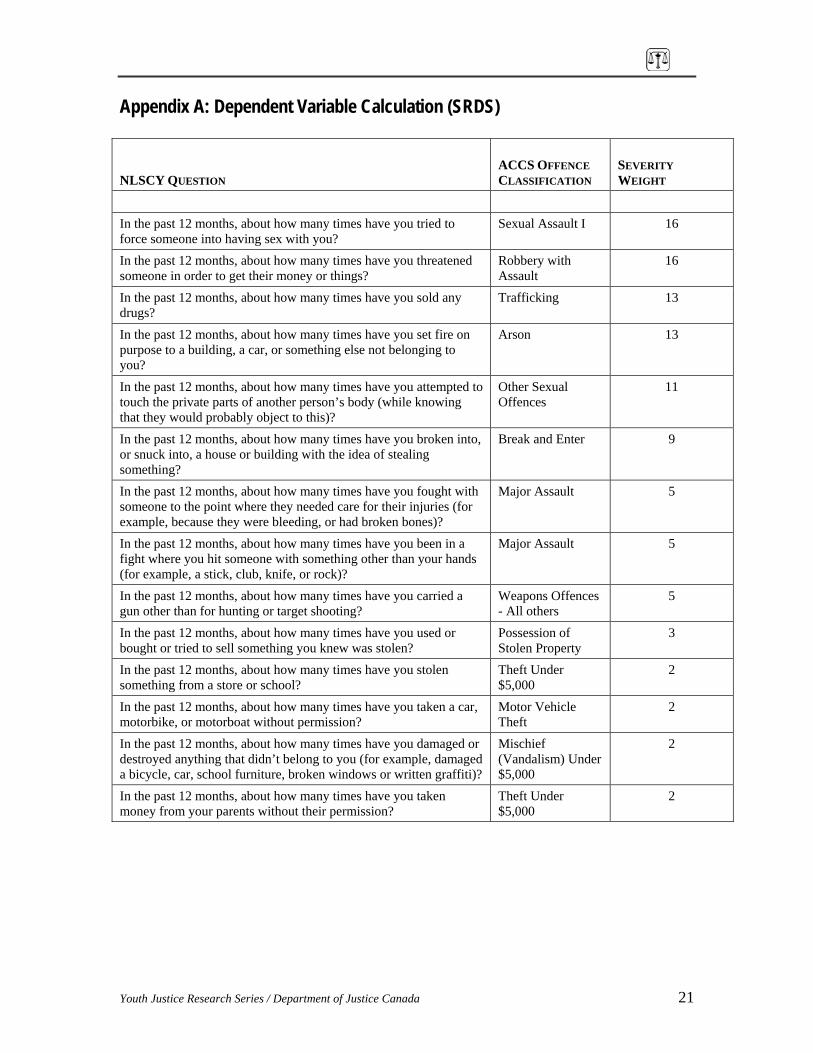
Appendix A: Dependent Variable Calculation (SRDS)
NLSCY QUESTION
ACCS OFFENCE CLASSIFICATION
SEVERITY WEIGHT
In the past 12 months, about how many times have you tried to force someone into having sex with you?
Sexual Assault I 16
In the past 12 months, about how many times have you threatened someone in order to get their money or things?
Robbery with Assault
16
In the past 12 months, about how many times have you sold any drugs?
Trafficking 13
In the past 12 months, about how many times have you set fire on purpose to a building, a car, or something else not belonging to you?
Arson 13
In the past 12 months, about how many times have you attempted to touch the private parts of another person’s body (while knowing that they would probably object to this)?
Other Sexual Offences
11
In the past 12 months, about how many times have you broken into, or snuck into, a house or building with the idea of stealing something?
Break and Enter 9
In the past 12 months, about how many times have you fought with someone to the point where they needed care for their injuries (for example, because they were bleeding, or had broken bones)?
Major Assault 5
In the past 12 months, about how many times have you been in a fight where you hit someone with something other than your hands (for example, a stick, club, knife, or rock)?
Major Assault 5
In the past 12 months, about how many times have you carried a gun other than for hunting or target shooting?
Weapons Offences - All others
5
In the past 12 months, about how many times have you used or bought or tried to sell something you knew was stolen?
Possession of Stolen Property
3
In the past 12 months, about how many times have you stolen something from a store or school?
Theft Under $5,000
2
In the past 12 months, about how many times have you taken a car, motorbike, or motorboat without permission?
Motor Vehicle Theft
2
In the past 12 months, about how many times have you damaged or destroyed anything that didn’t belong to you (for example, damaged a bicycle, car, school furniture, broken windows or written graffiti)?
Mischief (Vandalism) Under $5,000
2
In the past 12 months, about how many times have you taken money from your parents without their permission?
Theft Under $5,000
2
Youth Justice Research Series / Department of Justice Canada 21