Embed Size (px)
DESCRIPTION
The Cost of Doing Business in Africa Evidence from the Investment Climate Survey Data. Vijaya Ramachandran* - PowerPoint PPT Presentation
Citation preview
The Cost of Doing Business in AfricaEvidence from the Investment Climate Survey Data
Vijaya Ramachandran*
*This presentation is based on research jointly carried out with Alan Gelb, Benn Eifert, and Manju Kedia Shah, based on investment climate surveys carried out by the Regional Program on Enterprise Development, Africa Private Sector Group, The World Bank. The views expressed in this presentation are those of the authors, and not necessarily of the institutions they are affiliated with.
Investment Climate Surveys
This presentation is based on research using the World Bank’s Investment Climate Database.
Since 2001, private enterprises in South Africa, Senegal, Mali, Madagascar, Mauritius, Nigeria, Mozambique, Uganda, Kenya, Tanzania, Zambia, Ethiopia, and Eritrea have been surveyed; a sub-sample of these countries is used for this presentation.
Information is collected on cost of production, access to credit, labor, and the business environment (including infrastructure, government regulations, and crime and corruption), for about 400 firms in each country.
The focus of today’s presentation…
In this presentation, I will look at some key aspects of the investment climate, including access to infrastructure and government regulations.
I will argue that “factory-floor” productivity in Africa is not that low compared with China, but when investment climate variables are factored into costs, Africa’s productivity falls to very low levels.
I will also argue that small and indigenous firms face greater constraints, which need to be addressed via targeted interventions.
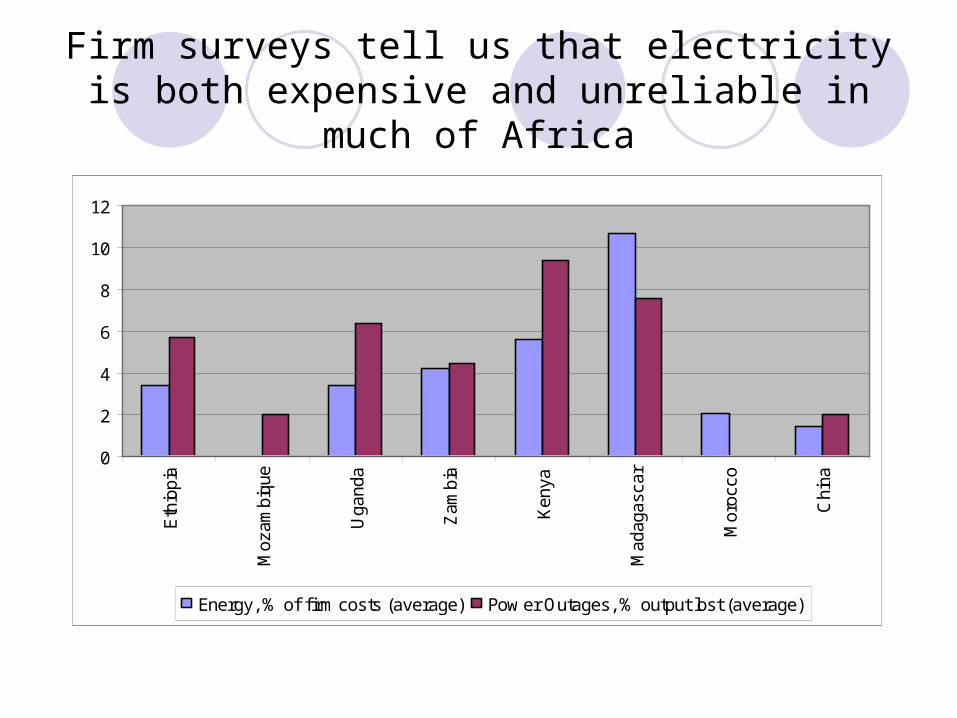
Firm surveys tell us that electricity is both expensive and unreliable in much of Africa
0
2
4
6
8
10
12
Eth
iopi
a
Moz
ambi
que
Uga
nda
Zam
bia
Ken
ya
Mad
agas
car
Mor
occo
Chi
na
Energy, % of f irm costs (average) Pow er Outages, % output lost (average)
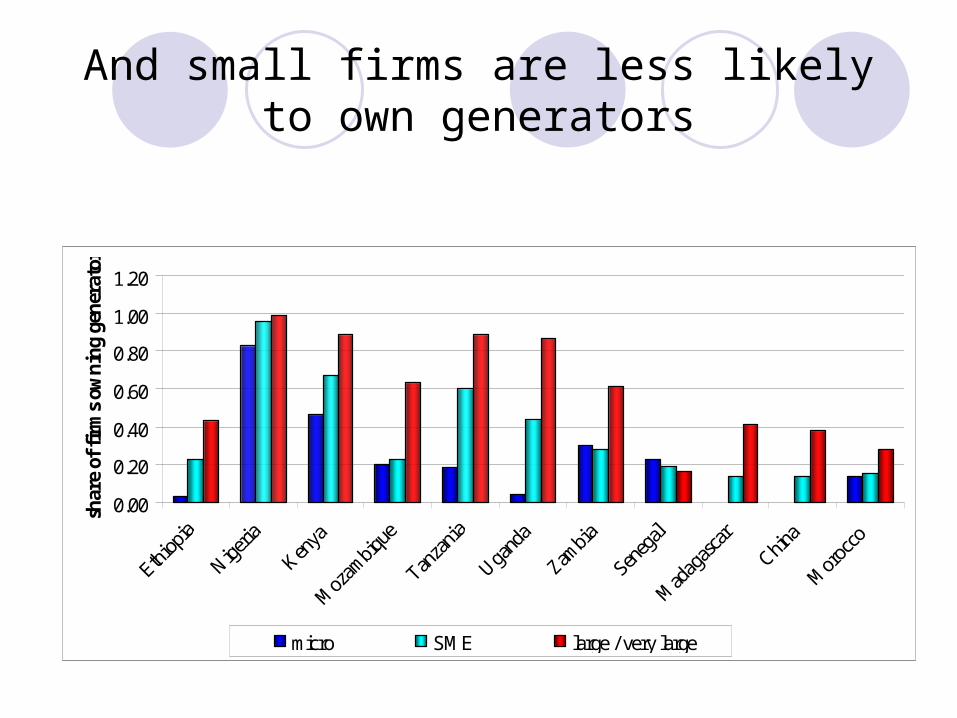
And small firms are less likely to own generators
0.00
0.20
0.40
0.60
0.80
1.00
1.20
Ethiop
ia
Nigeria
Kenya
Moz
ambiq
ue
Tanza
nia
Ugand
a
Zambi
a
Seneg
al
Mad
agas
car
China
Mor
occo
shar
e of
fir
ms
own
ing
gen
erat
or
micro SME large / very large

0
10
20
30
40
50
60
Phone lines Electricityconnection
Water connection
The waiting time for utility connections is very long in Africa compared to China….
(median value in days, in the past 2 years)
Kenya
Tanzania
Uganda
Zambia
China
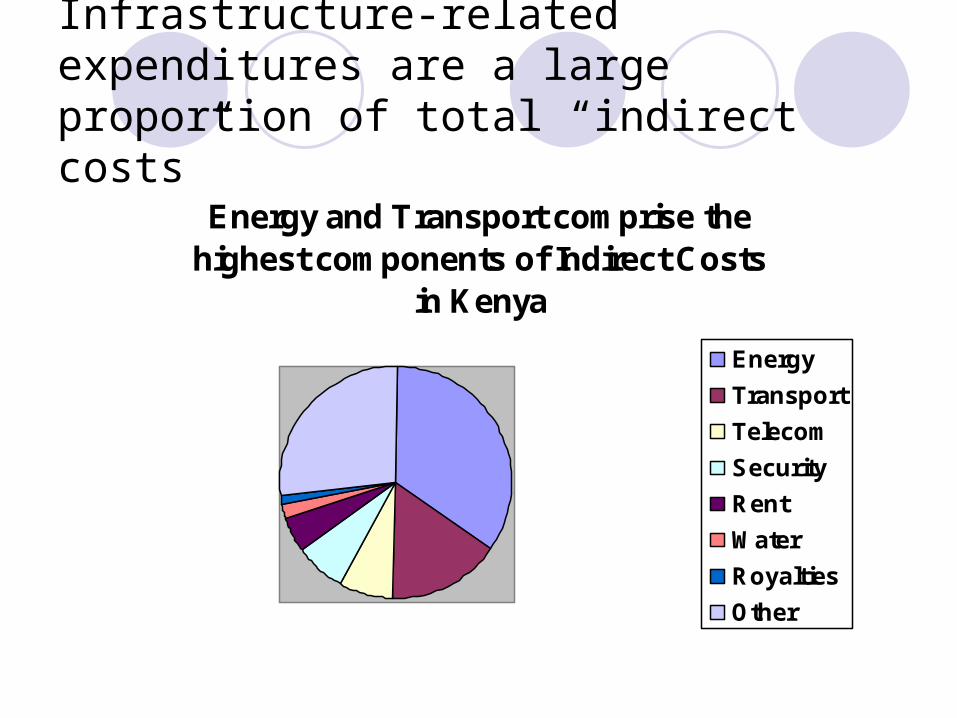
Infrastructure-related expenditures are a large proportion of total “indirect costs”
Energy and Transport comprise the highest components of Indirect Costs
in Kenya
Energy
Transport
Telecom
Security
Rent
Water
Royalties
Other

The time to clear goods at port is several days in many countries in Africa
02468
101214161820
Ethiop
ia
Moz
ambiq
ue
Nigeria
Ugand
a
Zambia
Kenya
Mad
agas
car
Mor
occo
China
India
Days to clear imports, median Days to clear exports, median
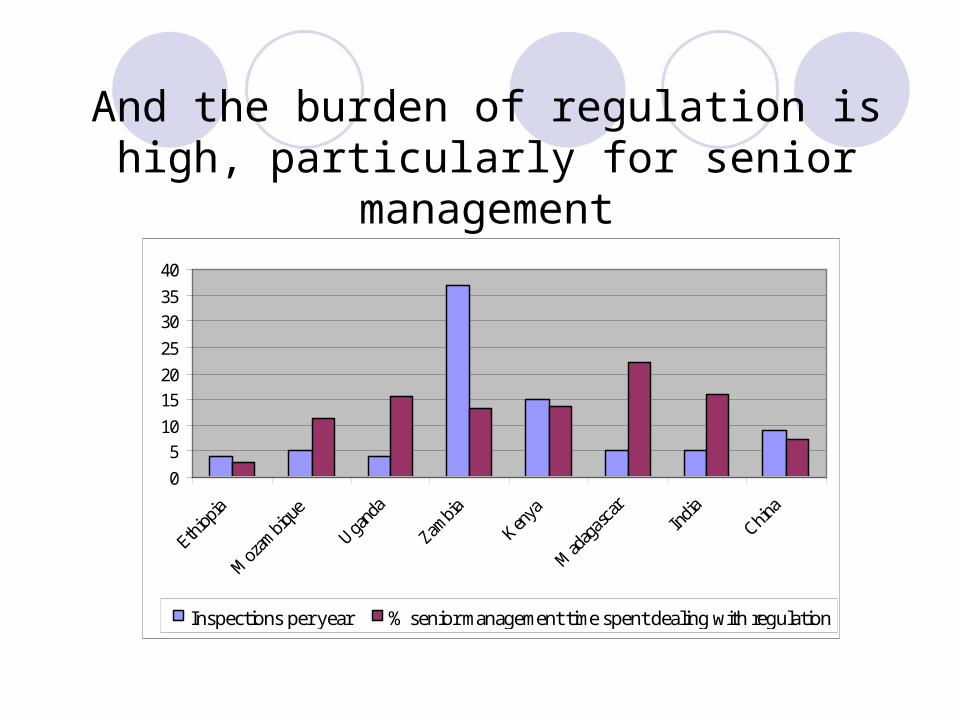
And the burden of regulation is high, particularly for senior management
0
5
10
15
20
25
30
35
40
Inspections per year % senior management time spent dealing with regulation
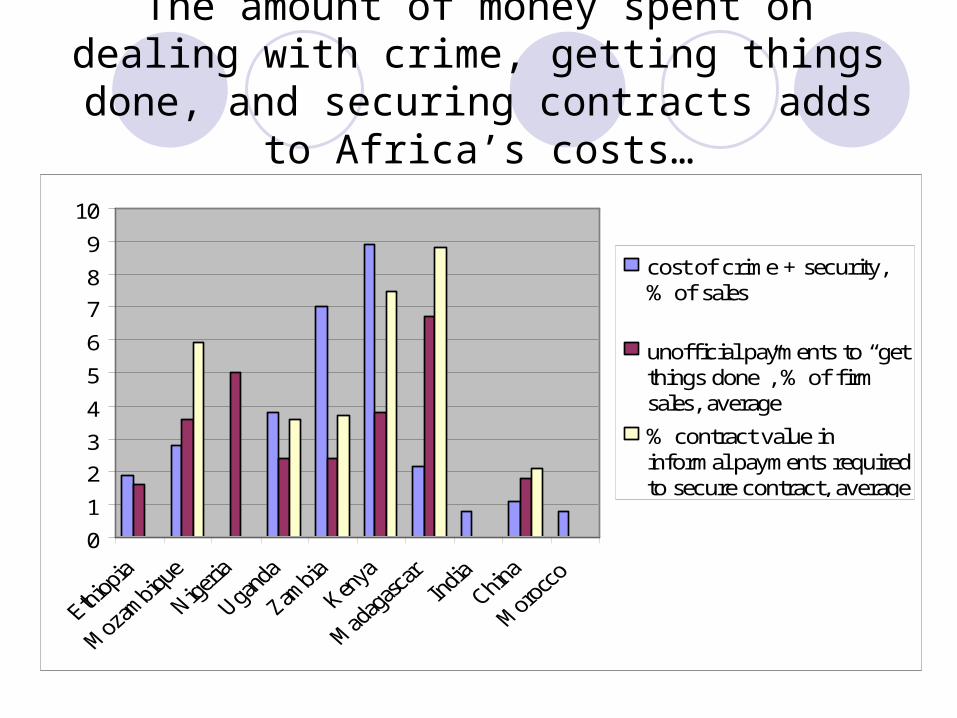
The amount of money spent on dealing with crime, getting things done, and securing
contracts adds to Africa’s costs…
Unofficial Payments and Informal Payments
0
1
2
3
4
5
6
7
8
9
10
cost of crime + security,% of sales
unofficial payments to “getthings done”, % of firmsales, average
% contract value ininformal payments requiredto secure contract, average
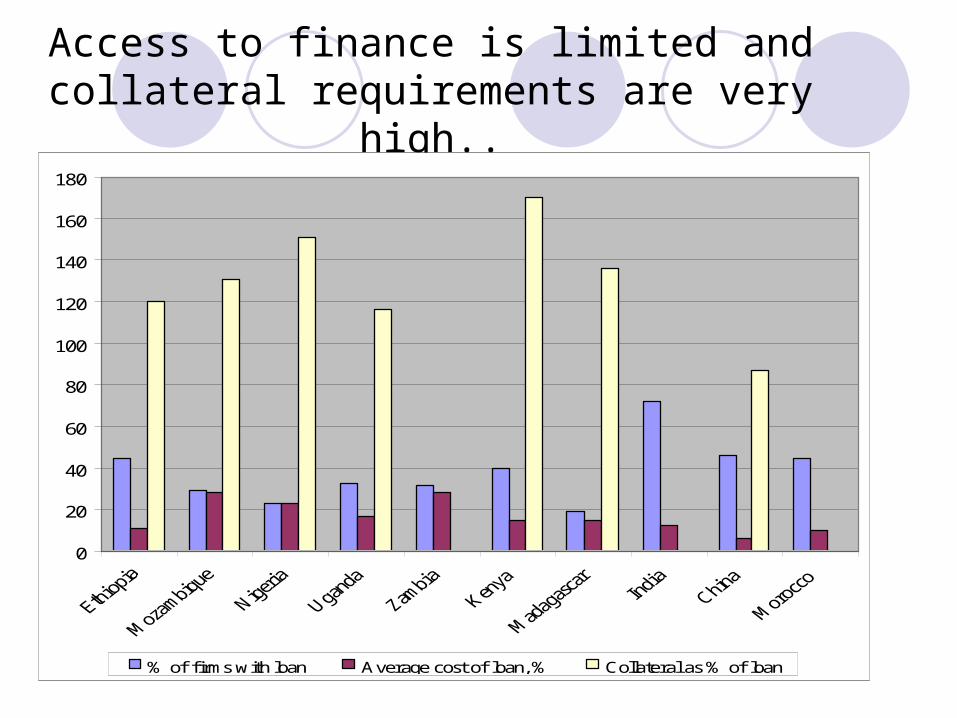
Access to finance is limited and collateral requirements are very high..
0
20
40
60
80
100
120
140
160
180
% of firms with loan Average cost of loan, % Collateral as % of loan
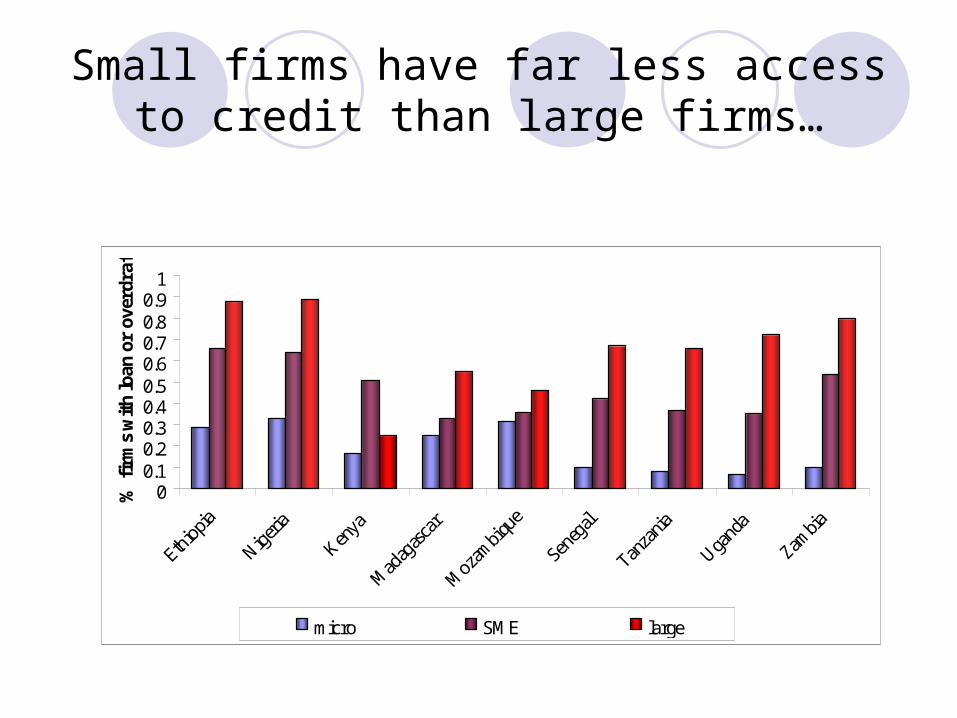
Small firms have far less access to credit than large firms…
00.10.20.30.40.50.60.70.80.9
1
Ethio
pia
Nigeri
a
Kenya
Mad
agas
car
Moza
mbi
que
Seneg
al
Tanza
nia
Uganda
Zambia
% f
irm
s w
ith
loan
or
over
draf
t
micro SME large
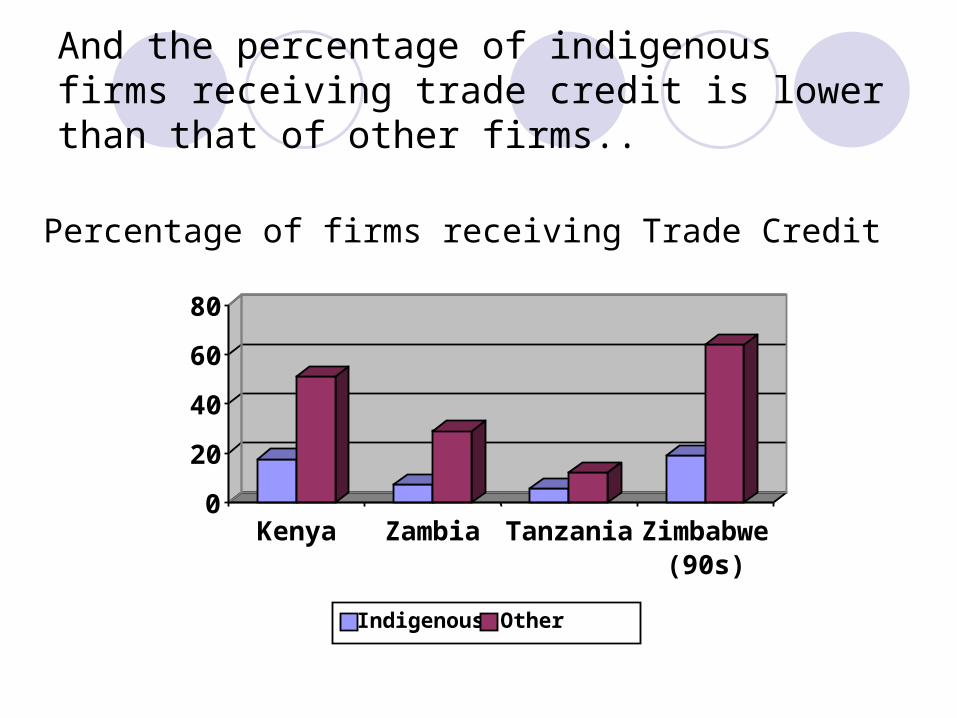
And the percentage of indigenous firms receiving trade credit is lower than that of other firms..
0
20
40
60
80
Kenya Zambia Tanzania Zimbabwe(90s)
Percentage of firms receiving Trade Credit
Indigenous Other
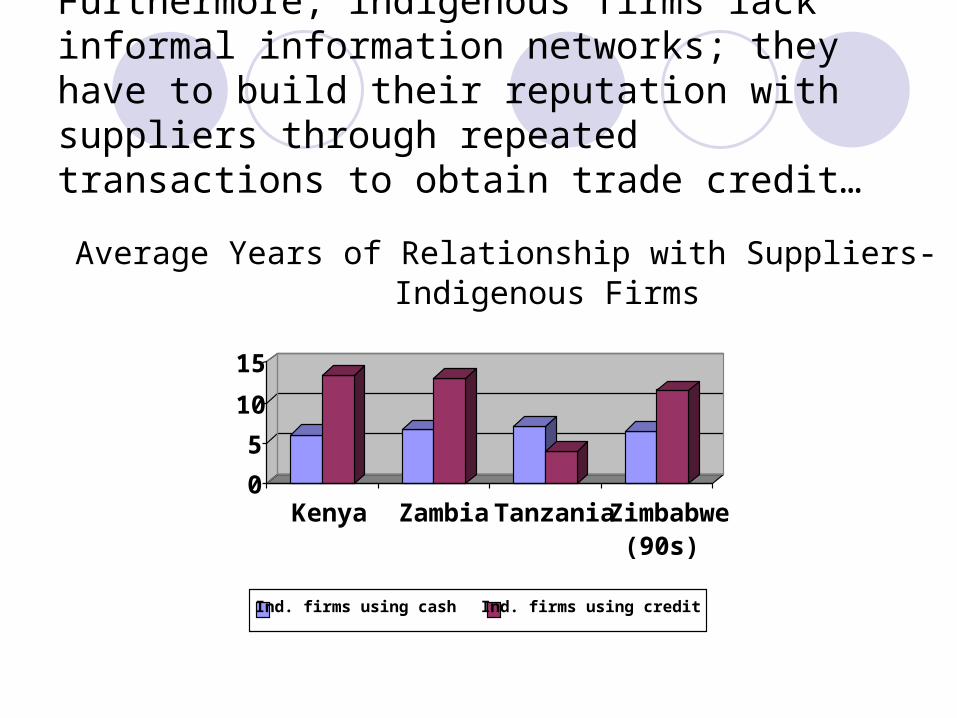
Furthermore, indigenous firms lack informal information networks; they have to build their reputation with suppliers through repeated transactions to obtain trade credit…
0
5
10
15
Kenya Zambia TanzaniaZimbabwe(90s)
Average Years of Relationship with Suppliers- Indigenous Firms
Ind. firms using cash Ind. firms using credit
What are the consequences of these investment climate characteristics for the African private sector?
Let us look at the impact on the productivity of firms, measuring Africa in comparative perspective…
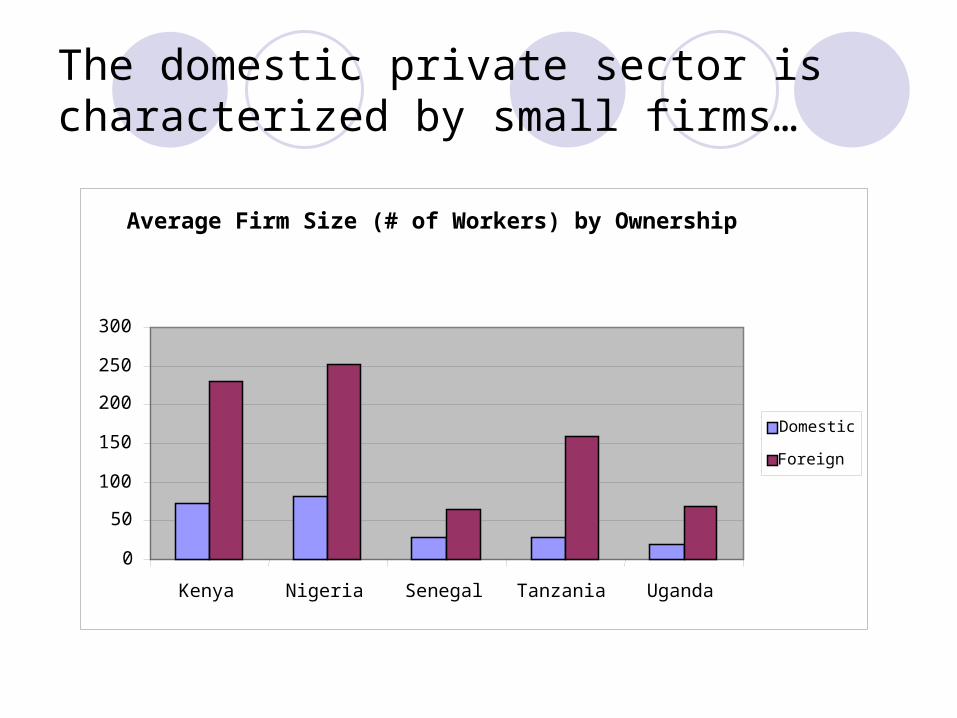
The domestic private sector is characterized by small firms…
Average Firm Size (# of Workers) by Ownership
0
50
100
150
200
250
300
Kenya Nigeria Senegal Tanzania Uganda
Domestic
Foreign
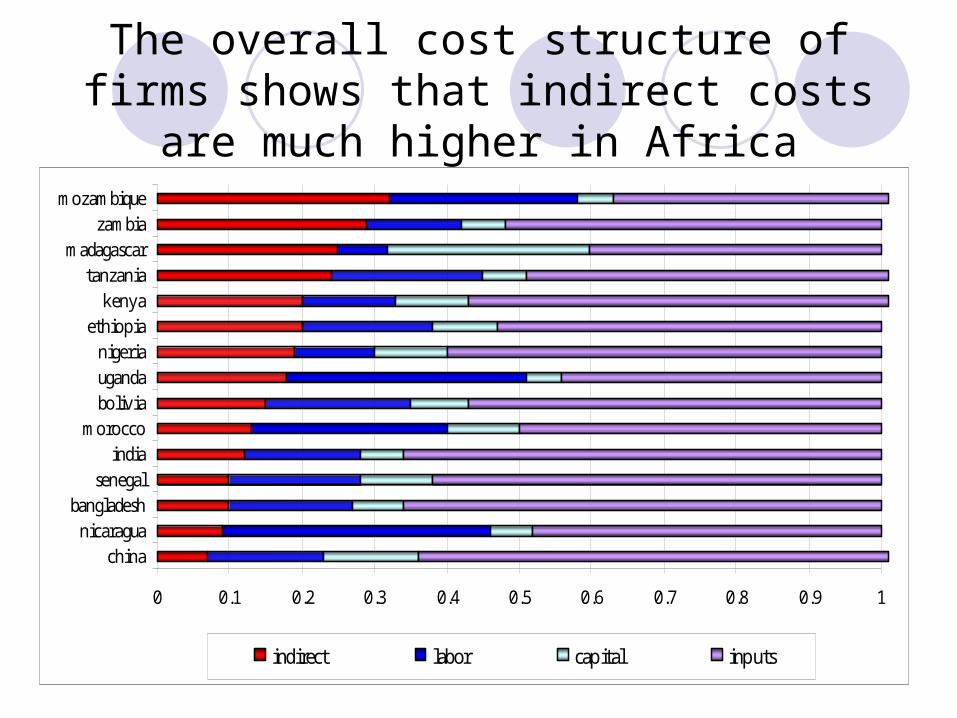
The overall cost structure of firms shows that indirect costs are much higher in Africa
0 0.1 0.2 0.3 0.4 0.5 0.6 0.7 0.8 0.9 1
chinanicaragua
bangladeshsenegal
indiamorocco
boliviaugandanigeria
ethiopiakenya
tanzaniamadagascar
zambiamozambique
indirect labor capital inputs
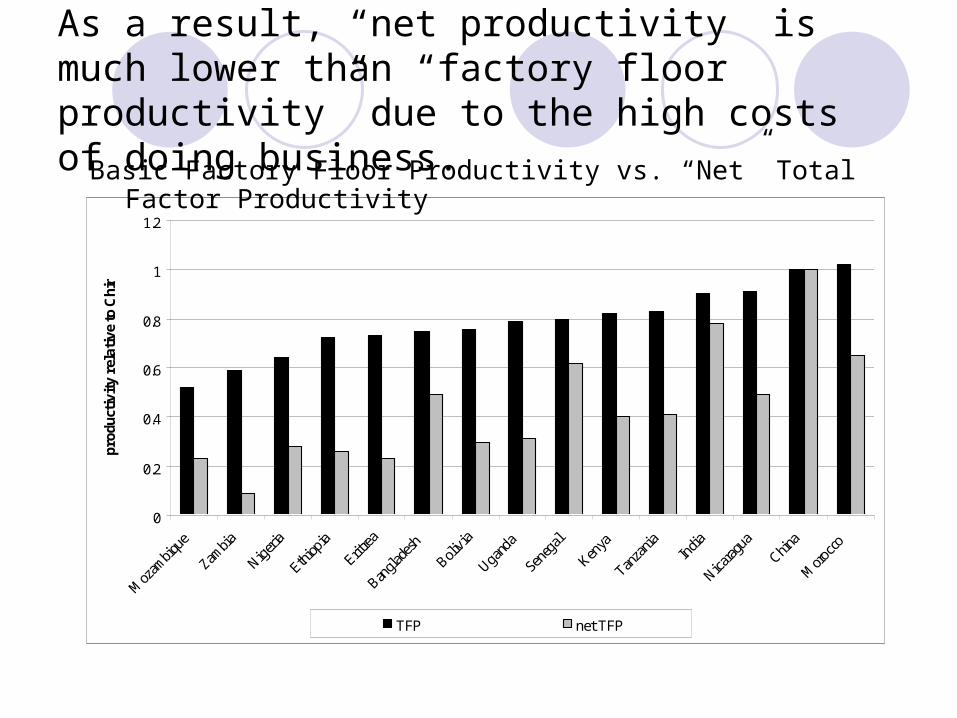
As a result, “net productivity” is much lower than “factory floor productivity” due to the high costs of doing business.
0
0.2
0.4
0.6
0.8
1
1.2
Moz
ambiq
ue
Zambia
Nigeri
a
Ethiop
ia
Eritrea
Bangla
desh
Bolivia
Uganda
Seneg
al
Kenya
Tanza
niaIn
dia
Nicarag
uaChin
a
Moro
cco
prod
ucti
vity
rel
ativ
e to
Chi
na
TFP net TFP
Basic Factory Floor Productivity vs. “Net” Total Factor Productivity
What are some of the key interventions that are necessary to raise productivity in Africa?
Scaling up infrastructure, to lower energy and transport costs, will benefit ALL firms.
Of particular interest is the INGA hydropower scheme, led by Eskom and other utility companies.
Advantage of low-cost labor often offset by poor power supply, resulting in investors going elsewhere—we need more generating capacity.
Improving Access to Finance
Targeted interventions towards helping small and medium sized firms get access to loans (e.g. the World Bank/IFC Small and Medium Enterprise Project or the very innovative kiva.org)
Increasing access to finance by creating credit bureaus or other mechanisms by which firms can be properly evaluated.
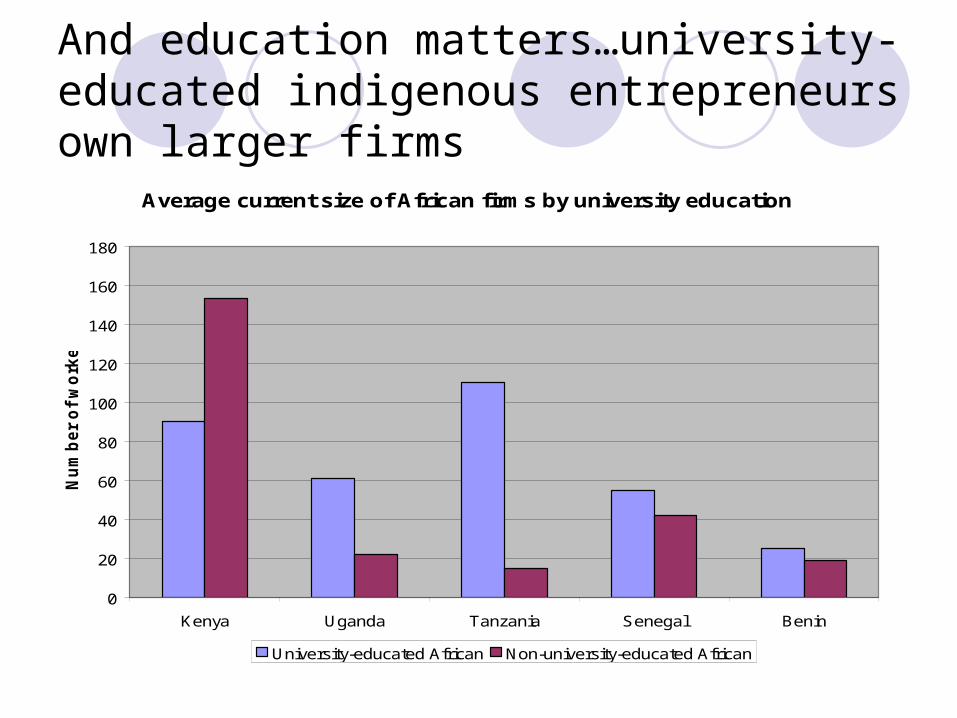
And education matters…university-educated indigenous entrepreneurs own larger firms
Average current size of African firms by university education
0
20
40
60
80
100
120
140
160
180
Kenya Uganda Tanzania Senegal Benin
Nu
mb
er
of
wo
rkers
University-educated African Non-university-educated African

Education Matters…
The International Finance Corporation has launched the Global Business School Network--a public-private partnership to strengthen and expand managerial education in Africa and elsewhere (http://www.ifc.org/gbsn)
Institutions such as WPI can play a role in training entrepreneurs
We have also found that relevant training, provided by the firm, increases productivity
Conclusion
The importance and centrality of the private sector must be continuously stressed by the various parties involved in African development.
We need unwavering government commitment, active private sector participation, and engagement by researchers, donors, and civil society.
For more information, please visit www.worldbank.org/rped