Embed Size (px)
Citation preview
The Cost of Capital for Early‐Stage Biotechnology Ventures
Iain Cockburn and Josh LernerBoston University and Harvard University
Executive Summary
• Evidence shows that the Cost of Capital for venture backed early stage companies in life sciences is high: – Many estimates suggest 20% or higher
• This reflects investors’ expectation of a return sufficient to compensate them for taking on extraordinary risk
• Permanently lowering realized returns will lead to lower investment in a critical component of the life sciences industry
2
Purpose of Study
• Understanding cost of capital is critical in economic modeling of the impact of regulatory and policy changes on investment and industry economics:– For all publicly traded companies, all sectors, average is about around 10%
– Project seeks to understand whether this is appropriate for private biopharma companies
3
4
The Cost of Capital
• Cost of Capital is a critical benchmark for assessing commercial viability of a project– Measures opportunity cost of resources employed– Often used as a “hurdle rate of return” to decide whether to invest in a company
– Also used as a “discount rate” to evaluate future cash flows
• Outside investors will put money into venture funds only if they expect returns (IRR) > Cost of Capital
• Very important to get this right in evaluating the economics of long‐term, risky projects
5
The Cost of Capital (2)
• Combines (1) time value of money, (2) risk of not getting your money back– For large, diversified companies with predictable cash flows, typical Cost of Capital is about 10%
– For smaller companies facing significant (and non‐diversifiable) business and technology risk, Cost of Capital is much higher: here investors demand additional compensation for taking on higher risk (e.g., biotech startups)
6
Simple economics of biotech ventures
• Biotech has several challenging features for venture investors (1) Very long time to market (typically 10 years or more) (2) Very high levels of risk (fewer than 1% of drug candidates will make it to market)
(3) Large amounts of capital continually needed to move most technologies forward
(4) The few successful companies usually have a big development partner and/or an acquirer
• Compared to many other assets, venture investors need to take on more risk, hold illiquid investments, and wait longer for a return – and therefore require a higher rate of return= a high Cost of Capital
7
The biopharmaceutical “ecosystem”
• Drug development takes place within a complex web of interdependent organizations– universities/NIH, R&D “boutiques”, established biopharmaceutical companies, health care providers
• Venture‐backed companies play a critical role in filling the front end of the drug development pipeline (and in creating tools and platforms to make drug development faster/better/cheaper)– More than 50% of molecules that go into humans originate and are acquired from entrepreneurial companies
See e.g. Cockburn Health Affairs (2004)
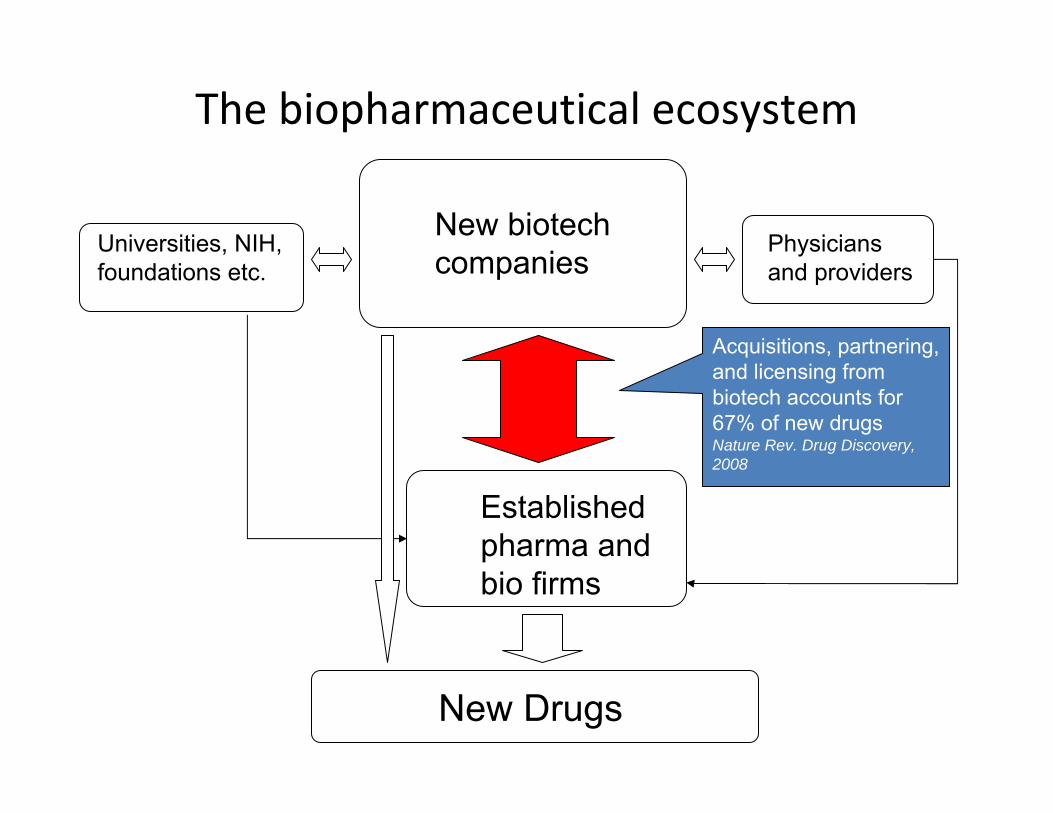
The biopharmaceutical ecosystem
New Drugs
New biotech companies
Established pharma and bio firms
Physicians and providers
Universities, NIH, foundations etc.
Acquisitions, partnering, and licensing from biotech accounts for 67% of new drugsNature Rev. Drug Discovery, 2008
9
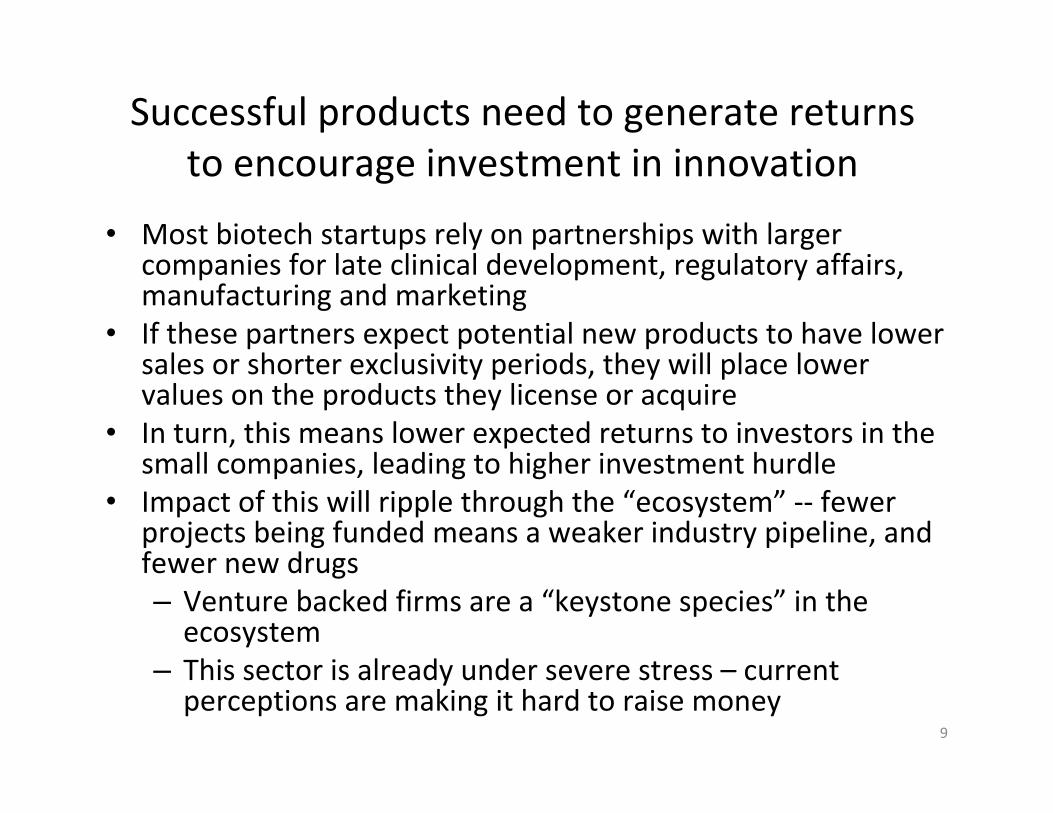
Successful products need to generate returnsto encourage investment in innovation
• Most biotech startups rely on partnerships with larger companies for late clinical development, regulatory affairs, manufacturing and marketing
• If these partners expect potential new products to have lower sales or shorter exclusivity periods, they will place lower values on the products they license or acquire
• In turn, this means lower expected returns to investors in the small companies, leading to higher investment hurdle
• Impact of this will ripple through the “ecosystem” ‐‐ fewer projects being funded means a weaker industry pipeline, and fewer new drugs– Venture backed firms are a “keystone species” in the ecosystem
– This sector is already under severe stress – current perceptions are making it hard to raise money
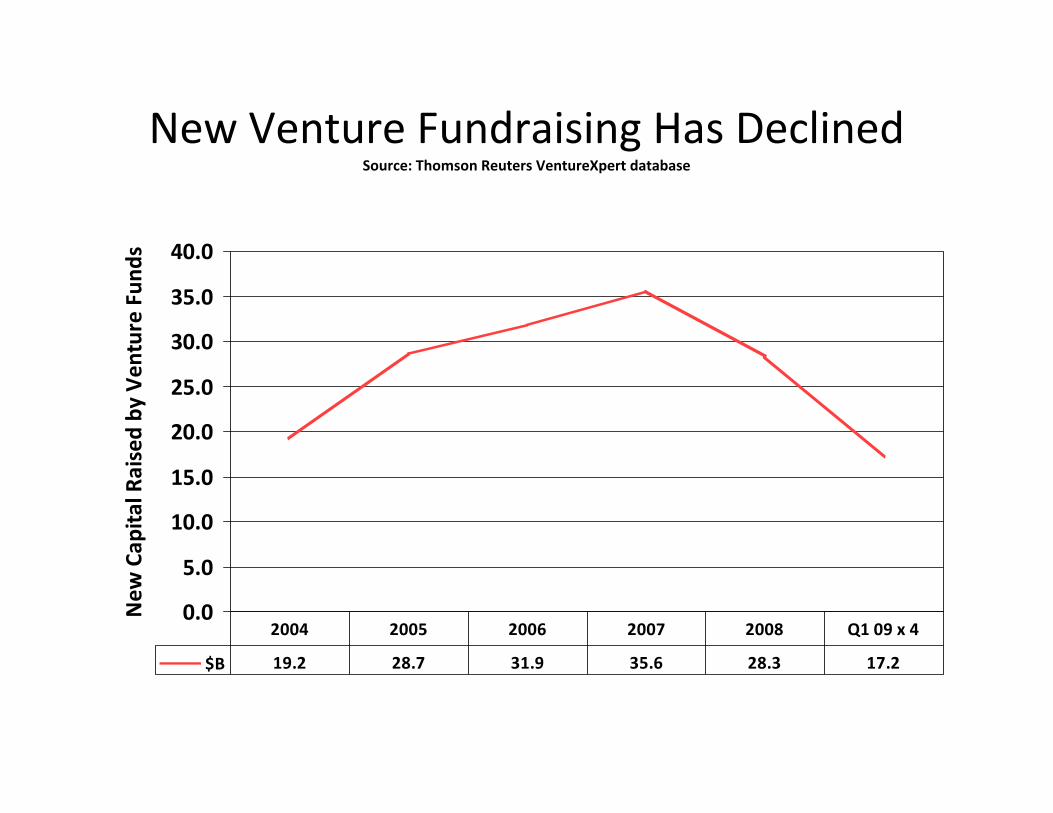
New Venture Fundraising Has DeclinedSource: Thomson Reuters VentureXpert database
0.0
5.0
10.0
15.0
20.0
25.0
30.0
35.0
40.0
New
Cap
ital R
aised by
Ven
ture Fun
ds
$B 19.2 28.7 31.9 35.6 28.3 17.2
2004 2005 2006 2007 2008 Q1 09 x 4
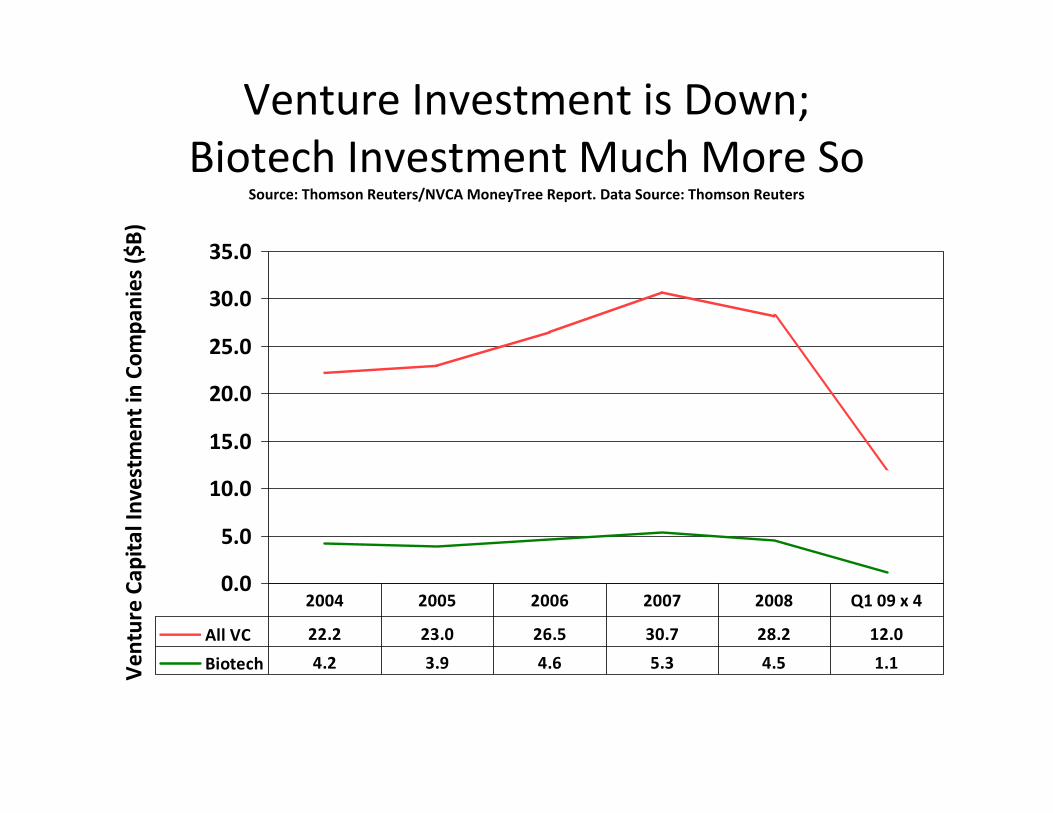
Venture Investment is Down; Biotech Investment Much More So
Source: Thomson Reuters/NVCA MoneyTree Report. Data Source: Thomson Reuters
0.0
5.0
10.0
15.0
20.0
25.0
30.0
35.0
Ven
ture Cap
ital Investm
ent in Co
mpa
nies ($
B)
All VC 22.2 23.0 26.5 30.7 28.2 12.0
Biotech 4.2 3.9 4.6 5.3 4.5 1.1
2004 2005 2006 2007 2008 Q1 09 x 4
12
What is the Cost of Capital for biotechnology ventures?
• Evidence on Cost of Capital comes from two principal sources– Actual returns realized on venture investments in biotech
• We assume that competitive supply of investment will drive realized average returns close to the Cost of Capital
– Unless investors get good returns, they won’t put more money in venture funds!
– “Expected” returns suggested by finance theory
13
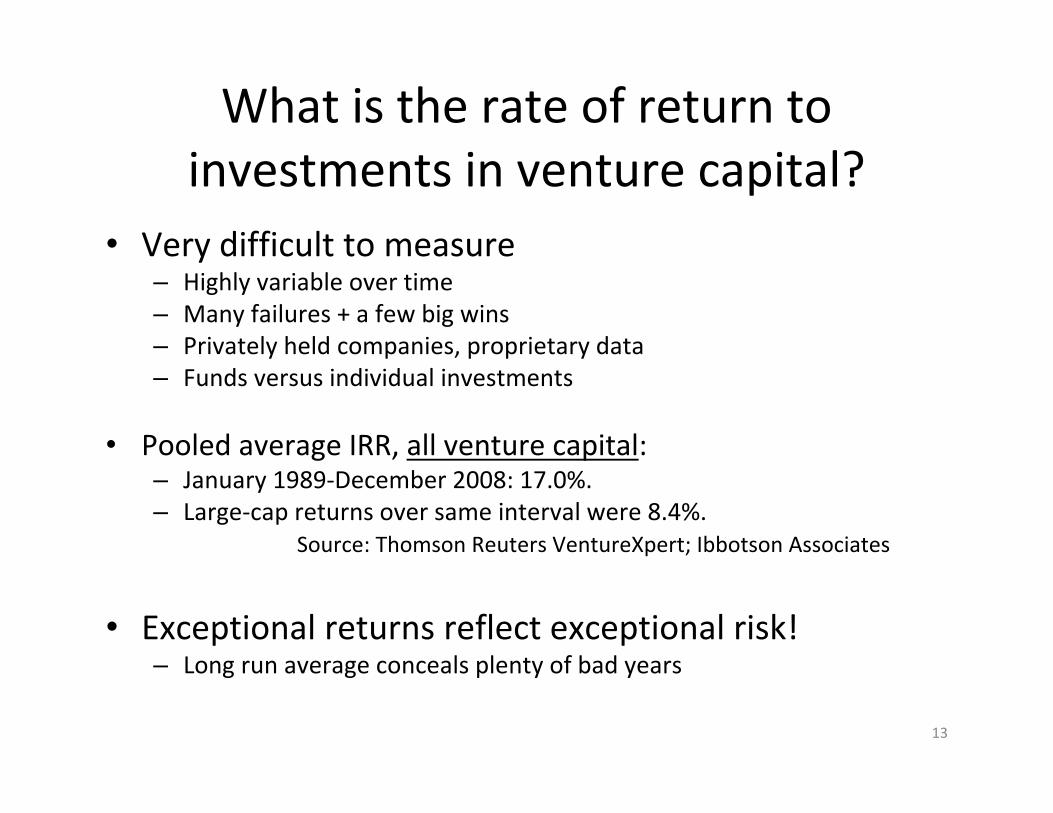
What is the rate of return to investments in venture capital?
• Very difficult to measure– Highly variable over time– Many failures + a few big wins– Privately held companies, proprietary data– Funds versus individual investments
• Pooled average IRR, all venture capital:– January 1989‐December 2008: 17.0%.– Large‐cap returns over same interval were 8.4%.
Source: Thomson Reuters VentureXpert; Ibbotson Associates
• Exceptional returns reflect exceptional risk!– Long run average conceals plenty of bad years
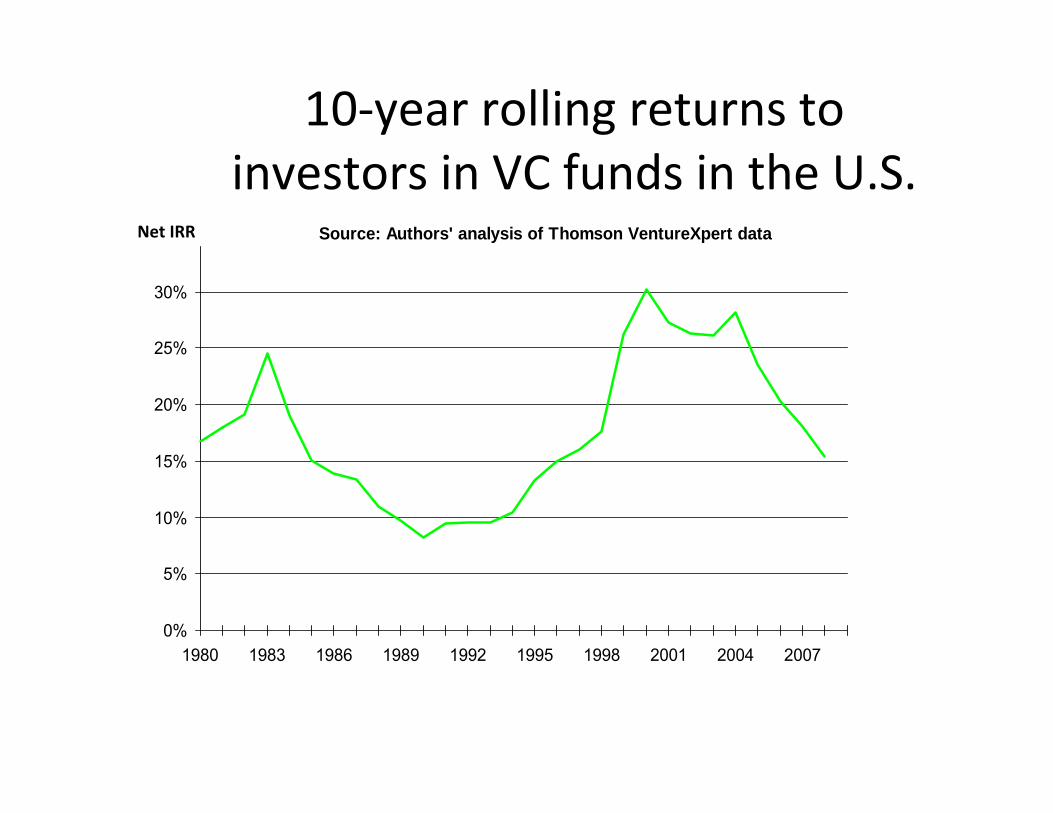
10‐year rolling returns to investors in VC funds in the U.S.
0%
5%
10%
15%
20%
25%
30%
1980 1983 1986 1989 1992 1995 1998 2001 2004 2007
Source: Authors' analysis of Thomson VentureXpert dataNet IRR
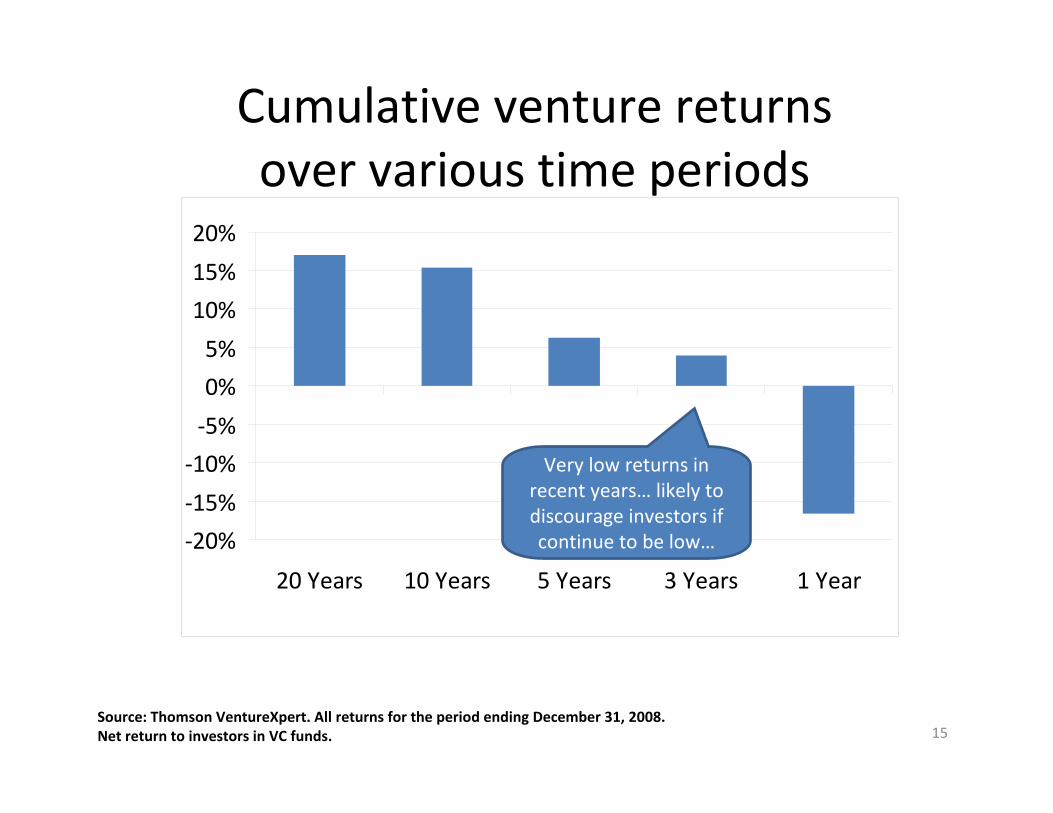
Cumulative venture returns over various time periods
‐20%
‐15%
‐10%
‐5%
0%
5%
10%
15%
20%
20 Years 10 Years 5 Years 3 Years 1 Year
15Source: Thomson VentureXpert. All returns for the period ending December 31, 2008. Net return to investors in VC funds.
Very low returns in recent years… likely to discourage investors if continue to be low…
Declining returns in recent periods• Dramatic drop in returns since bursting of “bubble” in 2000:– IPO exits have dried up
• Many observers have expressed concerns that venture ecosystem is under stress:– Institutions and individuals unlikely to invest at same rate unless can be assured of satisfactory returns
– Fallen public market valuations mean lower valuations of private companies
– Investor concerns about future outcomes
16
17
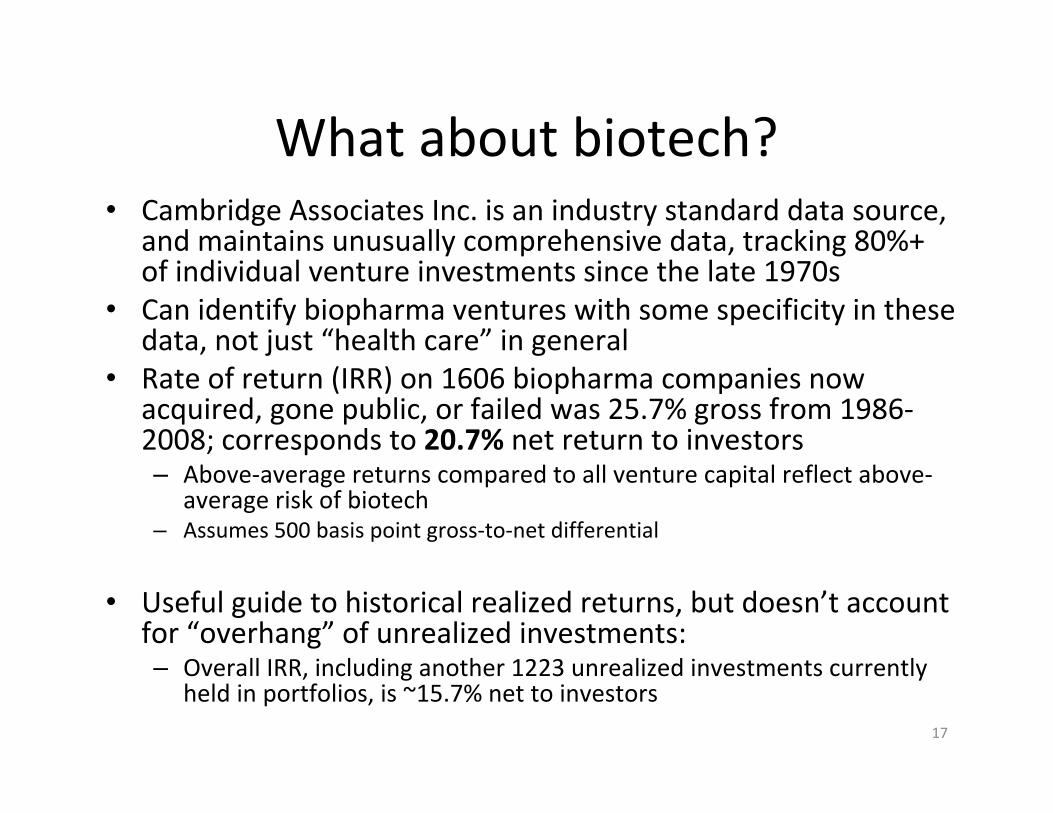
What about biotech?• Cambridge Associates Inc. is an industry standard data source,
and maintains unusually comprehensive data, tracking 80%+ of individual venture investments since the late 1970s
• Can identify biopharma ventures with some specificity in these data, not just “health care” in general
• Rate of return (IRR) on 1606 biopharma companies now acquired, gone public, or failed was 25.7% gross from 1986‐2008; corresponds to 20.7% net return to investors– Above‐average returns compared to all venture capital reflect above‐
average risk of biotech– Assumes 500 basis point gross‐to‐net differential
• Useful guide to historical realized returns, but doesn’t account for “overhang” of unrealized investments: – Overall IRR, including another 1223 unrealized investments currently
held in portfolios, is ~15.7% net to investors
18
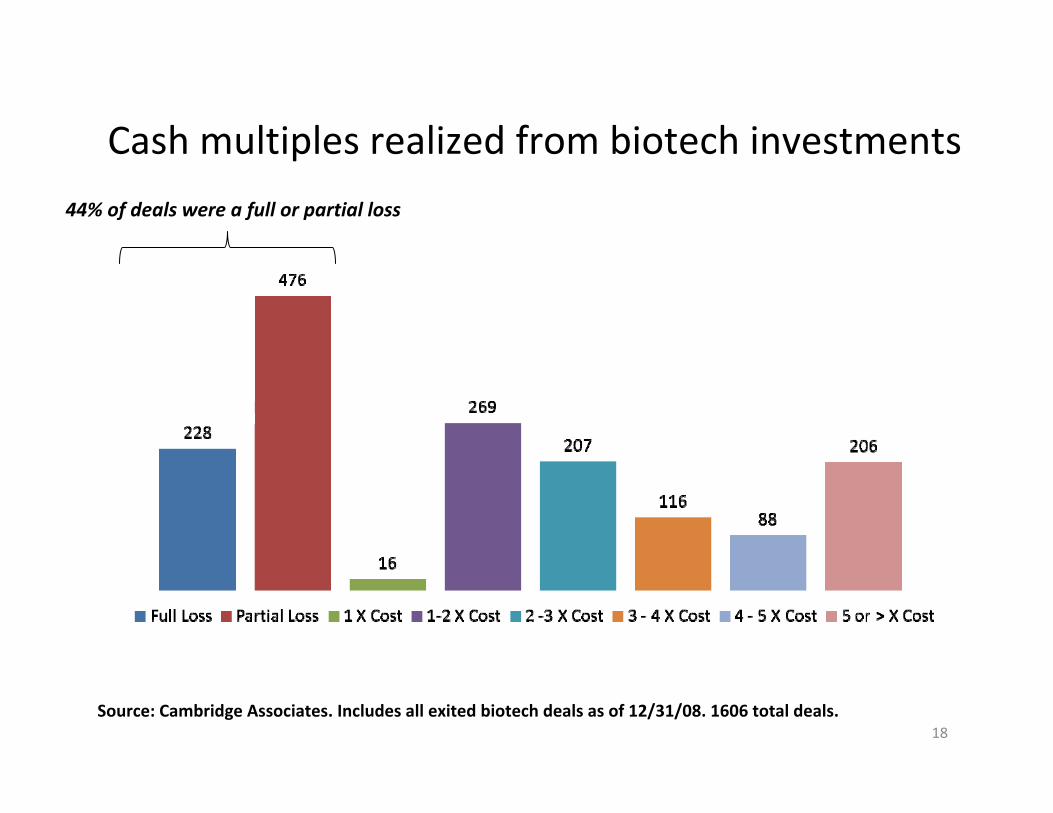
Cash multiples realized from biotech investments
Source: Cambridge Associates. Includes all exited biotech deals as of 12/31/08. 1606 total deals.
44% of deals were a full or partial loss
19
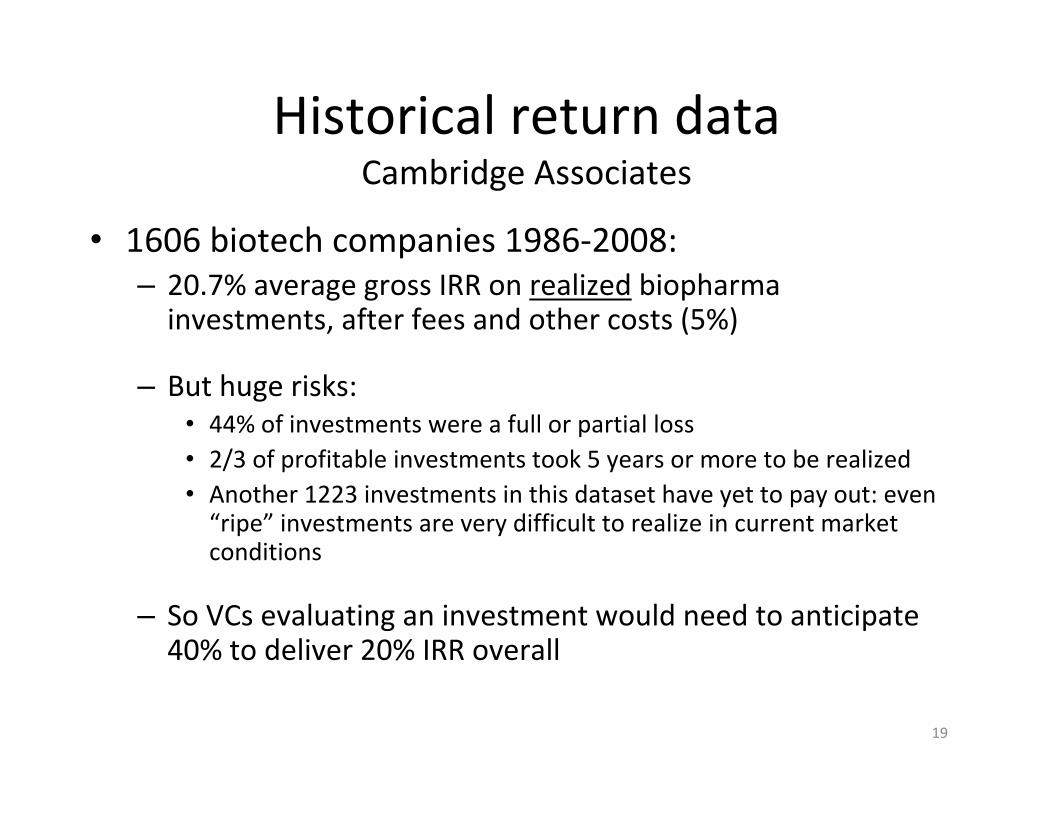
Historical return dataCambridge Associates
• 1606 biotech companies 1986‐2008:– 20.7% average gross IRR on realized biopharmainvestments, after fees and other costs (5%)
– But huge risks: • 44% of investments were a full or partial loss• 2/3 of profitable investments took 5 years or more to be realized• Another 1223 investments in this dataset have yet to pay out: even “ripe” investments are very difficult to realize in current market conditions
– So VCs evaluating an investment would need to anticipate 40% to deliver 20% IRR overall
20
Where do these returns come from?
Willingness of investors to
1. Take on huge risks: 44% of investments were a full or partial loss!
2. Hold illiquid investments for a long time: 2/3 of profitable investments took 5 years or more to be realized
21
How does this relate to Cost of Capital?
• Realized rates of return indicate how much venture‐backed companies need to “pay” for outside capital
• Theory of corporate finance tells us how to measure Cost of Capital more rigorously in terms of the rate of return investors expected at the time of the investment, using the “CAPM” model
22
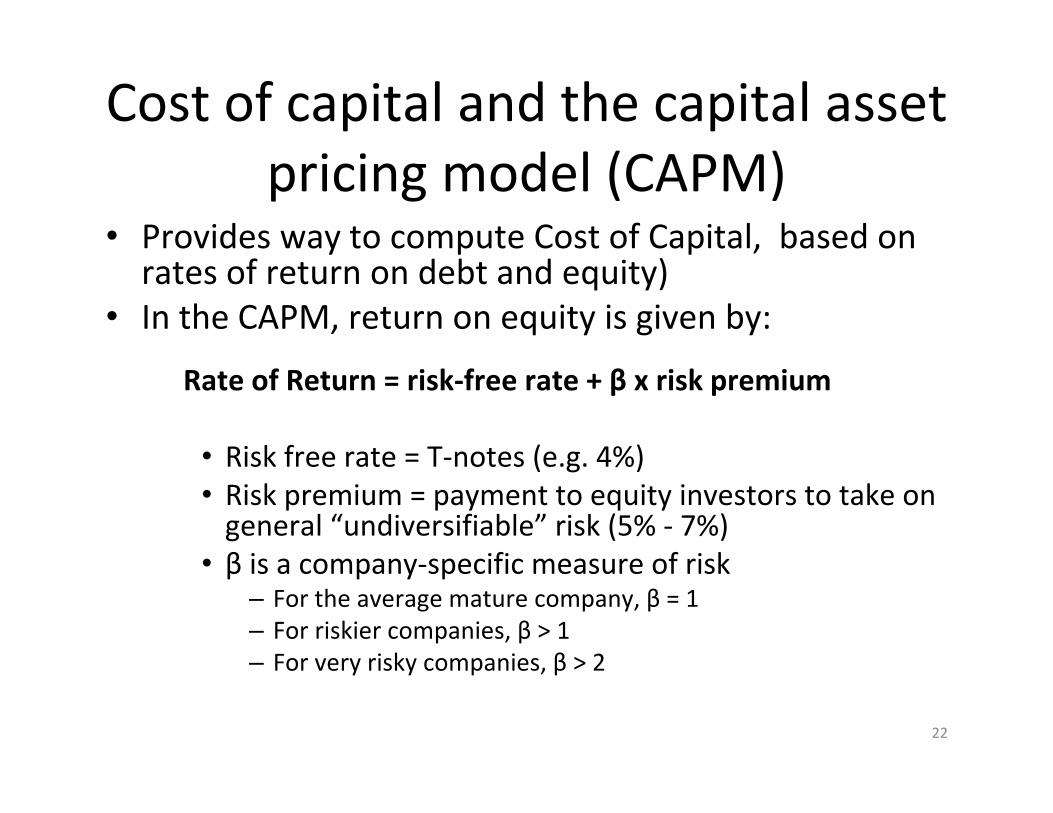
Cost of capital and the capital asset pricing model (CAPM)
• Provides way to compute Cost of Capital, based on rates of return on debt and equity)
• In the CAPM, return on equity is given by:
Rate of Return = risk‐free rate + β x risk premium
• Risk free rate = T‐notes (e.g. 4%)• Risk premium = payment to equity investors to take on general “undiversifiable” risk (5% ‐ 7%)
• β is a company‐specific measure of risk– For the average mature company, β = 1– For riskier companies, β > 1– For very risky companies, β > 2
23
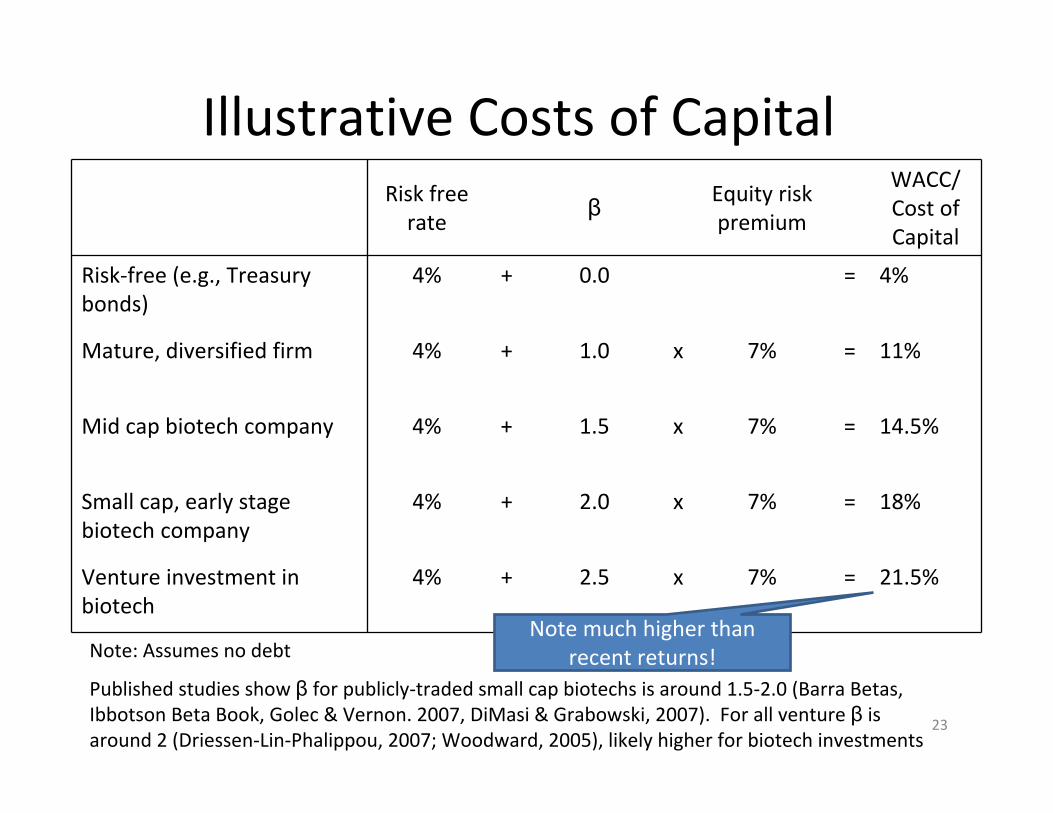
Illustrative Costs of CapitalRisk free rate
β Equity risk premium
WACC/ Cost of Capital
Risk‐free (e.g., Treasury bonds)
4% + 0.0 = 4%
Mature, diversified firm 4% + 1.0 x 7% = 11%
Mid cap biotech company 4% + 1.5 x 7% = 14.5%
Small cap, early stage biotech company
4% + 2.0 x 7% = 18%
Venture investment in biotech
4% + 2.5 x 7% = 21.5%
Note: Assumes no debt
Published studies show β for publicly‐traded small cap biotechs is around 1.5‐2.0 (Barra Betas, Ibbotson Beta Book, Golec & Vernon. 2007, DiMasi & Grabowski, 2007). For all venture β is around 2 (Driessen‐Lin‐Phalippou, 2007; Woodward, 2005), likely higher for biotech investments
Note much higher than recent returns!
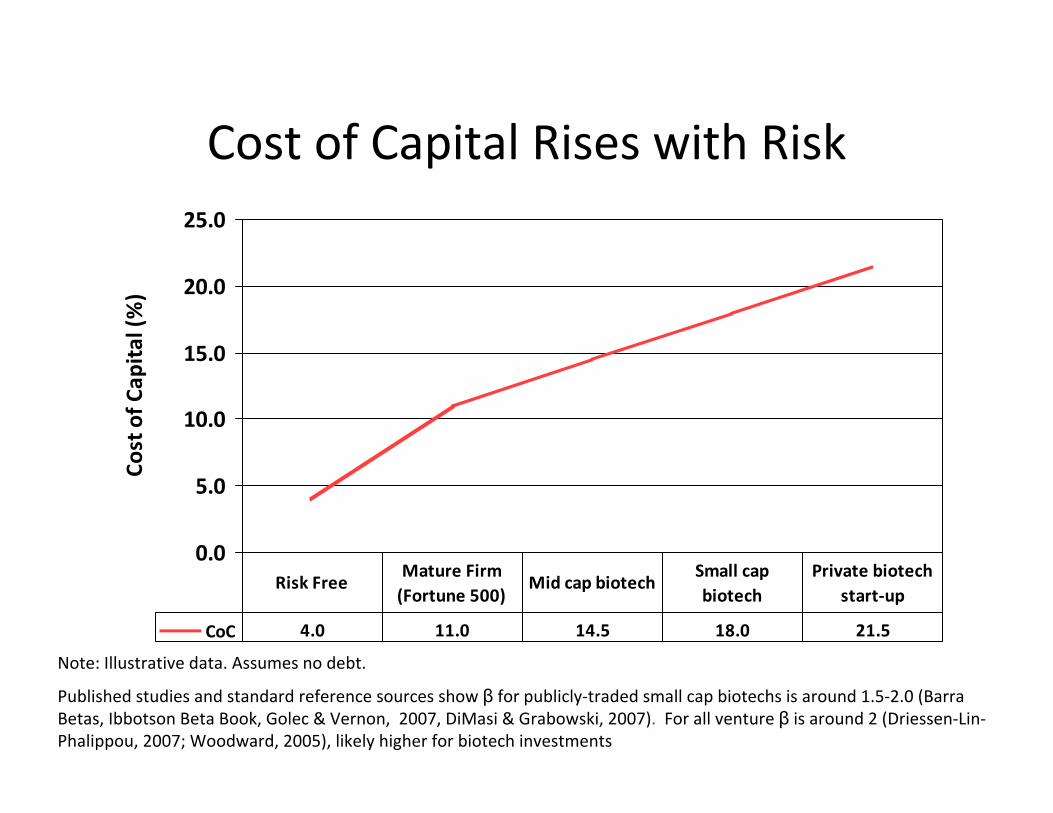
Cost of Capital Rises with Risk
0.0
5.0
10.0
15.0
20.0
25.0
Cost of C
apital (%
)
CoC 4.0 11.0 14.5 18.0 21.5
Risk FreeMature Firm (Fortune 500)
Mid cap biotechSmall cap biotech
Private biotech start‐up
Note: Illustrative data. Assumes no debt.
Published studies and standard reference sources show β for publicly‐traded small cap biotechs is around 1.5‐2.0 (BarraBetas, Ibbotson Beta Book, Golec & Vernon, 2007, DiMasi & Grabowski, 2007). For all venture β is around 2 (Driessen‐Lin‐Phalippou, 2007; Woodward, 2005), likely higher for biotech investments
25
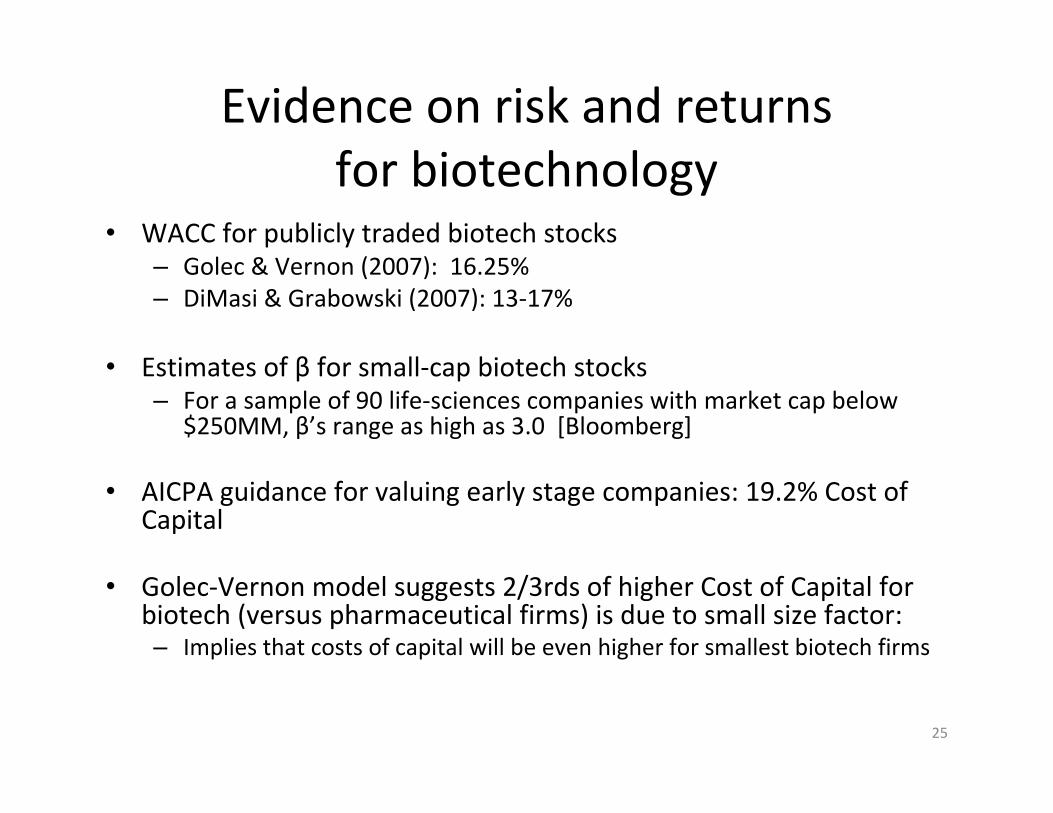
Evidence on risk and returns for biotechnology
• WACC for publicly traded biotech stocks – Golec & Vernon (2007): 16.25%– DiMasi & Grabowski (2007): 13‐17%
• Estimates of β for small‐cap biotech stocks– For a sample of 90 life‐sciences companies with market cap below
$250MM, β’s range as high as 3.0 [Bloomberg]
• AICPA guidance for valuing early stage companies: 19.2% Cost of Capital
• Golec‐Vernon model suggests 2/3rds of higher Cost of Capital for biotech (versus pharmaceutical firms) is due to small size factor:– Implies that costs of capital will be even higher for smallest biotech firms
26
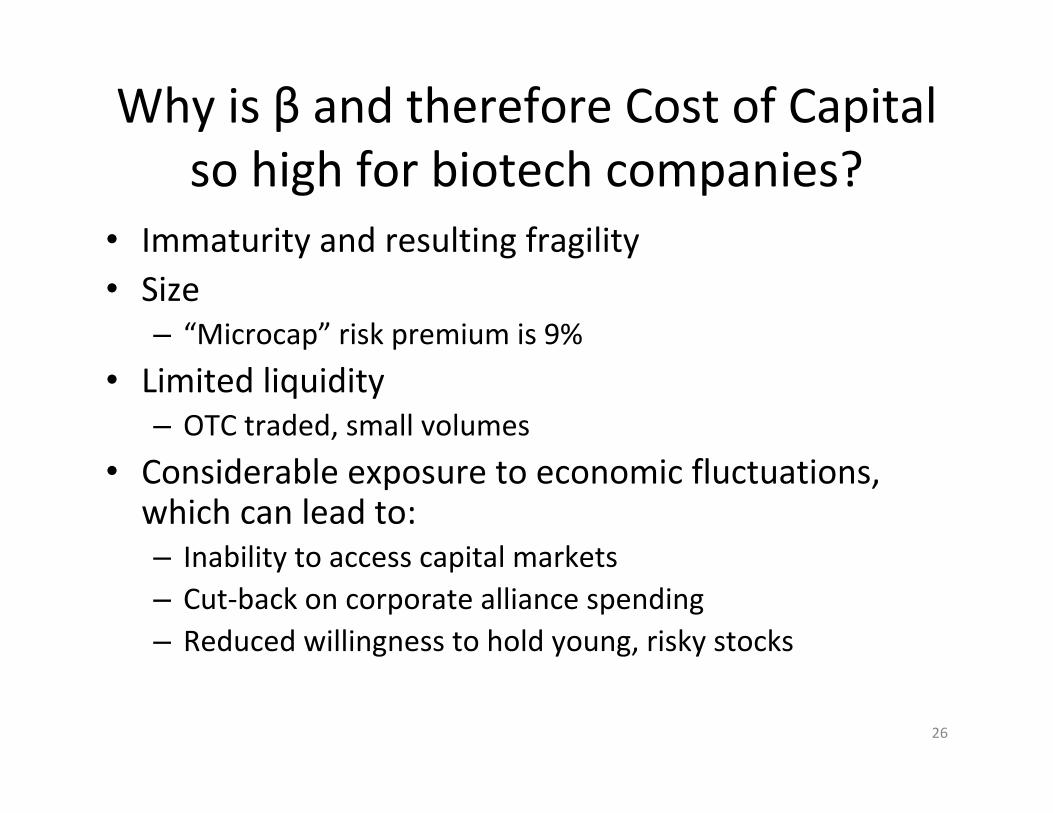
Why is β and therefore Cost of Capital so high for biotech companies?
• Immaturity and resulting fragility• Size
– “Microcap” risk premium is 9%
• Limited liquidity– OTC traded, small volumes
• Considerable exposure to economic fluctuations, which can lead to:– Inability to access capital markets– Cut‐back on corporate alliance spending– Reduced willingness to hold young, risky stocks
27
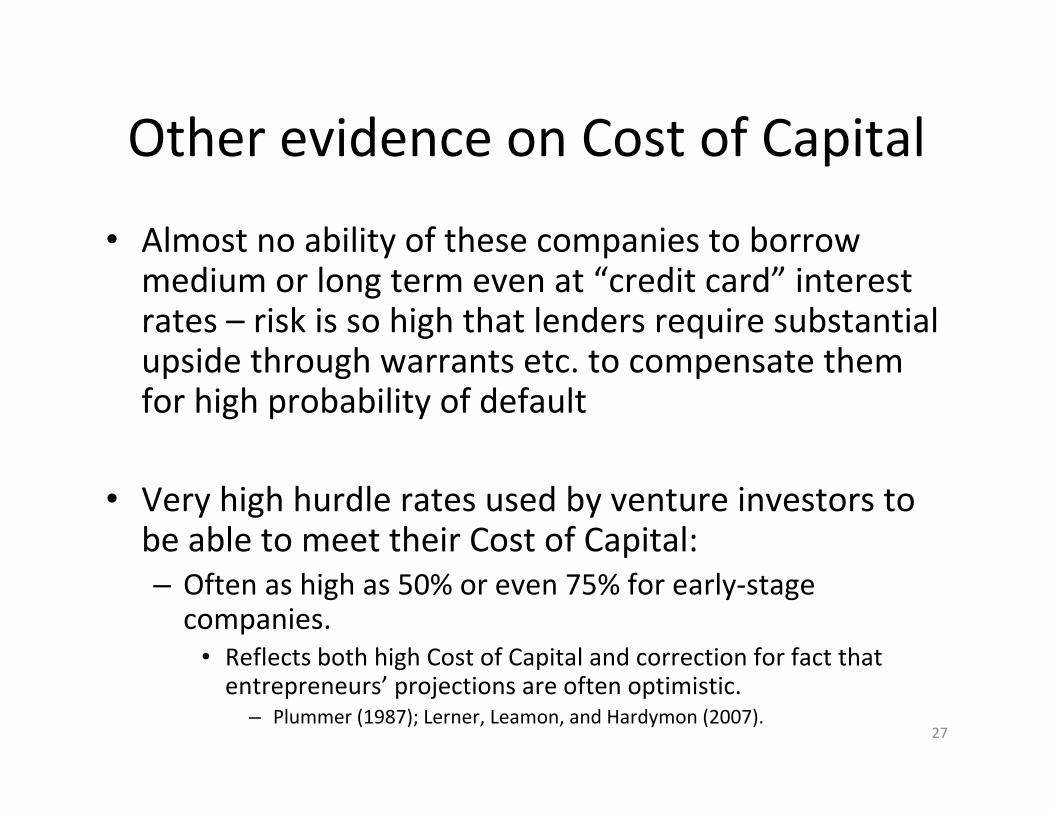
Other evidence on Cost of Capital
• Almost no ability of these companies to borrow medium or long term even at “credit card” interest rates – risk is so high that lenders require substantial upside through warrants etc. to compensate them for high probability of default
• Very high hurdle rates used by venture investors to be able to meet their Cost of Capital:– Often as high as 50% or even 75% for early‐stage companies.
• Reflects both high Cost of Capital and correction for fact that entrepreneurs’ projections are often optimistic.
– Plummer (1987); Lerner, Leamon, and Hardymon (2007).
28
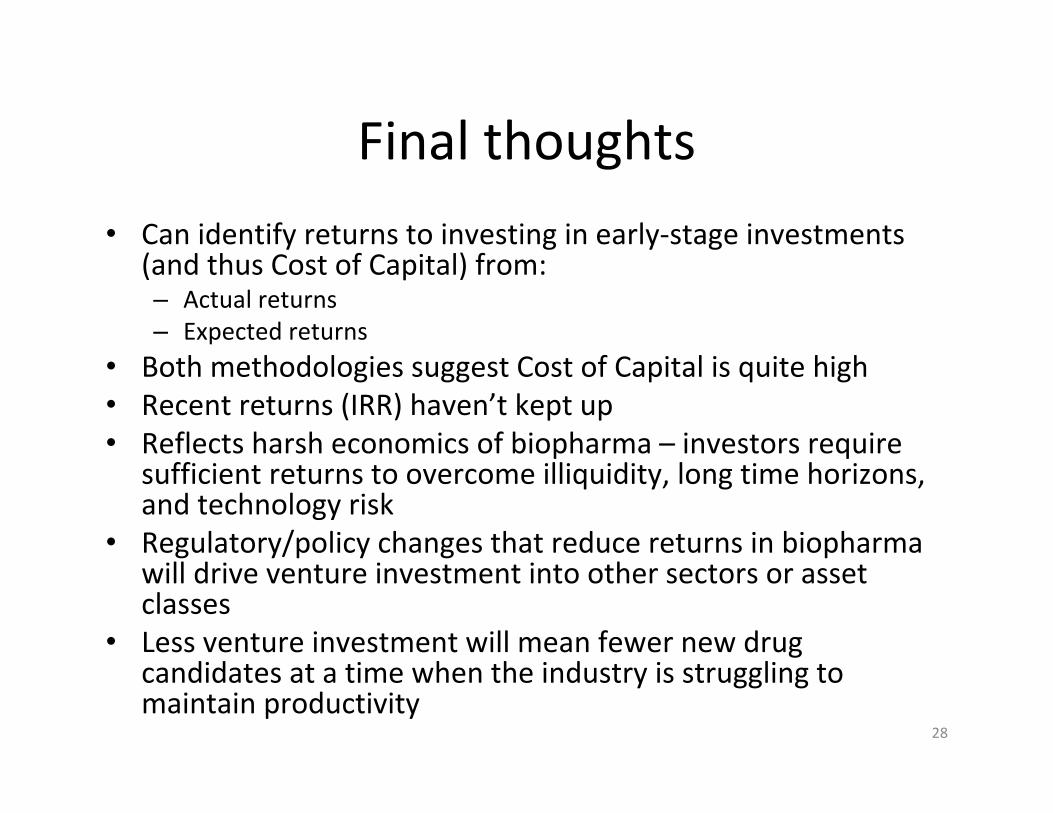
Final thoughts
• Can identify returns to investing in early‐stage investments (and thus Cost of Capital) from:– Actual returns– Expected returns
• Both methodologies suggest Cost of Capital is quite high• Recent returns (IRR) haven’t kept up• Reflects harsh economics of biopharma – investors require
sufficient returns to overcome illiquidity, long time horizons, and technology risk
• Regulatory/policy changes that reduce returns in biopharmawill drive venture investment into other sectors or asset classes
• Less venture investment will mean fewer new drug candidates at a time when the industry is struggling to maintain productivity
Technical Appendix
Measuring the Cost of Capital
30
1. Measuring venture returns
• Venture returns are highly variable:– In some periods, hugely positive: e.g., 1996‐2000.
– In some, very low: e.g., 1983‐89, 2001‐03.
– To get average returns that investors anticipate, must look over a long time period and average out good and bad periods.
• Key question is additional rate of return (“spread”) over other assets classes
• Not easy to calculate this for venture capital: need to identify specific investments, then follow them over long periods until (if) a payoff is realized– “Truncation bias” if potential large payoffs are still in play
– Need to track 2nd, 3rd, 4th subsequent rounds of investment in the same company, adjust for dilution of shareholdings etc.
• Data highly proprietary: usually only reported in aggregate
31
Total venture capital returns
• Thomson VentureXpert compiles returns over many funds over long time periods:– Looks at actual returns realized as well as interim valuations.
• Pooled average IRR, all venture capital:– 1970s‐ December 2008: 15.3%.
– January 1989‐December 2008: 17.0%.
– January 1999‐December 2008: 15.4%.
• Problem is that sources like VentureXpert compile returns on a fund‐by‐fund basis.
• Most funds invest in a mixture of information technology and life sciences.
• Thus, while we can measure returns to venture investors in aggregate, we cannot say based on these data what returns are for biotech specifically
32
Cambridge Associates data
• C.A. maintains unusually comprehensive data, tracking individualinvestments since the late 1970s
• Can identify bio/pharma ventures with some specificity, not just “health care” in general
• For investments in 1606 biotech companies 1986‐2008:– 25.7% average gross IRR for fully realized investments, up to 500 basis
points less to the investors– For all 2829 companies, including 1223 unrealized investments, IRR to
date has been 20.7% gross / 15.7% net
– Note huge risks: • 44% of investments were a full or partial loss• 2/3 of profitable investments took 5 years or more to be realized
33
2. Looking at expected returns
• The “right” approach to estimating the Cost of Capital is to look at what the expectations of investors were at the time of the investment.
• Finance theory gives us indications of what this expectation would be.• Evaluation of public markets has advanced considerably recently, based
on the recognition that investors must take portfolio view of investments.
– Insight of the CAPM model.• Risk is a measure of the correlation of one assets return with the overall market.
– New innovations in multi‐factor models.• Correlation with the market is not the only source of risk.
– Multi‐factor models increasingly used to measure returns of an asset class and returns of individual investors.
34
Risk‐adjusting returns: CAPM model
• All models of returns show that “risk” is determined by the correlation of one return with the return on a set of “factors”
– Capital Asset Pricing Model (CAPM)• Risk is measured by the degree of correlation with the market.
– Investors wealth is dependent upon where the market is.– Would demand lower returns on an investment that tends to be a hedge on
market.
• Greater co‐movement with the market implies higher required returns.
• Regression analysis used to estimate parameters– Beta is commonly used measure of risk.
• Beta of the market is 1.• Higher beta means higher risk.
– Intercept in the regression (alpha) measures risk adjusted returns.• What’s left over after adjusting for comovement with the market.
35
Risk‐adjusting returns: Alternative to the CAPM
• Alternative 3‐factor model (Fama‐French).– Market risk.– Size risk.
• Small companies are riskier than big companies.
– Book‐to‐market factor.• High book‐to‐market companies (value stocks) are riskier than growth companies
(distress).
• Both models used to price various stock and bond portfolios quite successfully.
• Will focus here on CAPM, though both approaches give similar results.
36
Returns and risk premia for small firms
• Risk premium is much larger for small cap stocks: points to much higher risk for “micro” ventures– Ibbotson analysis of all stocks gives “size premium” for smallest category (mkt
cap<$136MM) at 9.5%
• 10‐year Treasury yield: 3.84%.• Over past eight decades, risk premium of ~7%.
– Ibbotson Associates, 2009 Stock, Bonds, Bills and Inflation Yearbook, 2009.• Using long‐time period makes sense.
– Recent academic research finds risk premium as > 5% (John Campbell, “Estimating the equity premium,” Harvard working paper, 2008.)
• Implies expected return of 20‐21%.
37
Difficulties with applying framework to analyzing venture capital returns
• All expected return models are driven off of return correlations.• Private equity return correlation with other asset classes have little
meaning.– Private equity portfolios often kept at book.– Hesitancy to write down and up:
• Certainly historically, and even in post‐FAS 157 world.
– Leads to large downward bias in estimated correlations.– Cannot use most common models to risk‐adjust returns.
38
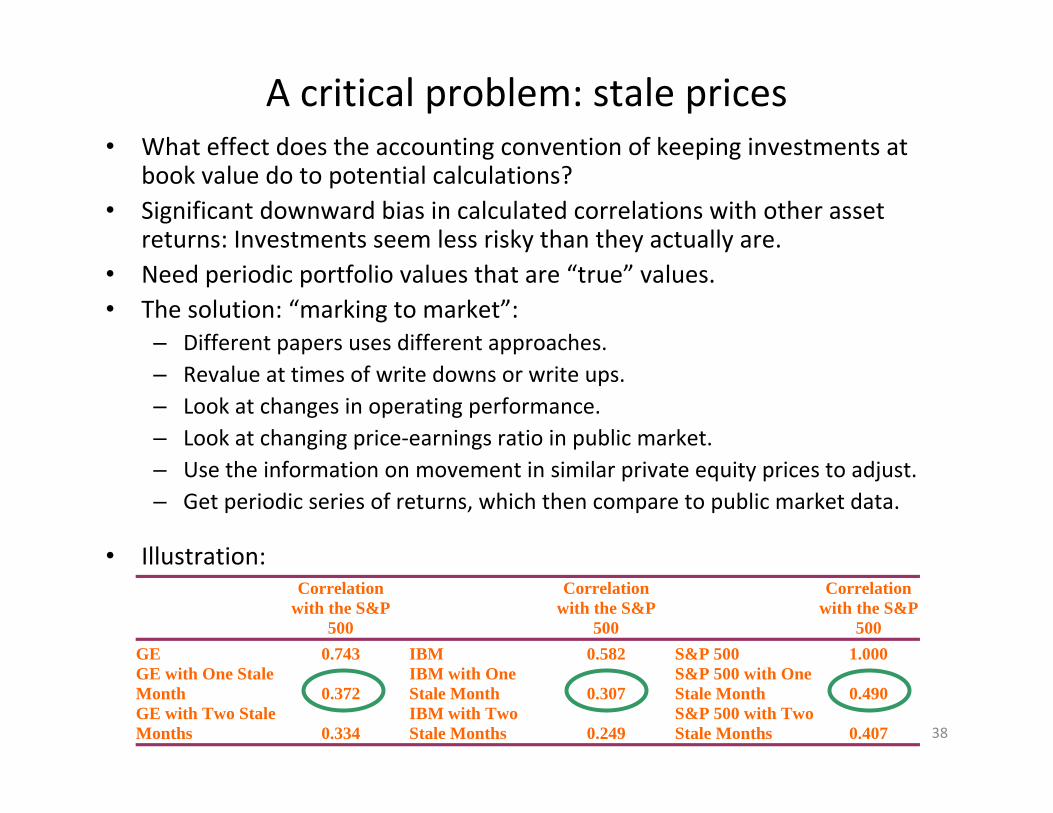
A critical problem: stale prices• What effect does the accounting convention of keeping investments at
book value do to potential calculations?• Significant downward bias in calculated correlations with other asset
returns: Investments seem less risky than they actually are.• Need periodic portfolio values that are “true” values.• The solution: “marking to market”:
– Different papers uses different approaches.– Revalue at times of write downs or write ups.– Look at changes in operating performance.– Look at changing price‐earnings ratio in public market. – Use the information on movement in similar private equity prices to adjust.– Get periodic series of returns, which then compare to public market data.
• Illustration:
Correlation with the S&P
500
Correlation with the S&P
500
Correlation with the S&P
500 GE 0.743 IBM 0.582 S&P 500 1.000 GE with One Stale Month 0.372
IBM with One Stale Month 0.307
S&P 500 with One Stale Month 0.490
GE with Two Stale Months 0.334
IBM with Two Stale Months 0.249
S&P 500 with Two Stale Months 0.407
39
Note on expected returns for venture capital
• The true expected returns in venture capital are likely to be higher than the calculated ones due to:
• The need to compensate investors for illiquidity (these calculations assume no liquidity premium).
– The greater risk of biotech investments (as seen above, actual returns are higher for biotech).
References
Cockburn, I. (2004) “The Changing Structure of the Pharmaceutical Industry” Health Affairs, 23(1), pp.10‐22.
DiMasi, J. and Grabowski, H. (2007) “The Cost of Biopharmaceutical R&D: Is Biotech Different?”Managerial and Decision Economics, 28, pp.469–479.
Driessen, J., Phalippou, L. and Lin, T. (2007) “A New Method to Estimate Risk and Return of Non‐Traded Assets from Cash Flows: The Case of Private Equity Funds,”Unpublished working paper, available at SSRN: http://ssrn.com/abstract=965917.
Golec, J. and Vernon, J. (2007) “Financial Risk In The Biotechnology Industry” NBER Working Paper No. 13604.
Lerner, J., Leamon, A. and Hardymon F. (2007) Venture Capital and Private Equity: A Casebook. New York, John Wiley & Sons.
Plummer, J. (1987), QED Report on Venture Capital Financial Analysis, Palo Alto, CA, QED Research.
Woodward, S. (2005), “Measuring Risk and Performance for Private Equity,”Unpublished working paper, available at http://www.sandhillecon.com/pdf/MeasuringRiskPerformance.pdf.