Embed Size (px)
Citation preview

EENet presents the fourth webinar in the Health Canada DTFP-ON series:
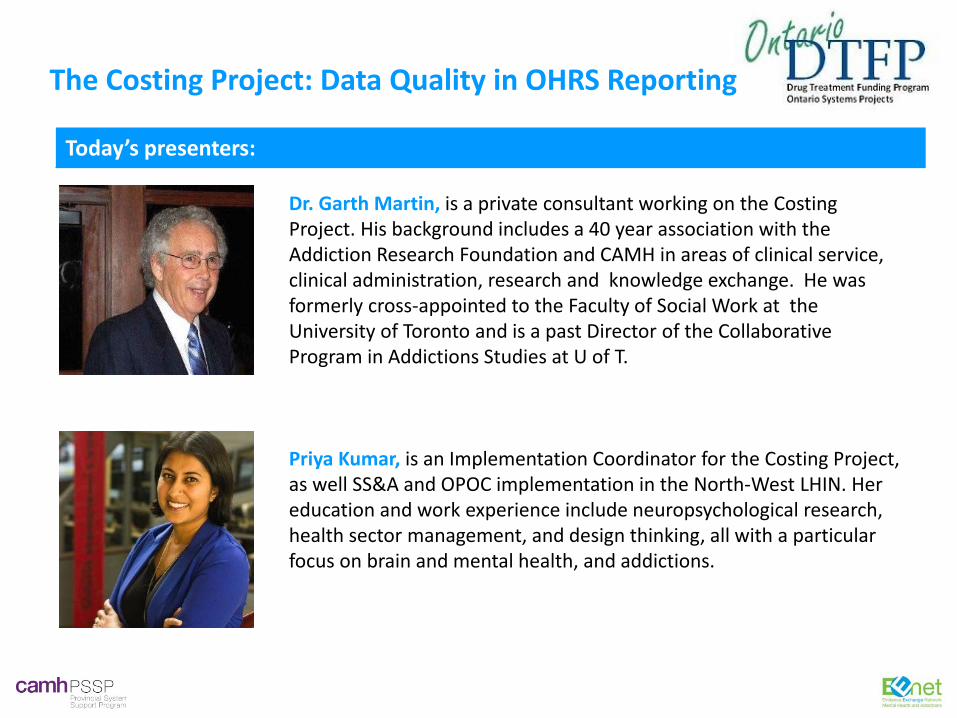
The Costing Project: Data Quality in OHRS Reporting
Thursday April 28, 2016 1pm – 2:30pm (EDT)

HOUSEKEEPING
• The audio is being stream via your computers. For optimal sound, please use external speakers or earphones. If you are still having trouble hearing our presenters, you can dial into 1-800-509-6600 Participant PIN: 95437934#
• This webinar will be recorded and posted on the project’s webpage following the presentation.
• Please also let us know via the chat box if someone is watching the
webinar with you! • Some collected data from the webinar might be used for reporting.
• We would appreciate having your feedback on today’s knowledge
exchange webinar. You will receive a link to an online survey towards the end of the webinar. Thanks in advance for the 5 minutes of your time to complete our online feedback survey.
The Costing Project: Data Quality in OHRS Reporting

Before we begin, we would like to know a little about YOU!
EENet would like to know WHICH SECTORS are participating in today’s webinar. Please answer the poll: What sector do you work in? Addictions only
Mental health only
Addictions and mental health
Other (please specify which sector in the chat box)
The Costing Project: Data Quality in OHRS Reporting

Before we begin, we would like to know a little about YOU!
EENet would like to know WHO is participating in today’s webinar. Please answer the poll: What is your main role in relation to the addictions and/or mental health sectors? Agency Leadership
Direct Service Provider
Knowledge Broker/Implementation Staff
Person with Lived Experience and/or Family Member
Policy Maker/Decision Maker
System Planner
Researcher/Research staff
Other (please specify in chat-box)
Not in the addictions and/or mental health sectors
The Costing Project: Data Quality in OHRS Reporting

Now we would like to know a little more about YOU!
EENet would like to know WHERE everyone is participating from. Please answer the poll:
Which Local Health Integration Network (LHIN) area are you participating from?
1. Erie St. Clair 2. South West 3. Waterloo Wellington 4. Hamilton Niagara Haldimand Brant 5. Central West 6. Mississauga Halton 7. Toronto Central 8. Central 9. Central East 10. South East 11. Champlain 12. North Simcoe Muskoka 13. North East 14. North West I am participating from outside of Ontario Not sure
The Costing Project: Data Quality in OHRS Reporting

Health Canada’s Drug Treatment Funding Program (DTFP)
• Through consultations with provincial and territorial governments and non-governmental organizations, Health Canada developed the Drug Treatment Funding Program (DTFP) in 2008 as part of the Treatment Action Plan under the National Anti-Drug Strategy.
• The DTFP is a federal contribution program designed to support provinces and territories in their efforts to strengthen evidence-informed substance use treatment systems; and address critical gaps in substance abuse treatment services, particularly for at-risk youth.
6
OntarioDTFPDrug Treatment Funding Program Ontario Systems Projects

The DTFP supports sustainable improvement in the quality and organization of substance use treatment systems through investments in the following areas:
LINKAGE & KNOWLEDGE EXCHANGE
STRENGTHENING PERFORMANCE MEASUREMENT & EVALUATION
IMPLEMENTATION OF EVIDENCE INFORMED PRACTICE
OntarioDTFPDrug Treatment Funding Program Ontario Systems Projects
7
Health Canada’s Drug Treatment Funding Program (DTFP)

Project Project Lead
IMPLEMENTATION OF EVIDENCE INFORMED PRACTICE
The Implementation of the Ontario Perception of Care Tool for Mental Health and Addictions (OPOC-MHA) Kim Baker, CAMH
Implementation of a new staged screening and assessment process for addictions Kim Baker, CAMH
Best practices in Peer Support Services Janis Cramp, AMHO
Developing and testing Internet-based interventions (IBI) for substance use in youth (NEW INITIATIVE)
Karen Urbanoski, Joanna Henderson, Gloria Chaim, CAMH
Trauma-informed substance use screening and assessment tools for First Nations and Inuit peoples (NEW INITIATIVE) Renee Linklater, CAMH
STRENGTHENING EVALUATION & PERFORMANCE MEASUREMENT
Development and standardization of cost-based performance indicators Kim Baker, CAMH
Strengthening performance measurement for mental health and addictions in Ontario (NEW INITIATIVE) Karen Urbanoski, CAMH
Improving reporting compliance and data quality among Ontario’s addiction treatment agencies Claudio Rocca, CAMH
Evaluating Residential Support Services Janis Cramp, AMHO
Evaluation Plan for Youth Care (NEW INITIATIVE) Laura Mills, Pine River Institute
LINKAGE & EXCHANGE
Evidence Exchange Network (EENet) Nandini Saxena, CAMH 8
DTFP-ON Projects for FY2015- December 2016

• Supports Ontario’s 10-year Comprehensive Mental Health and Addictions Strategy
• Offices across Ontario • Capacity and expertise in knowledge
exchange, implementation, equity & engagement, information management, & evaluation
• Houses EENet, a knowledge exchange network that connects people with evidence about mental health and substance use problems in Ontario
Today’s presenters:
The Costing Project: Data Quality in OHRS Reporting
Dr. Garth Martin, is a private consultant working on the Costing Project. His background includes a 40 year association with the Addiction Research Foundation and CAMH in areas of clinical service, clinical administration, research and knowledge exchange. He was formerly cross-appointed to the Faculty of Social Work at the University of Toronto and is a past Director of the Collaborative Program in Addictions Studies at U of T. Priya Kumar, is an Implementation Coordinator for the Costing Project, as well SS&A and OPOC implementation in the North-West LHIN. Her education and work experience include neuropsychological research, health sector management, and design thinking, all with a particular focus on brain and mental health, and addictions.
The Costing Project: OHRS Reporting
and Data Quality
*This project is made possible through a financial contribution from Health Canada and the support of the Ministry of Health and Long-Term Care (MOHLTC). The views expressed do not necessarily represent the views of Health Canada or MOHLTC.

OHRS and past phase of the Costing Project
Current phase: Performance indicators
Current phase:
Costing Training Program

The DTFP-Costing project aims to develop reliable and valid cost-based performance measures to assess and compare cost of A&MH services.
Ontario Healthcare Reporting Standards = source of data for development of these cost-based performance measures
The Costing Project

Ontario Healthcare Reporting Standards (OHRS)
Ontario version of national standard, Management Information System (MIS)
Links program’s revenues/expenses to its service delivery statistics
Ontario healthcare providers mandated to report to OHRS Q2, Q3, Year-end

Why report OHRS data?
Provides objective frame of reference for planning and resource allocation
Facilitates measurement of
program performance Supports accurate understanding
of the cost of services provided
15
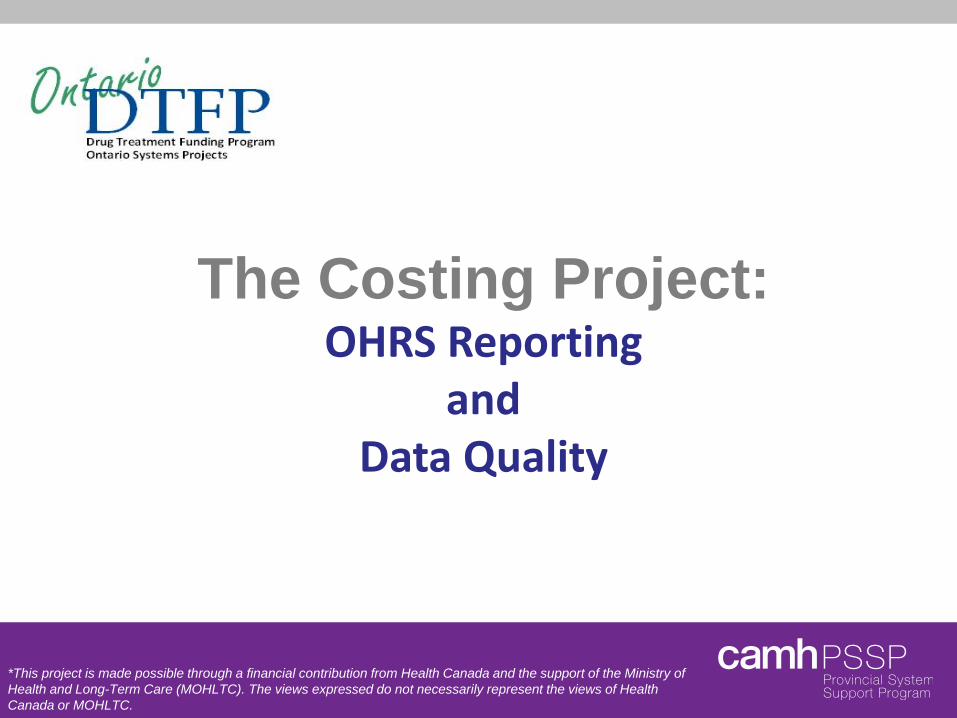
Issues identified in past phases Significant data quality problems across A&MH sectors • High variability in service reporting • High variability in expense reporting • Inconsistent interpretation of data standards
Methodological problems in use of existing indicators as performance measures
Need for standardized cost-based indicators + OHRS data quality training

Common issues with client data
Missing data
Incorrect Service Recipient statistics reported
Reporting to incorrect Functional Centre
Inconsistent OHRS and CSR reporting
Mismatching of financial and statistical data
17
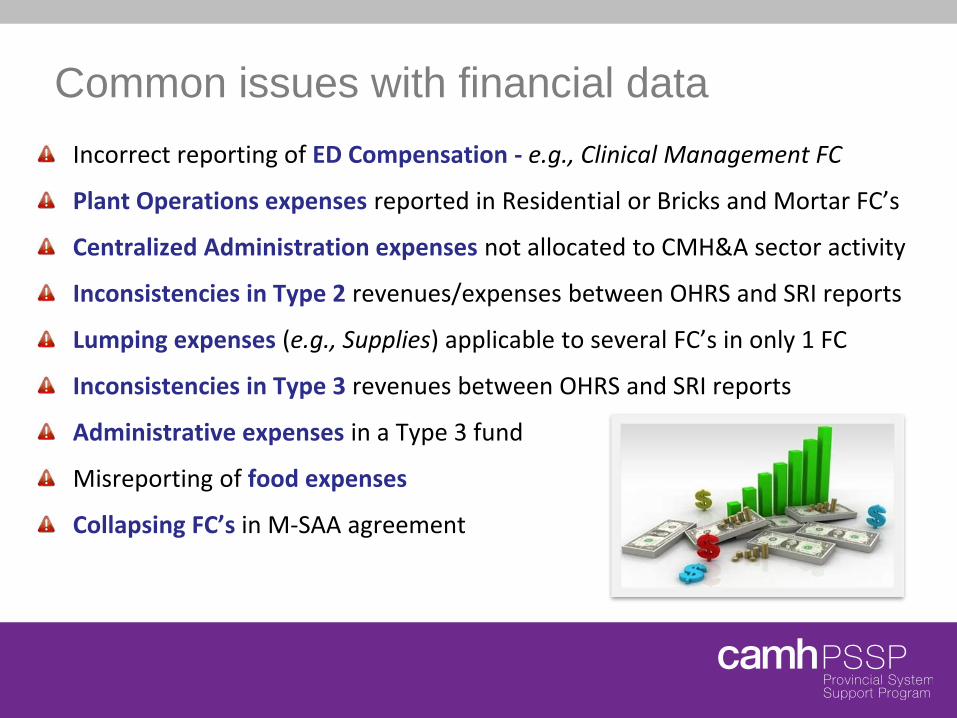
Incorrect reporting of ED Compensation - e.g., Clinical Management FC
Plant Operations expenses reported in Residential or Bricks and Mortar FC’s
Centralized Administration expenses not allocated to CMH&A sector activity
Inconsistencies in Type 2 revenues/expenses between OHRS and SRI reports
Lumping expenses (e.g., Supplies) applicable to several FC’s in only 1 FC
Inconsistencies in Type 3 revenues between OHRS and SRI reports
Administrative expenses in a Type 3 fund
Misreporting of food expenses
Collapsing FC’s in M-SAA agreement
Common issues with financial data

Apply only to Type 2 Funds Combine dissimilar statistics in computing the cost-per-client contact Large variations in cost of facilities distorts administrative costs Cost-per-resident day does not take into account the scope of services to non-residents Cost-per-individual served does not account for the type or duration of service provided
Issues with existing performance indicators

Recommendations for development of Guidelines for standardizing use and interpretation of existing indicators
Development of 5 OHRS e-Learning modules
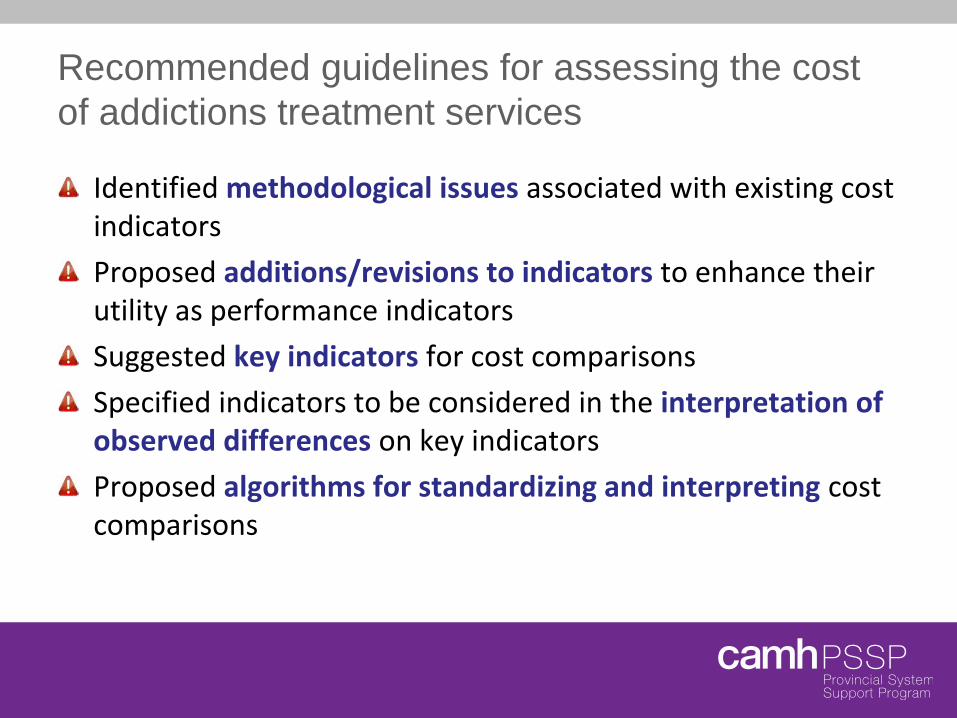
Recommended guidelines for assessing the cost of addictions treatment services
Identified methodological issues associated with existing cost indicators Proposed additions/revisions to indicators to enhance their utility as performance indicators Suggested key indicators for cost comparisons Specified indicators to be considered in the interpretation of observed differences on key indicators Proposed algorithms for standardizing and interpreting cost comparisons

Collaborators: Southwest Addiction and Mental Health Coalition, and MOHLTC – Healthcare Data Branch
MIS/OHRS eLearning modules
• Reporting & interpretation of OHRS data • Accessible at:
• https://hsimi.on.ca/hdbportal/cmha • http://eenet.ca/dtfp/development-
and-standardization-of-cost-based-performance-indicators-the-costing-project/ (scroll to Dec.8, 2015)
OHRS training support for
CMH&A agencies
1. Overview of MIS/OHRS 2. OHRS Client Statistics 3. OHRS Financial Reporting 4. OHRS Reporting-How to Use Your Data 5. Auditing and Troubleshooting Your Data
Five Modules:

Current Phase of the Costing Project: Performance Indicators

Costing indicators SPI Pilot project – exploring the use of
service provider interaction (SPI) statistics as cost and productivity performance measures
Working group - work from Guidelines to standardize the use and interpretation of indicators

SPI pilot project
SPI statistics (Individual and group) are measures based on service
input time - time spent by Health Service Providers in direct contact with clients
Pilot project examines using SPI as basis for measuring cost and
productivity within and among agencies, in contrast to the current approach of using service output measures (e.g., visits & group participant interactions)
• Tests potential performance indicators for accuracy and consistency based on SPI and SPGI times
• Six participating agencies • mix of large and small agencies; rural and urban services

Working Group Goal: To build on the Guidelines to standardize a set of performance
indicators for assessing, interpreting and benchmarking the costs of addictions treatment • A Working Group has been formed, comprised of members from the
Project Team, 3 LHINs, and Mental Health Sector. • It will work in collaboration with the LHIN SRI Indicators Group
Deliverables: Standardized performance indicators that allow effective measurement
and interpretation of agency performance Reliable performance measurement data that can
better assist MOHLTC and LHINs make informed decisions on policy, funding, and resource allocation at agency, regional, and provincial levels

Current Phase of the Costing Project: Data Quality Training Initiative

The Costing Training Program
Stage 1: Data Quality & OHRS Requirements
Stage 2: Data Quality Culture in your Agency
Stage 3: Network of Data Champions

Data quality culture is…
Embedding data quality best-practices in everyday work so there is… On-going awareness of how
data quality impacts program planning, funding, decision-making
Greater accountability around documenting, collecting, or reporting data
Embedding tools/practices that enable high data quality in daily work

Why the need for a data quality
culture?
System- and agency-level decisions impact quality of care.
Without accurate and complete data, incorrect decisions around service provision are made, impacting quality of care for clients.
Incorrectly identified gaps
Ineffective allocation, use of resources
Ineffective evaluation
Decreased quality of care:
Clients do not receive the
right care, at the right time, in most
effective way.

3 webinars across 10 LHINs • ~270 CMH&A staff registered from
various roles: Finance/Data experts, Direct service providers, Agency leaders
Overview of OHRS reporting requirements: • Reporting structures • Client statistics + reporting scenarios • Data quality tools and auditing data
Stage 1: Data Quality & OHRS Requirements
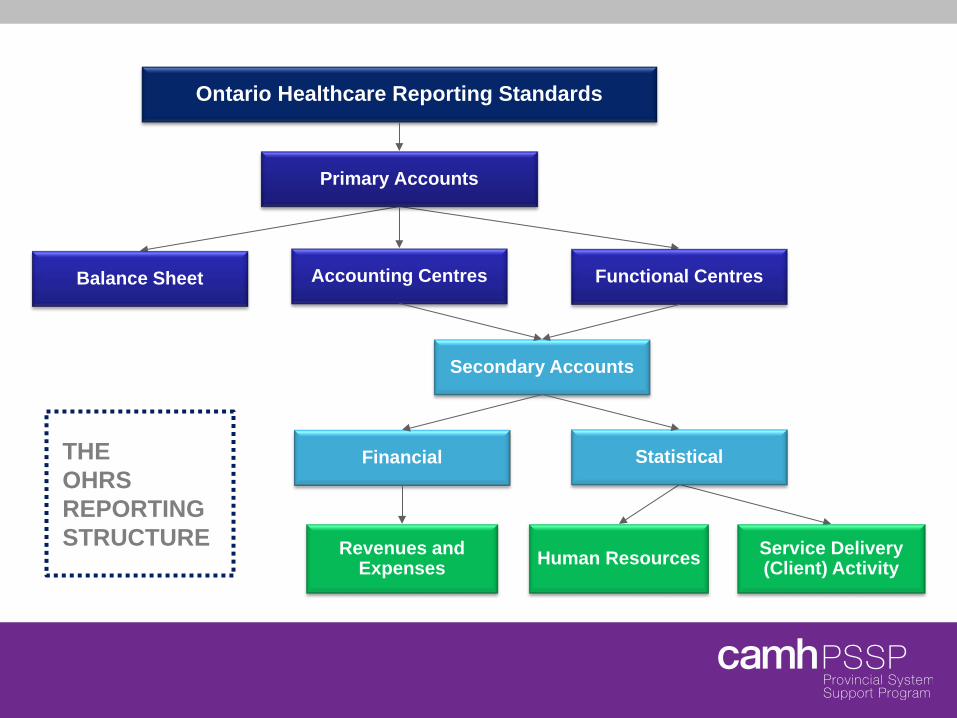
Ontario Healthcare Reporting Standards
Primary Accounts
Functional Centres Accounting Centres
Secondary Accounts
Financial Statistical
Balance Sheet
Revenues and Expenses Human Resources Service Delivery
(Client) Activity
THE OHRS REPORTING STRUCTURE

Ontario Healthcare Reporting Standards
Primary Accounts
Functional Centres Accounting Centres
Secondary Accounts
Financial Statistical
Balance Sheet
Revenues and Expenses Human Resources Service Delivery
(Client) Activity
THE MATCHING PRINCIPLE
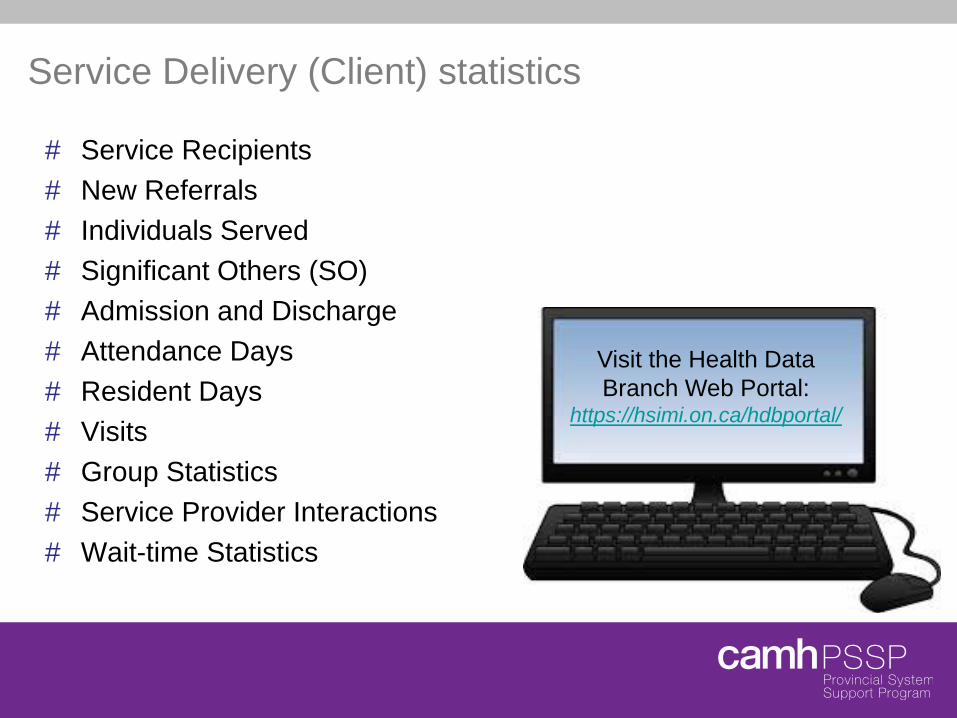
Service Delivery (Client) statistics
# Service Recipients # New Referrals # Individuals Served # Significant Others (SO) # Admission and Discharge # Attendance Days # Resident Days # Visits # Group Statistics # Service Provider Interactions # Wait-time Statistics
Visit the Health Data Branch Web Portal:
https://hsimi.on.ca/hdbportal/

Troubleshooting and auditing data quality issues
Auditing - sampling data to measure against various quality characteristics (completeness; accuracy; consistency; duplication; correct time periods)
Troubleshooting - logical approach to identifying/correcting data problems 1. Audit - check for accuracy, eliminate
obvious issues: entry errors, missing data 2. Dig deeper to determine problem & source 3. Take corrective action

Uses for the reported data and tools
Comparison – time periods, between programs, between peer agencies, within LHIN, across LHINs
Trending - client service needs, volumes, demographic changes, etc.
Forecasting - finances and service delivery
Benchmarking – support best practices, performance targets and program standards
Budgeting
Resource allocation – staff, funding, time
36

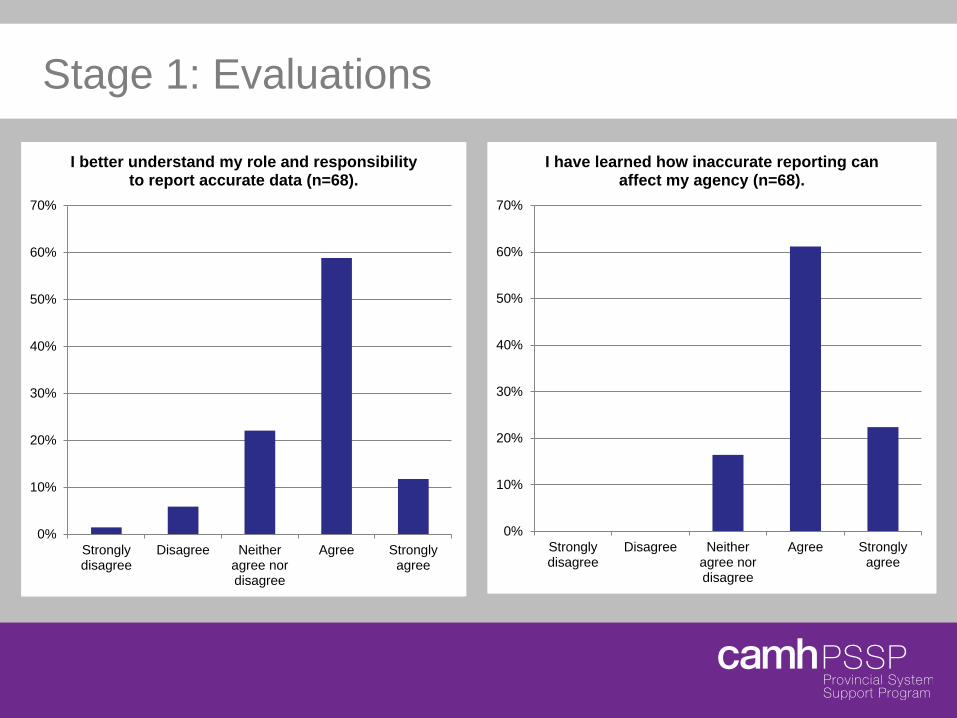
Stage 1: Evaluations
0%
10%
20%
30%
40%
50%
60%
70%
Stronglydisagree
Disagree Neitheragree nordisagree
Agree Stronglyagree
I have an increased understanding of OHRS (n=68).
0%
10%
20%
30%
40%
50%
60%
70%
Stronglydisagree
Disagree Neitheragree nordisagree
Agree Stronglyagree
I better understand the structure for reporting financial and statistical data (n=68).
Stage 1: Evaluations
0%
10%
20%
30%
40%
50%
60%
70%
80%
Stronglydisagree
Disagree Neitheragree nordisagree
Agree Stronglyagree
I have an increased understanding of OHRS.
0%
10%
20%
30%
40%
50%
60%
70%
Stronglydisagree
Disagree Neitheragree nordisagree
Agree Stronglyagree
I better understand the structure for reporting financial and statistical data.
0%
10%
20%
30%
40%
50%
60%
70%
Stronglydisagree
Disagree Neitheragree nordisagree
Agree Stronglyagree
I better understand my role and responsibility to report accurate data (n=68).
0%
10%
20%
30%
40%
50%
60%
70%
Stronglydisagree
Disagree Neitheragree nordisagree
Agree Stronglyagree
I have learned how inaccurate reporting can affect my agency (n=68).

5 full-day events across 10 LHINs • 197 staff attended from various roles
across CMH&A orgs
Connecting reporting requirements to data quality culture: • Reporting requirements + Scenarios • 4 Case studies • 2-part Group Brainstorm: Data quality
challenges + “Solution Generation”
Stage 2: Data Quality Culture in your Agency
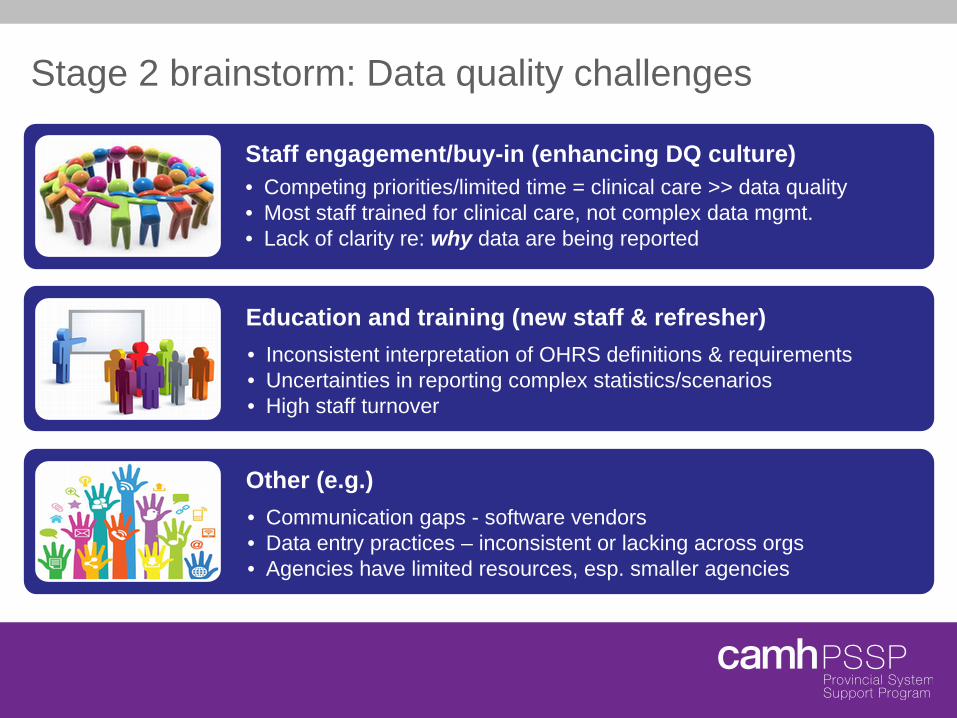
Stage 2 brainstorm: Data quality challenges
Staff engagement/buy-in (enhancing DQ culture) • Competing priorities/limited time = clinical care >> data quality • Most staff trained for clinical care, not complex data mgmt. • Lack of clarity re: why data are being reported
Education and training (new staff & refresher) • Inconsistent interpretation of OHRS definitions & requirements • Uncertainties in reporting complex statistics/scenarios • High staff turnover
Other (e.g.) • Communication gaps - software vendors • Data entry practices – inconsistent or lacking across orgs • Agencies have limited resources, esp. smaller agencies
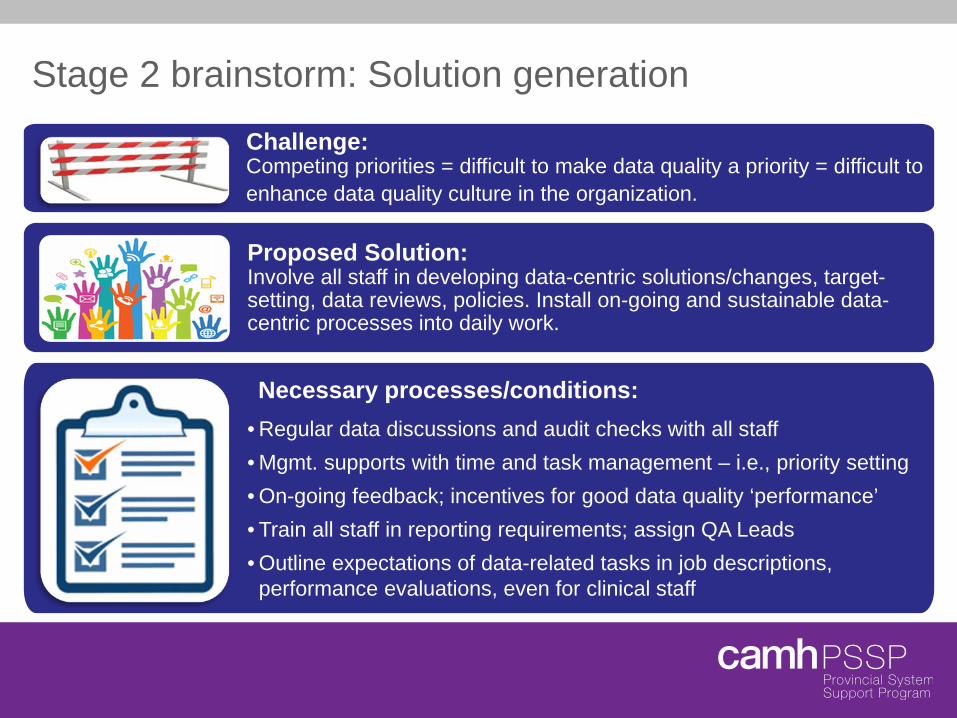
Stage 2 brainstorm: Solution generation
Challenge: Competing priorities = difficult to make data quality a priority = difficult to enhance data quality culture in the organization.
Proposed Solution: Involve all staff in developing data-centric solutions/changes, target-setting, data reviews, policies. Install on-going and sustainable data-centric processes into daily work.
Necessary processes/conditions: • Regular data discussions and audit checks with all staff • Mgmt. supports with time and task management – i.e., priority setting • On-going feedback; incentives for good data quality ‘performance’ • Train all staff in reporting requirements; assign QA Leads • Outline expectations of data-related tasks in job descriptions, performance evaluations, even for clinical staff
0%
10%
20%
30%
40%
50%
60%
70%
StronglyDisagree
Disagree NeitherDisagree or
Agree
Agree StronglyAgree
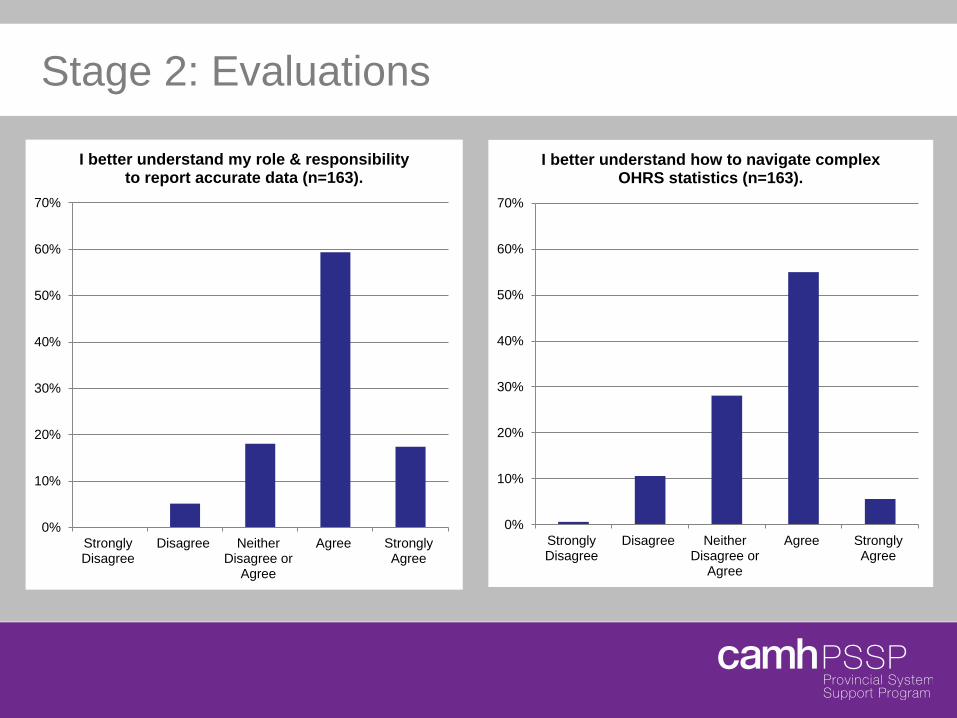
I better understand my role & responsibility to report accurate data (n=163).
0%
10%
20%
30%
40%
50%
60%
70%
StronglyDisagree
Disagree NeitherDisagree or
Agree
Agree StronglyAgree
I better understand how to navigate complex OHRS statistics (n=163).
Stage 2: Evaluations

Stage 2: Evaluations
0%
10%
20%
30%
40%
50%
60%
70%
StronglyDisagree
Disagree NeitherDisagree or
Agree
Agree StronglyAgree
I better understand the links between OHRS and data quality best practices (n=163).
0%
10%
20%
30%
40%
50%
60%
70%
StronglyDisagree
Disagree NeitherDisagree or
Agree
Agree StronglyAgree
I better understand how I can apply data quality best practices in my agency (n=163).

Supporting sustainable data quality + addressing needs/challenges from Stage 2 A. Resource-based: support around
training/education; information on best practices
B. Process-based: address/implement processes/best practices that impact data quality
Two components:
A. Resource-based: Online presence on Evidence Exchange Network (EENet)
B. Process-based: LHIN-based Working Group/CoP
Stage 3: Network of Data Champions

Open-access online space OHRS and other data-centric
resources • Need for training, education,
and related supports • Means of (data-centric)
communication and P2P learning
• Populated by Costing team and you!
The Network on EENet (Resource-centric)

Open-access online space OHRS and other data-centric
resources • Need for training, education,
and related supports • Means of (data-centric)
communication and P2P learning
• Populated by Costing team and you!
The Network on EENet Example features
Stage 1 & 2 training materials
“Data tip of the week”
“Data Success story of the month”
Scenario bank;
Moderated forum
Links to HDB tools, check-lists, presentations;
(Resource-centric)

Anticipated timeline: Exploration/Installation:
• Now - Summer, 2016 • Stakeholder engagement,
production, testing
Implementation: • Fall-Winter, 2016
• Enrollment, moderating, updating resources, on-going development
The Network on EENet
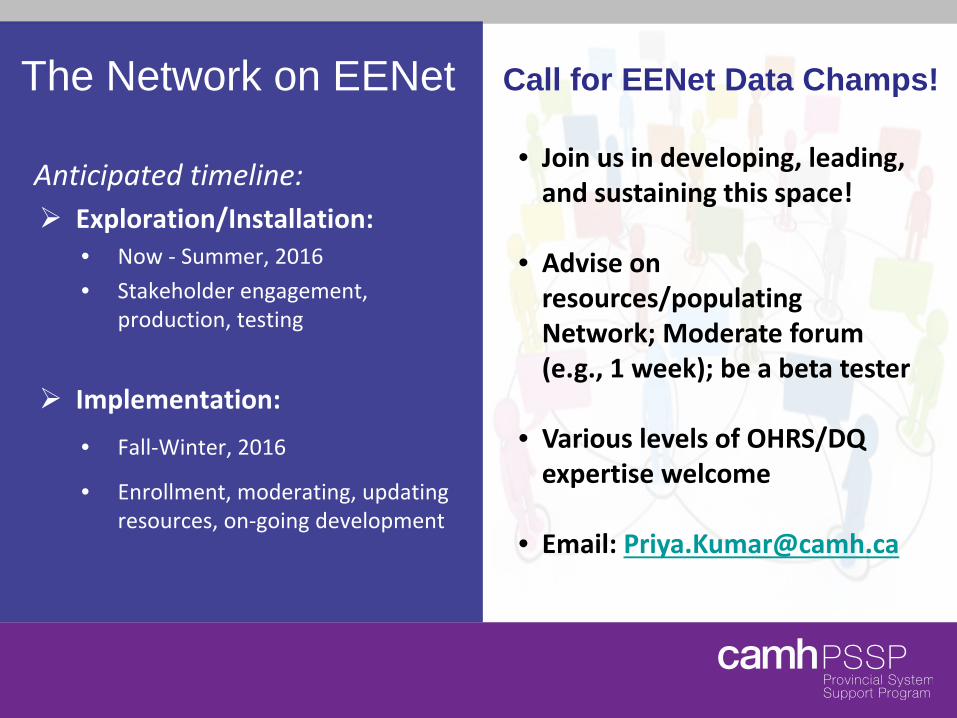
Anticipated timeline: Exploration/Installation:
• Now - Summer, 2016 • Stakeholder engagement,
production, testing
Implementation: • Fall-Winter, 2016
• Enrollment, moderating, updating resources, on-going development
The Network on EENet Call for EENet Data Champs!
• Join us in developing, leading, and sustaining this space!
• Advise on resources/populating Network; Moderate forum (e.g., 1 week); be a beta tester
• Various levels of OHRS/DQ expertise welcome
• Email: [email protected]

LHIN-based Network (Process-centric)
LHIN-based, Working Group + CoP
Identify, prioritize, and implement solutions to data quality challenges in the LHIN
Pilot with 2 LHINs
Process, results, best-practices to be shared via EENet Network

LHIN-based, Working Group + CoP
Identify, prioritize, and implement solutions to data quality challenges in the LHIN
Pilot with 2 LHINs
Process, results, best-practices to be shared via EENet Network
LHIN-based Network Anticipated Timeline
Exploration/Installation: Summer, 2016 • Stakeholder engagement,
identifying champions, challenge selection, implementation planning
Implementation: Fall-Winter, 2016 • Solution implementation,
process and outcome sharing on EENet Network (on-going)
(Process-centric)


Thanks to all participants for joining today’s webinar.
EENet would also like to give a special THANKS to Priya and Garth for today’s presentation!
Please take a few minutes to answer our survey on today’s webinar:
http://fluidsurveys.com/s/dtfp_costing_28Apr16/
The recording of today’s webinar will also be posted the project web page shortly.
The Costing Project: Data Quality in OHRS Reporting
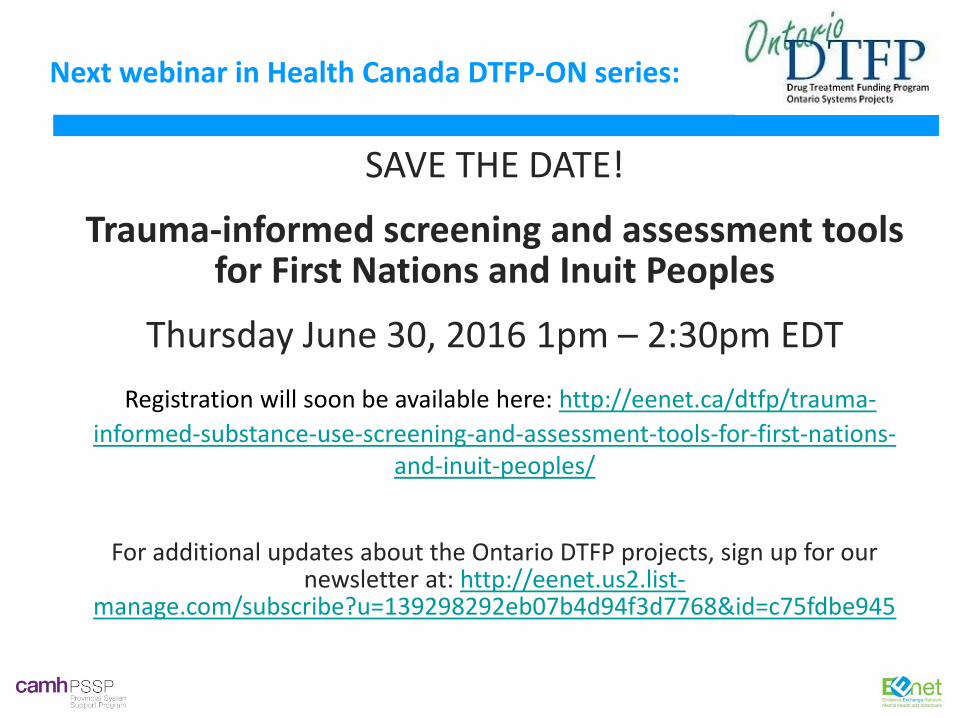
SAVE THE DATE!
Trauma-informed screening and assessment tools for First Nations and Inuit Peoples
Thursday June 30, 2016 1pm – 2:30pm EDT
Registration will soon be available here: http://eenet.ca/dtfp/trauma-informed-substance-use-screening-and-assessment-tools-for-first-nations-
and-inuit-peoples/
For additional updates about the Ontario DTFP projects, sign up for our newsletter at: http://eenet.us2.list-
manage.com/subscribe?u=139298292eb07b4d94f3d7768&id=c75fdbe945
Next webinar in Health Canada DTFP-ON series: