Embed Size (px)
Citation preview

THE COSTS AND BENEFITS OF URBAN
RIVER AND WETLAND REHABILITATION PROJECTS WITH SPECIFIC REFERENCE
TO THEIR IMPLICATIONS FOR MUNICIPAL FINANCE:
CASE STUDIES IN CAPE TOWN
Report to the Water Research Commission
By
Hugo van Zyl Independent Economic Researchers cc
Anthony Leman University of Cape Town School of Economics
Ada Jansen University of Stellenbosch
WRC Report No: KV159/04 ISBN No.: 1-77005-274-7
DECEMBER 2004

The cost and benefits of urban river and wetland rehabilitation projects 2

The cost and benefits of urban river and wetland rehabilitation projects 3
CONTENTS
ACKNOWLEDGEMENTS ................................................................................................................... 4
EXECUTIVE SUMMARY .................................................................................................................... 5
1 INTRODUCTION ......................................................................................................................... 8
1.1 Background .................................................................................................... 8 1.2 Approach ........................................................................................................ 8 1.3 Report structure .............................................................................................. 9
2 LITERATURE REVIEW ............................................................................................................. 9
2.1 The valuation of rehabilitation benefits ....................................................... 10
3 CASE STUDIES ON THE COSTS AND BENEFITS OF REHABILITATION .................. 13
3.1 The Lower Silvermine River upgrade .......................................................... 14 3.1.1 The impact of rehabilitation on property values .................................. 16 3.1.2 Flood attenuation benefits .................................................................... 18 3.1.3 Benefits associated with increased biodiversity .................................. 19 3.1.4 Rehabilitation project costs .................................................................. 19 3.1.5 Comparing rehabilitation costs and benefits ........................................ 20
3.2 Kuils River canalisation and rehabilitation .................................................. 22 3.2.1 The impact of rehabilitation on property values .................................. 22 3.2.2 Flood attenuation benefits .................................................................... 23 3.2.3 Rehabilitation project costs .................................................................. 24 3.2.4 Comparing rehabilitation costs and benefits ........................................ 24
3.3 Westlake River rehabilitation in Kirstenhof ................................................ 25 3.3.1 The impact of rehabilitation on property values .................................. 26 3.3.2 Flood attenuation benefits .................................................................... 27 3.3.3 Benefits associated with increased biodiversity .................................. 27 3.3.4 Rehabilitation project costs .................................................................. 27 3.3.5 Comparing rehabilitation costs and benefits ........................................ 28
4 FUNDING REHABILITATION ............................................................................................... 29
4.1 The municipal finance implication of rehabilitation projects ...................... 29 4.1.1 Calculating rates ................................................................................... 29 4.1.2 Assessment of Property Value in the City of Cape Town ................... 30 4.1.3 Financial returns from rehabilitation ................................................... 30
4.2 Potential funding mechanisms for rehabilitation ......................................... 32 4.2.1 Fiscal instruments ................................................................................ 32 4.2.2 User fees ............................................................................................... 32 4.2.3 Donations and grants ............................................................................ 33 4.2.4 Public-Private Partnerships .................................................................. 35 4.2.5 Volunteer contributions ....................................................................... 37
4.3 The applicability of potential funding mechanisms ..................................... 37 4.3.1 Identifying potential beneficiaries ....................................................... 38 4.3.2 The implications of land ownership ..................................................... 38 4.3.3 Gaining from association with rehabilitation projects ......................... 38 4.3.4 Recommendations on potential funding mechanisms .......................... 40
5 CONCLUSION ........................................................................................................................... 41
6 REFERENCES ............................................................................................................................ 42
7 APPENDIX .................................................................................................................................. 45

The cost and benefits of urban river and wetland rehabilitation projects 4
ACKNOWLEDGEMENTS
We would like to thank the Water Research Commission (WRC) for funding this project and Dr. Steve Mitchell of the WRC for his project management. The following people made valuable inputs without which this study would not have been possible:
Lorraine Gerans, Barry Woods, Martin Thompson, Nico Meyer, Brian Nicholson, Jan Botes, Mike Richardson (City of Cape Town), Evanne & Terry Rothwell (Silvermine Riverine Rovers), Julia Wood (Table Mountain Fund)
Fish Hoek estate agents: Derrick Redelinghuis (Pam Golding), Johan Le Roux (Coastal Estates), Lisa Jamieson (Seeff), Tony Deneys (De Kock Estates), Pierre Bezuidenhout (Aida)
Kuils River estate agents: Lenie Kruger (Marie Smit Properties), Brian Willemse (Antoinette properties), Uri Grobbelaar (Letitia Properties)
Kirstenhof estate agents: Bruce Haywood (Haywood & Brookes), Carol Polden (Seeff), Marion Chicken (Front Door Properties)

The cost and benefits of urban river and wetland rehabilitation projects 5
EXECUTIVE SUMMARY
Previous research has shown that Cape Town’s open spaces provide services to residents, and that these are reflected in property prices. Among the greatest sources of potential value are ‘water environments’. It also suggested that the utility these provide is particularly well reflected in the values of properties close to rehabilitated and well maintained water environments. This study provides more specific information on the costs and particularly the benefits associated with rehabilitation and alternative sources of funding for it.
When conducting a cost benefit analysis of rehabilitation projects, the estimation of costs is relatively straightforward. The estimation of benefits is far less simple as they are often intangible and do not appear as easily estimable financial flows. A review of the literature on the valuation of these benefits revealed that the ecological, aesthetic and recreational value of well maintained freshwater environments have long been recognised, and their measurement attempted. The property value approach (or hedonic pricing) has been used particularly extensively in urban settings.
After consultation with the City of Cape Town, three cost benefit case studies were selected to evaluate the economics of rehabilitation: the Lower Silvermine River upgrade, the Kuils River canalisation and rehabilitation, and the Westlake River rehabilitation in Kirstenhof.
The Lower Silvermine River upgrade, constructed in 2000, was conceived primarily to institute appropriate measures to control the flooding of properties in Fish Hoek and Clovelly. Improving the ecological functioning, aesthetics and recreational potential of the area were also important sub-goals. The project fulfilled its brief through a combination of engineering, indigenous landscaping and ongoing maintenance solutions with a total cost of approximately R10 million (in present value terms). The rehabilitation significantly upgraded the aesthetic and recreational potential of the area, turning the wetland area from an eye-sore to a far more secure attraction that is mentioned as a feature when houses are sold in the area. On the whole, the area has been transformed into a major growth point in Fish Hoek.
In order to calculate the value added to properties by rehabilitation, estate agents were asked to estimate the percentage increases in value due to rehabilitation. These estimates were averaged and multiplied by the value of the affected properties. The resulting estimated premium created by rehabilitation was R45 million for all the affected properties. Flood attenuation benefits with a present value of approximately R365 000 were estimated for the 13 existing houses (the estimate being based on damage costs avoided). In addition, preventative expenditures of R1 million (the approximate cost of filling and compacting on all open plots to allow for development) were used as a proxy for flood attenuation benefits on vacant land. Ecological benefits were not quantified. However, an assessment of Phase 1 of the project found that overall Habitat Integrity increased by 8 % to elevate this part of the river from a high Category 4 to a low Category 3 in the standard rankings of Habitat Integrity. The cost benefit analysis of the project showed a significantly positive net present value (NPV) of R36.3 million and a benefit cost ratio of 4.58:1 (over a 30 year period using a discount rate of 8%). These results remained positive when subjected to sensitivity analysis focused on the impacts of lower levels of property price increases due to rehabilitation.
The total costs of the project were dominated by cost items dedicated to flood control and not aesthetic enhancement. Yet the benefits were dominated by aesthetic and
The cost and benefits of urban river and wetland rehabilitation projects 6
recreational benefits, as reflected in increased property values. Had the area, hypothetically, not required flood attenuation measures the costs of the project would have been reduced substantially while the benefits of the project would have remained high. This indicates that the project would have had a higher benefit cost ratio if, hypothetically, rehabilitation had been its sole aim. By the same token, if flood attenuation measures such as canalisation were implemented without landscaping and without re-establishing a thriving natural environment, there would have been few or no aesthetic and recreational benefits. Such low benefits indicate how the overall benefit cost ratio of the project could be negative if a narrow ‘engineering only’ approach is followed.
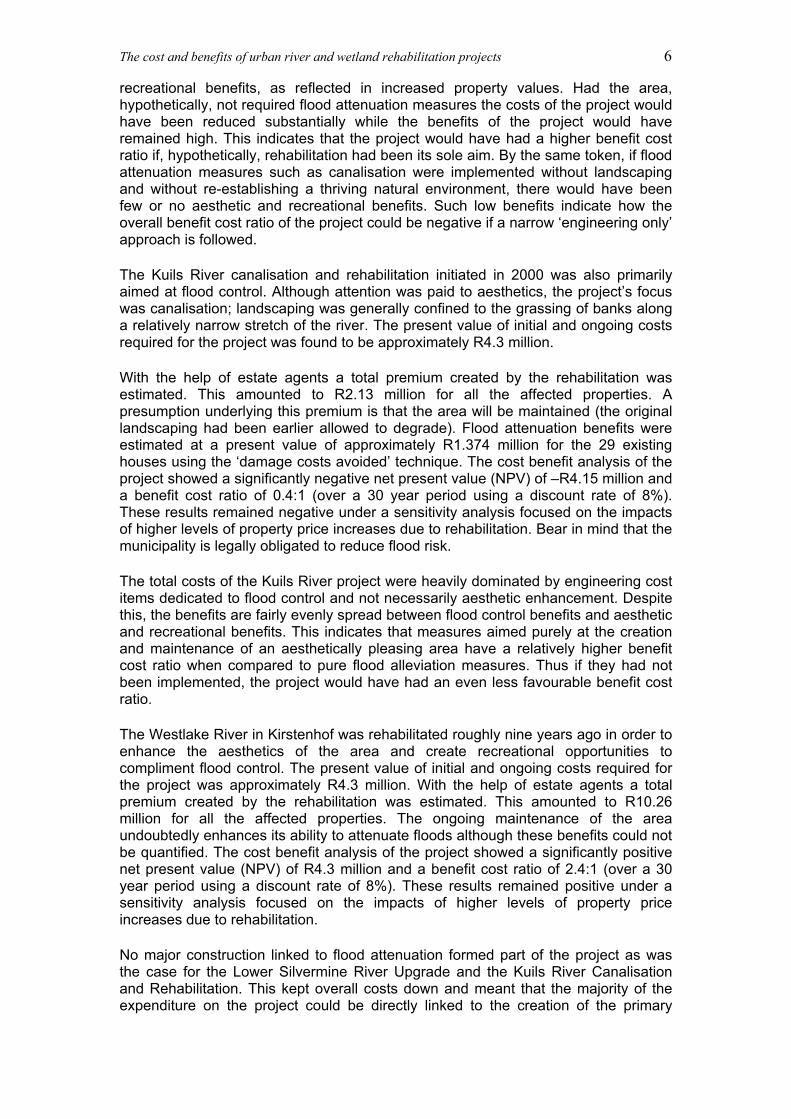
The Kuils River canalisation and rehabilitation initiated in 2000 was also primarily aimed at flood control. Although attention was paid to aesthetics, the project’s focus was canalisation; landscaping was generally confined to the grassing of banks along a relatively narrow stretch of the river. The present value of initial and ongoing costs required for the project was found to be approximately R4.3 million.
With the help of estate agents a total premium created by the rehabilitation was estimated. This amounted to R2.13 million for all the affected properties. A presumption underlying this premium is that the area will be maintained (the original landscaping had been earlier allowed to degrade). Flood attenuation benefits were estimated at a present value of approximately R1.374 million for the 29 existing houses using the ‘damage costs avoided’ technique. The cost benefit analysis of the project showed a significantly negative net present value (NPV) of –R4.15 million and a benefit cost ratio of 0.4:1 (over a 30 year period using a discount rate of 8%). These results remained negative under a sensitivity analysis focused on the impacts of higher levels of property price increases due to rehabilitation. Bear in mind that the municipality is legally obligated to reduce flood risk.
The total costs of the Kuils River project were heavily dominated by engineering cost items dedicated to flood control and not necessarily aesthetic enhancement. Despite this, the benefits are fairly evenly spread between flood control benefits and aesthetic and recreational benefits. This indicates that measures aimed purely at the creation and maintenance of an aesthetically pleasing area have a relatively higher benefit cost ratio when compared to pure flood alleviation measures. Thus if they had not been implemented, the project would have had an even less favourable benefit cost ratio.
The Westlake River in Kirstenhof was rehabilitated roughly nine years ago in order to enhance the aesthetics of the area and create recreational opportunities to compliment flood control. The present value of initial and ongoing costs required for the project was approximately R4.3 million. With the help of estate agents a total premium created by the rehabilitation was estimated. This amounted to R10.26 million for all the affected properties. The ongoing maintenance of the area undoubtedly enhances its ability to attenuate floods although these benefits could not be quantified. The cost benefit analysis of the project showed a significantly positive net present value (NPV) of R4.3 million and a benefit cost ratio of 2.4:1 (over a 30 year period using a discount rate of 8%). These results remained positive under a sensitivity analysis focused on the impacts of higher levels of property price increases due to rehabilitation.
No major construction linked to flood attenuation formed part of the project as was the case for the Lower Silvermine River Upgrade and the Kuils River Canalisation and Rehabilitation. This kept overall costs down and meant that the majority of the expenditure on the project could be directly linked to the creation of the primary

The cost and benefits of urban river and wetland rehabilitation projects 7
benefits of the project – i.e. aesthetic enhancement of the area and the creation of recreational opportunities.
Even if the desirability, economic or otherwise, of rehabilitation has been conclusively established its funding is often uncertain. For this reason the appeal of rehabilitation projects should increase if the financial resources required for rehabilitation can be recouped. Despite their benefits, the potential for increased municipal funding of rehabilitation projects seems limited for the foreseeable future. This is primarily due to other more urgent priorities coupled with a lack of clear municipal financial returns from such projects given current rate structures. Rehabilitation projects could, however, have redistributive impacts as they might increase rateable property values in one area, but would lower them in areas that did not benefit from rehabilitation (assuming that the pools of houses and buyers are taken as given). Rehabilitation may also generate long-run advantages for the municipality. These are centred on the enhancement of a large viable rateable base of properties and are outlined in the report.
Other, non-municipal, beneficiaries of rehabilitation projects, mainly local residents and businesses, should be more willing to fund rehabilitation projects particularly if they are made aware of its potential benefits. The ideal institutional structures for these projects will vary, but experience has shown that partnerships between local residents, businesses, local government institutions and NGOs increase the chances of success.
This research suggests that further study may be relevant on the role of rates in generating municipal income particularly when compared to the role of revenues from the sale of water. The incentive effects of current rate structures not only for supporting rehabilitation and other environmental improvements, but also for encouraging water conservation seem worthy of further investigation.

The cost and benefits of urban river and wetland rehabilitation projects 8
1 INTRODUCTION
1.1 Background
The ecological, aesthetic and recreational values of open water and riverine environments in urban areas have long been recognised and quantified in the environmental economics literature. A recent study for the City of Cape Town on the value of open spaces showed that water environments have one of the greatest potential values among urban open spaces (Turpie et al., 2001). This potential was particularly well reflected in the value of properties in close proximity to well maintained water environments but failed near degraded areas. Rehabilitation thus seems to have the potential to unlock added value from urban water environments.
While it is easily asserted that rehabilitation offers net benefits to society, there is a lack of specific information on the costs and benefits associated with rehabilitation and the alternative sources of funding for it. As a result, uniformed decision making often allows uneconomic degradation to persist. There is thus a need for information on the changes in values brought on by rehabilitation. These include; direct consumptive uses (such as harvesting), direct non-consumptive uses such as recreation, indirect uses such as ecosystem services, option and existence values. While all these value are worth considering, if rehabilitation is to be promoted the primary focus needs to be on values providing a financial incentive for the improvement of the water environment. In urban areas, property price increases generate such a value stream.
The appeal of rehabilitation projects should increase if the financial resources required for rehabilitation can be recouped in some way by those involved in funding them. This relationship between the funders and beneficiaries of rehabilitation needs to be investigated in order to better understand the potential for improving the funding of rehabilitation. For example, if the money municipalities spend on improvements can be recouped by higher rates revenues from higher property values linked to an improved water environment they should be far more likely to implement rehabilitation programs. Favourable benefit cost ratios for rehabilitation projects could also encourage community groups to undertake improvement projects if for no other reason than to increase the value of their investment in housing.
1.2 Approach
The study approach involved the following six steps:
1. Review the environmental valuation literature on the impact of improvements to the water environment on environmental values with particular emphasis on values reflected in property price increases.
2. Select three case studies based on relevance and availability of data in collaboration with the City of Cape Town. The aim was to choose case studies that offered the greatest number of potential lessons and covered a variety of rehabilitation actions and outcomes.
3. Estimate the costs of rehabilitation (primarily rehabilitation expenditures) based on information from municipal officials.
4. Estimate the benefits of rehabilitation based on analysis of property market impacts, recreational uses and ecosystem services. Property market impacts were

The cost and benefits of urban river and wetland rehabilitation projects 9
the focus as they have the greatest potential to yield direct financial benefits. They were analysed using structured estate agent interviews to gauge what had happened to the value of properties in close proximity to rehabilitated areas. Databases of property sales were also scrutinised for any evidence of property value changes brought about by rehabilitation. Unfortunately, statistical modelling of property value impacts using the hedonic approach was not possible owing to inadequate property sales data. Recreational/tourism use and ecosystem services benefits were assessed and quantified where relevant. The value of ecosystem services, mainly in the form of flood attenuation, was estimated based on data from City of Cape Town. Potential existence and option value increases were mentioned where relevant, but not quantified as they do not lead to direct financial benefits to anyone and their estimation requires resource-intensive and sometimes controversial survey techniques.
5. Compare costs and benefits and draw lessons from the differences in cost benefit results for each case study. The primary lessons focused on understanding which types of rehabilitation intervention tend to yield the greatest benefit cost ratios.
6. Investigate funding mechanisms for rehabilitation other than direct funding by local authorities. This was done through interviews with municipal officials, and community groups as well as a review of the literature on funding mechanisms.
1.3 Report structure
This report is structured as follows:
Section 2 contains a literature review focusing on the estimation of the benefits associated with rehabilitation, using the property value approach.
Section 3 presents the results of three case studies in Cape Town on the cost and benefits associated with rehabilitation projects.
Section 4 focuses on reviewing current funding as well as potentially applicable funding mechanisms for rehabilitation.
2 LITERATURE REVIEW
Before commencing with the case studies on the costs and benefits of rehabilitation in section 3, a literature review was undertaken. Cost benefit analysis (CBA) is a relatively well-known technique in economics and the literature on its methodological underpinnings has been reviewed elsewhere (e.g. Conningarth, 2002 and van Zyl & Leiman, 2002). Any further review for the purposes of this study was therefore considered unnecessary. The estimation of cost and benefit values is generally the most challenging part of a CBA. In the case of rehabilitation projects, the estimation of costs is relatively straightforward as they are primarily financial. On the benefit side, the estimation of value is far less simple. This is because benefits do not come in the form of easily estimable financial flows. Instead they are far less tangible taking the form of ecosystem improvements, recreational benefits, aesthetic upgrading, and so forth. With this estimation challenge in mind, the environmental economics literature on the valuation of rehabilitation benefits is reviewed before commencing with the case studies.

The cost and benefits of urban river and wetland rehabilitation projects 10
2.1 The valuation of rehabilitation benefits
The ecological, aesthetic and recreational value of well maintained freshwater environments has long been recognised and measured in the environmental economics literature. Numerous studies have quantified the value of the water environment (Heimlich et al., 1998 reviewed 33 studies that attached values to wetlands including rivers and lakes; in a more recent review Woodward & Wui, 2001 referred to 39 studies). Many of these studies attempted to measure the Total Economic Value of water environments incorporating direct and indirect use value, non-use value, option value and existence value as outlined in figure Figure 1 below. This approach allows for the recognition of all economic values and commonly requires the simultaneous application of market value, surrogate market and simulated market approaches to measure values. The results of such studies are often used as a powerful argument in favour of riparian conservation. Examples are also to be found of studies that have focused on a single value type. For instance, there have been CVM studies focused on the value for recreational purposes of better water quality (Georgiou et al., 1998 for a beach in the UK; Green & Tunstall, 1991 for rivers in the UK; Heiberg & Ehm, 1987 for fjords in Norway and Sutherland & Walsh, 1987 for rivers in Massachusetts, USA).
Source: Turpie et al., 2001
Figure 1. Conventional classification of the values of environmental amenities
For the purposes of this study we were most interested in the value of freshwater environments and their influence on property prices. More specifically, how property values change when freshwater environments are rehabilitated. A deliberate choice was made to focus on the property prices as a reflection of rehabilitation value, as this value stream reflects safety, aesthetic and recreational improvements, and is both significant and measurable.
Indirect use value
(ecosystem functions)
Existencevalue
Direct Use Values
ENVIRONMENTAL GOODS & SERVICES
USE VALUE NON-USE VALUE
TOTAL ECONOMIC VALUE
Consumptiveuse value
(e.g. harvesting)
Non-consumptiveuse value
(e.g. tourism)
Optionvalue
Indirect use value
(ecosystem functions)
Existencevalue
Direct Use Values
ENVIRONMENTAL GOODS & SERVICES
USE VALUE NON-USE VALUE
TOTAL ECONOMIC VALUE
Consumptiveuse value
(e.g. harvesting)
Non-consumptiveuse value
(e.g. tourism)
Optionvalue

The cost and benefits of urban river and wetland rehabilitation projects 11
A number of studies have measured the value of freshwater environments using the property price or hedonic pricing approach. A recent study for the City of Cape Town on the economics of open spaces showed that water related spaces are amongst those with the greatest potential to influence property values (Turpie et al., 2001). This potential was particularly well reflected in the value of properties close to well maintained water environments. The examples of premia achieved by waterfront properties in Marina Da Gama on Zandvlei near Muizenberg in Cape Town are particularly significant, with prices up to 35% higher than those of similar properties that lacked water frontage (van Zyl & Leiman, 2002). It is important to bear in mind that the Marina was constructed so that waterfront home owners could achieve maximum private benefits from their positions.
Mahan et al. (2000) analysed four different wetland types (forested, scrub-shrub, emergent vegetation and open-water wetlands) as well as lakes and rivers or streams in Portland, Oregon. They found that increasing the size of the nearest wetland by one acre yields an increase of $24.39 while reducing the distance to the nearest wetland by 1000 feet yields an increase of $436.17 relative to the mean house value of $122 570. Their results imply a 1.9% difference between houses bordering on wetlands and those at the mean distance from wetlands (Earnhart, 2001). Interestingly they did not find that wetland type had any influence. This seems somewhat counter-intuitive and does not agree with the findings of others, notably those of Doss and Taff (1996) discussed below. The fact that Mahan et al. performed hedonic analysis on a relatively large area with over 4 500 wetlands and other deepwater habitats such as lakes may have added complexity to the analysis and made it less suited to analysing the influence of wetland type. For other types of water bodies, Earnhart (2001) notes that the results of Mahan et al. (2000) imply a 1.1% difference between houses that border on streams and those the mean distance from streams. In the case of lakes the difference is found to be a premium of 7.1%. Lansford & Jones (1995) generated a significantly higher premium of 31.8% for lakes. They suggest that the significantly larger premium associated with lakes reflects the private access to recreational opportunities provided by these properties.
Doss and Taff (1996) focused on two questions in their analysis: ‘do people in urban areas prefer to live closer to or farther from wetlands?’ and, ‘are these preferences dependent on the type of wetland?’ They asked the latter question for four different wetland types, viz. forested, emergent vegetation, open water and scrub-shrub wetlands. Living closer to forested wetlands was found to impact negatively on property values by $145 for every ten meters closer. The reason given for this negative impact was the obstruction of views created by forested areas. Living ten meters closer to emergent vegetation, open water and scrub-shrub wetlands was found to impact positively on property values by $136, $99 and $145 respectively. This result implies that moving two blocks closer to scrub-shrub wetlands would increase property values by $5 800, or approximately 6% taking the mean house value used in the study ($104 956). Doss and Taff (1996) also estimated a premium associated with a lake view at $46 000, an amount similar to that found by Lansford and Jones (1995).
Kulshreshtha & Gilles (1993) investigated the impact of river views on property values. They found that houses with river views sold for $11.48 per square foot more than those without. This translates into an increased value of $14 166 for the average-sized house in the sample. Unfortunately, it is not possible to calculate the percentage of an average house value that this represents, as an average house value is not mentioned in the study.

The cost and benefits of urban river and wetland rehabilitation projects 12
Earnhart (2001) estimated that rivers and streams generate premia of 3.2% and 2.5% respectively for mean house prices in Connecticut.
Rather than analysing the impact of proximity per se, Netusil (2004) estimated the percentage change in property price due to a 1% change in the overall amount of water resources and open spaces within a quarter of a mile of properties. Using this method, a 1% increase in the extent of public wetlands and rivers increases property values by approximately 0.7% while the same increase results in a 1.57% decrease in values for private wetlands. Increases in the area covered by public streams also results in significant increases in value while increases on private streams do not. This finding seems to highlight the importance of public access to areas and not just their aesthetic appeal.
The studies above were not primarily concerned with the impact of variations in the quality of water environments (i.e. quality was taken as given). Other studies have focused on this issue. Earnhart (2001) estimated that restoring marshes in Fairfield, Connecticut increased nearby house values by an average of 16.6% (As a caveat, however, the author noted that this estimate seemed disproportionately large and cautioned that it may have been influenced by co-linearity and thus be an overestimate). Legget & Bockstael (1999) focused on the effects of improved water quality in Chesapeake Bay and found that houses in areas with average acceptable water quality generate a premium of 2% over those in areas with below average water quality.
The studies discussed thus far have all attached values to freshwater environments (with the exception of Legget & Bockstael, 1999) in a given, generally satisfactory, state. Studies specifically on the increased value associated with rehabilitation are unfortunately far less common.
Steiner & Loomis (1995) calculated the property value impacts of urban stream restoration measures in Contra Costa, Santa Cruz and Solano Counties, California. The benefits of restoration programs were noted as intact yards, minimal damage to trees, structures and landscaping, healthier streamside parks and the ecological benefits of returning streams to a more natural state. They estimated the benefits of two packages of measures associated with stream restoration: package A consisted of an education trail, maintenance of fish habitat and acquisition of land and/or easements, while package B involved stabilising stream banks (included cleaning obstructions, re-vegetating banks and cleaning up the stream) and reducing flood damage. Package A was found to increase residential property values by 11% to 13% while package B led to increases of 3% to 5%. A joint model of the combined impacts of both packages was associated with a 13% increase in values.
Improved riparian quality need not raise property prices. This is particularly true if the improvements reduce other services offered by a river - Mooney & Eisgruber (2001) focused on the property value implications of a plan to encourage property owners to plant riparian buffers in an effort to reduce stream temperature and thus improve habitat for salmon. They found that the planting of buffers decreased the value of stream-front properties and hypothesized that this was due to the obstruction of views and supports the findings of Doss and Taff (1996) regarding the negative property value impacts of forested wetlands. Stream frontage without a buffer obstructing views was found to add 7% to the average house value. In their model, planting a 50 foot riparian buffer was found to decrease property values by between 3% (where decrease per additional foot planted was assumed constant) and 11% (where decreases were assumed to increase per additional foot planted). This decrease is attributed to an inferior view.

The cost and benefits of urban river and wetland rehabilitation projects 13
3 CASE STUDIES ON THE COSTS AND BENEFITS OF
REHABILITATION
This section presents the case studies that were conducted on the benefits and costs of rehabilitation. The first step in the process was to choose appropriate case studies. With the help of the City of Cape Town’s Catchment Management and Planning and Environment departments a number of potential case studies were identified after which site visits were conducted. These included:
The Lower Silvermine River upgrade in Fish Hoek The Kuils River canalisation and rehabilitation near the Kuils River CBD The flood control measures and rehabilitation along the Lourens River in
Somerset West The establishment of Langvlei in Retreat
From this list, the Lower Silvermine River upgrade and the Kuils River canalisation and rehabilitation were chosen as most appropriate for further study. These two areas are surrounded by residential properties having clear potential to benefit from rehabilitation. This was not the case with the other two - In the case of the Lourens River, the section that had been rehabilitated was relatively small and as a result had few houses nearby. In addition, the area was not really heavily degraded prior to rehabilitation, decreasing the likelihood that improvements would yield clear benefits. Langvlei was discarded as its primary component was the establishment of park lands around the vlei rather than its rehabilitation. In addition to these two case studies it was decided also to investigate the impact of the Westlake River rehabilitation where it flows through Kirstenhof. This area was chosen as rehabilitation had taken place and an attractive network of trails had been established along the river and wetland areas in the suburb with the potential to result in property value increases.
The valuation exercise followed a ‘client based’ approach as is often advocated in the conservation finance literature (see IUCN, 1998). This approach asks, who benefits from improvements to the environment and can they realistically be made to pay for their benefits? This helps ensure that valuations are policy relevant. For example, if there is a very low likelihood of securing funding from those who may attach a high existence value to a site, then it may not be worth conducting the often resource intensive surveys required to quantify them. The valuation exercise is taken an important step further by investigating possibilities to secure funding.
In order to assess property value impacts interviews were conducted with estate agents that had long term experience in the case study areas. The agents were first asked to comment on the impacts of the rehabilitation on property values in general terms and then asked to quantify the increased property values that could be attributed to rehabilitation. They were specifically asked to identify the properties that were affected and estimate the percentage increase in property values that could be attributed to rehabilitation. The average of the estimates was then used to generate estimates of the increase in value by multiplying the average percentage increase by the average value of the properties affected. Average current values obtained from the agents were supplemented by relevant sales data that was available from the Residential Property Price Ranger, a database recording all sales conducted through estate agents.

The cost and benefits of urban river and wetland rehabilitation projects 14
Estate agents, municipal officials and local community groups (where relevant) were asked about recreational use of the rehabilitated areas. As the bulk of recreational users were local residents living within walking distance of the site, it was felt that this ‘use value’ would already have been captured in property values. This precluded use of a travel cost survey to analyse the recreational benefits of the rehabilitation.
The primary ecosystem service value associated with the rehabilitation projects was flood attenuation. This was the primary motivation for initiating the projects. Studies commissioned by the City of Cape Town outlined changes in 1 in 50 year flood lines which were used to quantify flood attenuation benefits. In the case of the Lower Silvermine and Westlake Rivers, rehabilitation also enhanced biodiversity. Particularly in the case of the Lower Silvermine River, a number of indigenous plant species re-appeared and were re-introduced, and conditions favourable for the return of fauna such as bird and frog species were created. Information on the construction and maintenance costs of rehabilitation was obtained from the City of Cape Town municipality.
3.1 The Lower Silvermine River upgrade
The Silvermine River is a short, naturally perennial, river approximately 12 km in length, rising at an altitude of 640 m in the Steenberg Mountains north-west of Fish Hoek. The catchment area covers approximately 21 km2. The river flows south-east across the Steenberg Plateau before cutting south through a deeply incised valley where it is joined by a number of small tributaries that drain the surrounding mountains. In its lower reaches, it meanders through unconsolidated sediments before entering False Bay via a small estuary in the north-east corner of Fish Hoek Bay at Clovelly Beach. It is one of the few rivers in the Cape Peninsula considered to have a high conservation status (Southern Waters, 2000).
The technical investigations that led to the Lower Silvermine River upgrade were initiated as part of a road planning exercise in the area. The Fish Hoek Northern Bypass was planned in 1969 as a freeway system linking Kommetjie and Fish Hoek and included the canalisation of the Lower Silvermine River. A tunnel link from Fish Hoek to Boyes Drive was also considered and a large area of land was ‘frozen’ from development to accommodate the proposed corridor. Over the years Fish Hoek expanded to the boundaries of this land, and the affected land owners pressured the municipality to either expropriate the land or allow development.
In 1988 ARCUS GIBB were appointed to re-plan the Fish Hoek Northern Bypass with a view to establishing an appropriate road reserve. During this study their brief was extended to include the re-planning of the northern area of Fish Hoek adjacent to the Northern Bypass and the determination of flood control measures for the affected reaches of the Lower Silvermine River.1 The main issues and concerns of interested and affected parties about the broader environment and the Silvermine River identified during the Fish Hoek Northern Area Re-planning Implementation Plan were as follows:
The Lower Silvermine River was degraded and in need of rehabilitation. The open space areas in and around the Lower Silvermine River needed to
be upgraded and formalised, to facilitate access to these areas by neighbouring communities.
1 Information on the Lower Silvermine River upgrade was sourced from SAACE, 2000 and personal communications with Martin Thompson, City of Cape Town, 2004.

The cost and benefits of urban river and wetland rehabilitation projects 15
The Silvermine Corridor and the Silvermine River were in need of a management plan.
Measures to alleviate flooding were needed. Design guidelines, aesthetic controls, and urban development in the study
area needed to be prepared and applied.
In view of these concerns, the Lower Silvermine River upgrade project’s brief was to:
Institute appropriate measures to control the flooding of properties in Fish Hoek and Clovelly.
Improve the ecological functioning of the Lower Silvermine River. Institute measures to control the aesthetic quality of the area. Prepare and implement a management plan.
Source: SAACE, 2000
The project fulfilled its brief through a combination of engineering and indigenous landscaping solutions. An environmental management team, consisting of a landscape architect, a freshwater ecologist, a hydrogeologist and a botanist were involved in design and construction. They appointed an environmental site officer who oversaw the implementation of environmental measures stipulated by the management team. The officer held environmental awareness programmes for the contractor’s staff, sub-contractors and suppliers. In addition, an environmental management committee that included members of the local community, local authority and Cape Nature Conservation was appointed to monitor the project. This committee held monthly site meetings to ensure that high environmental standards were maintained. A notice board was also placed at the Fish Hoek public library to inform the local community of developments at the site.
Flood control measures included the excavation of a flood plain and the use of excavated material to fill adjacent properties until they were above the 1 in 50 year flood line. Two large gabion structures designed to act as weirs and stilling basins, as well as berms were constructed, as well as the channels necessary to minimise flood risk. The 55 000m2 wetland and surrounding areas were carefully landscaped with indigenous vegetation and designed to meet ecological, aesthetic and recreational requirements. Bird perches and small islands were included in the wetland, attracting birds to the area. Twenty-five percent of the construction costs of the project were allocated to landscaping to ensure an aesthetically pleasing and well-functioning environment. The recreational potential of the site was realised mainly through the establishment of trails and a wooden bridge over the wetland area. In addition to these facilities, information boards, benches and a 60 car gravel parking lot were provided. The area has become extremely popular with local walkers.
During rehabilitation the Friends of Silvermine River participated in ensuring that environmental goals were met. After rehabilitation the Riverine Rovers were formed out of a sub-committee of the Friends of Silvermine and continue to play an important role in ensuring the continued conservation and sound management of the area. The group numbers approximately 12 members who are involved in activities such as alien hacking, rubbish removal, monitoring public behaviour (e.g. ensuring dogs are not let off their leashes in the wetland), educational projects (e.g. arranging school outings and other activities such as inputs to the frog census), the raising of funds for maintenance and the promotion of the area. A Silvermine River Wetlands Route pamphlet has recently been compiled with the help of the group and funding from the Clovelly Country Club for use by Fish Hoek Valley Tourism to promote the area and inform visitors. The area has also been included as a suggested stop on the ‘Deep

The cost and benefits of urban river and wetland rehabilitation projects 16
South’ route that covers areas in the South Peninsula relatively nearby to Cape Point.
3.1.1 The impact of rehabilitation on property values
In order to establish how the rehabilitation of the Lower Silvermine River impacted on property values, interviews were conducted with five agents with long term experience in the area. All the agents agreed that the rehabilitation had made a significant impact on the property market. They pointed out that before rehabilitation the area was an eye-sore prominently positioned at the northern entrance to Fish Hoek and Clovelly. It conveyed a negative first impression to visitors and residents alike and thus impacted on the overall desirability of Fish Hoek. Historically the area of Fish Hoek near the river was perceived as the least desirable residential zone. Aside from aesthetic considerations, there was a problem with squatters in the wetland area who were perceived as a nuisance and a security risk. Unfortunately these problems persist further up the river and in the dunes nearby as squatters that were relocated to the nearby settlement of Ocean View returned to these areas. In addition, there were vacant lots adjacent to the river that were unsightly and created uncertainty in the property market.
The rehabilitation project provided the impetus for a major turnaround in the status of the area. It provided a significant upgrade in the aesthetics of the area, turning the wetland from an eye-sore into an attraction that is mentioned as a feature when houses are sold in the area. This improvement was felt by all nearby residents, but most significantly by those with a view of the area from their houses. It provided new recreational opportunities: walking trails and increased bird watching opportunities. Understandably these opportunities have been most widely utilised by those within walking distance of the area. However, the provision of convenient parking has encouraged the use of the area by all Fish Hoek and Clovelly residents, as well as others not living in the area. Although use by tourists is still low, the publication of a “Silvermine River Wetlands Route” pamphlet and other efforts by Fish Hoek Valley Tourism to promote the area should bear fruit. Finally, the project facilitated a solution to the squatting problem in the area through the relocation of squatters. Bear in mind that although squatters were relocated to Ocean View, they returned to an area higher up the river and in the nearby dunes and continue to cause problems in that area.
The improvements associated with rehabilitation paved the way for the establishment of new housing complexes on vacant land on the southern (Fish Hoek) side of the river that formerly would not have been approved due to flood risks. In total, 8 secured complexes consisting of stands averaging 500 m2 have been established since 2000. All of these complexes were designed to take advantage of views of the rehabilitated area. Their establishment further enhanced the property market in the area - they are regarded as superior to the housing stock existing nearby. On the whole, the area has been transformed into a major growth point in Fish Hoek. Most agents felt that it not only benefited the area near the river, but also the rest of Fish Hoek through the creation of a new aesthetic and recreational amenity for everyone which enhanced the suburb’s entrance.
After discussing the general implications of the rehabilitation project, the agents were asked to identify properties affected by the rehabilitation and to estimate the percentage increase in their values that was attributable to rehabilitation. Agents felt that it most appropriate to divide houses into those with views and recreational benefits and those with recreational benefits alone (by virtue of their proximity to the rehabilitated area).

The cost and benefits of urban river and wetland rehabilitation projects 17
3.1.1.1 Houses with views and recreational benefits
All five agents agreed that properties bordering on the area or with nearby views of it increased fairly significantly in value because of the rehabilitation. These included the 44 properties bordering on it on the Fish Hoek side as well as the 18 properties on the Clovelly side. Estimates for the percentage increase in the value of these properties ranged from 15% to 30%. The majority of the houses on the Fish Hoek side were built in the last five years and with the knowledge that the wetland would be rehabilitated and were therefore designed to take advantage of the wetland view. In addition all the houses on the Clovelly side face the wetland area and offer good views of it. However, on the Fish Hoek side there is a row of 16 older houses that are slightly removed from the main rehabilitated area and do not offer the kinds of views to be found in other Fish Hoek houses bordering the wetland. Given this, the increases associated with these houses were assumed to be 75% of those for the houses with better views.
In addition, there are 27 properties in Clovelly that don’t border on the wetland but nevertheless enjoy nearby views of it due to their elevation above the row bordering on the wetland. It stands to reason that these houses would have experienced an increase because of the improved view. However, the houses in question also have mountain, sea and valley views making the significance of wetland views lower than for houses bordering on the wetland that only offer wetland and mountain views. The responses of the agents indicated that the magnitude of increases for these houses was less clear. One agent claimed that increases were on a par with those for houses bordering on the wetland while others thought a 10% increase was more plausible. Given this, the increase in value for this group of houses was assumed to be 60% of that for houses bordering on the wetland.
3.1.1.2 Houses enjoying recreational benefits alone
Agents agreed that price increases have also occurred for houses that are near to the rehabilitated area, but having no view of it. These increases were ascribed to the improved recreational potential of the area as well as the appeal of living near an aesthetically pleasing amenity. It was not obvious how far from the wetland area the effects of this price increase extended, but the majority of agents agreed that it would be reasonable to assign a 5% increase to all properties within a five minute walking distance. The properties in question (totalling 179 in Clovelly and 440 in Fish Hoek) were identified by means of timed walks into nearby residential areas.
In order to calculate the value added to properties by rehabilitation, the percentage increases estimated by all agents were averaged. These percentages were then multiplied by the value of the affected properties, estimated with the help of the agents and their databases. Using this approach the total premium created by rehabilitation was estimated at R45 million. Approximately half of this total accrued to properties with no view of the rehabilitated area, but with recreational access. Table 1 below presents the results of this exercise for the areas in question:

The cost and benefits of urban river and wetland rehabilitation projects 18
Table 1: Property value increases due to rehabilitation at the Lower Silvermine River
AreaNumber of
affected properties
Average value of
each property (R mil.)
Total value of affected
properties (R mil.)
% premium due to rehab.
Value of rehab.
Premium (R mil.)
Clovelly 31 R 1.00 R 31.00 22.0% R 6.82Fish Hoek (new houses) 44 R 0.80 R 35.20 22.0% R 7.74Fish Hoek (older houses) 16 R 0.80 R 12.80 16.5% R 2.11
Clovelly 27 R 1.30 R 35.10 15.0% R 5.27
Clovelly 179 R 1.10 R 196.90 5.0% R 9.85Fish Hoek houses 286 R 0.75 R 214.50 5.0% R 10.73Fish Hoek flats 154 R 0.33 R 50.05 5.0% R 2.50
R 45.01
Properties bordering on the rehabilitated area with views
Properties with nearby views of the rehabilitated area (not bordering on it)
Properties near the rehabilitated area with no views
Total for all properties affected by rehabilitation:
3.1.2 Flood attenuation benefits
The primary original motivation for the Lower Silvermine River upgrade was flood attenuation. The lower reaches of the Silvermine River are naturally prone to flooding during peak rainfall events and properties in Fish Hoek and Clovelly were under threat. This was unacceptable to the municipality, who are responsible for flood protection. With this in mind, the upgrade was planned to place both existing houses and plots where housing was proposed above the 1 in 50 year flood line. This was achieved primarily by excavating a new river channel and using the excavated material to fill and raise areas below the 1 in 50 year line.
Quantification of flood attenuation benefits was done for houses and plots affected by the shift in the 1 in 50 year flood line. For the existing houses a ‘damage costs avoided’ approach was used. It was assumed that the average value of damages from a 1 in 50 year flood would be R100 000 per house including damage to structures and house contents. since one cannot predict the timing of such floods (i.e. whether the next will occur in one year’s time or in 50 years), it was decided to use a discounted average of potential damage costs for each year between 2002 and 2052 using an 8% discount rate. This average (approximately R28 000) was then multiplied by 13 to capture the 13 existing houses formerly below the flood line. This yielded a present value for avoided damages of approximately R365 000.2
For plots that were below the 1 in 50 year flood line, quantification of flood attenuation benefits was done using a preventative expenditures approach. Lying
2 The number of affected houses was counted off the map showing the change in the 1 in 50 year flood line in Gibb Africa (1998)

The cost and benefits of urban river and wetland rehabilitation projects 19
below the 1 in 50 year flood line meant that these plots had been effectively frozen from development. Once raised above the flood line, these plots were all saleable. Given their marketability, the cost of raising them above the flood line is therefore a minimum estimate of the benefit provided. We have therefore used the approximate cost of filling and compacting on all open plots as a proxy for flood attenuation benefits. After discussions with the project engineers it was agreed that approximately 20 000 m3 of land needed to be filled to a height of about half a metre, requiring 10 000 m3 of fill. To have imported the fill, stripped existing topsoil, placed the fill and compacted it would have cost approximately R1 million at a conservative cost of R100/m3. By contrast, filling was supplied at no cost from the excavations.
As a result of land filling by the municipality affected private property owners below are were no longer required to employ hydrologists to determine the 50 year flood line on individual properties before commencing house building. The local authority’s approval of proposed flood safety measures required from a developer is also no longer necessary.
3.1.3 Benefits associated with increased biodiversity
While flood control was the main aim of the project, it also succeeded in its
subordinate objective: to improve ecological functioning and biodiversity. An
assessment of Phase 1 of the project just after its completion in 2001 measured
whether ecological improvements had taken place by applying a composite index of
Habitat Integrity. The assessment found that overall Habitat Integrity increased by 8
%, elevating this part of the river’s ‘habitat integrity’ ranking from a high Category 4 to
a low Category 3 (
Appendix 1 outlines how this conclusion was reached). It also noted that this increase was despite some negative impacts associated with the flood management facility. It followed improvements in the riparian habitat integrity, particularly removal of alien vegetation, re-connection of the river with its floodplain wetland (albeit a wetland no longer in its historic form), and mitigation of water quality and abstraction impacts. Overall, re-vegetation appears successful, though the process was still underway at the time of the assessment. The appraisal also found that the maintenance procedures stipulated and adopted during Phase 1 were of an exceptional standard and were potential models for similar projects. The project’s phased format, and the organisation of the maintenance contract between successive contractors, assisted with effective maintenance. Phasing of the project also allowed lessons learned during early phases to be incorporated into the designs of later phases (Freshwater Consulting Group, 2002).
There are thus clear, albeit early, indications that ecological and biodiversity benefits are flowing from the upgrade. These benefits plus increased aesthetic and recreational services are best reflected as increases in property values.
3.1.4 Rehabilitation project costs
The 1999 project costs were inflated to 2004 prices to make them comparable to the benefits (which were estimated in at current prices). The present value of the total construction and maintenance costs of the rehabilitation project (over 30 years using the 8% discount rate recommended for South Africa in Conningarth, 2002) was

The cost and benefits of urban river and wetland rehabilitation projects 20
approximately R10 million consisting of the cost elements in Table 2 below.3 Engineering construction was the major element of the costs. While relatively less was spent on landscaping, it was a major cost item when compared to other attenuation projects that focus on ‘hard engineering’ solutions. Annual maintenance costs of approximately R65 000 are spent mainly on cutting, clearing, landscaping and waste removal. Clearing takes place three times per year in order to ensure that that area remains effective in attenuating floods (Martin Thompson & Chris Bonthuys, City of Cape Town, pers. com. 2004)
Table 2: Present value of project costs: Lower Silvermine River Upgrade
ConstructionSite clearance (inlc. aliens) R 697,028Earthworks R 1,350,730Gabions R 1,631,070Medium pressure pipelines R 433,253Sewers R 146,541Stormwater R 305,826Roadworks R 779,856Landscaping R 1,684,590Measurement weirs R 12,743Preliminary and general R 1,248,788Professional fees R 924,486Contingencies R 911,297
MaintenanceClearing, silt removal, etc. R 499,022Landscaping, waste collection R 427,734
Present value of total costs R 10,126,207
Under the policy of ‘community based construction’, all casual and unskilled labourers and subcontractors were drawn from the local community. There was no accurate figure available for the number of these jobs. However, phase one of the project, requiring approximately one third of the total costs of the project, used 1 450 person days of local labour. It is therefore likely that the whole project used somewhere in the region of 4 350 person days of local unskilled labour. Approximately 45% of the contract value was for work done by subcontractors – this included the landscaping and gabion subcontract work.
3.1.5 Comparing rehabilitation costs and benefits
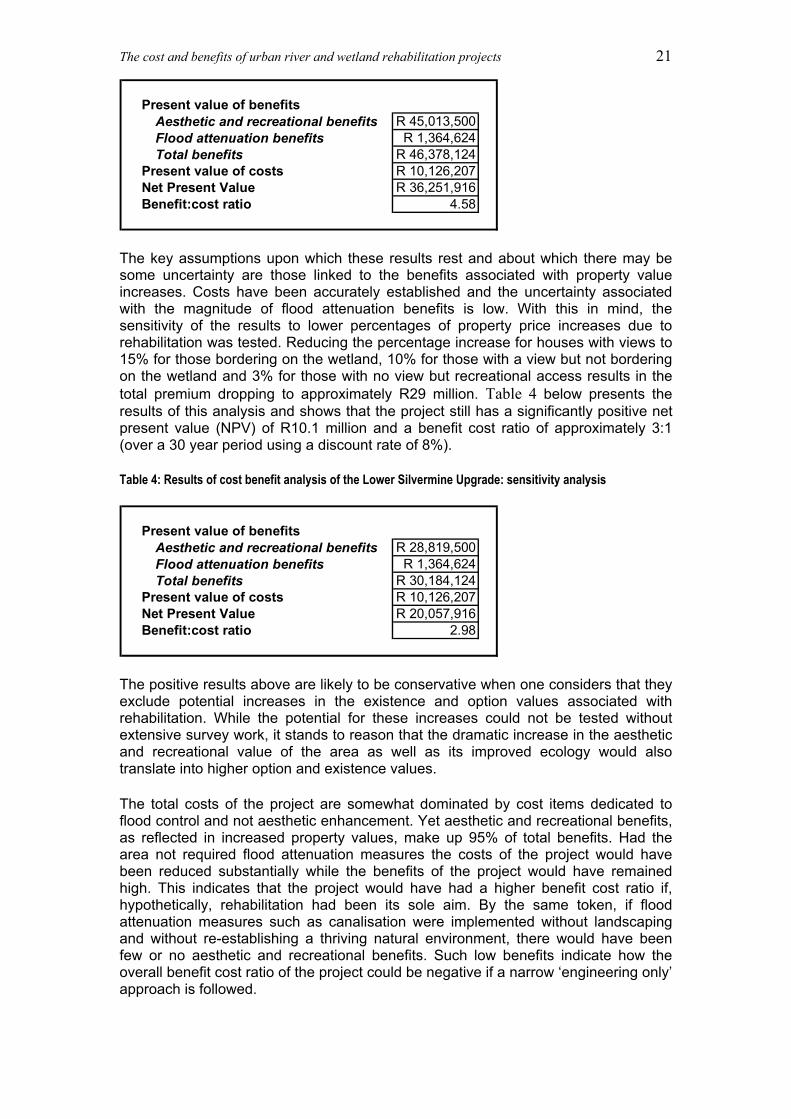
Having estimated the benefits and costs of rehabilitation in the previous sections, they can now be analysed using standard cost-benefit techniques. Table 3 below presents the results of this analysis and shows that the project had a significantly positive net present value (NPV) of R36.3 million and a benefit cost ratio of 4.58:1 (over a 30 year period using a discount rate of 8%).
Table 3: Results of cost benefit analysis of the Lower Silvermine River Upgrade (in 2004 Rands)
3 Construction costs were taken from contract documentation provided by the City of Cape Town. Approximate cost for alien clearing prior to construction were sourced from Julia Wood who worked from the South Peninsula Municipality at the time of the project.
The cost and benefits of urban river and wetland rehabilitation projects 21
Present value of benefitsAesthetic and recreational benefits R 45,013,500Flood attenuation benefits R 1,364,624Total benefits R 46,378,124
Present value of costs R 10,126,207Net Present Value R 36,251,916Benefit:cost ratio 4.58
The key assumptions upon which these results rest and about which there may be some uncertainty are those linked to the benefits associated with property value increases. Costs have been accurately established and the uncertainty associated with the magnitude of flood attenuation benefits is low. With this in mind, the sensitivity of the results to lower percentages of property price increases due to rehabilitation was tested. Reducing the percentage increase for houses with views to 15% for those bordering on the wetland, 10% for those with a view but not bordering on the wetland and 3% for those with no view but recreational access results in the total premium dropping to approximately R29 million. Table 4 below presents the results of this analysis and shows that the project still has a significantly positive net present value (NPV) of R10.1 million and a benefit cost ratio of approximately 3:1 (over a 30 year period using a discount rate of 8%).
Table 4: Results of cost benefit analysis of the Lower Silvermine Upgrade: sensitivity analysis
Present value of benefitsAesthetic and recreational benefits R 28,819,500Flood attenuation benefits R 1,364,624Total benefits R 30,184,124
Present value of costs R 10,126,207Net Present Value R 20,057,916Benefit:cost ratio 2.98
The positive results above are likely to be conservative when one considers that they exclude potential increases in the existence and option values associated with rehabilitation. While the potential for these increases could not be tested without extensive survey work, it stands to reason that the dramatic increase in the aesthetic and recreational value of the area as well as its improved ecology would also translate into higher option and existence values.
The total costs of the project are somewhat dominated by cost items dedicated to flood control and not aesthetic enhancement. Yet aesthetic and recreational benefits, as reflected in increased property values, make up 95% of total benefits. Had the area not required flood attenuation measures the costs of the project would have been reduced substantially while the benefits of the project would have remained high. This indicates that the project would have had a higher benefit cost ratio if, hypothetically, rehabilitation had been its sole aim. By the same token, if flood attenuation measures such as canalisation were implemented without landscaping and without re-establishing a thriving natural environment, there would have been few or no aesthetic and recreational benefits. Such low benefits indicate how the overall benefit cost ratio of the project could be negative if a narrow ‘engineering only’ approach is followed.

The cost and benefits of urban river and wetland rehabilitation projects 22
3.2 Kuils River canalisation and rehabilitation
The Kuils River rises in the Durbanville residential area approximately seven kilometres to the north of study area. It flows under the N1 freeway and then along the R300 before entering the suburb of Kuils River. In 2000 the City of Cape Town’s Catchment Management department decided that the canalisation and rehabilitation of a 650 metre stretch of the river between the R300 and Van Riebeeck Road in Kuils River was necessary to reduce flood risks in the area to an acceptable level. Unfortunately the original rehabilitation efforts were not well maintained after their completion. As a result, although the measures aimed at flood alleviation are still effective, the area is now relatively aesthetically degraded.
The property value implications of the following scenarios were chosen for investigation:
1. Maintain the status-quo in which the original rehabilitation effort of 2000 remains degraded.
2. The situation if the original rehabilitation effort were maintained to a high standard.
3.2.1 The impact of rehabilitation on property values
Three estate agents with suitable long term experience in the areas in question were interviewed. All of the agents agreed that in its current state, the river no longer has a positive impact on property values. The area has become overgrown, trails are no longer neatly demarcated and the majority of the trees planted near the river have died. This has lead to the re-emergence of the negative perception attached to the area before it was rehabilitated. The original rehabilitation in 2000 had lead to an increase in property values for houses bordering on the river and those nearby. However, this increase was eliminated through neglect of the site. The magnitude of the increase brought on by the original rehabilitation was estimated in previous research on the value of open spaces (Van Zyl & Leiman in Turpie et al., 2001). This work suggested a total increase of approximately R1.35 million in the area.
When asked what would have happened to property values had the rehabilitation been well maintained, all of the agents agreed that it would have lead to increases in property values. They felt that increases would occur for houses bordering on the river, but would not extend far as the river was a relatively small amenity. A distance of four rows of houses was chosen as a reasonable cut off point, beyond which the impacts of rehabilitation would probably no longer be felt. Their estimates of the price impacts for properties bordering the river ranged between 2% and 5%. Note that high walls placed to ensure privacy mean that few of these houses have views of the river. Agents also pointed out that houses bordering on the river could only benefit from rehabilitation up to a point due to security risks. It was felt that the property value increases would be higher for properties nearby the area but not bordering on it as they would reap the benefits of rehabilitation without the security risks. This leads to an important contingent point. The full value of environmental improvements in an area will only manifest itself if the public feel able to enjoy the improved amenity in safety.
In order to calculate the value added to properties by rehabilitation, the percentage increases agents attributed to rehabilitation, were averaged. These percentages were then multiplied by the value of the affected properties (estimated with the help of the agents and their databases). Table 5 below presents the results of this

The cost and benefits of urban river and wetland rehabilitation projects 23
exercise for the areas in question. The total premium created by rehabilitation was R1.39 million for all the affected properties. Approximately two thirds of this premium accrued from houses with no view of the rehabilitated area, but with recreational access.
Table 5: Increased property values associated with rehabilitation in Kuils River
AreaNumber of
affected properties
Average value of
each property (R mil.)
Total value of affected
properties (R mil.)
% premium due to rehab.
Value of rehab.
Premium (R mil.)
East of Kuils River 21 R 0.58 R 12.08 3.0% R 0.36West of Kuils River 7 R 0.48 R 3.33 3.0% R 0.10
2nd row east of river 14 R 0.58 R 8.05 4.3% R 0.352nd row west of river 5 R 0.48 R 2.38 4.3% R 0.103rd row east of river 13 R 0.58 R 7.48 3.7% R 0.274th row east of river 21 R 0.58 R 12.08 1.7% R 0.20
R 1.39
Properties bordering on the rehabilitated area
Properties nearby the rehabilitated area with no views
Total for all properties affected by rehabilitation:
3.2.2 Flood attenuation benefits
The primary original motivation for the Kuils River Channel upgrade was flood attenuation. The Kuils River Management and MOSS (Metropolitan Open Space System) studies (Ninham Shand 1990 and 1999) clearly highlighted flooding problems in the area. Regular and relatively severe flooding had occurred in the past and increased flooding problems were expected as development in the catchment continued. These risks were unacceptable to the municipality, which remains responsible for flood protection. With this in mind the upgrade was planned to ensure that 1 in 50 year flood line lay below existing houses. This was mainly achieved through engineering and landscaping works. A new river channel was excavated and the river banks shaped to reduce flooding.
Quantification of flood attenuation benefits was done for existing houses and plots that are now above the 1 in 50 year flood line thanks to the upgrade project. The valuation procedure replicated that used for the benefits of the Lower Silvermine Upgrade for existing houses, being based on ‘damage costs avoided’. It was assumed that the average value of damages from a 1 in 50 year flood would be R100 000 per house as in the case of the Lower Silvermine River Upgrade. Since the timing of 1 in 50 year flood cannot be predicted, a discounted (at 8%) average of potential damage costs for each year between 2002 and 2052 was used. This average was then multiplied by the 49 existing houses that were below the flood line giving an estimated R1.37 million as the present value of benefits.

The cost and benefits of urban river and wetland rehabilitation projects 24
3.2.3 Rehabilitation project costs
Project costs were inflated to 2004 prices, thus making them comparable to benefits (which were estimated in current prices). The present value of the total construction and maintenance costs of the rehabilitation project (over 30 years using a discount rate of 8% as recommended for South Africa in Conningarth, 2002) were approximately R6.9 million consisting of the cost elements in Table 6 below.4 The majority of the construction costs were for engineering construction while relatively little was spent on landscaping. In addition to construction costs, maintenance costs of R83 000 per annum are spent on cutting and clearing the area three times per year in order to ensure it remains effective in attenuating floods (Deon Botha, City of Cape Town, pers. com. 2004). However, this allocation of funds has proven insufficient to keep the area in the state that it was just after the construction phase of the project. After discussions with the City of Cape Town official involved in landscaping projects in the area it was assumed that in order to achieve this higher level of maintenance, an additional R50 000 per annum gradually decreasing to R25 000 per annum over four years, as new plants become established, would be required. It was also noted that the Kuils River Private Hospital which is situated on the banks of the river where the rehabilitation project took place have applied to be allowed to take over the landscaping maintenance of the area (J. Strydom, City of Cape Town, pers. com. 2004). This should ensure that the aesthetic and recreational potential of the area is realised to the benefit of the hospital and the local community.
Table 6: Present value of project costs: Kuils River canalisation and rehabilitation
Construction Construction costs R 4,587,385Engineering costs R 573,423Landscaping R 89,199Env. Impact assessment R 229,369Disbursements R 76,456Site monitoring R 140,170
MaintenanceCurrent clearing, landscaping R 1,219,733Est. additional maint. needed R 473,722
Present value of total costs R 6,915,736
3.2.4 Comparing rehabilitation costs and benefits
The benefits and costs of rehabilitation estimated in the previous sections can now be analysed using standard cost-benefit techniques. The focus here is on the scenario in which the original canalisation and rehabilitation project done in 2000 is maintained to a high standard. Table 7 below presents the results of this analysis and projects a negative net present value (NPV) of –R4.15 million and a benefit cost ratio of 0.40:1 (over a 30 year period using a discount rate of 8%). Bear in mind that the municipality is legally obligated to reduce flood risk. This implies that this kind of attenuation project is unavoidable to a certain degree.
4 Construction costs for 2000 were taken from contract documentation provided by the City of Cape Town and inflated to 2004 rands.

The cost and benefits of urban river and wetland rehabilitation projects 25
Table 7: Results of cost benefit analysis of the Kuils River canalisation and rehabilitation (2004 Rands)
Present value of benefitsAesthetic and recreational benefits R 1,389,083Flood attenuation benefits R 1,374,350Total R 2,763,434
Present value of costs R 6,915,736Net Present Value -R 4,152,303Benefit:cost ratio 0.40
The key assumptions upon which these result rests and about which there may be some uncertainty are those linked to the benefits associated with property value increases. Costs have been accurately established and the uncertainty associated with the magnitude of flood attenuation benefits is low. With this mind the sensitivity of the results to variations in estimated property price increases due to rehabilitation was tested. These estimates would have to increase from R1.39 million to R5.54 million, a factor of approximately four for the benefit cost ratio to become favourable (i.e. to increase to 1.0). This seems highly unlikely indicating that the overall results of the analysis are likely to remain robust.
The total costs of the project are heavily dominated by engineering cost items dedicated to flood control and not necessarily aesthetic enhancement of the area. Despite this, the benefits are fairly evenly spread between flood attenuation, and aesthetic and recreational benefits. This indicates that measures aimed purely at the creation and maintenance of an aesthetically pleasing area result in a relatively higher benefit cost ratio when compared to pure flood alleviation measures. Thus, in their absence, the project would have had an even less favourable benefit cost ratio.
North of the rehabilitated area before the R300 highway lies an un-rehabilitated stretch of the Kuils River approximately 550 metre in length. Currently this stretch is not well maintained and certainly has the potential to become an aesthetic and recreational amenity. The floodplain of the river is relatively wide seemingly offering potential for rehabilitation and landscaping along the lines of what was done for the Lower Silvermine River upgrade. If combined with the area that was rehabilitated in 2000, a far larger rehabilitated area could be created in which recreational facilities such as walking trails could be established (the recreational potential of the currently rehabilitated area is limited by its relatively small size). The costs involved in this kind of extension of the original rehabilitation project would probably be relatively low as they would not involve expensive engineering works aimed at flood attenuation as in the original project. Aesthetic and recreational benefits could, however, be significant when one considers the results of the cost benefit analysis results for the original rehabilitation. This implies that a higher overall benefit cost ratio could be achieved if an extension project was to be combined with the original rehabilitation project.
3.3 Westlake River rehabilitation in Kirstenhof
The Westlake River rises along the slopes of Steenberg kopie approximately three kilometres to the west of Kirstenhof. After making its way down the kopie it flows to the south of the Westlake golf course and Pollsmoor prison. Near Pollsmoor it is dammed before flowing under the Simon van der Stel freeway and into the suburb of Kirstenhof. The river and the wetlands along its course dominate Kirstenhof due to the suburb’s small size and their position at the centre of the suburb. Approximately

The cost and benefits of urban river and wetland rehabilitation projects 26
nine years ago the City of Cape Town undertook a rehabilitation of the Westlake River in Kirstenhof. The landscaping of the area was improved, paths were laid, bridges and benches installed as well as a play park for children.
3.3.1 The impact of rehabilitation on property values
In order to establish the impacts of the Westlake River rehabilitation on property values, interviews were conducted with three agents who had long term experience of the area. All agreed that the rehabilitation had impacted positively on the suburb’s entire property market. This has been due to the aesthetic and recreational opportunities it affords to all whose homes are within easy walking distance of the river. Homes with views over the river and wetlands are also perceived to be less secure and agents did not agree on whether such properties bordering directly on the wetland enjoyed increased values following the rehabilitation. Two of the agents interviewed felt that these properties probably enjoyed an increase in value due to enhanced views. However, they were uncertain in their opinions and were not prepared to quantify any increases. This was somewhat unexpected as all the agents at the other case study sites were prepared to back up their views on positive impacts with quantified value increases. When it was suggested that perhaps a conservative increase of 5% for all properties in the area was appropriate, they felt that this estimate stood a fair chance of being accurate.
The third agent was convinced that houses bordering on the wetland did indeed increase in value subsequent to rehabilitation. The primary reason given for this was that the rehabilitation created a far neater and more open space where before the area was overgrown and not particularly attractive. This not only increased the area’s aesthetic value but also decreased the security risks (a more overgrown environment presenting a greater security risk). In addition to this the trails and other facilities that were part of the rehabilitation package offered increased recreational opportunities on the doorstep of those bordering on the wetland. It was mentioned that unfortunately the majority of houses bordering the wetland were not constructed to make the most of wetland views, often being surrounded by high walls. There was, however, a trend towards houses being altered to better appreciate the views available. It was felt that once this trend became more prominent it would allow for the realisation of the value offered by rehabilitation. Increases of between 15% and 20 % were mentioned in this regard.
Given the agents’ uncertainty a particularly conservative approach was taken when quantifying value increases. Houses bordering on the wetland were assigned an increase of 3.5% while other houses nearby with no views were assigned a value of 2%. It was felt that these estimates would be the best possible conservative reflection of the opinions of estate agents.
In order to calculate the value added to properties by rehabilitation, the percentage increases of all agents were averaged. These percentages were then multiplied by the value of the affected properties estimated with help from the agents and their databases. Table 8 below presents the results of this exercise for the area. The total premium created by rehabilitation was R10.26 million for all the affected properties. Approximately 77% of this premium accrued to houses with no view of the rehabilitated area, but with recreational access. This is to be expected when one considers that houses bordering on the river are unsuited to taking advantage of views because the attendant security risks require high walls.
Table 8: Increased property values associated with rehabilitating the Westlake River in Kirstenhof

The cost and benefits of urban river and wetland rehabilitation projects 27
House typeNumber of
affected properties
Average value of
each property (R mil.)
Total value of affected
properties (R mil.)
% premium due to rehab.
Value of rehab.
Premium (R mil.)
Larger houses 40 R 1.10 R 44.00 3.5% R 1.54Smaller houses 25 R 0.60 R 15.00 3.5% R 0.53
Larger new houses 115 R 1.10 R 126.50 2.0% R 2.53Larger old houses 120 R 0.90 R 108.00 2.0% R 2.16Smaller houses 292 R 0.60 R 175.20 2.0% R 3.50
R 10.26
Properties nearby the rehabilitated area with no views
Total for all properties affected by rehabilitation:
Properties bordering on the rehabilitated area
3.3.2 Flood attenuation benefits
The ongoing maintenance of the river and wetlands undoubtedly enhances its ability to attenuate floods. The removal of silt and clearing of vegetation in particular enhances this ability. Unfortunately studies to estimate the change in flood lines brought about by rehabilitation were not done for Kirstenhof as they were for the Lower Silvermine River and Kuils River. The quantification of flood attenuation benefits was thus not possible. However, these benefits would in all likelihood be fairly small when compared to aesthetic and recreational benefits as the area is not generally prone to serious flooding.
3.3.3 Benefits associated with increased biodiversity
While there is no clear evidence of measurable biodiversity benefits associated with rehabilitation, it stands to reason that rehabilitation may have been beneficial at least to some degree. The main potential benefit of the project for the biodiversity of the area was the clearing of alien species, mainly typhus reeds. These reeds tend to choke systems, making it difficult for other species to grow.
3.3.4 Rehabilitation project costs
The project costs were inflated to current prices to make them comparable to benefits which were estimated in 2004 terms. The present value of the total construction and maintenance costs of the rehabilitation project (over 30 years using a discount rate of 8% as recommended for South Africa in Conningarth, 2002) were R4.3 million consisting of the cost elements in Table 9 below.5 The majority of the construction costs were for landscaping, signage, the creation of paths and the installation of a children’s playground. Maintenance costs of just under R200 000 per annum are
5 Original records of construction costs were not available for the project. This necessitated their estimation based on the likely cost of undertaking a similar project today. Estimates were made with the assistance of Jan Botes of the City of Cape Town who is responsible for the maintenance of the area.
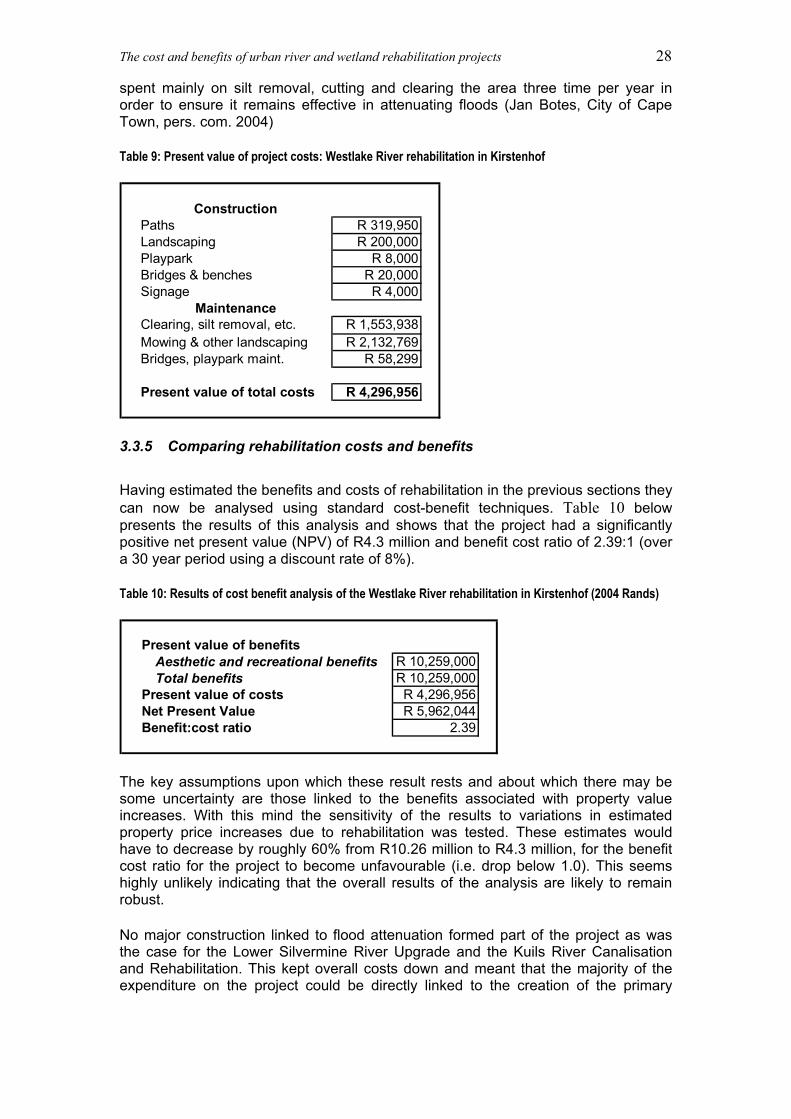
The cost and benefits of urban river and wetland rehabilitation projects 28
spent mainly on silt removal, cutting and clearing the area three time per year in order to ensure it remains effective in attenuating floods (Jan Botes, City of Cape Town, pers. com. 2004)
Table 9: Present value of project costs: Westlake River rehabilitation in Kirstenhof
ConstructionPaths R 319,950Landscaping R 200,000Playpark R 8,000Bridges & benches R 20,000Signage R 4,000
MaintenanceClearing, silt removal, etc. R 1,553,938Mowing & other landscaping R 2,132,769Bridges, playpark maint. R 58,299
Present value of total costs R 4,296,956
3.3.5 Comparing rehabilitation costs and benefits
Having estimated the benefits and costs of rehabilitation in the previous sections they can now be analysed using standard cost-benefit techniques. Table 10 below presents the results of this analysis and shows that the project had a significantly positive net present value (NPV) of R4.3 million and benefit cost ratio of 2.39:1 (over a 30 year period using a discount rate of 8%).
Table 10: Results of cost benefit analysis of the Westlake River rehabilitation in Kirstenhof (2004 Rands)
Present value of benefitsAesthetic and recreational benefits R 10,259,000Total benefits R 10,259,000
Present value of costs R 4,296,956Net Present Value R 5,962,044Benefit:cost ratio 2.39
The key assumptions upon which these result rests and about which there may be some uncertainty are those linked to the benefits associated with property value increases. With this mind the sensitivity of the results to variations in estimated property price increases due to rehabilitation was tested. These estimates would have to decrease by roughly 60% from R10.26 million to R4.3 million, for the benefit cost ratio for the project to become unfavourable (i.e. drop below 1.0). This seems highly unlikely indicating that the overall results of the analysis are likely to remain robust.
No major construction linked to flood attenuation formed part of the project as was the case for the Lower Silvermine River Upgrade and the Kuils River Canalisation and Rehabilitation. This kept overall costs down and meant that the majority of the expenditure on the project could be directly linked to the creation of the primary

The cost and benefits of urban river and wetland rehabilitation projects 29
benefits of the project – i.e. aesthetic enhancement of the area and the creation of recreational opportunities.
4 FUNDING REHABILITATION
When considering the rehabilitation of an urban river or wetland a first step is to confirm that the project’s benefits exceed the costs (as was done in the case studies of the previous section). For practical purposes, however, one has to recommend how the rehabilitation should be funded.
Cape Town municipality funded the construction costs of all three rehabilitations described in the case studies of the previous section. Funding was channelled through the Catchment Management department. Resources for ongoing maintenance came from the City through the local municipality parks and recreation offices.
Did the city get any financial benefits to offset its costs and thus encourage further investment in rehabilitation? Are there other sources of funding for rehabilitation that could be explored? The following section turns to these questions and investigates the applicability of the available mechanisms, given the contexts within which they function.
4.1 The municipal finance implication of rehabilitation projects
4.1.1 Calculating rates
Sales of water and electricity are the municipality’s main revenue sources. They are insufficient, however, to cover all municipal expenditures. The fiscal gap remaining is filled by a property tax, i.e. municipal rates. Note that the rate at which these are levied is determined by the shortfall that has to be met. Currently they are not treated as a primary revenue source, even though they provide 25% of municipal income. The following example shows current thinking on the calculation of rates. Assume a revenue shortfall of R2 billion, and a total property value of R200 billion. Dividing R2 billion by R200 billion gives 0.01 (cent-in-a-rand). This is then multiplied by each individual’s property value to give the annual rates payable. Annual real growth in the municipal budget is constrained by National Treasury. The municipality can borrow, however, the Municipal Finance Act (No. 56, 2003) stipulates that municipalities can incur long-term debt only for the purpose of capital expenditure (e.g. plant and equipment) or to re-finance existing long-term debt. Short-term debt (for current expenditure) may be incurred only as bridging finance and if the debt can be repaid within the financial year. Capital costs form the major component of rehabilitation expenditures. However, borrowing remains a short term solution, the municipality will eventually have to meet its debts with income from charges and rates.
Sewage charges are similarly determined. Sewage services have a budget that consists of stock costs, chemicals, etc. Given this budget, a financial modelling exercise determines how to raise the necessary income. The formula has two components - 50% of the income is based on property values and 50% is linked to the surcharge through water consumption.
Essentially the budgetary process starts with what the municipality needs to raise in income. Affordability is a key issue. Models are used to determine different scenarios of total municipal accounts over a range of property values. From these, concessions (relief measures) are built in. Once these are determined, the municipality maximizes
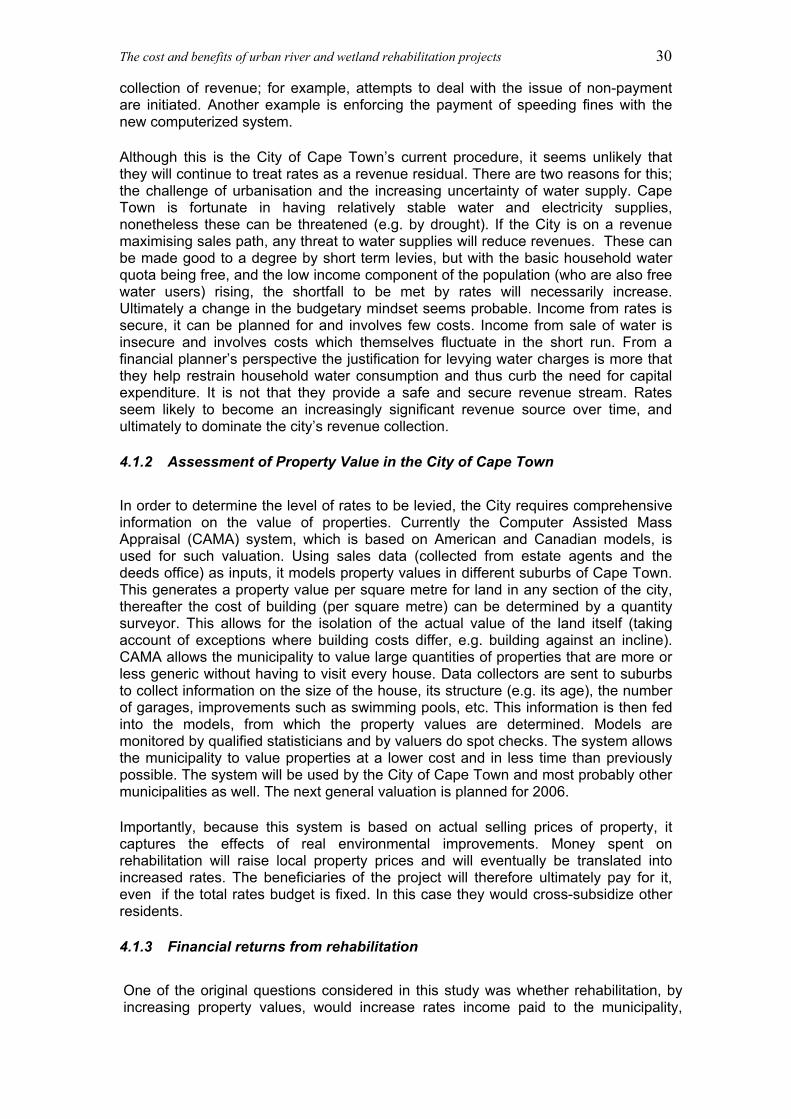
The cost and benefits of urban river and wetland rehabilitation projects 30
collection of revenue; for example, attempts to deal with the issue of non-payment are initiated. Another example is enforcing the payment of speeding fines with the new computerized system.
Although this is the City of Cape Town’s current procedure, it seems unlikely that they will continue to treat rates as a revenue residual. There are two reasons for this; the challenge of urbanisation and the increasing uncertainty of water supply. Cape Town is fortunate in having relatively stable water and electricity supplies, nonetheless these can be threatened (e.g. by drought). If the City is on a revenue maximising sales path, any threat to water supplies will reduce revenues. These can be made good to a degree by short term levies, but with the basic household water quota being free, and the low income component of the population (who are also free water users) rising, the shortfall to be met by rates will necessarily increase. Ultimately a change in the budgetary mindset seems probable. Income from rates is secure, it can be planned for and involves few costs. Income from sale of water is insecure and involves costs which themselves fluctuate in the short run. From a financial planner’s perspective the justification for levying water charges is more that they help restrain household water consumption and thus curb the need for capital expenditure. It is not that they provide a safe and secure revenue stream. Rates seem likely to become an increasingly significant revenue source over time, and ultimately to dominate the city’s revenue collection.
4.1.2 Assessment of Property Value in the City of Cape Town
In order to determine the level of rates to be levied, the City requires comprehensive information on the value of properties. Currently the Computer Assisted Mass Appraisal (CAMA) system, which is based on American and Canadian models, is used for such valuation. Using sales data (collected from estate agents and the deeds office) as inputs, it models property values in different suburbs of Cape Town. This generates a property value per square metre for land in any section of the city, thereafter the cost of building (per square metre) can be determined by a quantity surveyor. This allows for the isolation of the actual value of the land itself (taking account of exceptions where building costs differ, e.g. building against an incline). CAMA allows the municipality to value large quantities of properties that are more or less generic without having to visit every house. Data collectors are sent to suburbs to collect information on the size of the house, its structure (e.g. its age), the number of garages, improvements such as swimming pools, etc. This information is then fed into the models, from which the property values are determined. Models are monitored by qualified statisticians and by valuers do spot checks. The system allows the municipality to value properties at a lower cost and in less time than previously possible. The system will be used by the City of Cape Town and most probably other municipalities as well. The next general valuation is planned for 2006.
Importantly, because this system is based on actual selling prices of property, it captures the effects of real environmental improvements. Money spent on rehabilitation will raise local property prices and will eventually be translated into increased rates. The beneficiaries of the project will therefore ultimately pay for it, even if the total rates budget is fixed. In this case they would cross-subsidize other residents.
4.1.3 Financial returns from rehabilitation
One of the original questions considered in this study was whether rehabilitation, by increasing property values, would increase rates income paid to the municipality,

The cost and benefits of urban river and wetland rehabilitation projects 31
allowing it to recoup some of money spent on rehabilitation. The immediate answer is 'no'; not while rates are regarded as a residual item. It is argued that rates are determined by the municipality's income needs, and with annual increases capped, there is no potential for increased property values (whether from rehabilitation projects or other sources) to increase overall rates income.
Rehabilitation projects could, however, have redistributive impacts. If the pool of houses and the pool of buyers were taken as given, a rise in house demand in one area would involve a fall in demand for houses elsewhere. Rehabilitation projects might increase rateable property values in one area, but would lower them in areas that did not benefit. The view of the municipality's overall director of budgets on the funding of environmental rehabilitation projects from municipal budgets was relatively clear. The municipality's capital budget prioritizes sustaining existing services and the provision of basic services. Environmental projects receive less attention and lower priority when seeking a share of the municipal budget. The municipality is looking more towards corporate involvement to address environment concerns (M. Richardson, City of Cape Town, pers. com. 2004). Moreover, even if rehabilitation project were able to increase municipal income, the funds would flow into a general pool; there is no earmarking of funds for environmental improvements. This said, although the municipal funding system currently in place may give council no short-run financial incentives for spending on wetland conservation and rehabilitation, such expenditures may generate advantages in the long-run, even though the rehabilitation work occurs in low income areas.
Clearly, a council with a large viable rateable base of properties enjoys greater flexibility in its self-funding options than one whose rateable base is restricted to a fixed set of historically upper and middle income suburbs in which ratepayers perceive service quality as falling rather than rising. The benefits accruing to council from rehabilitation expenditures would include:
a) Political aspects - ratepayers would enjoy aesthetic advantages. These are typically income elastic, i.e. they ostensibly appeal most to the affluent. Nonetheless, even though the direct benefits accrue to residents in low income areas, affluent ratepayers may see these as "worthwhile" expenditures that raise the appeal of the city as a whole.
b) Development issues -The housing market in the newer suburbs of the Cape Flats is limited. This has serious knock-on effects in terms of economic and social development. A viable market is necessary if homes are to serve as collateralisable assets. A safe and attractive set of greenbelt areas is one of the services council can provide that is likely to enhance the appeal of property in these areas, and speed the development of such a market. In doing so it enhances property values induces development and stabilises communities.
c) Economic - The city as a player in a zero-sum game: While in the short run the city budget is decided according to need, and then funded; the long run sees the city competing with other cities in the country, the region, and ultimately the globe. This is the point of Tiebout's theory of regional tax differentials. Cape Town is currently seen as a desirable place in which to reside and do business. High taxes and low benefits could change this perception. Currently there is an influx of ratepayers - such growth makes it viable for the council to borrow funds if need be. Municipal bonds have not been a serious feature of the SA financial scene, but there is place for them. In contrast, a movement of businesses and high income residents out of the area in response to poor aesthetics and high rates would be perceived as a contracting rates base, and lead to increased costs of borrowing.
The cost and benefits of urban river and wetland rehabilitation projects 32
4.2 Potential funding mechanisms for rehabilitation
The previous section established that currently municipal funding of rehabilitation provides no direct financial benefits for the municipality limiting the likelihood that council will increase rehabilitation funding. Indeed it was noted that the municipality is looking more towards corporate involvement to address environmental concerns. In this section we turn to alternative funding mechanisms. Mechanisms that fall under the conservation finance umbrella are used as a starting point to outline a broad range of options that could be used in a situation such as that for urban freshwater environment in Cape Town or any South African urban centre.
As its name implies conservation finance focuses on ways of generating the funds necessary for conservation initiatives. It covers a relatively broad range of mechanism form those that can be used to finance entire systems of national parks to those that deal with local environmental education programmes. With this mind, only mechanisms that are potentially applicable to urban freshwater rehabilitation are dealt with.
The most commonly used rehabilitation financing mechanisms include:
Fiscal instruments User fees Donations and grants Public-Private Partnerships Volunteer contributions
4.2.1 Fiscal instruments
Fiscal instruments are the primary revenue-generating mechanism of government and can thus be considered for the financing of conservation. Taxes can be raised based on the ability-to-pay principle (Tax those who can afford to pay) or the benefit principle (Tax those who benefit from a government service). In the former case, tax revenues go to the general budget and conservation projects can be financed from it. In the case of benefit taxes, these funds can be earmarked for specific conservation projects (Conservation Finance Alliance, 2004). The latter is extremely uncommon in South Africa.
Taxes at the local or provincial level may be used to fund rehabilitation. For example, a portion of local or provincial sales tax or property taxes from landowners who gain from an adjacent protected area could be used to finance conservation of an area. Another possibility is use of state lottery revenues to fund conservation and rehabilitation projects (Conservation Finance Alliance, 2004).
An example where local taxes were used to fund river rehabilitation was in Durango, Colorado. The Animas River Trail was funded from a part of the ½ cent sales tax increase, approved by city voters. The funds were used to build a new recreation centre and for rehabilitation along the river (American Trails, 2004).
4.2.2 User fees
There is potential for overlap between fiscal instruments and user fees. Here we define user fees as fees charged directly and not collected through the taxation system (i.e. through income tax, local rates and taxes, etc.). Examples include
The cost and benefits of urban river and wetland rehabilitation projects 33
entrance fees, fishing permit fees, etc. Tourism or recreational use fees have been used to raise funds for conservation and rehabilitation projects. Funds for conservation can be raised by making use of tourism user fees, where most of these fees are site-level mechanisms.
The following are some examples:
Entrance fees, where visitors are charged to enter or visit the conservation area.
Concession fees, where those businesses that provide a service within the protected area, e.g. food, are charged a fee to operate within these areas.
Licenses and permits, where private firms are charged fees. These pertain to businesses such as tour operators or individuals interested in specific recreational activities, e.g. diving or fishing.
Tourism-based taxes, where taxes are levied at hotels or airports for conservation purposes.
Source: (Conservation Finance Alliance, 2004).
4.2.3 Donations and grants
Donations typically come from individuals or companies either directly or through organisations set up to distribute donated funds. They can also come from government as grants.
4.2.3.1 Corporate donations
Corporations can bring high public and media profile to the projects they fund. This raises public profile is to their advantage, but also helps to encourage environmental restoration in other locations. The emphasis on social responsibility spending by companies in South Africa creates added opportunities for sourcing corporate donations. Two well-known South African examples are the Mondi Wetlands Project and the Mazda Wildlife Fund.
The Mondi Wetlands Project is a joint project of two non-governmental organizations (Wildlife and Environment Society of South Africa, WESSA & the World Wide Fund for Nature - South Africa, WWF-SA). The Project receives funding from Mondi and works very closely with the company, assisting in sustainable wetlands management according to their Mondi Forests wetlands policy (Mondi Wetlands Project, 2004).
The Mazda Wildlife Fund was established by the Ford Motor Company of Southern Africa and the network of Mazda dealers. When a Mazda car is purchased, a contribution is made to the Fund. The Mondi Wetlands Project also receives sponsored vehicles and purchased vehicles at a discount from Mazda (Mondi Wetlands Project, 2004).
4.2.3.2 Non-profit organizations and non-governmental organizations
Foundations (non-profit organizations) and Non-governmental organizations can act as distributors of donations. Foundations are non-profit organizations established by individuals or groups who make donations to certain causes. They can also be created specifically to raise funds for a given cause. Where they have specific

The cost and benefits of urban river and wetland rehabilitation projects 34
missions and interests, or geographical focuses, these will restrict the projects they will consider funding. (Conservation Finance Alliance, 2004).
The Zandvlei Trust was formed in 1988 to “conserve the indigenous fauna and flora of the Zandvlei and to enhance this natural resource for the benefit of all” (Zandvlei Trust, 2004). It has approximately 130 members, each of whom contributes R30 per annum in membership fees, and it is managed by a committee of ten people. A quarterly newsletter is published at a cost of roughly R10 000 with the help of corporate sponsors currently including De Kock Estates, Glasscraft, Lakeside Pharmacy, The Map Shop and Rope World. An annual donation of roughly R5 000 from the paper and glass recycling companies that have a depot at Zandvlei is the only other consistent source of funding. Any special projects that are conceived such as the recent construction of a bird hide require ad hoc fund raising (Henk Schreuders, Zandvlei Trust, pers. com. 2004).
Wildlife and Environment Society of South Africa (WESSA) is a non-governmental environmental organization, started in 1926, its mission being to promote public participation in caring for the Earth. WESSA works with people at all levels of society involved in environmental activities, from local communities, volunteers (such as the Friends groups), and all levels of government as well as national and international conservation organizations. It has an extensive network with regional office branches throughout the country.
WESSA’s vision specifies the organization’s role in ensuring long-term environmental sustainability. To this end, WESSA is involved in various conservation & environmental education activities. It is actively involved in various national projects, for example the Adopt-A-Beach project (initiated by the Department of Environmental Affairs and Tourism) as well as the Mondi Wetlands Project (see more details below). Environmental education is another crucial activity of the organization; it offers various services to schools, teacher groups and other environmental educators (WESSA, 2004).
WESSA is a member-based organization. Annual membership fees are charged, but make up a minor percentage of its income. Its main source of income emanates from projects sponsorships usually coming from big corporations. It also receives funding from government when it runs projects on their behalf. WESSA has already been extensively involved in urban river rehabilitation projects, especially in the Cape Town area. It participated in rehabilitation projects such as the Liesbeek, Black and Disa river rehabilitations. WESSA is also involved in initiatives in the Paardeneiland wetlands areas (A. Kelly, WESSA, pers. com. 2004).
The Mondi Wetlands Project (MWP) is a non-governmental wetland conservation project launched in 1991. It is a joint venture between two conservation organizations, the WWF-SA and WESSA, as well as corporate sponsors, the Mazda Wildlife Fund and the Mondi Forestry Company. The primary goal of the project is the conservation of wetlands outside nature reserves. Some of its specific tasks include initiating and implementing the sustainable use and rehabilitation of wetlands as well as fostering partnerships with various structures in both the public and private sectors to promote the conservation of wetlands (Mondi Wetlands Project, 2004).
International examples of non-profit organisations involved in river rehabilitation include American Rivers (USA) and Great River Greening (USA). American Rivers is a non-profit organization that leads the river movement in the USA. They encourage tax-deductible contributions by making use of the following options and other mechanisms to get support from the public:

The cost and benefits of urban river and wetland rehabilitation projects 35
Workplace giving: where the donation is deducted from the payroll. River Legacy Society: where people can get information about how to support
the work of American Rivers by leaving some inheritance or a planned gift. Gifts of Stock: people are encouraged to make a gift of stock to American
Rivers and get some tax benefit for doing so. River guardians: people are encouraged to make a special gift of $1,000 or
more in return for special membership benefits. Source: American Rivers, 2004
Great River Greening is a non-profit organization involved in restoration projects. It has a large volunteer base that assists in various activities in these projects. Funding comes from various sources; corporations and individuals are encouraged to make tax-deductible contributions, or planned gifts (Great River Greening, 2004).
4.2.3.3 Grants
Government grants generally come from special funds that set aside finance for specific types of environmental projects. Among others, The Working for Water and Working for Wetlands programmes, under the Department of Water Affairs and Forestry would be a local example of these kinds of programmes. These programme are also an example of public-private partnerships (see 4.2.4) which involve government departments, private contractors, corporate partners and the WWF.
In the United Sates, the National Fish and Wildlife Foundation funds local wetland conservation and restoration projects. Its goals include habitat protection, environmental education, habitat and ecosystem rehabilitation and restoration. The Wetlands Campaign works with the Foundation to help secure funding for wetland projects (National Fish and Wildlife Foundation, 2004).
In Australia the New South Wales Murray Wetlands Working Group administers two funding schemes that help private landholders, community groups, and other organisations manage and rehabilitate wetland ecosystems. The Wetlands Incentive Scheme is a small grants program (for projects costing less than $10,000), which encourages and provides assistance to landholders or community groups interested in managing and/or rehabilitating wetlands on their properties or in the community. The scheme provides financial assistance for activities such as fencing, re-vegetation, minor earth works, small studies or wetland education activities. The Wetland Rehabilitation and Investigations Program is intended for larger scale projects costing more than $10,000 (Murray Wetlands Working Group, 2004).
Also in Australia, Wetland Care Australia’s Living Wetlands Fund was a three year monetary grant provided by Environment Australia to aid wetland rehabilitation throughout the country. Funding was given to community groups with suitable wetland rehabilitation projects and managed by Wetland Care Australia. It was first launched in 2000 and continued through to 2003, during which time 33 local organisations across Australia received funding totalling $550 000 (Wetland Care Australia, 2004).
4.2.4 Public-Private Partnerships
Wetland and river rehabilitation projects often require a successful mix of public and private funding. According to Environment Canada “One of the most striking features of many wetland conservation efforts is the complexity and number of players: from national governments to community groups, private wetland owners and concerned

The cost and benefits of urban river and wetland rehabilitation projects 36
individuals who enjoy spending time in their local wetland. It is a mix with inherent challenges that requires effective coordination and communication among players, and makes for dynamic and innovative wetland conservation initiatives. With limited funding to go around, taking advantage of volunteers, government partnerships, private land stewardship and community action plans are essential for success. Each partner brings specific strengths to a wetland rehabilitation or securement project” (Environment Canada, 2004).
The Keyser’s River Restoration Project is a local example of the value of co-operative partnerships to ensure rehabilitation. The focus of the project is a particularly degraded section of the Keyser’s River which winds its way through commercial and light industrial sites in Tokai, Cape Town. When the project started this stretch was overgrown with alien plants, there was ongoing dumping and littering and it was ecologically degraded. In early 2001 the City of Cape Town explored the potential for partnerships with other role players to rehabilitate the river. This led to a partnership between the City, local businesses and WESSA. The City provides logistical support such as the clearing of cut trees and rubble collection. It remains involved in ensuring that the river is well managed, but this is done in collaboration with the other partners. Local businesses provide finance and other forms of donations that have generally added up to approximately R100 000 per annum. The estimated total project cost for the river corridor is about R300 000 per annum including the City’s contributions in terms of heavy machinery and waste removal (P. Dowling, WESSA – Western Cape Region, pers. com. 2004). WESSA – Western Cape is responsible for the financial management of the project as well as the training of the river warders in environmental and waste management, river dynamics, water testing and life skills. Currently the project employs two warders for three days per week. In order to facilitate the smooth running of the project a steering committee with representatives from all partner organisations was formed and meets on a monthly basis.
The South Peninsula Wetlands Rehabilitation Project was initiated after the City of Cape Town received funding from the Department of Environment Affairs and Tourism (DEAT) to run a ‘Working for Wetlands’ programme. To facilitate this project, a partnership was formed with WESSA. The project focused on highly sensitive wetland and riverine ecosystems. Its alien clearing component entailed removing alien vegetation on riverine and wetland areas. The other component of the project involved rehabilitating the riparian edges of various vleis and rivers throughout the South Peninsula. Local labour was used to clear riparian edges infested by invasive bullrush and then to replant these areas with appropriate indigenous species which were propagated at the Noordhoek Forestry Station by local community members. Training was undertaken by WESSA and aimed to furnish trainees with the skills and knowledge necessary for future employment. Training modules included life skills, environmental awareness, entrepreneurial skills, first aid techniques and HIV-Aids awareness. Trainees received a certificate at the end of the project.
Big Rivers Partnership is an example from the United States of partnership between groups, consisting of a team of government and non-profit organizations who work together, involving the local citizens in restoration projects. Partners include Great River Greening, Friends of Minnesota River Valley and the Minnesota Department of Natural Resources. The key objective of the partnership is to provide landowners that are close to the Mississippi and Minnesota Rivers with the opportunity to improve the areas adjacent to the rivers. Both private and public landowners can apply for funding, with the possibility that matching funds may be required (Big Rivers Partnership, 2004)

The cost and benefits of urban river and wetland rehabilitation projects 37
Also in the United States, the US Fish and Wildlife Service, in cooperation with state governments as well as non-governmental partners, administers the North American Waterfowl Management Plan (NAWMP) joint venture projects program. It was authorized in 1986 between the United States and Canada with the purpose of protecting, restoring, and enhancing wetlands important to waterfowl. Mexico has subsequently also signed on. The plan is implemented at the grassroots level by partnerships called joint ventures. Wetlands identified under the NAWMP as "areas of major concern" for waterfowl and other bird habitat (for example, migration, nesting and forage areas) are targets for these joint ventures. Each joint venture starts by developing a plan with goals and objectives. Financial and technical assistance are available to landowners through the plan as well as support for research on wetland restoration, wetlands status surveys, and wetlands inventories (Audubon, 2004).
4.2.5 Volunteer contributions
The efforts of volunteers are often pivotal to the success of rehabilitation projects. They can provide valuable time for initial rehabilitation as well as ongoing project maintenance work. They can generate interest in projects and assist directly with sourcing funding. Local groups and individuals that are familiar with their environments can often provide information valuable to the formulation of environmental management plans. They can also fulfil an important watchdog role ensuring that local authorities are held accountable for ensuring the maintenance of rehabilitated areas.
Local examples of volunteers groups include the Riverine Rovers at the Lower Silvermine River mentioned in section 3.1. Friends of Rietvlei are a group of residents who are involved in the rehabilitation and ongoing preservation of the Rietvlei Wetland Area in Milnerton, Cape Town. Initially they raised funds to purchase the land surrounding the vlei, and received support from the WWF and Mazda Wildlife Fund. Their activities include assisting the City of Cape Town in the management of Rietvlei as well as educating the public with regard to wetland preservation. They also have corporate sponsors with the nearby Caltex refinery being particularly active in supporting the group’s activities. Recently they provided sponsorship for the building of the new education centre. The group also relies on volunteers as well as its membership fees (Friends of Rietvlei, 2004).
International examples of volunteer groups include Friends of the Chicago River which is a non-profit organization with more than 1600 dues-paying members and a number of volunteers assisting in its activities. The group is involved in various river rehabilitation projects aimed at improving water quality, reducing flood damage and creating a suitable habitat for wildlife. The group’s funding consists of membership fees, gifts from individual and corporative sponsors, planned gifts or gifts of stock, sponsoring of its events as well as volunteering (Friends of Chicago River, 2004).
4.3 The applicability of potential funding mechanisms
The previous section has outlined a number of mechanisms that could act (and in some cases have acted) as alternatives to direct municipal funding of wetland rehabilitation projects. The focus now switches to the applicability of these mechanisms in Cape Town.

The cost and benefits of urban river and wetland rehabilitation projects 38
4.3.1 Identifying potential beneficiaries
The first question with regard to applicability is: who are the main beneficiaries of rehabilitation and can they be made to pay for their benefits? The choice of potential funder and funding mechanism will depend on the types and magnitudes of the values created by the project. In all three case studies, aesthetic and recreational benefits for the local community were the most prominent values associated with rehabilitation as measured using property values. Interestingly, while the flood attenuation benefits for the local community were also important, their magnitudes was not as great. In the case of the Silvermine River and, to a far lesser degree, the Westlake River in Kirstenhof there were also biodiversity enhancement values. These provided aesthetic and recreational benefits to the local community e.g. greater bird diversity both enhances aesthetic appeal and increases recreational opportunities in the form of bird watching.
4.3.2 The implications of land ownership
When considering whether the beneficiaries of rehabilitation can be made to pay for it one needs to consider any special implications stemming from the ownership of the areas under consideration? When it is public land that requires rehabilitation, the relevant government officials have to recognise the need for it. Public ownership can, however, impede rehabilitation efforts if the public believe that the municipality (or other public sector bodies) is somehow obligated to rehabilitate. When the rehabilitation is non-essential, and in particular where it provides windfall gains in the form of higher property values for nearby landowners it is crucial that such landowners be free (and encouraged) to initiate such improvements themselves!
Further complexities are introduced when land needing rehabilitation is privately owned. Ongoing rehabilitation and flood attenuation work on the Lourens River in Somerset West has been made more difficult by the unique ownership structure with respect to the river. The property rights of private land owners adjacent to the river extend to the middle of the river. Consequently the municipality had to consult extensively with land owners and enter into agreements with them before any rehabilitation was possible (Nico Meyer, City of Cape Town, pers. com. 2004).
4.3.3 Gaining from association with rehabilitation projects
If a ‘user-pays’ strategy is adopted, those living close to a rehabilitated areas (and typically enjoying the bulk of the benefits) are the obvious source of funding. Association with rehabilitation projects can also provide benefits however. Thus companies, particularly those that rely on local customers, benefit when associated with successful and locally popular rehabilitations. Funding or subsidy of rehabilitation may offer such benefits, and the costs remain deductible from taxable income.
Local estate agencies, banks and tourism and recreation related business are some more obvious examples of companies that often benefit from association with rehabilitation. Estate agencies make their income from commissions on the sale prices of houses. They stand to gain from any project, such as rehabilitation, that increases these prices or leads to increased development some consider contribution to rehabilitation a sound business practice. Currently De Kock Estates is the major sponsor of the Zandvlei trust which is dedicated to the conservation of Zandvlei in

The cost and benefits of urban river and wetland rehabilitation projects 39
Muizenberg. Aida are also in the process of contributing to the maintenance of the Lower Silvermine River Upgrade through the activities of the Riverine Rovers.
To place the indirect benefits of rehabilitation for estate agents into context, increased commissions from sales in Clovelly and Fish Hoek as a result of rehabilitation were calculated. It was assumed that a commission of six percent would be earned on sales and that the average house affected by rehabilitation would be sold every 10 years. Given these assumptions, average increased commissions due to rehabilitation amount to R270 000 per annum - over 50 years the present value of this flow would be R3.3 million at a discount rate of 8%.
Property transfer and conveyancing fees also increase when property values rise to the benefit of conveyancers and the state. These fees consist of transfer duties, property conveyance fees and bond conveyance fees. Transfer duties go to central government and are currently calculated as follows:6
0% for the first R150 000 of the property purchase price, 5% for R150 001 to R320 000 and R8500 plus 8% (on value above R300 000) for R320 001 and above
Using the Lower Silvermine River upgrade example, the financial benefits of rehabilitation to the central government would be approximately R360 000 per annum - over 50 years the present value of this flow would be R4.4 million at a discount rate of 8%.
Conveyance fees go to the attorneys involved in the transfer and are currently calculated as follows:
R7250 for the first R500 000 plus -
R800 per R100 000 (or part thereof) above that up to R1 000 000 R400 per R100 000 above R1 000 000 and up to R5 000 000 R200 per R100 000 above R5 000 000.
Using the Lower Silvermine River upgrade example, the financial benefits of rehabilitation to the attorneys involved would be approximately R36 000 per annum - over 50 years the present value of this flow would be R440 000 at a discount rate of 8%.
If a property is bought using a loan, bond conveyance fees are also charged by the attorneys representing the financial institutions extending the loan and are calculated as follows:
R5 050 for the first R500 000 plus -
R600 per R100 000 (or part thereof) above that up to R1 000 000 R300 per R100 000 above R1 000 000 and up to R5 000 000 R150 per R100 000 above R5 000 000.
Using the Lower Silvermine River upgrade example, the financial benefits of rehabilitation to the attorneys involved could be zero if all properties require bonds of
6 Information on the calculation of transfer duties and conveyance fees was provided by Johan Le Roux of Cape Coastal Properties.

The cost and benefits of urban river and wetland rehabilitation projects 40
R500 000 or less. If all properties require bonds exceeding R500 000, benefits would total approximately R27 000 per annum - over 50 years the present value of this flow would be R330 000 at a discount rate of 8%. Given the profile of buyers in the area and the average price of property it seems unlikely that benefits would be zero, but they are also unlikely to reach the maximum amount of R27 000 per annum.
Tourism and recreation related businesses also stand to gain from rehabilitation projects. If greater numbers of people are attracted to an area this can result in opportunities for businesses. Not only can this benefit existing businesses, it can also lead to the establishment of new ones. For example, a rehabilitated area may create the setting for a coffee shop or small restaurant. In the case of the Lower Silvermine River, the Clovelly Country Club have recently financed the printing of information pamphlets on the Lower Silvermine wetland. This is not just good neighbourliness, it makes sound business sense to support initiatives that beautify the area and attract people to it.
4.3.4 Recommendations on potential funding mechanisms
Where the land affected by rehabilitation is undeveloped but privately owned, funding is fairly straightforward. The development value of the site increases with environmental improvement. The recreational and aesthetic benefits of the rehabilitation can be sold with the development and incorporated in the price of units.
When the degraded area and the areas benefiting are communal or open access zones, the dimensions of the problem change. Where the benefits of a “common” are shared by all, Hardin recommends a system of “mutual coercion mutually agreed upon”. In the context of wetland rehabilitation formation of local civic associations would be an example. For practical purposes, however, the primary potential instrument for rehabilitation funding remains rates levied on nearby property owners. This presents difficulties which have been discussed in section 4.1 on the role of municipal finance in funding rehabilitation. Regardless of these constraints, there does seem to be scope to consider the potential of changes to the rates regime and role of rates in generating municipal income particularly when compared to the role of revenues from the sale of water.
User fees do not seem to offer much. To be practical a large number of users must be expected and regulation of access must be easy. When these conditions are not met (as for the case studies investigated here), fees may not even generate the income to cover the costs of their collection. They may also give rise to objections from local communities who feel that charging for access to municipal amenities is unethical.
Measures that do not force beneficiaries to pay for rehabilitation run the risk of free-riding, but still have good potential. These include donations and grants, Public-Private Partnerships and volunteer contributions. Of course the potential for funding diminishes when the public are unaware of the benefits that they stand to gain from rehabilitation. As a final point, the success of rehabilitation projects that are not initiated by the municipality and instead involve partnerships between individuals, organisations and companies depend critically on having a dynamic local champion to push the project along and manage it.

The cost and benefits of urban river and wetland rehabilitation projects 41
5 CONCLUSION
Out of the three case studies, the Lower Silvermine River upgrade project stands out as an example of how benefits can be maximised if attention is paid to restoring ecosystems and creating aesthetically pleasing spaces with recreational opportunities. The cost benefit analysis confirms the desirability of the project even under conservative assumptions. The Kuils River project relied more heavily on the construction of a suitable narrow and relatively deep channel to attenuate floods. There was relatively little scope for aesthetically pleasing landscaping compared to the Lower Silvermine River. In addition, that which was done was allowed to degrade, further decreasing benefits and emphasising the importance of proper maintenance. The rehabilitation in Kirstenhof illustrated the high benefit generation potential of relatively cost effective rehabilitation focused on aesthetic and recreational improvements. The often greater magnitude of aesthetic and recreational benefits relative to flood attenuation benefits in the case studies indicates that their enhancement should be made a priority even when rehabilitation project are primarily aimed at flood attenuation.
Despite their benefits the potential for increased municipal funding of rehabilitation projects seems limited for the foreseeable future. This is primarily due to other more urgent priorities coupled with a lack of clear municipal financial returns from such projects. However, other beneficiaries of rehabilitation projects, mainly local residents and businesses, should be more willing to fund rehabilitation particularly if they are made aware of its potential benefits. The ideal institutional structures for these projects will vary, but experience has shown that partnerships between local residents, businesses, local government institutions and NGOs increase the chances of success.
This research suggests that further study may be relevant on the role of rates in generating municipal income particularly when compared to the role of revenues from the sale of water. The incentive effects of current structures not only for supporting rehabilitation and other environmental improvements, but also for encouraging water conservation seem worthy of further investigation.

The cost and benefits of urban river and wetland rehabilitation projects 42
6 REFERENCES
American Rivers. 2004. Introduction. Retrieved on 4 July 2004. http://www.amrivers.org American Trails. 2004. Introduction. Retrieved on 4 July 2004. http://www.americantrails.org/resources/funding/TipsFund.html
Audubon, 2004. Waterfowl Management Plan Joint Venture Projects (NAWMP) program. Retrieved on 3 June 2004. http://www.audubon.org/campaign/wetland/funding.html
Big Rivers Partnership. 2004. The Big Rivers Partnership. Retrieved on 8 July 2004. http://www.fmr.org/brp.html
Brown, C.A. & Harding, W. 1999. Silvermine River: Verification of the Stormwater Proposals for the Lower Silvermine River. Prepared by Southern Waters for South Peninsula Municipality / Erica van den Honert Consulting.
Conningarth Consulting. 2002. Updating of the 1989 Manual for Cost-benefit Analysis in South Africa to 2000 with Specific Reference to Water Resource Development. WRC Report Nr. K5/1132. WRC, Pretoria.
Doss, C.R. & Taff, S.J. 1996. The Influence of Wetland Type and Wetland Proximity on Residential Property Values. Journal of Agricultural and Resource Economics 31(1):120-129.
Conservation Finance Alliance. 2004. Conservation Finance Guide. Retrieved on 30 June 2004. http://guide.conservationfinance.org
Earnhart, D. 2001. Combining Revealed and Stated Preference Methods to Value Environmental Amenities at Residential Locations. Land Economics 77(1): 12-29.
Environment Canada. 2004. Wetland Partnerships. Retrieved on 3 June 2004. http://www.on.ec.gc.ca/wildlife/wetlands/partnerships-e.cfm.
Freshwater Consulting Group. 2002. Assessment of River and Wetland Engineering and Rehabilitation Activities within the City of Cape Town; Realisation of Project Goals and their Implications. Report to Catchment Management, City of Cape Town.
Friends of Chicago River. 2004. Introduction on Friends of Chicago River Home Page. Retrieved on 8 July 2004. http://www.chicagoriver.org
Friends of Rietvlei. 2004. History and Activities. Retrieved on 5 August 2004. http://home.worldonline.co.za/~friendsofrietvlei/
Georgiou, S., Langford, I.H., Bateman, I.J. & Turner, R.K. 1998. Determinants of individual's willingness to pay for perceived reductions in environmental health risk: a case study of bathing water quality, Environment and Planning A, Vol. 30, pp. 577-594.
The cost and benefits of urban river and wetland rehabilitation projects 43
Gibb Africa. 1998. Fish Hoek Northern Area Replanning: Implementation Plan. Report to the South Peninsula Municipality, Plumstead, Cape Town. Project No. J80010A.
Great Rivers Greening. 2004. About Us: Great River Greening. Retrieved on 10 July 2004. http://www.greatrivergreening.org/
Green, C.H. & Tunstall, S.M. 1991. The Evaluation of River Water Quality Improvements by the Contingent Valuation Method. Applied Economics 23: 1135-1146.
Heimlich, R.D., Weibe, K.D., Claassen, R., Gadsby, R, & House, R.M. 1998. Wetlands and Agriculture: Private Interest and Public Benefits. USDA Economic Research Service. Washington D.C.
Heiberg, A. & Hem, K-G. 1987. Use of Formal Methods in Evaluating Countermeasures to Coastal Water Pollution: a Case Study of Kristiansand Fjord, Southern Norway. Centre for Industrial Research. In: Barde, J.P. & Pearce, D.W. (Eds) 1991. Valuing the Environment: Six case studies. OECD, Paris.
IUCN. 1998. Economic Values of Protected Areas: Guidelines for Protected Area Managers. IUCN, Gland, Switzerland.
Lansford, N.H. & Jones, L.J. 1995. Marginal Price of Lake Recreation and Aesthetics: A Hedonic Approach. Journal of Agricultural and Applied Environmental Economics 27(1): 212-223.
Legget, C.G. & Bockstael, N.E. 2000. Evidence on the Effects of Water Quality on Residential Land Prices. Journal of Environmental Economics and Management 39: 121-144.
Mahan, B.L., Polasky, S. & Adams, R.M. 2000. Valuing Urban Wetlands: A Property Price Approach. Land Economics 76 (February):100-113.
Mondi Wetlands Project. 2004. What is the Mondi Wetlands Project? Retrieved on 5 August 2004. http://www.wetland.org.za
Mooney, S. & Eisgruber, L.M. 2001. The Influence of Riparian Protection Measures in Residential Property Values: The Case of the Oregon Plan for Salmon and Watersheds. Journal of Real Estate Finance and Economics 22(2/3): 273-286.
Murray Wetlands Working Group. 2004. Introduction on Home Page. Retrieved on 3 June 2004. http://www.murray.nsw.gov.au/news/.
National Fish and Wildlife Foundation. 2004. Introduction on Home Page. Retrieved on 5 August 2004. http://www.nfwf.org.
Netusil, N. 2004. Does Ownership Matter: Examining the Relationship Between Property Values and Privately and Publicly Owned Open Spaces. Streams and Wetlands. Unpublished report - Reed College, Oregon.
Ninham Shand. 1990. Kuils River Flood Management Study. Unpublished report No. 1669/4978. Ninham Shand, Cape Town.

The cost and benefits of urban river and wetland rehabilitation projects 44
Ninham Shand. 1999. Kuils River Metropolitan Open Space Study. Unpublished report. Ninham Shand, Cape Town.
SAACE. 2000. The SAACE Award for Excellence in Environmental Engineering for 2000: Silvermine River Upgrade. Unpublished report.
Southern Waters. 2000. Silvermine River Integrated Catchment Management Plan. Unpublished report to the City of Cape Town.
Streiner, C.F. & Loomis, J. 1995. Estimating the Benefits of Urban Stream Restoration Using the Hedonic Price Method. Rivers 5(4): 267-278.
Sutherland, R.J. & Walsh, R.G. 1985. Effect of Distance on the Preservation Value of Water Quality. Land Economics 61(3): 281-291.
Turpie, J.K., Joubert, A., Van Zyl, H.W. & Leiman, A. 2001. Valuation of Open Space in the Cape Metropolitan Area. Report to the City of Cape Town, Environmental Management Department.
Van Zyl, H.W. & Leiman, A. 2002. Development of a Framework for the Economic Evaluation of Water Conservation / Demand Management Measures with Specific Application to Cape Town. Water Research Commission report Nr. K5/1275. WRC, Pretoria.
WESSA. 2004. Education at WESSA. Retrieved on 6 August 2004. http://www.wildlifesociety.org.za
Wetland Care Australia. 2004. Retrieved on 3 June 2004. http://www.wetlandcare.com.au/Projects_LWF_archive.asp
Woodward, R.T. & Wui, Y.S. 2001. The Economic Value of Wetland Services: A Meta-analysis. Ecological Economics 37: 257-70.
Working for Wetlands. 2004. Retrieved on 8 August 2004. http://www.panda.org/downloads/freshwater/mrwworkingforwetlandscs.pdf
Zandvlei Trust. 2004. Zandvlei Trust Newsletter, 2nd quarter 2004.

The cost and benefits of urban river and wetland rehabilitation projects 45
7 APPENDIX
Appendix 1: Habitat Integrity scores for the Silvermine River, before (from Brown & Harding 1999) and after implementation of the project (September 2001).
Note: Scores out of 25 River Before After Comment / reason for score change
Abstraction 13 5 alien clearing (incl. upstream); influence of groundwater
Water quality 15 10 influence of groundwater
Floods 8 5 Silvermine reservoir (score change due to refinement of methods)
Low flows 15 5 influence of groundwater mitigates against drying out in summer
River bed 13 19 alteration of in-channel conditions by removal of bank; re-creation of deeper water section adjacent to old channel
River channel 17 13 redress of channelisation (narrow channel); increased connectivity with floodplain wetlands
Inundation 0 16 “new” channel deeper, with exposed groundwater, but some seasonality in levels; floodplain area permanently inundated
Exotic macrophytes 8 7 alien clearing programme; but threat remains
Exotic fish 9 11 more standing water habitat = greater threat
Presence of solid waste 8 5 maintenance & operational programme
Loss of indigenous riparian vegetation
13 15 presently much removed; some planting, but yet to establish
Encroachment by alien vegetation
19 2 alien clearing programme
Erosion 6 4 not significant
Instream component (%) 55 59
Riparian component (%) 60 71
Habitat Integrity Score (%)
58 65 Category 4 → Category 3
Source: The Freshwater Consulting Group, 2002