Embed Size (px)
Citation preview

The Costs of Illegal Wildlife Trade: Elephant and Rhino
WP3 Quantitative Analysis
Deliverable No. 3.2c
This project has received funding from the European
Union’s Seventh Framework Programme for research,
technological development and demonstration under
grant agreement no 320276.

ii
DISCLAIMER
The text reflects only the authors’ views and the EU or the Ecologic Institute are not liable for any use that may be made of the information contained therein. The views expressed in this publication are the sole responsibility of the author/s and do not necessarily reflect the views of the European Commission.
For permission to reproduce, please contact the Ecologic Institute at [email protected].
ACKNOWLEDGEMENT
The research leading to these results has been carried out as part of the research project "European Union Action to Fight Environmental Crime" (www.efface.eu). EFFACE is a collaborative effort of 11 European universities and think tanks and is coordinated by the Ecologic Institute (www.ecologic.eu). The research leading to these results has received funding from the European Union FP7 under grant agreement No 320276.
AUTHOR(S)
Lucy Olivia Smith, Ecologic Institute
Lucas Porsch, Ecologic Institute
With contributions by:
McKenna Davis
With thanks to:
Christiane Gerstetter
Manuscript completed in July 2015
This document is available online at: www.efface.eu
This document should be cited as: Smith, Lucy Olivia and Lucas Porsch. 2015. The Costs of Illegal Wildlife
Trade: Elephant and Rhino. A study in the framework of the EFFACE research project. Berlin: Ecologic
Institute.

iii
Table of Contents
1 Background: Summary of Available Information ............................................................................................................ 6
1.1 Introduction: Illegal trade of Elephant and Rhino 6
1.2 Summary of Available Information 8
2 Methodology: what methods were used for quantitative analysis and for the monetary analysis ....... 10
2.1.1 Estimating the impact of illegal trade on population numbers 11
2.1.2 Estimating and valuing impacts of decreasing population numbers 12
2.1.3 Limitations of the Above Methods of Estimation 12
3 Impact of Illegal Poaching on Population Numbers .................................................................................................... 13
3.1 Elephants 13
3.1.1 Geographic Range and Population Estimates 13
3.1.2 Impact of Poaching on Population Growth Rates 14
3.1.3 Conclusions for the Economic Assessment 15
3.2 Rhino 16
3.2.1 Geographic Range and Population Estimates 16
3.2.2 Impact of Poaching on Rhino Populations 17
3.2.3 Conclusions for the Economic Assessment 19
4 Qualitative and Quantitative Impacts of Illegal Rhino and Elephant Poaching ............................................... 19
4.1 Quantifiable Social and Economic Impacts 20
4.1.1 Wildlife Tourism and Game preserves – An Estimate of the Value of the Natural Wealth
Loss 20
4.1.2 Trophy Hunting/Ranching: 25
4.1.3 Example for the value of a Rhino: Namibia and Community Led Conservation 25
4.1.4 Qualitative Impacts of Poaching committed by Organised Criminal Groups 26
5 Results and Conclusions .......................................................................................................................................................... 27
References ................................................................................................................................................................................................. 29
Annex A ...................................................................................................................................................................................................... 32

iv
List of Tables
Table 1 Poaching Statistics from the IUCN African Rhino Specialist Group ................................................................... 17
Table 2 Valuation Estimates of Extinction of Rhinos in Four Countries ........................................................................... 24
Table 3 Valuation Estimates of Extinction of Elephants ......................................................................................................... 24
Table 4 Economic Value Lost Due to Elephant Poaching ....................................................................................................... 27
Table 5 Economic Value Lost Due to Rhino Poaching .............................................................................................................. 28
List of Figures
Figure 1: Impacts of trade in endangered species ..................................................................................................................... 10
Figure 2: Elephant Population and Range .................................................................................................................................... 14
Figure 3: Modelled trends in annual population changes between 2002 and 2012 for 306 elephant
populations across Africa .................................................................................................................................................................... 15
Figure 4 Recorded number of rhinos poached annually in South Africa .......................................................................... 18
Figure 5 Rhino population increase for Africa between 2007 and 2012 (Data from IUCN SSC AfRSG) ............... 18
Figure 6 Importance of Wildlife and Wildlife Related Sectors for Visitors ...................................................................... 21
Figure 7 Direct and Indirect Contribution of Tourism on GDP and Employment in Source Countries ................ 21
Figure 8 Value of Travel and Tourism to African Economies: Sector Comparison ....................................................... 23
Figure 9 Value of Travel and Tourism to the Generation of Employment Compared to other Industries .......... 23
List of Boxes
Box 1: Zimbabwe: Case Example of Overharvesting and Population Collapse 2006-2009 ....................................... 19

v
LIST OF ABBREVIATIONS
AfESG
AfRSG
CAR
CITES
DRC
ETIS
GPTF
IRDNC
IUCN
LRA
IUCN/SSC African Elephant Specialist Group
IUCN/SCC African Rhino Specialist Group
Central African Republic
Convention on International Trade in Endangered Species
Democratic Republic of Congo
Elephant Trade Information System
Game Products Trust Fund
Integrated Rural Development and Nature Conservation
International Union for the Conservation of Nature
Lord’s Resistance Army
MIKE
PIKE
SSC
Monitoring the Illegal Killing of Elephants
Proportion of Illegally Killed Elephants
Species Survival Commission
UNEP
UNWTO
United Nations Environmental Program
United Nations World Tourism Organisation
WTTC World Travel and Tourism Council

6
1 Background: Summary of Available Information
1.1 Introduction: Illegal trade of Elephant and Rhino
African elephants and rhino are facing an uncertain future, placed at risk in the short term by increasing
demands for ivory and rhino horn and in the long term by habitat loss, degradation and fragmentation
from expanding human settlements. It is the short term threat of poaching, however, that puts elephant
and rhino at immediate risk of extinction in the wild. Since 2007, illegal poaching has risen precipitously
year after year to meet the insatiable market demand of mainly Asian consumers. The high value of ivory,
and particularly rhino horn, have established these items as lucrative black market commodities, which
has led to the trade becoming highly organised and professionalised.
Historically, both elephants and rhino became nearly extinct because of unsustainable hunting. The
mass slaughter and near elimination of both species during the twentieth century led to concerted
rehabilitation missions.1 In the 1960’s an international coordinated effort called “operation rhino” involved
the repopulation of white rhino to southern Africa using just a few individuals. For elephants, unregulated
poaching and hunting led to the introduction of important protection measures in the late 1980s with a
1989 Convention on International Trade in Endangered Species (CITES) ban on commercial trade of ivory
and the inclusion of elephants on the International Union for the Conservation of Nature (IUCN) Red List as
“vulnerable.”2 Elephant poaching levels are also the highest in over 25 years.3 Both elephants and rhino are
currently listed in Appendix I of CITES meaning that commercial trade in wild-caught specimens is illegal.4
As a result of these efforts, elephant and rhino populations experienced a decade of low levels of
poaching (from 1995 to 2007) that saw their populations begin to rehabilitate. This brief period, however,
came to an end in 2007 when poaching levels escalated dramatically and continued to increase on an
annual basis.5 For rhino in particular, the poaching rate over time exhibits the magnitude of growing
demand with an average of only fourteen poached rhino individuals per year between 1990 and 2007
increasing to over a thousand in 2014.6
Poaching for ivory and particularly rhino horn is driven by the high value these products have on the
black market. According to the wildlife trade monitoring network TRAFFIC, the street price of Rhino horn
is $100,000/kg compared to the price in 1990 which at the time was estimated at $250-500/kg, with a
1 Tom Milliken and Jo Shaw, The South Africa-Vietnam Rhino Horn Trade Nexus: A Deadly Combination of Institutional Lapses, Corrupt Wildlife Industry Professionals and Asian Crime Syndicates, A TRAFFIC Report, (2012), http://www.traffic.org/species-reports/traffic_species_mammals67.pdf.
2 IUCN Red List, “Loxodonta Africana,” 2015, http://www.iucnredlist.org/details/12392/0.
3 UNEP, Elephants in the Dust: The African Elephant Crisis, A Rapid Response Assessment (United Nations Environmental Programme, 2013), http://www.unep.org/pdf/RRAivory_draft7.pdf.
4 Hunting only takes place with a limited number of permits/licenses dictated by CITES to private owners.
5 Richard Emslie, Tom Milliken, and Bibhab Talukdar, African and Asian Rhinoceroses - Status, Conservation and Trade., A report from the IUCN Species Survival Commission (IUCN/SCC) African and Asian Rhino Specialist Groups and TRAFFIC to the CITES Secretariat pursuant to Resolution Conf. 9. 14 (Rev. CoP16) (Bangkok, 2013), http://www.rhinos.org/professional-resources/iucn-african-rhino-specialist-group.
6 Milliken and Shaw, The South Africa-Vietnam Rhino Horn Trade Nexus: A Deadly Combination of Institutional Lapses, Corrupt Wildlife Industry Professionals and Asian Crime Syndicates.

7
single horn weighing between 1-3kg, depending on the age and species.7 Thus, the poached value of a rhino
individual ranges between $100,000 - $300,000. The price of ivory has tripled in the last three years in
China.8 Uncarved ivory is worth $2,100 per kilo and an elephant on average has 10 kilos per tusk, thus the
black market revenue of one poached elephant is approximately $21,000.9 Demand from consumers is not
abating and parallels the purchasing power of Asia’s rising middle class which finds rhino and ivory to be
symbolic of prestige and wealth.10 However, what is fundamentally new is the surge in demand of rhino
horn from Vietnam stemming from a rumour around 2008 when a Vietnamese politician claimed to be
treated for cancer with rhino horn.11 Contrary to popular belief, rhino horn is not a common ingredient of
traditional Chinese medicine and its use now is distinctly a new trend tied to increased wealth and its
perceived medicinal qualities.12 The number of multimillionaires in Vietnam has grown 150% in the last
five years. 13 At the same time, cancer rates in Vietnam are increasing 20-30 % annually with an estimated
150,000 new cases each year making for a long waiting list for radiation therapy and lack of capacity to
deal with cancer in conventional facilities.14 Scientifically rhino horn is composed of carotene and is the
same chemical composition as a human finger nail, thus making the trade not only unsustainable but
scientifically misguided. On the other hand, ivory has been traded throughout history, but demand from
Asian countries particularly Vietnam (for rhino horn) over the last decade has led to a resurgence in
poaching pushing many African elephant populations towards extinction.15
Range or source countries for ivory are widespread across Africa and include but are not limited to
Sudan, Central African Republic, Democratic Republic of Congo, Chad, Kenya, Tanzania, Zimbabwe, Zambia,
Malawi, Mozambique, Nigeria, Cameroon and Mali.16 The main source countries for rhino horn are South
Africa, Namibia, Zimbabwe and Kenya where 98% of all black and white rhinos live.17
Range and source countries have varying levels of experience, capacity and political will to stop the
poaching and illegal trade. A 2014 study by Chatham House conducted an extensive literature review to
7 Gwynn Guilford, “China’s Obsession with Rhino Horns Is Sending South African Rhino Deaths through the Roof,” Quartz, December 19, 2013, http://qz.com/159902/chinas-obsession-with-rhino-horns-is-sending-south-african-rhino-deaths-through-the-roof/.
8 “Price of Ivory in China Triples,” The Guardian, July 3, 2014, http://www.theguardian.com/environment/2014/jul/03/price-ivory-china-triples-elephant.
9 Rob Brandford, Dead or Alive? Valuing an Elephant. (United Kingdom: The David Sheldrick Wildlife Trust, 2014), http://iworry.org/wp-content/uploads/2013/09/Dead-or-Alive-Final-LR.pdf.
10 UNEP, CITES, IUCN, TRAFFIC (2013). Elephants in the Dust – The African Elephant Crisis. A Rapid Response Assessment. United Nations Environment Programme, GRID-Arendal.
11 Milliken and Shaw, The South Africa-Vietnam Rhino Horn Trade Nexus: A Deadly Combination of Institutional Lapses, Corrupt Wildlife Industry Professionals and Asian Crime Syndicates.
12 Ibid.
13 Gwynn Guilford, “Why Does a Rhino Horn Cost $300,000? Because Vietnam Thinks It Cures Cancer and Hangovers,” The Atlantic, May 15, 2013, http://www.theatlantic.com/business/archive/2013/05/why-does-a-rhino-horn-cost-300-000-because-vietnam-thinks-it-cures-cancer-and-hangovers/275881/.
14 “Rhinos Face Extinction by 2020, Wildlife Experts Warn | Al Jazeera America,” accessed March 12, 2015, http://america.aljazeera.com/articles/2014/4/14/rhinos-face-extinctionby2020.html.
15 Environmental Investigation Agency, Made in China: How China’s Illegal Ivory Trade Is Causing a 21st Century African Elephant Disaster (Washington D.C., 2007), http://eia-global.org/images/uploads/Made_in_China_Report.pdf.
16 George Wittemyer et al., “Illegal Killing for Ivory Drives Global Decline in African Elephants” 111, no. 36 (2014), http://www.pnas.org/content/111/36/13117.full.pdf+html.
17 Emslie, Milliken, and Talukdar, African and Asian Rhinoceroses - Status, Conservation and Trade.

8
illustrate the consensus among authors that poaching and illicit trade flows thrive in regions with weak
governance and conflict and is perpetuated by such conditions.18 However, even countries such as South
Africa that have a long standing history and experience in conservation as well as governmental and
financial capacity, are also unable to adequately end illegal poaching and trade, which has become highly
professionalized. For example, in South Africa, the number of prosecutions against poachers has risen, but
poaching continues to accelerate annually.19
At the crux of the crisis is the fact that poaching levels are increasing annually and in some regions
actually outpacing the natural reproductive capacities of the species. Possible extinction in some ranges for
both elephants and rhino is a reality, in Central Africa the regional elephant population has been reduced
by 64% in the last decade, decimated by large-scale poaching incidents killing as many as 300 individuals
at once.20 Extinction is also a real threat for some rhino populations, with the western black rhino declared
extinct in 2013.21
As the largest land mammals on earth, elephant and rhino are particularly vulnerable because of their
time-intensive reproductive habits that make their conservation status in the wild especially sensitive to
consecutive years of accelerated poaching. Despite numerous reports citing known poaching statistics of
elephant and rhino, there are few studies that attempt to gauge the rate of extinction from over harvesting,
thereby coming to a predictive estimate of when a species will begin a steady population decline.
Developing tentative extinction rates can inform effective conservation management and action.
1.2 Summary of Available Information
Both the African elephant and African black and white rhino have been included in Appendix I of the
CITES Convention for over a decade and they or their parts are not allowed to be traded for commercial
purposes. The most comprehensive source of population data for elephants is the African Elephant
Database, which is maintained by the IUCN/ Species Survival Commission (SSC). The African Elephant
Specialist Group (AfESG) and has produced five reports to date (i.e. 1995, 1998, 2002, 2007 and
provisionally in 2015). The AfESG cooperates with the two CITES-mandated elephant monitoring systems
(the programme for Monitoring the Illegal Killing of Elephants - MIKE - and the Elephant Trade
Information System - ETIS) in an effort to integrate all available information on populations, poaching and
illegal ivory trade. For rhino, the IUCN/SSC African Rhino Specialist Group (AfRSG) is the authority on
population and poaching. The relatively low number of rhino and their earlier near extinction has led to
meticulous monitoring and statistics.
The CITES trade database (Table 1) includes data on the trade of CITES-listed species using self-
reported data by member states on import, export and re-exports. The database allows users to identify
where trade of a particular endangered species is occurring at the national level, it allows searching for
species, animal parts, and finished products (e.g. chess sets made from ivory) and also includes information
on its intended purpose (circus, educational, hunting). The CITES trade database can give an indication of
overall trade volumes of legal wildlife commodities or derivatives thereof. However, since elephant and
18 Katherine Lawson and Alex Vines, Global Impacts of the Illegal Wildlife Trade: The Costs of Crime, Insecurity and Institutional Erosion. (London: Chatham House, 2014), http://www.chathamhouse.org/sites/files/chathamhouse/public/Research/Africa/0214Wildlife.pdf.
19 Milliken and Shaw, The South Africa-Vietnam Rhino Horn Trade Nexus: A Deadly Combination of Institutional Lapses, Corrupt Wildlife Industry Professionals and Asian Crime Syndicates.
20 Wittemyer et al., “Illegal Killing for Ivory Drives Global Decline in African Elephants.”
21 Platt, John R. “How the Western Black Rhino Went Extinct | Extinction Countdown, Scientific American Blog Network,” accessed March 4, 2015, http://blogs.scientificamerican.com/extinction-countdown/2013/11/13/western-black-rhino-extinct/.

9
rhino are forbidden to be commercially traded, the CITES database is not useful in gauging the level of
illegal trade.
Information on the financial value of horn and ivory is constantly changing and for this reason online
sources were used that collected information from newspapers and journalists to gauge the street value in
real-time. Several internet search tools were also used that aim to tap into and evaluate the black market
directly, collecting open-source information on the black market.22 These websites collect information
from involved individuals, consumers and whistleblowers. Black market prices of illegal goods were also
compared with recent reports produced by TRAFFIC.
22 Two websites that collect information black market activity are: https://wildleaks.org/ http://www.havocscope.com/

10
2 Methodology: what methods were used for quantitative
analysis and for the monetary analysis
The following methodology sets out to explain how the impacts of illegal trade in certain CITES
protected species could be assessed and which data sources and methods will be deployed to achieve
thorough estimates for those impacts. The methodology is thereby based on the impact chain illustrated in
Figure 1, which was developed in task one of WP3.
Figure 1: Impacts of trade in endangered species
The methodology has two distinct steps:
1. In the first step the impact of illegal trade on population numbers of the species protected by
CITES is assessed based on existing statistics on poaching and population.
2. In the second step the impact of such population losses will be gauged taking into consideration
environmental, social, political and economic impacts. For some of the monetary impact valuations
will be undertaken.

11
2.1.1 Estimating the impact of illegal trade on population numbers
The most immediate impact of illegal trade in endangered species is the effect it has on populations,
global biodiversity and ecosystem services. For many different species, data can be obtained on the
conservation status of certain species’ populations. Some databases23 also keep track of the number of
seizures of a certain species or parts thereof, however seizure data only gives an indication of illegal
activity that is discovered by the authorities, and information on the “real” number of illegally traded
species is difficult to discern, and thus in some cases the understanding of the direct impact of the trade on
population numbers is limited.
For our analysis we therefore have chosen two species, where it is possible to divulge particularly
accurate information on the real amount illegal activity.
Elephants: A long history of conservation efforts combined with an upsurge in illegal poaching in recent years has led to improved monitoring efforts and data collection. The Elephant Database tracks the conservation status of elephants, with the last continental population census undertaken in 2012. The large geographic range of elephant populations which span some 37 countries, mean that available figures are estimates.24 CITES and ETIS contain the most extensive database and record of ivory seizures, while MIKE contains “kill data”, in other words, records resulting from identified poached animal carcasses in elephant range states.
Rhinos: The IUCN Red List database tracks the conservation status of Rhino (Black and White). The near extinction of African Rhino in the 1980s led to close monitoring and conservation efforts resulting from an upsurge of poaching in 2007. The conservation history and low numbers of individuals in the wild has resulted in comprehensive and extensive surveillance and population data. Therefore, data exists on populations, the number of individuals poached by year and on seizures.
For each of the two species the available information on population and poaching is assessed to
identify the causality between estimated illegal trade numbers and population figures. It is important to
emphasize the fact that different datasets will have certain biases and are not complete. Therefore, we do
not suggest to undertake a sophisticated statistical analysis, as the basic biases. The statistics can be more
easily and more transparently identified using the following steps:
Trend analysis: For elephant and rhino, the first phase of data collection and analysis will compare population data with the available data on kills for trade (bodies found without tusks or horns). The analysis should provide a first intuition of whether the data correlates to population declines, and if so in which magnitude and with which time delay.
Causal relationships: These first intuitions are then tested by reviewing literature on the
reproductive behaviour (average life span) of the species and other potential influences on
population. It is tested whether the first intuitive trends of the impact are consistent with the best
knowledge on the drivers of population figures.
23 There are also several databases that record data on seizures related to specific species such as
elephants (ETIS) and tigers (Tiger Tracker Wildlife Trade Tracker). These databases give information on
the number of seizures, the geographical location and volume or quantity. They are useful for monitoring
the economic value and the environmental impact of trade in a specific species. EU TWIX is a database
containing centralised data on seizures and offences reported by all 28 EU Member States, it is only
accessible by national law enforcement officers and CITES authorities.
24 Elephant Database, “2012 Continental Totals,” 2013, http://www.elephantdatabase.org/preview_report/2013_africa/Loxodonta_africana/2012/Africa.

12
It is obvious that the impact of specific individuals (rhino and elephant) on a population differs
according to the age of the poached animal, the average age of the population as a whole and the local
distribution of the animals. Thus, aggregated values for the impact are always imprecise. But the main
focus of this analysis is to produce estimates for the total economic and other loss caused by the crime and
for that average figures of population loss will be calculated.
This will result in estimates on where poaching at current levels is reducing the population and where
it is “only” reducing the increase of the population.
2.1.2 Estimating and valuing impacts of decreasing population numbers
Decreasing species numbers can have important impacts on host countries. Firstly, there is the danger
that an existing ecosystem is destabilized and changed by the decreasing or even disappearing species. So
the first step of the analysis needs to assess the role of the species in the ecosystem.
The second step of the analysis will undertake to value the loss or damage to the ecosystem and host
countries. These are based on two different sources of income provided by the ecosystem with elephants
and rhinos:
If the poaching does not lead to reduced numbers of the species, the societal loss is valued by
estimating the alternative legal income that the host society could reap from the animals, if they
would not be poached. The assumption is here that without poaching, the host countries could use
rising animal population numbers for to support the wildlife industry as it relates to tourism,
trading of hunting rights, and game ranching. Earned income could then be reinvested in nature
conservation or other purposes.
If the poaching reaches a level that leads to a reduction of the population, the loss is valued as a
loss of natural capital. The wildlife is the wealth of the source countries on which basis they can
attract wildlife tourism and the associated annual income from it. It is assumed that a reduction in
the numbers of rhinos and elephants leads to a reduction in wildlife tourism. Objectively a
poaching rate of 1% above replacement level would probably lead to lower reduction in
population numbers in the first years while if sustained the losses will be bigger in the later years,
when populations become too small and scattered for reproductive purposes. But for lack of better
data, the assumption is that this relationship is linear.
Other impacts mentioned above like the impacts of organised crime will not be quantified.
2.1.3 Limitations of the Above Methods of Estimation
The estimates provided have several limitations which need to be taken into account using the figures:
For lack of better data we estimated that an extinction of rhinos and elephants would each
diminish the total wildlife watching trade by 20%. As both rhinos and elephants have a very high
status for wildlife tourists this may be an underestimate but no data was found to prove or
disprove this assumption.
As population figures are not always precise and up to date we had to calculate the population loss
sometimes on the basis of the estimates for poaching. We estimated that 1% poaching above the
natural growth of 5% would lead to a 1% population loss. This is a simplification as it is more
likely that the impact will change in the course of a process leading to extinction. While poaching
more than the natural growth will probably first have a lower impact (less than 1%) on population
numbers as the average age of the population decreases, but if sustained, the impact will then
become even higher than 1% as sex ratios become skewed and behaviour dynamics from the
trauma of poaching affect animal groups.

13
3 Impact of Illegal Poaching on Population Numbers
The main environmental impact and threat posed by illegal harvest of horn and ivory is the extinction
of African elephant and rhino in the wild. Taking current estimates of total populations and measuring the
average population growth rate compared to the poaching rate can help predict the time period in which it
would take for the species to become extinct.
3.1 Elephants
3.1.1 Geographic Range and Population Estimates
The extensive geographic range of African elephants makes it difficult to get exact figures on population
and poaching and the quality and availability of specific population data varies greatly across the continent.
Regionally, Southern Africa is home to the largest portion of known elephants (almost 55%) and the
population is currently expanding under strong protection measures.25 Eastern Africa contains 28% of the
total population, with most in Tanzania and Kenya. Central Africa has 16% and West Africa less than 2%.26
The impact of poaching differs region to region, with Central African elephant populations being hit
especially hard. A study by Milliken (2014) estimates that Central African forest elephant populations have
undergone a 76% decline since 2002.27 The 2014 study by Wittemyer confirms such estimates, concluding
that 75% of elephant populations are declining in Central Africa.28
Elephants are slow to mature and reproduce and for this reason are particularly susceptible to
exploitative harvesting. A single calf is typically born every 2.5-9 years, after a gestation period of 22
months, and lives up to 70 years. Females are typically fertile between the ages of 25 and 45, and males
begin successfully competing for mating after the age of 20.29 Mature individuals are also the most heavily
targeted because their bigger sized tusks make them more valuable, thus poaching often targets those
elephants that are most important to maintaining reproductive potential of elephant communities and
range populations. Poaching also has the effect of destabilizing herd dynamics and skews populations often
leaving strongly skewed sex ratios and social damage from destroyed families and orphans, which affects
the recovery of populations and conservation efforts.
25 The greatest share in this region and on the continent are located in Botswana; Mozambique, Namibia, South Africa, Zambia and Zimbabwe also boast significant populations.
26 Elephant Database, “2012 Continental Totals.”
27 Tom Milliken, Illegal Trade in Ivory and Rhino Horn: An Assessment Report to Improve Law Enforcment under Wildlife TRAPS Project (USAID and TRAFFIC, 2014).
28 Wittemyer et al., “Illegal Killing for Ivory Drives Global Decline in African Elephants.”
29 WWF, “African Elephants,” African Elephants, 2014, http://wwf.panda.org/what_we_do/endangered_species/elephants/african_elephants/.

14
Figure 2: Elephant Population and Range
Source: http://www.cites.org/sites/default/files/eng/com/sc/65/E-SC65-42-01
3.1.2 Impact of Poaching on Population Growth Rates
To monitor poaching, CITES created the MIKE database (Monitoring the Illegal Killing of Elephants) in
2002, a data collection network that collects information on the number of illegally killed elephants in
African range states. MIKE aims to establish relative poaching levels by calculating the proportion of
illegally killed elephants (PIKE) from the total number of identified carcasses.
Using PIKE data it is estimated that 20,000 to 25,000 elephants are illegally killed each year out of total
population estimated to be between 420,000 and 650,000.30 Poaching rates reached an all time high during
the period from 2010 to 2012 where it is estimated that over 100,000 elephants were killed.31 Illegal
poaching became unsustainable in 2010 when illegal killing rates were ~6.8% between 2010 and 2012
meaning an average of ~33,630 elephants were killed per year based on current estimates of the entire
elephant population. Between 2010 and 2013, approximately 7% of the entire elephant population was
lost each year.32
In 2011, 40,000 elephants were illegally killed marking a kill rate of ~8% which correlates to a species
reduction of ~3% that year. In 2012, the killing rate was 7.4% compared to an average annual population
growth for elephants of 5% (in the absence of illegal killing), which means that more animals are being
killed than are being born.33 Thus, the poaching rate continues to outpace the natural reproduction rate
thereby already indicating consecutive years of a downward impact on overall populations.
30 IUCN African Elephant Specialist Group, 2013 Provisional African elephant status report.
31 “Organized Crime Threat to Wild Species on the Increase, Says UN on Wildlife Day - UNEP,” accessed March 4, 2015, http://www.unep.org/newscentre/Default.aspx?DocumentID=26788&ArticleID=34775&l=en.
32 Wittemyer et al., “Illegal Killing for Ivory Drives Global Decline in African Elephants.”
33 Ibid.

15
Figure 3: Modelled trends in annual population changes between 2002 and 2012 for 306
elephant populations across Africa
Modelled trends in annual population changes between 2002 and 2012 for 306 elephant populations across Africa presented by region: (A) Central, (B) East, and (C) Southern Africa regions and (D) all combined. Gray lines represent the site-specific annual population changes, where the thickness represents relative population size. Black lines represent the aggregate trends. Dashed lines represent the 95% confidence interval of aggregate trends.)
Source: George Wittemyer et al., “Illegal Killing for Ivory Drives Global Decline in African Elephants” 111,
no. 36 (2014), http://www.pnas.org/content/111/36/13117.full.pdf+html. P13119
3.1.3 Conclusions for the Economic Assessment
For the economic assessment of the impacts of poaching we aim to distinguish between poaching that
leads to a slower growth rate of the population and poaching that actually reduces the number of animals
leading to extinction. For that purpose we regard a poaching rate of 5% of the population or less as
reducing only the growth of population while a poaching rate of more than that reduces the population
towards extinction. Using the numbers indicated above the following conclusions can be made:

16
Africa lost a total of 100,000 elephants to poaching, which could have provided legal income for
African countries.34
As without poaching the population would have increased by about 75,000 animals (5% per year)
in the three years, this poaching led to an estimated population loss of 25,000 elephants or about
5% of the estimated population of 500,000.
As figure 2 shows the trends were different in different regions of Africa. While in South Africa nearly no
population loss occurred, the population losses were substantial in Central Africa.35
3.2 Rhino
3.2.1 Geographic Range and Population Estimates
There are currently an estimated 5,055 black rhinoceros and 20,405 white rhinoceros in Africa.36
Today, globally, there are 29,000 rhinos in the world (including Asian species), compared to 70,000 in
1970 and 500,000 in 1900.37 There has been a decline in population of 97% in the last century and rhinos
have disappeared entirely from some regions of their natural range.
African rhino populations exist in four key range states: Kenya, South Africa, Namibia and Zimbabwe.
South Africa, however, is home to the largest populations rhino accounting for 85% of the world’s white
rhino population and 73% of the black rhino population.38
The rate of poaching is gaining on that of rhinoceros reproduction with several authors predicting an
overall downward trend in population growth beginning between 2014 and 2016.39 Poaching threats,
therefore, are compounded by the slow reproductive rates of rhino. A single calf is typically born every 2.5-
4 years, after a gestation period of 16 months. Calves stay with their mother for 2-4 years which
significantly slows down their reproductive potential. Females typically become fertile between the ages of
4 and 7 years, and males begin successfully competing for mating between 7 and 10 years. They live
between 40 and 50 years of age. 40
Comparing the poaching rate to the reproductive rate of rhino, it is possible to gauge the possible rate
of extinction. The total population of white and black rhino in Africa has increased by 17.5% between 2007
and 2012 marking an increase in total population from 21,705 in 2007 to 25,510 in 2012.41 The average
rate of population growth during this time period was 4.9% per year between 2007 and 2010. This growth
34 Wittemyer et al., “Illegal Killing for Ivory Drives Global Decline in African Elephants.”
35 Ibid.
36 Save the Rhino, “Rhino Population Figures,” Save The Rhino, 2012, http://www.savetherhino.org/rhino_info/rhino_population_figures.
37 Ibid.
38 Guilford, “China’s Obsession with Rhino Horns Is Sending South African Rhino Deaths through the Roof.”
39 Emslie, Milliken, and Talukdar, African and Asian Rhinoceroses - Status, Conservation and Trade.
40 WWF, “African Rhinos,” 2014, http://wwf.panda.org/what_we_do/endangered_species/rhinoceros/african_rhinos/.
41 Sarah Standley and Richard Emslie, Population and Poaching of African Rhinos across African Range States (Climate, Environment, Infrastructure and Livelihoods Professional Evidence and Applied Knowledge Services (CEIL PEAKS), 2013).

17
rate decreased from 2010 to 2012 to 0.9% per annum.42 While still growing, this significant decrease in
rate indicates the pressures of poaching.
3.2.2 Impact of Poaching on Rhino Populations
From the early 1990s to 2007, rhino poaching was at a relatively low rate, which allowed for the
recovery and growth of rhino populations across the continent. From 2002 to 2005, an 56 rhinos were
illegally killed on the African continent. And from 1990 to 2006 an average of 15 rhinos were killed
annually.43 In some countries with targeted repopulation programmes, maximum growth rates were
achieved. After 2007, the annual number of rhinos illegally poached for their horn soared, in particular,
rhinos in Zimbabwe were hit hard as the country entered a state of economic and political turmoil. Annual
rhino poaching figures have continued to increase year after year jumping from 201 in 2009 to 745 in 2012
and 1090 in 2013.44 In preparation for the CITES COP15, the IUCN’s Species Survival Commission (SSC)
African Specialist Group estimated that between 2010 and 2011 rhino poaching increased 43%
representing a loss of 3% of the African rhino population.45
Table 1 Poaching Statistics from the IUCN African Rhino Specialist Group
Region 2006 2007 2008 2009 2010 2011 2012 2013 2014
African Continent 60 62 262 201 426 520 745 1090
South Africa 36 13 83 122 133 448 668 1004 1215
While poaching is occurring throughout the continent, few countries other than South Africa report
statistics on illegally killed rhinos. South Africa has sustained the largest number of poaching incidents and
is home to the overwhelming majority (85%) rhino population.46 In 2014, 1,215 rhinos were illegally
poached representing an increase of 21% from the previous year where 1,004 rhinos were poached.47
42 Sarah Standley and Richard Emslie, Population and Poaching of African Rhinos across African Range States Ibid.
43 Milliken, Illegal Trade in Ivory and Rhino Horn: An Assessment Report to Improve Law Enforcment under Wildlife TRAPS Project.
44 Paul De Hert, Pieter Paepe, and Henk Griffioen, “Europees milieustrafrechtarrest minder voor nationale strafbevoegdheden,” 144, June 14, 2006.
45 IUCN African Rhino Specialist Group, CITES Rhino Report for Bangkok COP16 (COP16, 2013), http://www.rhinos.org/professional-resources/iucn-african-rhino-specialist-group.
46 Save the Rhino, “Poaching Crisis in South Africa,” 2015, http://www.savetherhino.org/rhino_info/thorny_issues/poaching_crisis_in_south_africa.
47 Ibid.

18
Figure 4 Recorded number of rhinos poached annually in South Africa
Source: South Africa Department of Environmental Affairs. (2015) Available online:
http://www.savetherhino.org/rhino_info/poaching_statistics
Figure 5 Rhino population increase for Africa between 2007 and 2012 (Data from IUCN SSC AfRSG)
Source: Sarah Standley and Richard Emslie (2013), Population and Poaching of African Rhinos across
African Range States. Climate, Environment, Infrastructure and Livelihoods Professional Evidence and
Applied Knowledge Services (CEIL PEAKS).

19
Reported poaching rates (% of poached rhinos per year compared to total population) of rhino
between 2006-2010 are as follows: South Africa: 3.99%, Kenya 6.47%, in Namibia 0.18%, Zimbabwe
44.52%. During this period death rates exceeded birth rates in Kenya and, dramatically, in Zimbabwe. In
2010, in South Africa the poaching rate was 1.61%; in Kenya 2.29%, in Namibia 1.61 and in Zimbabwe
6.24%. Populations of rhino therefore seem to still be increasing in South Africa, Namibia, and Kenya
despite 2010 poaching levels. However, current poaching rates in South Africa and Kenya are approaching
levels that would lead to population losses. If poaching levels increase at the level they have in consecutive
years of +34% to +46% a year, deaths will exceed births as early as 2015 and 2016.
Box 1: Zimbabwe: Case Example of Overharvesting and Population Collapse 2006-2009
Between 2006 and 2009, rhino poaching in Zimbabwe reached unsustainable levels fueled by
political and economic instability in the country. As of 2007, the number of illegally poached rhino
overtook the annual birth rate leading to a precipitous decline in the overall population of both black
and white rhino. From 2006 to 2011, the reported number of poached rhino as a percentage of the
population (2010) reached 44.5%. Concerted conservation efforts and the abatement of civil unrest
within the country led to a decrease in poaching levels after 2010; however, rhino poaching as a
percentage of the population remains very high at 6.46%.
Source: Sarah Standley and Richard Emslie (2013), Population and Poaching of African Rhinos across African Range States
(Climate, Environment, Infrastructure and Livelihoods Professional Evidence and Applied Knowledge Services (CEIL PEAKS).
3.2.3 Conclusions for the Economic Assessment
Again we distinguish between poaching levels that reduce the population and poaching levels that only
reduce the increase in population which could have been expected without poaching. We use the period
2006-2014, due to the availability of data.
South Africa: For 2006-2014 3,827 Rhinos were poached which reduced the overall population
growth, but did not lead to a reduced population. Only in 2013 and 2014 (more than a 1,000
animals per year) was the overall poaching close to the level where a population decrease could be
expected.
Namibia: Only five animals were poached from 2006-2012, which did not lead to any reduction in
population.
Kenya: 101 animals were poached between 2006-2012, which reduced the increase in population
but did not lead to a population decrease.
Zimbabwe: As mentioned above due to internal strife between 2006-2012, 378 animals were
poached. The population decreased during that time by 67 animals or 8% of the population.
4 Qualitative and Quantitative Impacts of Illegal Rhino
and Elephant Poaching
As outlined in chapter 2 the quantification of impacts is done on the basis of the economic value of the
wildlife tourism and game preserve business for the African economies and on an estimate for potential
economic gains of rhinos and elephants without poaching.
20
4.1 Quantifiable Social and Economic Impacts
We have calculated in chapter 3 the amount of poaching of rhinos and elephants that happened in the
past. The following chapter undertakes to estimate an economic value for that amount of poaching based
on methodologies:
1. Unsustainable poaching levels that lead to a decrease in population endanger the population as a
whole and with that the whole income stream of wildlife tourism and game preserves. Maintaining
that level of poaching in the long term will lead to a loss of that income stream. We estimate the
loss of capital that is caused by this unsustainable poaching level.
2. But even levels of poaching that do not reduce population levels rob the African economy of a
potential source of legal income. In a world without illegal poaching, African countries could use
the population surplus to fund their spending on wildlife preservation, when the level of desired
population is reached.
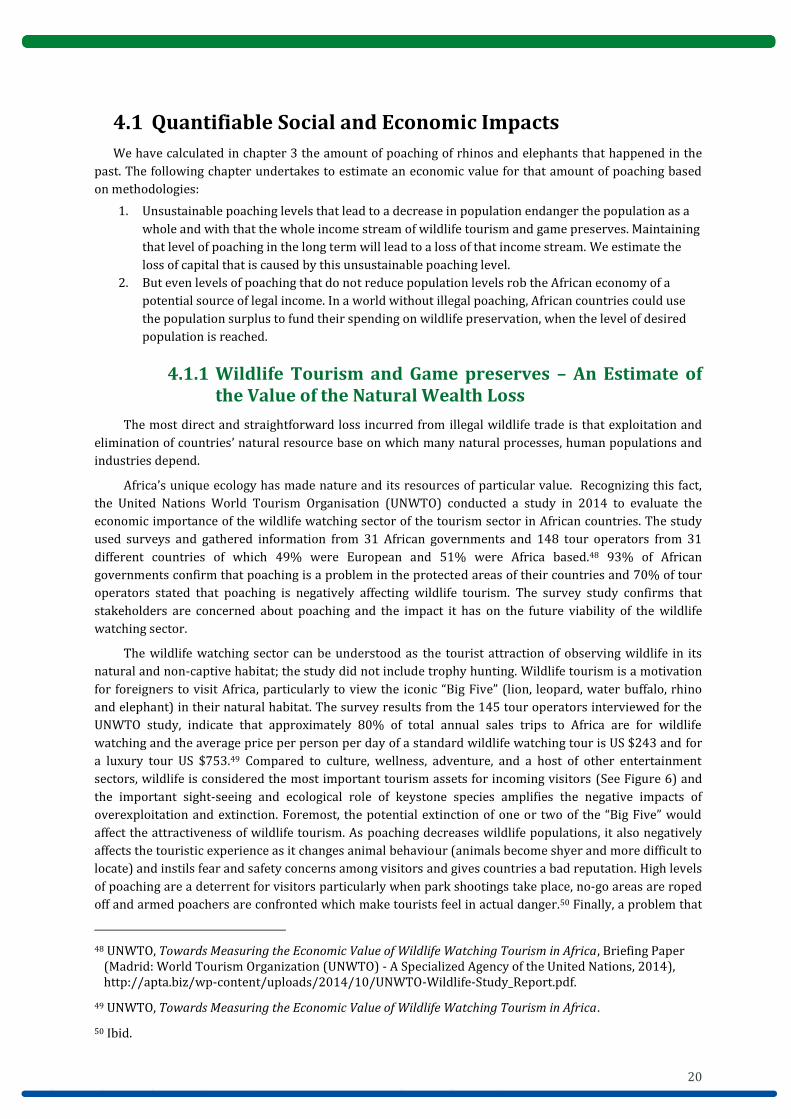
4.1.1 Wildlife Tourism and Game preserves – An Estimate of the Value of the Natural Wealth Loss
The most direct and straightforward loss incurred from illegal wildlife trade is that exploitation and
elimination of countries’ natural resource base on which many natural processes, human populations and
industries depend.
Africa’s unique ecology has made nature and its resources of particular value. Recognizing this fact,
the United Nations World Tourism Organisation (UNWTO) conducted a study in 2014 to evaluate the
economic importance of the wildlife watching sector of the tourism sector in African countries. The study
used surveys and gathered information from 31 African governments and 148 tour operators from 31
different countries of which 49% were European and 51% were Africa based.48 93% of African
governments confirm that poaching is a problem in the protected areas of their countries and 70% of tour
operators stated that poaching is negatively affecting wildlife tourism. The survey study confirms that
stakeholders are concerned about poaching and the impact it has on the future viability of the wildlife
watching sector.
The wildlife watching sector can be understood as the tourist attraction of observing wildlife in its
natural and non-captive habitat; the study did not include trophy hunting. Wildlife tourism is a motivation
for foreigners to visit Africa, particularly to view the iconic “Big Five” (lion, leopard, water buffalo, rhino
and elephant) in their natural habitat. The survey results from the 145 tour operators interviewed for the
UNWTO study, indicate that approximately 80% of total annual sales trips to Africa are for wildlife
watching and the average price per person per day of a standard wildlife watching tour is US $243 and for
a luxury tour US $753.49 Compared to culture, wellness, adventure, and a host of other entertainment
sectors, wildlife is considered the most important tourism assets for incoming visitors (See Figure 6) and
the important sight-seeing and ecological role of keystone species amplifies the negative impacts of
overexploitation and extinction. Foremost, the potential extinction of one or two of the “Big Five” would
affect the attractiveness of wildlife tourism. As poaching decreases wildlife populations, it also negatively
affects the touristic experience as it changes animal behaviour (animals become shyer and more difficult to
locate) and instils fear and safety concerns among visitors and gives countries a bad reputation. High levels
of poaching are a deterrent for visitors particularly when park shootings take place, no-go areas are roped
off and armed poachers are confronted which make tourists feel in actual danger.50 Finally, a problem that
48 UNWTO, Towards Measuring the Economic Value of Wildlife Watching Tourism in Africa, Briefing Paper (Madrid: World Tourism Organization (UNWTO) - A Specialized Agency of the United Nations, 2014), http://apta.biz/wp-content/uploads/2014/10/UNWTO-Wildlife-Study_Report.pdf.
49 UNWTO, Towards Measuring the Economic Value of Wildlife Watching Tourism in Africa.
50 Ibid.

21
this study has not valuated but that is extremely important is the fact that carrying out anti-poaching
measures in protected areas is a huge financial burden. Efforts to thwart poaching rely on extensive
monitoring by rangers and veterinarians, tagging, observation and security of animals, relocation and
rehabilitation in cases of injury and death.
Figure 6 Importance of Wildlife and Wildlife Related Sectors for Visitors
Source: UNWTO, Towards Measuring the Economic Value of Wildlife Watching Tourism in Africa.
The economic impacts incurred from a destabilised wildlife tourism sector would also have substantial
negative effects on national GDP and employment in source countries. The Word Travel and Tourism
Council (WTTC) has provided data on the direct and indirect contribution of tourism to GDP and
employment. Indirectly, wildlife tourism provides many employment opportunities, particularly for poor
and rural populations who are the most vulnerable to marginalisation, food insecurity and extreme
poverty. Employment from tourism spurs the development of restaurants, hotels/guesthouses, guides and
also indirect financial benefits from the redistribution of protected area fees and community funds.
Figure 7 Direct and Indirect Contribution of Tourism on GDP and Employment in Source
Countries
South Africa51
GDP: Direct Contribution: 3.0% of GDP (ZAR103.2bn) in 2013 and is forecast to rise by 3.9% per
annum from 2014-2023
GDP: Indirect Contribution: 9.5% of GDP (ZAR323bn) in 2013, forecast to rise 9.8% of GDP
51 World Travel and Tourism Council, Travel and Tourism: Economic Impact 2014: South Africa (WTTC, 2014), http://www.wttc.org/-/media/files/reports/economic%20impact%20research/country%20reports/south_africa2014.pdf.

22
Employment (Direct Contribution):645,500 jobs (4.6 % of total employment)
Employment (Indirect Contribution): 1, 404,000 jobs (10.1% of total employment)
Kenya52
GDP: Direct Contribution: 4.8 of GDP (KES183.4bn) in 2013 and is forecast to rise by 5.2% per
annum from 2014-2023
GDP: Indirect Contribution: 12.1% of GDP (KES462.8bn) in 2013, forecast to rise 5.2% of GDP
Employment (Direct Contribution): 226,500 (4.1 % of total employment)
Employment (Indirect Contribution): 589,500 jobs (10.6% of total employment)
Zimbabwe53
GDP: Direct Contribution: 5.6 of GDP (USD 420.1mn) in 2013 and is forecast to rise by 6.1% per
annum from 2014-2023
GDP: Indirect Contribution: 11.4% of GDP (USD857.9mn) in 2013, forecast to rise 6.0% of GDP
Employment (Direct Contribution): 42,500 (3.7 % of total employment)
Employment (Indirect Contribution): 98,500 jobs (8.2% of total employment)
Namibia54
GDP: Direct Contribution: 3.0 of GDP (NAD3.126-5mn) in 2013 and is forecast to rise by 9.2% per
annum from 2014-2023
GDP: Indirect Contribution: 14.8% of GDP (NAD15,302.6mn) in 2013, forecast to rise 7.6% of GDP
Employment (Direct Contribution): 24,000 (4.5 % of total employment)
Employment (Total Contribution): 103,500 jobs (19.4% of total employment)
52 World Travel and Tourism Council, Travel and Tourism: Economic Impact 2014: Kenya (WTTC, 2014), http://www.wttc.org/-/media/files/reports/economic%20impact%20research/country%20reports/kenya2014.pdf.
53 World Travel and Tourism Council, Travel and Tourism: Economic Impact 2014: Zimbabwe (WTTC, 2014), http://www.wttc.org/-/media/files/reports/economic%20impact%20research/country%20reports/zimbabwe2014.pdf.
54 World Travel and Tourism Council, Travel and Tourism: Economic Impact 2014: Namibia (WTTC, 2014), http://www.wttc.org/-/media/files/reports/economic%20impact%20research/country%20reports/namibia2014.pdf.

23
Figure 8 Value of Travel and Tourism to African Economies: Sector Comparison
Source: http://www.wttc.org/-/media/files/reports/benchmark%20reports/regional%20results/2013%20africa%20summary.pdf.
Figure 9 Value of Travel and Tourism to the Generation of Employment Compared to other
Industries
Source: http://www.wttc.org/-
/media/files/reports/economic%20impact%20research/regional%20reports/africa2014.pdf
The total value of the wildlife trade
The following table summarises the economic losses caused by poaching above the level of replacement.
The following simplifying assumptions for the estimation of the total value are taken:

24
Wildlife watching represents 80% of the total annual sales of trips to Africa and sales are
increasing.55 The number represents the tour operators participating in the UNWTO study and it
probably produces an overestimate for countries like South Africa with other tourist attractions
and an underestimate for other countries.
The overall value of a capital asset like the wildlife of Africa is 20-30 times the annual income
stream it provides. This estimate is in line with the usual assumptions on other long term capital
assets.
An extinction of one of the “big five” animal species would reduce the wildlife tourism by 20%.
Table 2 Valuation Estimates of Extinction of Rhinos in Four Countries
Rhino South Africa Namibia Kenya Zimbabwe
Annual (direct and indirect) tourism income € 24,7 billion € 1,2 billion €4.8 billion €1,4 billion
Annual wildlife tourism income56 €19.7 billion € 0,9 billion €3,8 billion €1.1 billion
Total capital value of wildlife tourism income
(20-30 times annual income)
€395-592 billion €18.7- 28 billion €76.8-115.2 billion €22.66-33.8
billion
Loss of extinction of all rhinos (20% of wildlife
tourism income)
€79- 118 billion €3.7-5.6 billion €15.4-23 billion €4.5-6.8
billion
Value of 1 % reduction in rhino population €0.79-1.18 billion €0,037-0,056
billion
€0.15-0.23 billion €0.045-0.068
billion
*National currency figures converted into € using with exchange rates of the 2nd March 2015.
Table 3 Valuation Estimates of Extinction of Elephants
Elephants All African range states
Annual (direct and indirect) tourism income €74.1 billion
Annual wildlife tourism income57 €59.3 billion
Total capital value of wildlife tourism income (20-30 times annual income) €1,185-1,778 billion
Loss of extinction of all elephants (20% of wildlife tourism income) annual €237-356 billion
Value of 1% reduction in elephant population €2.4 - 3.6 billion
The figure above is overall conservative as it estimates the total capital value for tourism of each elephant
to €500,000 to €800,000. A recent study estimated that the value of a live elephant for tourism purposes is
USD 1,607,624 throughout the course of its life.58
55 UNWTO, Towards Measuring the Economic Value of Wildlife Watching Tourism in Africa.
56 Wildlife watching represents 80% of total annual sales of trips to Africa (gathered from 148 tour operators)
57 Wildlife watching represents 80% of total annual sales of trips to Africa (gathered from 148 tour operators)
58 Brandford, Dead or Alive? Valuing an Elephant.
25
4.1.2 Trophy Hunting/Ranching:
Another branch of wildlife tourism is the private ranching and trophy hunting business. Milliken and
Shaw (2013) identify ranching as being a central component for the recovery and growth of rhino
populations. They also explain that ranching provides an incentive for land owners and communities to
keep and protect wildlife stating that what was once a mainly public industry has become a booming
private one where wildlife is harvested, hunted and traded. The partial privatisation of the wildlife
industry has also helped to professionalise the industry in aspects such as translocation, capture,
immobilization and veterinary care which has improved standards for the entire industry (public and
private).
Poaching is affecting this industry in two ways. Firstly, the cost of measures to keep animals protected
and safe from poachers makes keeping rhino and elephant uneconomic. Secondly, ranchers that sell
licenses to tourists to hunt big game lose the revenue they would make from the sale of the hunt of the
animal. In 2014, the amount an individual was willing to pay to hunt a rhino was USD 350,000 (€
312,640).59
Looking on websites offering trophy hunting services for elephant such as AfricaSkyHunting in South
Africa, the potential revenue earned is between 25,000 and 35,000 USD (€ 22,330 to €31,264).60 The
poaching crisis is a threat to this industry as it is ever more expensive for public and private owners alike
to protect their animals from poaching.61
4.1.3 Example for the value of a Rhino: Namibia and Community Led Conservation
In Namibia a community managed approach to wildlife conservation has led to great success in
nationwide conservation of land and the rehabilitation of several once endangered species including the
critically endangered black rhino. It started when an NGO called Integrated Rural Development and Nature
Conservation (IRDNC) paid local communities to protect wildlife. The initial success of this approach led
the newly independent government of Namibia in the 1990s to turn over ownership of wildlife to
communal conservancies. The main idea was to create a situation that motivated villagers to manage and
profit from the conservation of land and wildlife that existed already existed in the country.
Trophy hunting has become an important approach of communal conservancies because of its low level
of initial investment especially compared to setting up wildlife lodges and touristic reserves.62 Trophy
hunting has been an easy and lucrative incentive for communities to maintain and benefit from wildlife.
Each year the Namibian Ministry of Environment and Tourism sets limits to hunting endangered species
and for example has an annual quota whereby five black rhinos can be sold for trophy hunting. The price
for hunting a black rhino in 2014 was USD 350,000, of which all the money goes into a trust for rhino
protection: paying for game rangers and anti-poaching protection measures such as tagging, implantation
of chips, and capture/relocation.63 In 1997 the Namibian government established the Game Products Trust
59 Richard Conniff, “A Trophy Hunt That’s Good for Rhinos,” The New York Times, January 20, 2014, http://www.nytimes.com/2014/01/21/opinion/a-trophy-hunt-thats-good-for-rhinos.html.
60 “African Sky Hunting,” Company Website, (2015), http://www.africanskyhunting.co.za/trophies/elephant-hunting.html.
61 Expenses include aspects like anti-poaching and monitoring patrols, ranger salaries, technology such as micro chips, drones and transport such as helicopters and vehicles.
62 N. Leader-Williams et al., “Trophy Hunting of Black Rhino Diceros Bicornis: Proposals to Ensure Its Future Sustainability,” Journal of International Wildlife Law & Policy 8, no. 1 (January 1, 2005): 1–11, doi:10.1080/13880290590913705.
63 Conniff, “A Trophy Hunt That’s Good for Rhinos.”

26
Fund (GPTF) which transfers money from wildlife trophy hunting industry to conservation. Tourism and
rhino hunting concessions provides 70-80% of the Fund’s revenue.64
Currently some 20% of Namibia is community owned and managed and 44% of the country’s land
surface is under some kind of environmental protection.65 While poaching of rhino and elephant have
soared in neighbouring South Africa, Namibia has maintained very low levels of poaching. Only two black
rhinos were poached in 2013 and the population has enjoyed stable growth from 1,435 individuals in 2007
to 1,750 in 2012. Other species once threatened have also made impressive come backs in Namibia using
the hunting and community management approach. For example, the number of elephants has increased
from 15,000 in 1995 to 20,000 in 2013. The number of zebra has increased from 1,000 in 1982 to 27,000 in
2013.66
Since community managed conservancies provide local individuals with jobs as rangers and guards as
well as business opportunities for other tourist activities (e.g. handicrafts, indigenous artisanal, bed and
breakfasts, restaurants, transportation services etc), there is a strong build up of social pressure and
stigma against illegal poaching due to the very fact that the livelihoods and income of the communities are
intrinsically tied to the protection and calculated harvest of wildlife for which the proceeds are shared
collectively. The GPTF has also created other mechanisms that ensure that communities opt to protect
wildlife rather than exploit or eliminate it. For example, for communities that experience economic losses
to wildlife, for instance, the killing of cattle or infrastructure, the GPTF will provide remuneration.
Community based resource management is an approach that puts wildlife conservation in the hands of
local communities.
4.1.4 Qualitative Impacts of Poaching committed by Organised Criminal Groups
Rhino and elephant poaching is often associated with the immediate environmental impacts on
biodiversity and conservation of an endangered species, but it also has important security and socio-
economic impacts. The financial value of illicit trade has made wildlife trafficking the fifth most lucrative
type of illegal trade in the world and is comparable to other types of illegal trade such as drug-smuggling,
weapons, counterfeit goods and human trafficking.67 In a literature review of wildlife crime and security
implications, Chatham House cited numerous studies that detailed the involvement of organized criminal
groups and armed non-state actors in wildlife trade of ivory and rhino as well as other goods such as tiger.
In this overview of existing studies, wildlife trafficking was found to have strong stunting impacts on
source countries by undermining institutions and the rule of law, creating political and economic
instability and perpetuating conflict and violence (e.g. civil conflict, intrastate conflict and transnational
organized crime syndicates).68 Quantifying the cost (financially, socially, politically) of prolonged conflict in
a country is difficult but undeniably relevant in many cases where wildlife trafficking has played a role,
64 “Can Rhinos Profit from Trophy Hunting?,” Project: African Rhino, accessed March 9, 2015, http://africanrhino.org/2013/11/11/can-rhinos-profit-from-trophy-hunting/.
65 WWF, Communal Conservancies. Namibia’s Gift to the Earth., 2011, http://www.namibiatourism.com.na/uploads/file_uploads/Namibian_Conservation_Fact_Sheet_copy.pdf.
66 WWF, Communal Conservancies. Namibia’s Gift to the Earth.
67 Nigel South and Tanya Wyatt, Comparing Illicit Trades in Wildlife and Drugs: An Exploratory Study, Deviant Behavior (London, 2011), http://dx.doi.org/10.1080/01639625.2010.483162.
68 Jeremy Haken, Transnational Crime in the Developing World, Global Financial Integrity, 2011, http://www.gfintegrity.org/storage/gfip/documents/reports/transcrime/gfi_transnational_crime_web.pdf.

27
such as the Democratic Republic of Congo (DRC),69 the Central African Republic (CAR), Sudan and some
other countries. A 2014 United Nations Environmental Program report cites that ivory has been an
important source of income to militia groups in the DRC and CAR, and is one of the main sources of income
to the Lord’s Resistance Army (LRA) currently warring in the border region of South Sudan, CAR and DRC
and decimating elephant populations in those countries.70 Criminal networks, whether they are state
militias, rebels, terrorist organizations or organized criminal syndicates, benefit from weak institutions
and lawless environment and have an inherent interest to maintain such a state for their illegal operation.
As Jeremy Haken points out, illegal wildlife trade does “immeasurable structural damage to developing
economies by empowering forces which erode the capacity of the state.”71 Moreover, the long-term looting
of resources and perpetuation of violence and crime have repercussions that extend from economic
concerns to social ones that deeply effect the development trajectory of source countries.
Wildlife poaching and trafficking not only perpetuates state instability and institutional weakness in
source countries, it also exports security threats globally. The associated costs for the international
community are difficult to quantify in absolute terms but are clearly connected when looking at case by
case examples. According to Interpol and the U.S. State Department, several Islamic extremist groups have
used wildlife trafficking to fund their activities.72
5 Results and Conclusions
Overall the poaching of rhinos and elephants causes significant damage to African economies both by
taking away current and legal income opportunities for African economies and also by reducing the natural
capital on which all future income opportunities are based. Using the numbers developed in the paper, the
overall impact on those economies can be estimated in the following ways:
Table 4 Economic Value Lost Due to Elephant Poaching
Africa
Total population of Elephants in Africa 2010 500,000
Number of elephants poached 2010-2012 100,000
Lost potential legal income per Elephant €22,331 - €31,264
Total loss of potential legal income 2010-2012 € 2.23 billion – € 3.12 billion
Total loss of population 2010-2012 25.000 (5% of population)
Value of 1% population loss € 2,4 billion to € 3,6 billion
69 Civil conflict in the DRC has also led to mass poaching by militia and rebel groups contributing to atrocious and unabated violence since 1996 and elephant population decline by 50% between 1995-200669. Elephant poaching in the DRC is conducted by the Congolese army as well as armed non-state actor including Mai Mai rebel groups and the FDLR.
70 Agger, Kasper and Jonathan Hutson, ‘Kony’s Ivory: How Elephant Poaching in Congo Helps Support the Lord’s Resistance Army’, Enough Project (June, 2013)
71 Haken, Transnational Crime in the Developing World.
72 Lawson and Vines, Global Impacts of the Illegal Wildlife Trade: The Costs of Crime, Insecurity and Institutional Erosion.
28
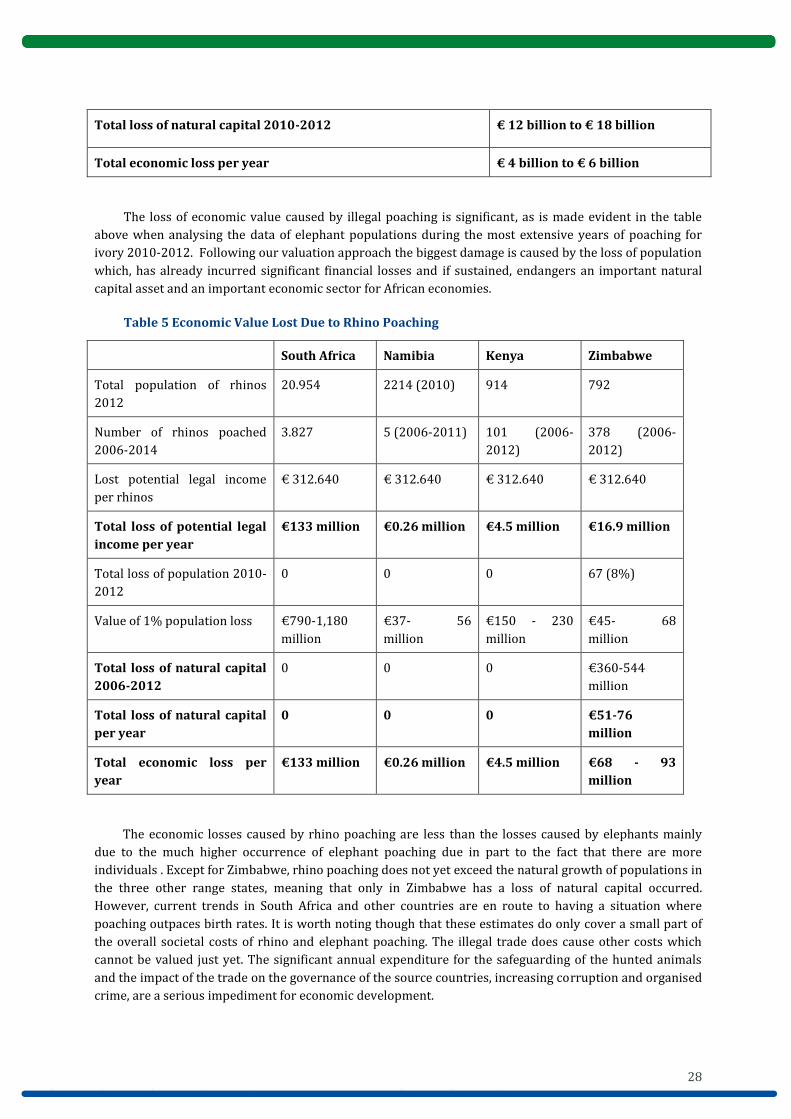
Total loss of natural capital 2010-2012 € 12 billion to € 18 billion
Total economic loss per year € 4 billion to € 6 billion
The loss of economic value caused by illegal poaching is significant, as is made evident in the table
above when analysing the data of elephant populations during the most extensive years of poaching for
ivory 2010-2012. Following our valuation approach the biggest damage is caused by the loss of population
which, has already incurred significant financial losses and if sustained, endangers an important natural
capital asset and an important economic sector for African economies.
Table 5 Economic Value Lost Due to Rhino Poaching
South Africa Namibia Kenya Zimbabwe
Total population of rhinos
2012
20.954 2214 (2010) 914 792
Number of rhinos poached
2006-2014
3.827 5 (2006-2011) 101 (2006-
2012)
378 (2006-
2012)
Lost potential legal income
per rhinos
€ 312.640 € 312.640 € 312.640 € 312.640
Total loss of potential legal
income per year
€133 million €0.26 million €4.5 million €16.9 million
Total loss of population 2010-
2012
0 0 0 67 (8%)
Value of 1% population loss €790-1,180
million
€37- 56
million
€150 - 230
million
€45- 68
million
Total loss of natural capital
2006-2012
0 0 0 €360-544
million
Total loss of natural capital
per year
0 0 0 €51-76
million
Total economic loss per
year
€133 million €0.26 million €4.5 million €68 - 93
million
The economic losses caused by rhino poaching are less than the losses caused by elephants mainly
due to the much higher occurrence of elephant poaching due in part to the fact that there are more
individuals . Except for Zimbabwe, rhino poaching does not yet exceed the natural growth of populations in
the three other range states, meaning that only in Zimbabwe has a loss of natural capital occurred.
However, current trends in South Africa and other countries are en route to having a situation where
poaching outpaces birth rates. It is worth noting though that these estimates do only cover a small part of
the overall societal costs of rhino and elephant poaching. The illegal trade does cause other costs which
cannot be valued just yet. The significant annual expenditure for the safeguarding of the hunted animals
and the impact of the trade on the governance of the source countries, increasing corruption and organised
crime, are a serious impediment for economic development.

29
From a purely macro-economic viewpoint the direct and indirect contribution of wildlife tourism to
economic growth and employment indicates the importance of this sector and also its potential to develop.
One of the main objectives of this report, however, was to go beyond citing the importance of the wildlife
watching sector and attempt to measure its economic value. So far there is very little available data for
such an analysis and this report relied primarily on the initial findings from the 2014 UNWTO study.
Economically elephants and rhino in a conserved and managed state are worth more than the immediate
price of their tusks and horns. In other words, their value over time, whether it be for wildlife watching
purposes or for carefully managed private ranching and hunting, has a more substantial value.
Moreover, the financial benefits tend to be more equitably shared in legal markets maintaining or
contributing to alternative sources of income and employment opportunities for communities or as the
case of Namibia illustrated, ranching and hunting when authorized through legal structures can be
redistributed to maintain those resources and communities.
References
“African Sky Hunting.” Company Website, 2015. http://www.africanskyhunting.co.za/trophies/elephant-hunting.html.
Agger, Kasper, and Jonathon Hutsom. Kony’s Ivory: How Elephant Poaching in Congo Helps Support the Lord’s Resistance Army. Enough Project, June2013.
Brandford, Rob. Dead or Alive? Valuing an Elephant. United Kingdom: The David Sheldrick Wildlife Trust, 2014. http://iworry.org/wp-content/uploads/2013/09/Dead-or-Alive-Final-LR.pdf.
“Can Rhinos Profit from Trophy Hunting?” Project: African Rhino. Accessed March 9, 2015. http://africanrhino.org/2013/11/11/can-rhinos-profit-from-trophy-hunting/.
Cheteni, Priviledge. “An Analysis of Antipoaching Techniques in Africa: A Case of Rhino Poaching.” Environmentla Economics 5 (2014).
Conniff, Richard. “A Trophy Hunt That’s Good for Rhinos.” The New York Times, January 20, 2014. http://www.nytimes.com/2014/01/21/opinion/a-trophy-hunt-thats-good-for-rhinos.html.
Elephant Database. “2012 Continental Totals,” 2013. http://www.elephantdatabase.org/preview_report/2013_africa/Loxodonta_africana/2012/Africa.
Emslie, Richard, Tom Milliken, and Bibhab Talukdar. African and Asian Rhinoceroses - Status, Conservation and Trade. A report from the IUCN Species Survival Commission (IUCN/SCC) African and Asian Rhino Specialist Groups and TRAFFIC to the CITES Secretariat pursuant to Resolution Conf. 9. 14 (Rev. CoP16). Bangkok, 2013. http://www.rhinos.org/professional-resources/iucn-african-rhino-specialist-group.
Environmental Investigation Agency. Made in China: How China’s Illegal Ivory Trade Is Causing a 21st Century African Elephant Disaster. Washington D.C., 2007. http://eia-global.org/images/uploads/Made_in_China_Report.pdf.
Guilford, Gwynn. “China’s Obsession with Rhino Horns Is Sending South African Rhino Deaths through the Roof.” Quartz, December 19, 2013. http://qz.com/159902/chinas-obsession-with-rhino-horns-is-sending-south-african-rhino-deaths-through-the-roof/.
———. “Why Does a Rhino Horn Cost $300,000? Because Vietnam Thinks It Cures Cancer and Hangovers.” The Atlantic, May 15, 2013. http://www.theatlantic.com/business/archive/2013/05/why-does-a-rhino-horn-cost-300-000-because-vietnam-thinks-it-cures-cancer-and-hangovers/275881/.
Haken, Jeremy. Transnational Crime in the Developing World. Global Financial Integrity, 2011. http://www.gfintegrity.org/storage/gfip/documents/reports/transcrime/gfi_transnational_crime_web.pdf.
IUCN. New Figures Reveal Poaching for the Illegal Ivory Trade Could Wipe out a Fifth of Africa’s Elephants over the next Decade. International News Release, December 2, 2013.

30
http://www.iucn.org/news_homepage/?14120/New-figures-reveal-poaching-for-the-illegal-ivory-trade-could-wipe-out-a-fifth-of-Africas-Elephants-over-next-decade.
IUCN African Elephant Specialist Group. 2013 Provisional African elephant status report. IUCN, 2013. www.elephantdatabase.org/pre view_report/2013_africa/Loxodonta_africana/ 2012/Africa.
IUCN African Rhino Specialist Group. CITES Rhino Report for Bangkok COP16. COP16, 2013. http://www.rhinos.org/professional-resources/iucn-african-rhino-specialist-group.
IUCN Red List. “Loxodonta Africana,” 2015. http://www.iucnredlist.org/details/12392/0.
Lawson, Katherine, and Alex Vines. Global Impacts of the Illegal Wildlife Trade: The Costs of Crime, Insecurity and Institutional Erosion. London: Chatham House, 2014. http://www.chathamhouse.org/sites/files/chathamhouse/public/Research/Africa/0214Wildlife.pdf.
Leader-Williams, N., S. Milledge, K. Adcock, M. Brooks, A. Conway, M. Knight, S. Mainka, E. B. Martin, and T. Teferi. “Trophy Hunting of Black Rhino Diceros Bicornis: Proposals to Ensure Its Future Sustainability.” Journal of International Wildlife Law & Policy 8, no. 1 (January 1, 2005): 1–11. doi:10.1080/13880290590913705.
Maisels, Fiona, Samantha Strindberg, Stephen Blake, George Wittemyer, and et al. “Devestating Decline of Forest Elephants in Central Africa.” PLoS ONE 8, no. 3 (2013). http://journals.plos.org/plosone/article?id=10.1371/journal.pone.0059469.
Milliken, Tom. Illegal Trade in Ivory and Rhino Horn: An Assessment to Improve Law Enforcement under the Wildlife Traps Project. A TRAFFIC Report. Cambridge UK: TRAFFIC International, 2014. http://www.usaid.gov/sites/default/files/documents/1865/W-TRAPS-Elephant-Rhino-report.pdf.
Milliken, Tom, and Jo Shaw. The South Africa-Vietnam Rhino Horn Trade Nexus: A Deadly Combination of Institutional Lapses, Corrupt Wildlife Industry Professionals and Asian Crime Syndicates. A TRAFFIC Report, 2012. http://www.traffic.org/species-reports/traffic_species_mammals67.pdf.
Nowell, Kristen. Species Trade and Conservation: Rhinoceroses. Assessment of Rhino Horn as a Traditional Medicine. A report prepared for the CITES Secretariat, April 2012. http://www.cites.org/eng/com/sc/62/E62-47-02-A.pdf.
Platt, John R. “How the Western Black Rhino Went Extinct | Extinction Countdown, Scientific American Blog Network.” Scientific American, November 13, 2013. http://blogs.scientificamerican.com/extinction-countdown/2013/11/13/western-black-rhino-extinct/.
“Poachers Funding Al-Shabaab, Reveals KWS.” Horn Portal, 2013. http://horn.so/poachers-funding-al-shaba ab-reveals-kws.
“Price of Ivory in China Triples.” The Guardian, July 3, 2014. http://www.theguardian.com/environment/2014/jul/03/price-ivory-china-triples-elephant.
Ratchford, Marina, Beth Allgood, and Paul Todd. Criminal Nature: The Global Security Implications of Illegal Wildlife Trade 2013. International Fund for Animal Welfare. Accessed February 11, 2015. http://www.ifaw.org/sites/default/files/ifaw-criminal-nature-UK.pdf.
“Rhinos Face Extinction by 2020, Wildlife Experts Warn | Al Jazeera America.” Accessed March 13, 2015. http://america.aljazeera.com/articles/2014/4/14/rhinos-face-extinctionby2020.html.
Safina, Carl. “Op-Ed Contributor--Blood Ivory.” The New York Times, 2013. http://www.nytimes.com/2013/02/12/opinion/global/blood-ivory.html.
Save the Rhino. “Poaching Crisis in South Africa,” 2015. http://www.savetherhino.org/rhino_info/thorny_issues/poaching_crisis_in_south_africa.
———. “Rhino Population Figures.” Save The Rhino, 2012. http://www.savetherhino.org/rhino_info/rhino_population_figures.
Shaw, Jo. “Poaching Crisis in South Africa: The South African Situation.” The Horn. 2011.
South, Nigel, and Tanya Wyatt. “Comparing Illicit Trades in Wildlife and Drugs: An Exploratory Study.” Deviant Behaviour, June 16, 2011. http://www.wildlife1.org/phocadownload/2011.south.etal.comparing%20illicit%20trades.wildlif

31
e.drugs.pdf.
Standley, Sarah, and Richard Emslie. Population and Poaching of African Rhinos across African Range States. Climate, Environment, Infrastructure and Livelihoods Professional Evidence and Applied Knowledge Services (CEIL PEAKS), 2013.
———. The Trend in Rhino Species Numbers. Climate, Environment, Infrastructure and Livelihoods Professional Evidence and Applied Knowledge Services (CEIL PEAKS) Programme. Practical Action Consulting and DFID, 2013.
TRAFFIC. Rhinos in Crisis--Poaching and Illegal Trade Reach Highest Levels in over 20 Years. TRAFFIC, 2013. . www.traffic.org/home/2013/ 1/15/rhinos-in-crisis-poaching-and-illegal-trade- reach-highest-le.html.
———. UN Recognizes Wildlife Crime as Threat to Rule of Law. TRAFFIC, 2012. . http://www.traffic.org/home/2012/9/ 25/un-recognizes-wildlife-crime-as-threat-to- rule-of-law.htm.
UNEP. Elephants in the Dust: The African Elephant Crisis. A Rapid Response Assessment. United Nations Environmental Programme, 2013. http://www.unep.org/pdf/RRAivory_draft7.pdf.
UNWTO. Towards Measuring the Economic Value of Wildlife Watching Tourism in Africa. Briefing Paper. Madrid: World Tourism Organization (UNWTO) - A Specialized Agency of the United Nations, 2014. http://apta.biz/wp-content/uploads/2014/10/UNWTO-Wildlife-Study_Report.pdf.
US House Committee on Natural Resources. Poaching American Security: Impacts of Illegal Wildlife Trade. Statement of John M. Sellar, secretariat of the Convention on International Trade in Endangered Species of Wild Fauna and Flora-CITES. 110th Cong. 2nd Sess., March 5, 2008.
Wittemyer, George, Josoph Northrup, Julian Blanc, Iain Douglas-Hamilton, Patrick Omondi, and Kenneth Burnham. “Illegal Killing for Ivory Drives Global Decline in African Elephants” 111, no. 36 (2014). http://www.pnas.org/content/111/36/13117.full.pdf+html.
World Travel and Tourism Council. Benchmarking Travel and Tourism in Africa: How Does Travel and Tourism Compare to Other Sectors?. WTTC, 2013. http://www.wttc.org/-/media/files/reports/benchmark%20reports/regional%20results/2013%20africa%20summary.pdf.
———. Travel and Tourism: Economic Impact 2014: Kenya. WTTC, 2014. http://www.wttc.org/-/media/files/reports/economic%20impact%20research/country%20reports/kenya2014.pdf.
———. Travel and Tourism: Economic Impact 2014: Namibia. WTTC, 2014. http://www.wttc.org/-/media/files/reports/economic%20impact%20research/country%20reports/namibia2014.pdf.
———. Travel and Tourism: Economic Impact 2014: South Africa. WTTC, 2014. http://www.wttc.org/-/media/files/reports/economic%20impact%20research/country%20reports/south_africa2014.pdf.
———. Travel and Tourism: Economic Impact 2014: Zimbabwe. WTTC, 2014. http://www.wttc.org/-/media/files/reports/economic%20impact%20research/country%20reports/zimbabwe2014.pdf.
WWF. “African Elephants.” African Elephants, 2014. http://wwf.panda.org/what_we_do/endangered_species/elephants/african_elephants/.
———. “African Rhinos,” 2014. http://wwf.panda.org/what_we_do/endangered_species/rhinoceros/african_rhinos/.
———. Communal Conservancies. Namibia’s Gift to the Earth., 2011. http://www.namibiatourism.com.na/uploads/file_uploads/Namibian_Conservation_Fact_Sheet_copy.pdf

Annex A
We also used the Environmental Valuation Reference Inventory (EVRI) a searchable database of
empirical studies on the economic value of environmental benefits and human health effects to select
several potentially relevant studies that are listed in Annex 1. From the EVRI database, one study
supported the idea that the value of an elephant alive for nature watching purposes is significantly higher
than its value accrued illegally through the sale of its ivory. The 2008 report by Scholes and Mennell found
that estimates for the total value of African elephants per annum to South Africa ranged from US$4.1-77.2
million from the consumptive value of ivory to US$2.2 billion from non-use values. A 2005 study by
Lindsey et al. on endangered wild dogs found that the revenue brought in through ecotourism by visitors
specially interested in seeing this species far offset the costs of conservation plans to maintain them.
Finally a study on the economic touristic value of gorilla for Uganda found that the economic value of
gorilla tourism was estimated at $7.8-$34.3 million depending on the discount rate used. Our results are
therefore broadly in line with similar endeavours.
Literature Review by EVRI
Title: “A Recreational Demand Model of Wildlife-Viewing Visits to the Game Reserves of the KwaZulu-Natal
Province of South Africa” (2000)
Key: Value of wildlife viewing/reserves, South Africa
Estimated (Service Flow) Values:
The nested multinomial logit model provided a better fit to the data, so it is used for the welfare estimations. Table 1 reports the per trip welfare values for the loss of the game reserves of KwaZulu-Natal. The average household would suffer welfare losses of $49.71 per trip from the removal of Hluhluwe, while the loss from Mkuzi would be only about $18.67 (1995 U.S. Dollars). Table 1 also presents average per trip values for the loss of access to both Hluhluwe and Umfolozi. The value for the loss of both reserves simultaneously ($105.55) is considerably higher than the sum of the loss of both reserves individually ($80.18). This result illustrates the importance of substitution and the benefits of using a model that allows for such effects. If both are removed, the substitution possibilities are considerably diminished.
Title: "The Economic Returns to Wildlife Management in Southern Africa, in the Valuing the Environment
in Developing Countries: Case Studies, edited by David Pearce, Corin Pearce and Charles Palmer" (2002)
Key: Botswana, Land and Animals
Estimated (Service Flow) Values:
Table 1 shows the financial and economic worth of eight typical wildlife/rangeland use enterprises in Botswana. Of the eight, crocodile farming generated the largest net present value (NPV) of 2.56 million pula (1 Botswana pula = 0.47 USD or 1.34 South African rand) per square km. of land (at 6% over ten years, 1991 prices) followed by ostrich farming and wildlife viewing. Table 2 shows the total economic value and contribution of each of the different wildlife use and livestock production to the national income per annum. The non-consumptive wildlife uses in particular Wildlife viewing generated a net value added of 92.52 million pula, about 78% of the total GVA from wildlife use and livestock production activities.

Title: "The Potential Contribution of Ecotourism to Africa Wild Dog Lycaon pictus Conservation in South
Africa" (2005)
Key: Economic value of endangered species (African wild dog), South Africa
Estimated (Service Flow) Values:
Table 1 gives the estimated mean willingness to pay values of tourists for the opportunity to improve their chances of viewing the endangered African wild dog. Table 2 and 3 lists the net present values of conservation associated with the Kruger National Park, nature reserves and ranchland populations. The results for both nature reserves and ranchland are given under various prey compensation schemes where different costs arise when all prey is killed, half the prey is killed and no prey is killed. As well, costs for nature reserves were estimated based on whether adequate wild dog fencing was in place. All values are in 2002 US $ (ZAR in parentheses). 2002 US$/ZAR exchange rate is 1$=R10.99.
"The Existence Value of Biodiversity in South Africa: How Interest, Experience, Knowledge, Income and
Perceived Level of Threat Influence Local Willingness to Pay" (2003)
Key: Willingness of communities to pay for conservation
Estimated (Service Flow) Values:
Overall, a mean willingness to pay of US $10.4 ($0.6 - $195.2) was found for nature conservation in South Africa. Extrapolation to 76% (% WTP contribution towards biodiversity conservation) of Western Cape households (1.06 million) provides an estimate of $ 8 378 240 per year for nature conservation. Based on data obtained through the dichotomous choice questions, overall estimated average willingness to pay for reduced climate change impacts is $36.7. The mean WTP based on the climate change open-ended question was $27. The extrapolated estimate 1.06 million Western Cape households are between $21 and $39 million. Table 1 gives the estimated Western Cape population WTP values for biodiversity in the 7 biomes.
Title: "Biodiversity and Nature-Based Tourism at Forest Reserves in Uganda" (2001)
Key: Value of biodiversity, forests, birds, Uganda
Estimated (Service Flow) Values:
Based on the calculated mean optimal entrance fee of $47 (standard deviation = 2.28, range = 37.5 - 62), the annual average revenue to the Mariba Forest Reserve was estimated to be $29,919 (standard deviation = 3,386, range = 12,198 - 25,196). The number of bird species was a strong determinant of revenue. For 20 species of birds seen, the revenue was $18,032 (standard deviation = 2,346, range = 12,198 - 25,196). For 80 species of birds seen the revenue was $40,423 (standard deviation = 4,287, range = 27,662 - 52,158). These values correspond to $0.60 to $1.35 per hectare. All values in 2001 $US.
Title: "Can local communities in Zimbabwe be trusted with wildlife management?: Evidence from
contingent valuation of elephants” (2009)
Key: endangered species, elephants, Zimbabwe
Estimated (Service Flow) Values:
The median WTP for the preservation of 200 elephants is ZW$260 (US$4.73) for respondents who consider elephants a public good while the same figure is ZW$137 (US$2.49) for those who consider elephants a public bad and prefer translocation. The preservation of 200 elephants yields an annual net worth of ZW$10,828 (US$196) to CAMPFIRE households. The majority of households (62%) do not support elephant preservation
Title: The Economic Value of Congo Basin Protected Areas Goods and Services (2011)
Key: Cameroon, Central African Republic, Democratic Republic of Congo, Equatorial Guinea, Gabon,
Republic of Congo

Estimated (Service Flow) Values:
Total economic value was estimated to be $603,468,014,907. Direct use values were estimated to be $13,884,954; indirect use values total $589,532,157,606; and option, existence, and bequest values are estimated to be $50,903,301. (Values are in U.S. dollars).
Title: "The Economic Value of Elephants, in the Assessment of South African Elephant Management: A
Scientific Assessment of South Africa, edited by RJ Scholes and KG Mennell" (2008)
Key: Elephants, South Africa
Estimated (Service Flow) Values:
Table 1 provides a summary on valuation studies on African elephants (excluding studies from southern Africa) used in the study. The summary includes what has been valued, the valuation technique, the source, the values, and some remarks. Table 2 provides a summary of the main economic values of African elephants. Based on the economic values of elephants shown in Table 1, the value of an African elephant (in 2006/07 US$) was estimated to range from US$175 in terms of compensation costs to surrounding land owners to US$4,420 in terms of non-use values (mainly existence, bequest and experience value from European and American households). The total value of African elephants per annum was estimated to range from US$4.1-77.2 million from the consumptive value of ivory to US$2.2 billion from non-use values. The low value estimate of the direct consumptive use relative to its non-use and non-consumptive use values was expected since CITES included the African elephant in the list of endangered species in 1989. The non-use values were almost 30 times higher than the high-end estimation of the consumptive value of ivory.
Title: "Analysis of the Economic Significance of Gorilla Tourism in Uganda"Key: endangered species,”
(2000)
Key: Gorilla, Tourism
Estimated (Service Flow) Values:
Assuming an average consumer surplus of $196/tourist, the annual net economic benefit of gorilla tourism in the two parks at full capacity (8,760 tourists/year) is $1,716,960 (in US Dollars). Depending on the discount rates used, that annual net economic benefit value varies. At a 5% discount rate (conservation focused rate), the benefits account for $34,339,000 while at a 12% discount rate (Government of Uganda’s official social discount rate) those benefits amount to $14,308,000. At a 22% discount rate (private time preference rate), the benefits are of $7,804,000. Because tourists are not expected to go see individual gorillas, the value has been accounted for viewing groups of mountain gorillas. Thus, at a 0% discount rate (ultra-conservationists or preservationists), the value of one of three groups available for viewing in two parks is infinity. At discounts of rate of 5%, 12% and 22%, the values are respectively of $11.4 million per group, $4.8 million/group and $2.6 million/group. The total sale impact for the whole country was estimated at $8.8 million/year, net foreign exchange earning of about $4.4 million, employment income of about $3.9 million, government revenue through various taxes at $2.7 million and an employment opportunity of 946 person years all from direct tourist expenditures of $7.6 million (table 1). In addition an annual benefit flowing to the Uganda Wildlife Authority of $2.1 million and to local communities ($678,000) is estimated (table 2). The economic value of gorilla tourism was estimated at $7.8-$34.3 million depending on the discount rate used.