Embed Size (px)
Citation preview

Bank of Canada staff discussion papers are completed staff research studies on a wide variety of subjects relevant to central bank policy,
produced independently from the Bank’s Governing Council. This research may support or challenge prevailing policy orthodoxy. Therefore, the
views expressed in this paper are solely those of the authors and may differ from official Bank of Canada views. No responsibility for them should be attributed to the Bank.
www.bank‐banque‐canada.ca
Staff Discussion Paper/Document d’analyse du personnel 2017‐4
The Costs of Point‐of‐Sale Payments in Canada
by Anneke Kosse, Heng Chen, Marie‐Hélène Felt, Valéry Dongmo Jiongo, Kerry Nield and Angelika Welte

ISSN 1914-0568 © 2017 Bank of Canada
Bank of Canada Staff Discussion Paper 2017-4
March 2017
The Costs of Point-of-Sale Payments in Canada
by
Anneke Kosse,1 Heng Chen,2 Marie-Hélène Felt,2 Valéry Dongmo Jiongo,2
Kerry Nield2 and Angelika Welte2
1De Nederlandsche Bank Amsterdam, The Netherlands
and Currency Department
Bank of Canada Ottawa, Ontario, Canada K1A 0G9
2Currency Department
Bank of Canada Ottawa, Ontario, Canada K1A 0G9

i
Acknowledgements
This study would not have been possible without the contribution of various trade organizations, financial institutions, cash transportation companies, the Canadian Bankers Association and other individual market participants. The authors are also grateful to the Bank of Canada's Currency Department regional teams for their recruitment of respondents and advice. Many thanks to Ben Fung and Kim P. Huynh for their continuing support and valuable advice and guidance, to Céline Armstrong for her help on the communication aspects of the study, and to Jean-François Beaumont (Statistics Canada) and Alan Roshwalb (Ipsos Reid) for their expert comments and suggestions. We also thank our colleagues, especially Rene Bidart, Stan Hatko, Casey Jones, Emma McGuire, Gradon Nicholls, Zixin Nie, Rallye Shen, Kyle Vincent and Blair Williams for excellent research assistance, and Theodoros Garanzotis and Gerald Stuber for helpful comments and suggestions. We acknowledge Shelley Edwards, Jessica Wu and the Ipsos Reid team for their collaboration on this project. Finally, we thank our colleagues at other central banks for sharing their experiences and lessons learned: Terje Åmås (Norges Bank), Maria Tereza Cavaco (Banco de Portugal), David Emery (Reserve Bank of Australia), Geoffrey Gerdes (Federal Reserve Board), Nicole Jonker (De Nederlandsche Bank), Anders Mølgaard Pedersen (Danmarks Nationalbank), Björn Segendor (Sveriges Riksbank) and Chris Stewart (Reserve Bank of Australia). This paper was written when Anneke Kosse was seconded from De Nederlandsche Bank to the Bank of Canada.

ii
Abstract
This study provides insight into the costs of cash, debit card and credit card payments made at the point of sale in Canada in 2014. For each payment method, it examines the total resource costs, which capture the overall use of resources by society as a whole. Using extensive survey data from retailers, financial institutions and cash transportation companies as well as internal and external data sources, the results show that the resource costs of payments in Canada are non-negligible (0.78 per cent of GDP). Credit cards are most costly in terms of resource costs per transaction, while cash carries the highest resource costs per dollar transacted. Debit cards are the least costly, both in terms of costs per transaction and costs per dollar in sales. The study also demonstrates how the costs vary with transaction sizes. Considering the variable resource costs only, cash is found to be cheapest for transactions up to $6, while debit cards are the least costly for transactions larger than $6. The study also looks into the total private costs, which are the costs incurred by each stakeholder, thereby providing insight into how costs are affecting the use and acceptance of payment methods.
Bank topics: Bank notes; Financial institutions; Payment clearing and settlement systems; Digital currencies
JEL codes: D12, D23, D24, E41, E42, G21, L2
Résumé
Cette étude permet de mieux cerner les coûts des paiements effectués en argent comptant, par carte de débit et par carte de crédit dans les points de vente au Canada en 2014. Pour chacun de ces modes de paiement, nous examinons l’ensemble des coûts en ressources, qui rendent compte de l’utilisation globale des ressources par la société tout entière. Les résultats, fondés sur de nombreuses données d’enquête auprès des détaillants, des institutions financières et des sociétés de transport de fonds, ainsi que sur des sources de données internes et externes, montrent que les coûts en ressources associés aux paiements au Canada ne sont pas négligeables (0,78 % du PIB). Les paiements par carte de crédit sont les plus coûteux par transaction sur le plan de l’utilisation des ressources, tandis que les paiements en argent comptant entraînent les coûts en ressources les plus importants par dollar de vente. Les règlements par carte de débit sont les moins coûteux par transaction et par dollar de vente. Par ailleurs, nous montrons comment les coûts varient selon le montant des transactions. Du point de vue des seuls coûts variables en ressources, les paiements les moins coûteux découlent des transactions en argent comptant allant jusqu’à 6 $ et des
iii
transactions par carte de débit de plus de 6 $. L’étude porte également sur l’ensemble des coûts individuels, à savoir les coûts assumés par chaque partie prenante, ce qui permet de mieux comprendre leur incidence sur l’utilisation et l’acceptation des différents modes de paiement. Sujets : Billets de banque ; Institutions financières ; Systèmes de compensation et de règlement des paiements ; Monnaies numériques Codes JEL : D12, D23, D24, E41, E42, G21, L2

Summary and Key Findings
The Bank of Canada (the Bank) conducted a comprehensive study to analyze the costs ofcash, debit cards and credit cards used by Canadian consumers at the point of sale (POS) inCanada in 2014. For each payment method, the study assesses the overall use of resourcesby society as a whole. Moreover, the study examines the total private costs incurred bythe key stakeholders, i.e., consumers, retailers, financial institutions and infrastructures, theRoyal Canadian Mint (the Mint) and the Bank. This paper discusses the methodology andreports the main findings of the study.
Various extensive surveys were conducted to collect cost information from retailers, fi-nancial institutions and cash transportation companies. A separate study was establishedto measure the time costs for consumers and retailers to make and receive payments. Aswell, internal and external data sources were employed to assess the costs for consumers, theMint and the Bank, and to estimate the number and value of payments made at the POSin Canada in 2014.
The key findings of the study are:
• The costs of cash and card payments at the POS in Canada are non-negligible. Totalresource costs amounted to $15.3 billion, which corresponds to 0.78 per cent of GDP.
• Stakeholders incur costs in providing, accepting and using payments at the POS andtheir shares vary by payment method.
• Debit cards are the least costly in terms of total resource costs, followed by credit cards,whereas cash is the most costly.
• On average, debit cards are the least costly in terms of resource costs per transaction(volume) as well as resource costs per dollar transacted (value). Credit cards carry thehighest resource cost per transaction, while cash is most costly in terms of resourcecosts per dollar transacted.
• Considering variable resource costs per transaction, cash is cheapest for transactionsup to $6, while debit cards are the least costly for transactions larger than $6.
• If stakeholders make their payment choices based on their private costs alone, con-sumers would prefer to use credit cards, while retailers and financial institutions wouldprefer debit card payments.
It is important to recognize that the study focuses solely on the costs that can be measured.The use, acceptance and provision of payment methods by individual stakeholders, however,also depends on the overall revenues and benefits those methods generate. Therefore, tobetter understand the overall efficiency of payment methods, as well as the drivers of theuse and acceptance of payments, further work on the benefits and revenues is recommended.Moreover, the study uses information over 2014. Because of recent changes in the paymentsenvironment, such as a further growth in the use of contactless debit card and credit cardpayments and ongoing efforts by financial institutions to reduce costs, the cost estimatesmay have changed.
iv
1 Introduction
Consumers can use different methods to pay for their point-of-sale (POS) purchases andmany parties incur costs for these payments. For example, for a cash payment, the centralbank and financial institutions incur a cost to produce bank notes and make them availableto the public, the consumer incurs a cost to withdraw the cash from an automated tellermachine (ATM) or bank teller, and merchants incur a cost to count and accept the cash andprocess and deposit it at the end of the day. The Bank of Canada (the Bank) has a greatinterest in understanding these costs and how they differ between payment methods.
1.1 Background
The Bank plays an important role in retail payments by issuing Canadian bank notes andpromoting the efficiency and safety of the payments system. To improve its understandingof the use of cash and other payment methods, the Bank regularly conducts a Methods-of-Payment (MOP) Survey (see, for example, Fung et al. (2015)). However, comprehendingthe costs is also important. Knowing the absolute and relative costs of cash will enable theBank to improve its understanding of the demand for bank notes and how to improve theefficiency of its currency provision. A detailed study on the costs of cash and card paymentsalso creates new research opportunities. Understanding the cost of paying will allow for newinsight—for example, into the interaction between the retailer and consumer sides of thepayments market. Furthermore, transparency about the costs will enable a discussion ofhow these costs could be reduced and allow all market participants to make better-informeddecisions as to what payment methods to use, accept or provide. This may eventually helpimprove the overall efficiency of the Canadian payments system.
In 2006, the Bank conducted a survey among Canadian retailers (see Arango and Taylor(2008)). It provided a first step toward understanding the costs of POS payments. Overall,cash was found to be the least costly method of payment for low-value transactions. However,the payments landscape has significantly changed since then. Innovations such as contactlesscards have entered the scene, the card industry has adopted a code of conduct launched bythe Department of Finance Canada in 2010 to encourage choice and competition in the debitand credit card market,1 and the use of cash has continued to decline (Fung et al. (2015)).Also, the 2006 study focused on retailers and variable costs only; costs for other stakeholderswere not examined. Therefore, an updated and broader study is warranted.
1.2 Scope of study
This study analyzes the costs of different payment methods in Canada in 2014. The focusis on the main payment methods used by Canadian consumers at the POS, which are cash,debit cards and credit cards, with the latter including regular as well as prepaid creditcards.2 Costs related to the use of these instruments for person-to-person, e-commerce or
1See https://www.fin.gc.ca/n10/10-029-eng.asp.2The focus is on cards issued in Canada only. Although no actual credit is involved with prepaid credit
cards, the term “prepaid credit card” is used in this study to refer to Visa and MasterCard prepaid cards.
1

bill payments, and payments outside Canada, are out of scope. Cheques are excluded aswell, since consumers rarely use them at the POS.
For each payment method, the study assesses the total costs in terms of overall useof resources by society, which is relevant for understanding the cost-efficiency of paymentsfrom a social perspective. Moreover, to better understand the decisions made by individualstakeholders, the study examines the total private costs incurred by consumers, retailers,financial institutions and infrastructures, the Royal Canadian Mint (the Mint) and the Bank.Revenues and benefits are out of scope, so only gross costs are assessed. For reasons ofconfidentiality, the costs for financial institutions, cash transportation companies and otherinfrastructure providers are reported as one aggregate total. Similarly, the costs for the Mintand the Bank are also aggregated.
To allow for a fair comparison across instruments, this paper considers only the paymentfunction of credit cards. Costs related to their credit functionality, such as credit lossesand the costs of outstanding credit balances, are out of scope. Costs related to the 21-daygrace period and the evaluation of the credit worthiness of new applicants by contrast areconsidered as a payment cost and included.3 Similarly, beyond their payment function, debitcards can be used as a means of authentication for online banking and for cash withdrawals.However, only a debit card’s POS payment function is covered in this study. The costs ofcash withdrawals, including those made using a debit, credit or prepaid card, are includedin the cost of cash.
1.3 Contribution and comparison with other studies
This study is similar to those of other central banks in a number of ways—see, for instance,Hayashi and Keeton (2012) and Schmiedel et al. (2013). These studies share some commonconclusions, including that the costs of payments are non-negligible and that cash paymentsoften carry the lowest cost for small transactions. However, different conclusions are reachedabout the absolute costs of different payment methods. The European Central Bank (ECB),for example, assesses the costs in 13 European countries and shows that the resource cost ofpayments ranges from 0.42 to 1.35 per cent of gross domestic product (GDP) per country(Schmiedel et al. (2013)). An Australian study by Stewart et al. (2014) estimates the resourcecosts of retail payments at 0.54 per cent of GDP. This suggests that costs can depend onthe specificity of a country’s payments system. Moreover, the studies differ in terms ofmethodology, scope and year. This indicates that comparisons should be made with cautionand underlines the need for the Bank to conduct its own study.
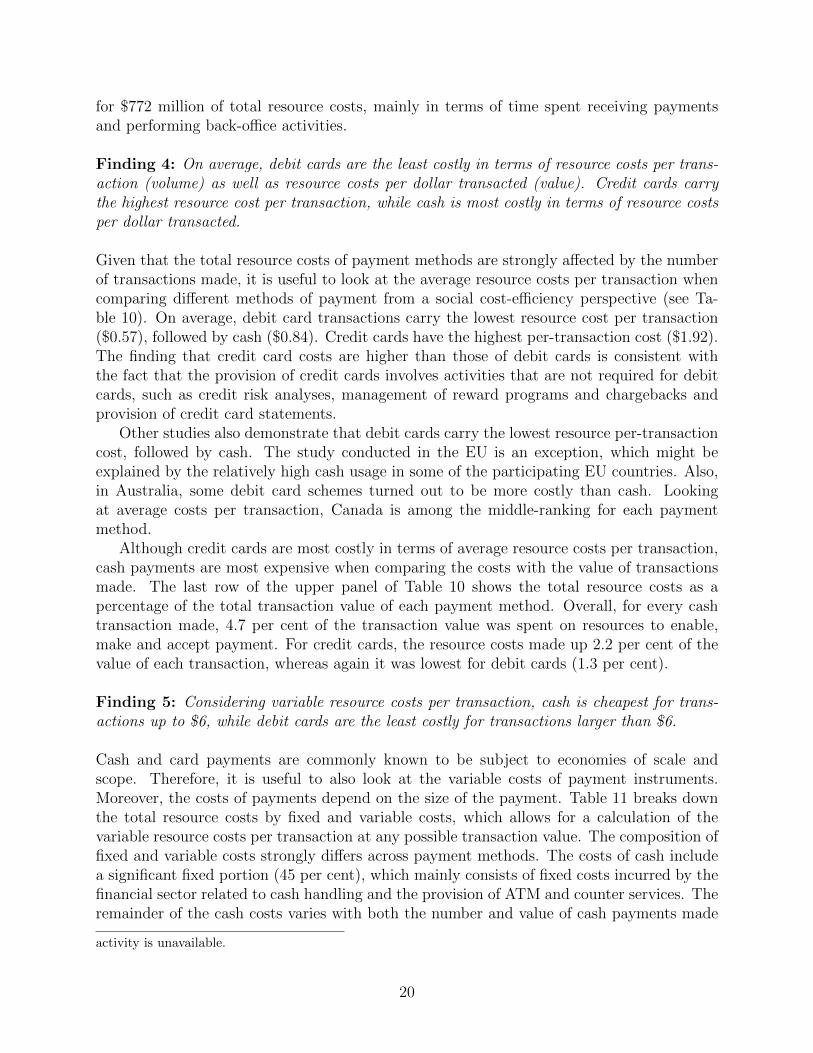
Appendix A presents the key characteristics of several cost studies. This study contributesto the understanding of the costs of payments in a number of ways. First, it is based onan extensive retailer survey. As discussed later in Section 4.2, data are collected from over1,000 retailers. This is considerably more than in the Bank’s 2006 survey (Arango and Taylor(2008)) and in most other studies. In particular, small and medium-sized retailers are wellrepresented (see Figure 1). Second, this study covers the costs of the key stakeholders in
3In Canada, consumers usually have 21 days from the time they receive their credit card statement to payoff the new balance before incurring any interest costs. The costs related to this grace period are consideredas a cost related to the payment function of credit cards. The evaluation of the creditworthiness of newapplicants is included, as this is a standard procedure, even when the card is used only for payments.
2
the payments chain. The Bank’s 2006 survey focused only on retailers, while the currentstudy also includes the financial sector and the bank-note- and coin-issuing authorities.It also assesses consumer costs, which are not considered in every study. Moreover, asdiscussed in Section 4, this paper directly surveys cash transportation companies instead ofusing information provided by retailers and banks. This study further contributes in that adistinction is made between fixed and variable costs. As a result, this paper is able to showhow the costs of payments vary with transaction sizes.
1.4 Caveats of study
Despite the broad coverage, there are a number of caveats to bear in mind when interpretingthe results. First, the study focuses on the year 2014, but the payments market has furtherchanged since then. For example, Canada’s largest credit card companies reduced theirretailer fees in 20154 and new payment options have been launched. Therefore, the estimatesmay have changed over time as well. Second, a discussion of the efficiency of alternativemethods of payment should take into account a wider range of considerations than just thegross costs as measured in this study, such as the revenues and benefits they offer to variousstakeholders and their indirect impact on the rest of the society, i.e., their externalities.Ideally, an all-comprehensive cost-benefit analysis would entail every item listed in Figure 2.Since benefits and externalities are difficult to quantify, this paper focuses on the costs only,and only those that can be measured directly, i.e., the two highlighted boxes at the bottomof the figure. Third, while the focus is on the use of payment methods at the POS, theestimated cost of cash includes all issuance and distribution costs, irrespective of how thecash is finally used by the public. Since cash can be used for purposes other than POSpayments—such as person-to-person payments or maintaining a supply of cash on-hand—the total cash costs may overestimate the cost of cash used for POS payments only. Fourth,while the study is based on an extensive sample of retailers, the large businesses coveredin the study are not fully representative of all large retailers in Canada. Therefore, anystatistical references should be used with some caution. Finally, the estimates are subject tovarious other key assumptions, which are summarized in Appendix B. These should be keptin mind when interpreting the results.
1.5 Structure of paper
The next sections describe the Canadian payments landscape (Section 2) and the cost def-initions used for the analysis (Section 3). Section 4 discusses the various methods usedto calculate the costs for each stakeholder. Section 5 presents the findings and comparesthe results with those found abroad. The paper closes with a conclusion and discussion inSection 6.
4See: http://www.fin.gc.ca/n14/14-157-eng.asp.
3

2 The Canadian Retail Payments Landscape
2.1 Payment trends
Over the past 20 years, Canada has witnessed a gradual shift away from cash and towarddebit and credit cards (Arango et al. (2012)). More recently, the decrease in the market shareof cash has mainly been driven by increased usage of credit cards, in particular contactlesscredit cards (see Figure 3 and Figure 4; see also Fung et al. (2015)). The market shareof cash in terms of value, however, remained virtually stable between 2009 and 2013. Theobserved reduction in the use of cash in favour of electronic means of payment is in line withresearch by Fung et al. (2014) and Chen et al. (2017) that predicts a significant reduction inthe share of cash as a result of the introduction of contactless credit cards.
The shift towards contactless credit cards may be explained by different factors. First,contactless payment cards differ from regular payment cards in terms of speed and conve-nience, which are features that Canadian consumers rank as most desirable (Arango andWelte (2012)). Moreover, the increase in contactless payments goes hand in hand with themassive rollout of contactless credit cards by Canadian financial institutions and the widedeployment of contactless terminals by retailers over the past years.5 Finally, the rising shareof credit card payments in general might be attributable to the generous reward programsin Canada. Henry et al. (2015) show that about two-thirds of respondents to the Bankof Canada 2013 MOP survey received rewards on their main credit card and that theserespondents were less likely to use cash.
Despite the recent developments, Wakamori and Welte (2017) find that consumers stillhave a preference for using cash for POS transactions, especially small-value ones. Indeed,cash still constitutes a major share of POS transactions in Canada and in other countries(Bagnall et al. (2016)). According to Henry et al. (2015), cash is still seen as a convenient,low-cost, secure and widely accepted means of payment. Moreover, it is used most commonlyamong respondents who are older, have a lower income or are less educated.
2.2 Key stakeholders in retail payments
The Canadian cash and payment card market is composed of many stakeholders, each ofwhich incurs a cost for enabling, using or accepting payments. Figure 5 provides an overviewof the key stakeholders considered in this study.
Consumers usually pay a periodic fee to have a bank account and a credit card, anddepending on their banking package, they may also pay a fee to withdraw cash or usetheir cards. Other costs include the (travel) time spent to make payments or withdrawcash, the risks of holding and using payment methods, and forgone interest on outstandingcash or prepaid credit card balances. The costs for retailers include periodic fees and per-transaction charges for accepting card payments and depositing cash, rental or depreciationcosts of terminals, and security and fraud costs. Retailers also incur a time cost to count anddeposit their cash receipts. Differences in business structure, bargaining power and paymentacceptance may cause smaller retailers to face different costs than larger ones. The Bank
5The effect of retailer acceptance is in line with previous research by Arango et al. (2015) and Huynh et al.(2014), which demonstrates the role of card acceptance in explaining payment choice and cash holdings.
4

of Canada’s 2013 MOP survey, for example, shows that the use of payment methods varieswith the size of the retailer, which might give rise to differences in costs.
Banks and credit unions, hereafter referred to as financial institutions, play a major rolein the cash and payment card chain as well. They offer chequing, credit and prepaid cardaccounts to consumers and in some cases provide acquiring services to retailers. Financialinstitutions also incur costs for the operation of ATMs and the handling and processing ofcash. Other costs include card processing and costs related to fraud losses and prevention.Being responsible for the issuance of Canadian bank notes and coins, the Bank and theMint, respectively, are main actors in the cash chain. They incur costs to design, produce,store and transport bank notes and coins, as well as to combat counterfeiting. Finally, theCanadian cash and payment card industry involves many other players, which are primarilyinfrastructure providers, such as Payments Canada—the owner and operator of Canada’sretail payments system. Other infrastructure providers are Interac (the provider of thenational debit card scheme), credit card companies, cash transportation companies, white-label ATM providers and payment card acquirers.
3 Cost Definitions
The focus of this paper is on the costs of cash, debit cards and credit cards that can bemeasured. We differentiate between private costs and resource costs, indirect and directcosts, as well as total, average and variable costs. This section provides an explanation ofthese different cost concepts.
3.1 Private and resource costs
The concept of private and resource costs has been commonly used for measuring the costs ofpayment methods. Private costs are the total costs incurred by each individual stakeholder.These include both the resources employed by the stakeholders themselves and all transfersmade to other parties. For example, banks consume resources to offer payment servicesand products in the form of labour, equipment and premises. In addition, they pay cashtransportation companies for the shipment of bank notes to and from branches and ATMs.All these costs taken together constitute the private cost to banks. Similarly, retailers incura resource cost in terms of time spent on back-office activities related to payments, butthey also pay fees to their financial institutions and payment processors. All of these coststogether comprise the private costs to retailers. See Figure 2 for a few more examples ofresource costs and transfers made.
While the private costs are most relevant in understanding the behaviour of individualstakeholders, from a social cost-efficiency perspective, the total resource costs are moreinformative. The total resource costs reflect the overall use of resources in the entire society,and are calculated by adding together the resource costs of each stakeholder. In some studies,these resource costs are also referred to as social costs (see, for example, Schmiedel et al.(2013)). However, since externalities are excluded from the study and to avoid confusionwith the definition of social costs used in economics, this paper uses the term resourcecosts instead of social costs, as in Stewart et al. (2014). The total resource costs cannot be
5

calculated by adding together the private costs of each stakeholder, as this would double-count the resource costs that stakeholders pass on to each other through fees. Moreover,from a society’s point of view, the fees paid by one party are offset by the fees received bythe other.
Note that the stakeholders considered in this paper also pay fees to entities that are notseparately addressed in this study. The Bank, for example, pays fees to electricity companiesor bank-note material providers. While measuring the private costs of these entities is outsideof the scope of this study, their resource costs do contribute to the total resource costs tosociety. Therefore, the fees paid to these parties are assumed to equal their resource costs andare added to the resource costs of the paying stakeholder (in this example, the Bank). Thisensures that these costs are captured in total resource costs. It should be noted, however,that total resource costs might be overstated if the fees charged by other entities contain aprofit margin. Similarly, fraud costs are considered to be a resource cost to the injured partyand hence a cost to society as a whole, as the benefiting entities (i.e., fraudsters) are notseparately analyzed in this study.
See Appendix C for an illustration of the concept of private and resource costs.
3.2 Direct and indirect costs
The estimates presented in this paper include both direct and indirect costs. Direct costsarise when resources are used exclusively for a particular payment method. The costs oftransporting cash, for example, are solely incurred for cash, whereas debit card processingcosts are related only to debit card payments. By contrast, indirect costs are incurred formore than one payment method at the same time, and for other types of services as well.Chequing accounts, for instance, can be used for a variety of transactions, including chequepayments and electronic funds transfers. Hence, the cost of providing or having a chequingaccount cannot be directly assigned to one particular payment method. Indirect costs mayalso include those that are not directly related to payments at all if stakeholders are activein other lines of business. In that case, corporate-wide management costs, for example, areonly partly related to stakeholders’ payment activities. As discussed in Section 4, a varietyof allocation keys are used to ensure an appropriate allocation of indirect costs across thepayment methods studied.
3.3 Average and variable costs
Since the total costs of a payment method are strongly influenced by the intensity with whichthe payment method is used, it is useful to look at the average costs per transaction whencomparing different payment methods. The average costs per transaction are generated bydividing the total costs of each payment method by the number of transactions made withit. However, this indicator does not take into account the size of the transactions. Therefore,this study also provides the average costs per dollar in sales, which reflects, for each singlepayment, how much of the transaction value is actually going to the costs of enabling, makingand accepting this payment.
One of the limitations of the average costs per transaction or dollar in sales is that theyare difficult to compare because of economies of scale and scope. It is for this reason that
6

this study also calculates the fixed and variable costs. Assuming a medium-term horizonof three to five years, fixed costs are those that are incurred irrespective of the numberof payments made in the economy, such as the costs of machinery, premises and software.Variable costs are those that vary with the intensity with which a payment method is used.Transaction-related variable costs fluctuate with the number of payments, whereas value-related variable costs change with the transaction size.6 The breakdown between fixed andvariable costs is useful for calculating and comparing the variable costs of payment methodsat different transaction sizes. These variable costs reflect the additional costs of makingone additional payment of a certain value, while assuming that all fixed costs have alreadybeen paid for. Based on these costs, the threshold amount can be identified, which is thetransaction amount above which one payment method becomes less costly than another.
4 Methodology
4.1 Overview
The Bank conducted various surveys to collect cost information from retailers, financialinstitutions and cash transportation companies. A separate study was established to measurethe time costs for consumers and retailers to make and receive payments. Moreover, internaland external data sources were employed to assess the costs for consumers, the Mint andthe Bank, and to estimate the number and value of payments made at the POS in Canadain 2014. This section discusses the various surveys and methods in more detail.
4.2 Survey of retailers
4.2.1 Methodology
The Bank conducted an extensive survey to collect 2014 cost data from Canadian retailers,the Retailer Survey on the Cost of Payment Methods (RCPM survey). The survey was dis-tributed across retail stores, accommodation and food places and personal service providersas defined in the North American Industry Classification System (NAICS).7 The retailerswere sampled from different frames. For a detailed description of the sampling methodology,see Welte (2017).
To ensure that the contacted retailers were capable of providing the requested dataand authorized to release it, two different questionnaires were used: one for retailers whoindependently own and operate a business and another for headquarters operating a chain.Both questionnaires asked for the same information, but the headquarters’ survey was divided
6Examples of transaction-related variable costs include the time costs to consumers to make a cardpayment and the costs to banks and infrastructures to process the payment, as these are likely to be thesame for a $5 transaction as for a $500 one. By contrast, the cost of counting and transporting bank notesis likely to increase with the value of cash handled. Similarly, fraud-related costs are likely to be higher forhigh-value card payments than for low-value ones.
7With specialized retail stores being NAICS 44, general retail stores being NAICS 45, accommodationand food places being NAICS 72 and personal service providers being NAICS 81.
7
into two sections. The first section had to be completed by someone at the head office,whereas the second one had to be filled out by individual sales locations.
The survey followed Dillman et al. (2008) and approached retailers with different surveymodes to accommodate various preferences, including a paper questionnaire, an online surveyand telephone interviews. Various incentives were used to further promote participation. SeeAppendix D for more details on the survey, sampling, survey modes and incentives.
Given the length of the questionnaire, information on the fixed and variable nature of thecosts was not directly collected from the retailers. Instead, the breakdown of the retailers’costs into fixed and variable presented in this paper is based on other similar studies andexternal information. As a robustness check, the fixed and variable shares were also econo-metrically estimated from the data, following the method used by the European Commission(2015), which hardly affected the results.
4.2.2 Survey responses
To obtain a sizeable number of responses, almost 30,000 retailers were approached. Overall,more than 1,000 responses were received, representing a response rate of about 3.5 percent, which is typical for this kind of voluntary business survey (see Table 2). The finalsample of small and medium-sized independent retailers provides good coverage of small andmedium-sized retail stores, food and drink places and personal service providers in Canadain terms of industry and region (see Table 3). Moreover, the large independent retailers andheadquarters included in the sample represent about 41 per cent and 18 per cent of the totalturnover in the Canadian retail and restaurant sectors.8
Because of the relatively low number of responses from headquarters and large indepen-dent retailers (hereafter jointly referred to as large retailers), those responses were analyzedseparately from small and medium-sized independent retailers. Also, Jiongo (2017) demon-strates that the cost structure of the large independent respondents was similar to thoseoperating a chain, which further supported combining them and analyzing their responsesseparately from small and medium-sized independent retailers.
One of the challenges of surveys is unit and item nonresponse. Unit nonresponse refersto retailers not replying to the survey at all, whereas item nonresponse refers to particularquestions not being answered. Since both may introduce a bias, various techniques havebeen used to address nonresponse. Hatko (2017) provides a detailed description of thetechniques used to correct for nonresponse among small and medium-sized independentretailers, whereas Jiongo (2017) describes the imputation methods used for large retailers.
As discussed in great detail in Chen and Shen (2017), survey weights have been created forthe small and medium-sized retailer sample to ensure the survey results can be appropriatelyextrapolated to the national level. However, given the relatively small number of respondents,calibration methods were used for the scale-up of the large retailers’ answers (see Jiongo(2017)). The current study reports the aggregate costs of all retailers taken together. Abreakdown of the results by size of retailer will become available under separate cover on theBank’s website.
8The definition of small, medium and large independent retailers is based on the number of employees,with small ones having fewer than 5 employees, medium ones having 5 to 49 employees and large ones havingmore than 49 employees.
8

See Box 1 for the main lessons learned from the RCPM survey. Moreover, Figure 6provides an overview of how the current paper and the work of Welte (2017), Jiongo (2017),Chen and Shen (2017) and Hatko (2017) fit together.
Box 1: Lessons learned from the RCPM survey
Various experiences were gained during the RCPM survey:
• Screening calls: Nonresponse and project mailing costs were reduced in the courseof the fieldwork when first making screening calls to identify retailers that wereout of operation and to check their addresses before sending survey packages.
• Adaptive sampling: The representativeness of the sample benefited from contactingretailers in multiple waves and adapting the sample as responses came in.
• Personal visits: Personal visits were useful to recruit respondents from particularindustries, such as small restaurants.
• Personalized outreach: Response rates among large retailers strongly benefitedfrom direct personal outreach to verify the name, title and mailing information ofthe most appropriate individual.
• Trade associations: Assistance from retail and restaurant associations was invalu-able in gathering responses. This included help in drafting the questionnairesand reaching out to members through newsletters, emails and letters to promoteparticipation.
4.3 Financial institutions and infrastructure providers
4.3.1 Financial institutions
After carefully considering other potential methods (see Appendix E), directly gatheringcost information from financial institutions proved to be the most suitable approach formeasuring their costs. Therefore, a separate survey was designed. The survey was completedby the largest Canadian banks, the main credit unions and several smaller banks. Comparedwith the number of transactions from Interac, the Canadian Bankers’ Association and othersources, the data set covers about 96 per cent of all debit card transactions made in Canada,almost 78 per cent of all regular credit card payments and 94 per cent of all prepaid creditcard transactions.9 The costs have been scaled up to the national level based on the totalnumber and value of cash withdrawals and card payments in Canada. This assumes thatthe non-participating banks and credit card brands have the same cost structure as those inthe sample.
9The credit card transactions in the data set mainly include Visa and MasterCard transactions. Othercredit card brands, such as American Express, were not reported, hence the 78 per cent coverage.
9

The survey asked for all costs incurred to provide cash services and issue debit and(prepaid) credit cards in 2014.10 Moreover, information was collected about the fixed andvariable nature of the costs and whether they constituted transfers paid to other stakeholders.The data were collected at the headquarter level to capture the costs to the entire institution,including those incurred at individual branches.
One of the main challenges pertained to the allocation of indirect costs across individualpayment methods. To help with this and to ensure comparability of the responses, the Bankdeveloped an automated data collection tool based on the activity-based costing (ABC)framework. Respondents were free to use this tool or to use their own accounting methods.See Appendix E for an overview of all activities considered, as well as the allocation keysused to allocate the indirect costs.
Bank employees worked closely with the respondents to ensure the appropriateness of themethodology and the quality and consistency of responses. Collaboration included meetingsto discuss the required and available information, and extensive contact during and afterthe data submission period to clarify questions and ambiguities. To ensure the quality andreliability of the data, deliberate quality control procedures were implemented. Individualresponses were rigorously checked for internal consistency and compared with responses fromother participants and, where possible, with other data sources.11 If needed, clarification wassought from the respondents who, in most cases, submitted revised data or provided infor-mation that allowed the Bank to adjust the data. In case of item nonresponse, assumptionswere made based on the breakdown of other respondents.12
Banks that are members of the Canadian Bankers Association (CBA) provided their inputto the CBA, which then submitted the aggregated data to the Bank. All other financialinstitutions were directly engaged on a bilateral basis. To ensure anonymity, the resultshave been merged with those of the cash transportation companies and other infrastructureproviders and presented as one aggregate total.
The financial institutions were not able to provide information about their domestic POStransactions only, so their data also covered online and international payments. Therefore,the calculations in this study assume similar average unit costs for online and POS payments,as well as for domestic and international payments.13
See Box 2 for the key lessons learned from the survey of financial institutions.
10Some institutions provided data based on their 2014 fiscal year starting on 1 November 2013. Theyindicated that the changes between November and December 2013 and November and December 2014 arelimited and that these changes should not have a notable effect on the total estimated costs for the 2014calendar year.
11Other sources include internal data from the Bank’s 2013 MOP survey, Tompkins (2015), statisticspublished by the Canadian Bankers Association, as well as proprietary information provided by the CanadianPrepaid Providers Organization (CPPO), Interac, Nielsen and other market participants.
12Different scenarios were estimated, but changing the assumptions minimally affected the final estimates.13Although the majority of fraudulent card payments occur online and are thus more likely to be riskier
and more costly, it is not always the case that the source of the fraud is an online rather than a POStransaction. Moreover, the survey data suggest that fraud costs make up a limited part of total card coststo financial institutions. Therefore, the assumption of equal average costs is assumed to minimally affect thefinal results.
10
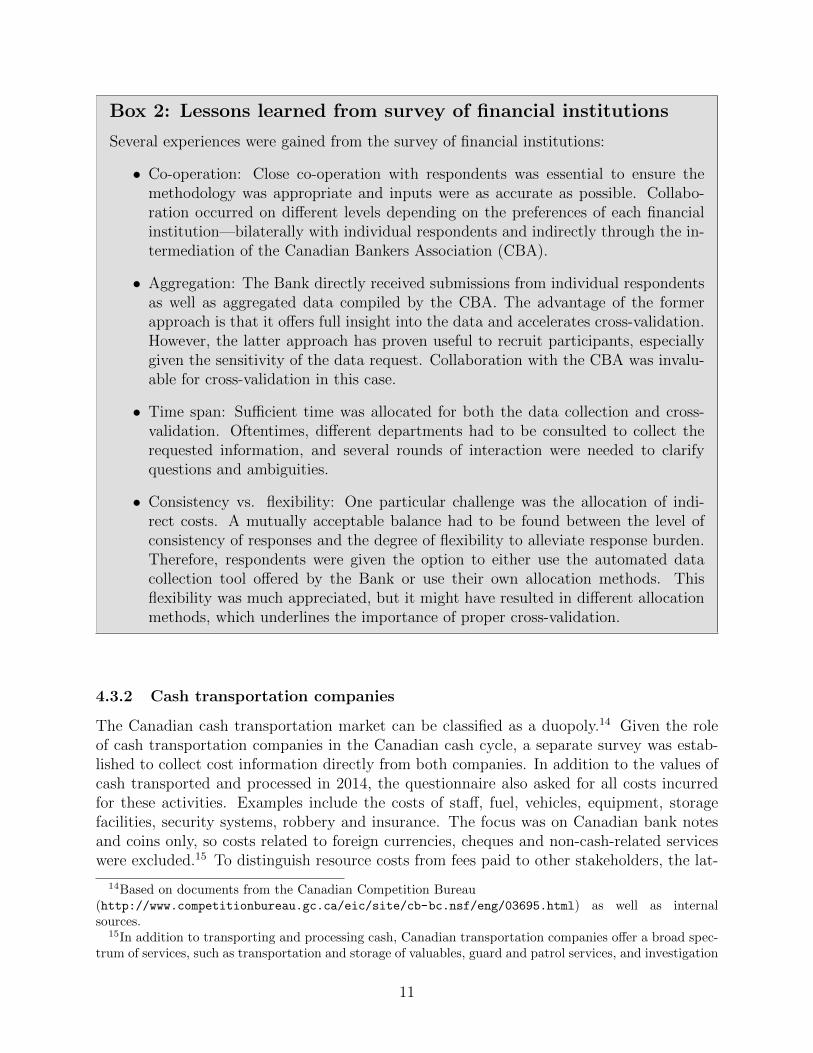
Box 2: Lessons learned from survey of financial institutions
Several experiences were gained from the survey of financial institutions:
• Co-operation: Close co-operation with respondents was essential to ensure themethodology was appropriate and inputs were as accurate as possible. Collabo-ration occurred on different levels depending on the preferences of each financialinstitution—bilaterally with individual respondents and indirectly through the in-termediation of the Canadian Bankers Association (CBA).
• Aggregation: The Bank directly received submissions from individual respondentsas well as aggregated data compiled by the CBA. The advantage of the formerapproach is that it offers full insight into the data and accelerates cross-validation.However, the latter approach has proven useful to recruit participants, especiallygiven the sensitivity of the data request. Collaboration with the CBA was invalu-able for cross-validation in this case.
• Time span: Sufficient time was allocated for both the data collection and cross-validation. Oftentimes, different departments had to be consulted to collect therequested information, and several rounds of interaction were needed to clarifyquestions and ambiguities.
• Consistency vs. flexibility: One particular challenge was the allocation of indi-rect costs. A mutually acceptable balance had to be found between the level ofconsistency of responses and the degree of flexibility to alleviate response burden.Therefore, respondents were given the option to either use the automated datacollection tool offered by the Bank or use their own allocation methods. Thisflexibility was much appreciated, but it might have resulted in different allocationmethods, which underlines the importance of proper cross-validation.
4.3.2 Cash transportation companies
The Canadian cash transportation market can be classified as a duopoly.14 Given the roleof cash transportation companies in the Canadian cash cycle, a separate survey was estab-lished to collect cost information directly from both companies. In addition to the values ofcash transported and processed in 2014, the questionnaire also asked for all costs incurredfor these activities. Examples include the costs of staff, fuel, vehicles, equipment, storagefacilities, security systems, robbery and insurance. The focus was on Canadian bank notesand coins only, so costs related to foreign currencies, cheques and non-cash-related serviceswere excluded.15 To distinguish resource costs from fees paid to other stakeholders, the lat-
14Based on documents from the Canadian Competition Bureau(http://www.competitionbureau.gc.ca/eic/site/cb-bc.nsf/eng/03695.html) as well as internalsources.
15In addition to transporting and processing cash, Canadian transportation companies offer a broad spec-trum of services, such as transportation and storage of valuables, guard and patrol services, and investigation
11

ter were requested separately. Close co-operation with respondents was crucial to ensure anaccurate understanding of the methodology and to secure the quality of the responses.
The breakdown between fixed and variable costs is based on other cost-of-payment studiesand discussions with participants. Overall, the total costs of cash transportation companiesare assumed to be mainly variable, especially with the value of cash used in the economy.Yet a considerable portion of total costs is presumed to be fixed, as a minimum level ofinfrastructure is required, irrespective of the number or value of cash payments made.16
As explained above, the results of the cash transportation companies are merged withthose of the financial institutions to ensure anonymity.
4.3.3 Other infrastructure providers
The costs incurred by other key players in the payments market, such as Payments Canada,Interac, credit card companies, payment card acquirers and white-label ATM providers, areindirectly estimated based on the fees paid by financial institutions, retailers and consumers,assuming that these fees are a fair reflection of the underlying resource costs. The estimatedcosts are aggregated with the resources provided by financial institutions and cash trans-portation companies. It should be noted, however, that the true resource costs of these otherinfrastructure providers might be overestimated if their fees charged to the market contain aprofit margin. In the absence of further information, this study assumes zero profits, hencethe total reported resource costs for financial institutions and infrastructures are likely torepresent an upper bound.
4.4 The costs of bank-note- and coin-issuing authorities
Bank of Canada internal accounting information over the year 2014 is used to calculate thetotal costs incurred by the Bank to issue Canadian bank notes. This includes the costsof: raw materials; labour; equipment and premises employed for producing, processing anddistributing bank notes; and all other bank-note-related activities, such as research, policyand communication. In addition, part of the Bank-wide overhead costs is included, suchas the costs of the Bank’s corporate service departments, the Board of Directors and theBank’s head office. The allocation of these indirect costs is based on the ratio of the numberof full-time equivalent (FTE) Bank employees working on bank-note-related activities to thenumber of FTEs working on the Bank’s other core functions.17
The granularity of the data allows us to clearly distinguish the Bank’s resource costsfrom the fees paid to other stakeholders considered in this study, such as cash transportationcompanies. The breakdown of costs into fixed and variable is based on careful consultations
and detective services. Costs related to these activities are out of scope of the current study.16The coin/bank note composition of cash payments may change over time. This may affect the fixed
and variable nature of transportation costs, as a change in coin usage affects the weight of the trucks andconsequently fuel and maintenance costs. Since information about the current composition of cash paymentsis unavailable and given the aim of this study, the variable costs of cash are calculated considering a medium-term time horizon within which the composition of a cash payment is assumed to be fixed.
17An alternative approach is to allocate the overhead costs based on the ratio of FTEs working on bank-note-related activities to the total number of Bank employees; however, this would overlook the fact thatthe bank-wide overhead costs would not have been incurred in the absence of the Bank’s core functions.
12

with relevant experts within the Bank. Overall, the production and transportation costs ofbank notes are mainly variable with the use of cash in the economy, whereas processing anddistribution costs contain considerable fixed and variable components. The costs of otherbank-note-related activities and Bank-wide overhead are essentially fixed over a medium-term horizon of three to five years.
The costs incurred by the Mint to issue Canadian circulation coins in 2014 are estimatedbased on internal calculations using a variety of sources, such as the Mint’s annual reports.Although the Mint also produces collector and foreign coins, the focus here is on Canadiancirculation coins only, as these are used in daily life for Canadian POS transactions. Al-ternative scenarios were estimated to test for different assumptions. Overall, changing theassumptions minimally affected the final results. For reasons of sensitivity, the estimatedcosts for the Bank and the Mint are aggregated and reported together.
4.5 Measuring consumer costs
Various sources are used to estimate consumer costs of cash and cards in 2014. Chequingaccount fees and transaction fees for debit card payments and cash withdrawals are estimatedusing information from the Bank’s 2013 MOP survey and the Financial Consumer Agencyof Canada (FCAC).18 Canadians do not pay transaction fees for credit card payments, butdo incur an annual charge plus a fee and interest costs for credit card cash withdrawals. Theannual charges are taken from the 2013 MOP survey, whereas withdrawal costs are estimatedusing FCAC data. Fees tied to prepaid credit cards are approximated using information fromfinancial institutions and credit card companies.
Other costs for consumers include the time spent making payments. These are estimatedusing the results of the time duration study (see Section 4.6). In the absence of furtherinformation, the time costs of withdrawing cash (i.e., travel and transaction time) are ap-proximated based on estimates from other studies. Travel time to withdraw cash is assumedto be proportional to the concentration of ATMs. The average for Canada is computed usingthe times reported for Australia (Schwartz et al., 2008) and the United States (Garcia-Swartzet al., 2006), and the relative concentration of ATMs across Canada. The transaction time ofa cash withdrawal is taken from the Norwegian cost study (Norges Bank, 2014).19 Owing tothe lack of information, time spent on other payment-related activities such as paying creditcard bills or checking statements, as well as transport costs incurred to withdraw money aredisregarded.
Consumers’ time is valued using half the average hourly after-tax wage. Other studiesvalue consumers’ time using full wages; however, it is unlikely that consumers would other-wise work the time they spend on paying. Instead, the trade-off is most likely in leisure timeand not directly in earnings. Therefore, similar to Schwartz et al. (2008) and in the absenceof further guidance, half the average hourly after-tax wage is used.
Consumers also incur forgone interest costs for the cash they have on hand and for anon-interest-bearing prepaid or chequing account. These costs are approximated using in-
18The FCAC collects information on banking and credit card fees for a wide range of products offered byCanadian financial institutions. This information is made available on the FCAC website.
19The Norwegian study is the only recent study presenting an estimate of the transaction time of cashwithdrawals.
13

formation from the 2013 MOP survey and an annual interest rate of 1 per cent.20 Other costspertain to fraud, such as cash theft, counterfeiting and card fraud. However, since card fraudlosses are typically absorbed by card issuers or retailers, and given the low counterfeitingand robbery rates, consumers’ fraud costs tied to POS payments are likely to be limited inCanada and are therefore ignored in the present analysis.21
Most of the above costs do not relate solely to POS payments. Chequing accounts areoften also used for other purposes, such as bill payments, and payment cards can be usedbeyond the physical POS, such as online or over the phone. Similarly, cash withdrawalscan also be made for person-to-person transactions or other purposes, such as maintaininga supply of cash on-hand. Hence, various allocation methods are used to estimate consumercosts related to the use of cash and cards at the POS only. All fees are allocated based onthe number of POS transactions relative to the total number of transactions made from achequing account. Costs related to forgone interest are allotted based on the relative valueof POS transactions compared with the total value of transactions made from the account.22
Moreover, a correction is applied for the use of cash for non-POS purposes, using informationfrom the 2013 MOP survey.
Overall, the total resource costs for consumers include only time-related costs; all othercosts constitute a fee paid to other stakeholders. Periodic and per-transaction fees, forexample, are transfers to financial institutions or other independent ATM owners, whereasforgone interest is basically a transfer of interest margin income for financial institutions.When calculating the variable costs, all periodic fees are assumed to be fixed, per-transactionfees and time costs are considered to vary with the number of payments, and forgone interestis assumed to vary with the value of payments. Cash withdrawal costs are assumed to beboth fixed and variable.
The final cost estimates are subject to various assumptions, including, for example, theinterest rate used to calculate forgone interest costs, the fees charged by white-label ATMsand the number of interest days charged for credit card cash withdrawals. Further analysesdemonstrate that the final estimates are quite stable to different scenarios. They seem mostsensitive to drastic changes in the value of consumers’ time23 and to changes in the ratio ofcash withdrawals made at own-bank ATMs and other ATMs.24 In the absence of furtherinformation, the final estimates are based on values used in other studies or values that liein the middle of the range of plausible options.
20The average overnight money market rate is used to proxy the short-term interest rate for consumers.21The total value of counterfeit Canadian bank notes passed in 2014 amounted to $2.4 million (Royal
Canadian Mounted Police (2016)). Moreover, the rate of reported robbery and burglary is relatively low(Boyce (2015) and Conference Board of Canada (2013)).
22Based on numbers and values taken from the 2013 MOP survey and Tompkins (2015).23Increasing (decreasing) the value of consumers’ time to 75 per cent (25 per cent) of average after-tax
wages increases (decreases) total consumers’ costs of cash by 17 per cent and the cost per cash transactionby $0.06.
24Increasing (decreasing) the ratio from 70/30 to 80/20 (60/40) decreases (increases) total cash costs by12 per cent and the costs per cash transaction by $0.04.
14

4.6 Time duration study
The time needed to make a payment at the counter, i.e., the tender time, constitutes anopportunity cost to consumers and a labour cost to retailers. To measure this time, theBank undertook a time duration study in the fall of 2014. Observers visited 29 stores to takenote of the duration of all payments made over a six-hour period. Since tender times mightvary with the size and type of store, the sample consisted of a large variety of locations,such as gas stations, coffee shops, convenience stores, drug stores, supermarkets and homeimprovement stores. Visits were made on all seven days of the week and from early morningto late evening to account for any day- or time-related effect. To avoid potential regionalbiases, the sample was split among Montreal, Toronto and Ottawa.
The transaction duration was defined as the number of seconds between the momentthat the total sum to be paid is made known to the customer and the moment that thereceipt and billing slips are printed and taken out of the register. Time used for socialor productive activities that were not directly related to payment, such as scanning thepurchases, packaging or socializing with clients, was included only as long as these activitieshappened while the customer was waiting for the transaction to be authorized and approved.If not, any such time was subtracted from the total time to measure only the payment activity.
Besides the duration, observers recorded the payment methods used and the transactionamounts. Other factors that could affect the time were also logged, such as the day and timeof the transaction, the gender and estimated age of the client and cashier and the numberof cash registers in operation. Observers also logged any irregularities, such as technicalproblems with card terminals or customers asking for cash back. See Appendix F for furtherdetails on the Bank’s time duration study.
A total of 5,891 transactions were recorded. The median transaction duration of eachpayment method is estimated with a quantile regression model, using the method of payment,transaction size and all auxiliary variables as covariates.25 The results are presented inFigure 7. Cash transactions were found to be quickest, with a median duration of 11.61seconds. The duration of card payments strongly depends on the underlying technology.Contactless debit and credit card transactions take about 15 seconds, whereas these couldextend to almost 26 seconds when using the chip and PIN or the swipe technology.26 Otherstudies show large country differences (Stewart et al. (2014) and Schmiedel et al. (2013)). Yetoverall, cash was often found to be either the fastest or one of the fastest payment methods,and contactless card payments were shown to be quicker than traditional card transactions(Polasik et al. (2010)).
25A quantile regression model was used to account for potential skewness in the distribution of the trans-action durations. The results were similar to those of an ordinary least squares model, which implies thataccounting for skewness did not affect the duration estimates.
26Contactless cards refer to payment cards that simply need to be waved or tapped over a terminal. Chip-based transactions require the card to be inserted into the terminal, whereas swipe transactions requirethe card to be swiped. All chip-based transactions as well as debit card swipe transactions require a PIN,whereas a signature is used for credit card swipe transactions.
15

4.7 Estimation of the number and value of POS transactions
Having accurate data on the number and value of payments made at the POS in Canada isimportant for measuring the costs of payments—for example, when assessing average costsper transaction. Table 4 provides an overview of the transaction estimates used in this study.The remainder of this section discusses how these estimates were derived.
4.7.1 Number and value of POS card payments
The number and value of debit card payments are taken from Interac, the provider of thenational debit card scheme.27 Since these statistics include online and potentially also cash-back transactions, the estimates might slightly overestimate the use of debit cards at thePOS. Yet the 2013 MOP survey and information provided by financial institutions suggestthat the share of Interac online and cash-back transactions is small.
Statistics from the Canadian Bankers Association (CBA) were used as a basis for theestimation of the value and volume of POS credit card payments.28 Since these statisticsinclude only the number and value of Visa and MasterCard transactions, an adjustment wasmade to include American Express, using information from Nilson (2015). Furthermore,internal information was used to exclude international, online and cash-back transactions tonarrow the scope to domestic POS payments only. It should be noted that the CBA statisticscover the 2014 fiscal year (ending October 2014) instead of the calendar year. Informationto correct for this is unavailable, but the effect is assumed to be limited. Moreover, theestimates generated in this way include only Visa and MasterCard transactions reportedby CBA member banks, plus an adjustment for American Express transactions. As CBAmember banks and American Express cover the majority of the Canadian credit card market,the effect of excluding other types of credit cards is assumed to be small.29
The final number and value of credit card transactions used in this study include the useof prepaid credit cards. These statistics were estimated based on information obtained fromexternal payment service providers.
4.7.2 Number and value of POS cash payments
Because of the anonymous nature of cash transactions, generating reliable statistics on thenumber and value of cash payments made at the POS is challenging. Several methodswere explored. The RCPM survey replicated the debit and credit card values (as discussedabove) fairly well. Therefore, it was used as the basis for estimating the total value of cashpayments. In particular, the overall share of cash in total retailer sales was extrapolatedto the national level using the total value of Canadian sales at retail stores, food and drinkplaces and personal service providers, as reported by Statistics Canada. The number oftransactions was then calculated by dividing the total value by the weighted average POS
27See http://interac.ca/en/interac-debit-tab.html#transactions-merchants-terminals-dollar-value-users.28See http://www.cba.ca/credit-card-statistics.292013 MOP survey data suggest that 98 per cent of the Canadian population obtained a credit card from
a CBA member bank or directly from American Express.
16

cash transaction value from the 2013 MOP survey.30 Some of the retailers included in the2013 MOP survey had also participated in the RCPM Survey. Since a comparison of theiraverage cash transaction values from both studies showed great similarity, the values fromthe 2013 MOP survey are assumed to be a good reflection of the average cash value inCanada in 2014.
5 Key Findings
Finding 1: The costs of cash and card payments at the POS in Canada are non-negligible.Total resource costs amounted to $15.3 billion, which corresponds to 0.78 per cent of GDP.
Figure 8 summarizes the total private and resource costs broken down by payment method.The majority of costs are linked to cash and credit cards, the payment methods that accountfor the largest number and value of payments made in Canada.
Overall, the total resource costs of cash and debit cards seem to be consistent with othercountries when taking into account the underlying transaction shares (see Table 12).31 Thecosts of cash range from 0.07 per cent in Norway, where cash accounts for only about aquarter of the total transactions, to 0.49 per cent in the EU, where the large majority ofpayments are paid in cash. Similarly, the costs of debit cards vary between 0.05 per cent inAustria, where debit cards account for a small share of transactions, and 0.19 per cent inSweden, where more than half the transactions are paid by debit. For both payment meth-ods, Canada seems to be in the middle. The total resource costs of credit cards, however, arelarger in Canada than abroad. As a result, the total costs of cash and cards taken togetherare relatively high as well. This seems in line, though, with the larger number and value ofpayments made in Canada, especially credit card payments.32
Finding 2: Stakeholders incur costs in providing, accepting and using payments at thePOS and their shares vary by payment method.
Figure 9 breaks down the total private and resource costs by stakeholder. For private costs,the financial sector bears the majority of the cash costs, whereas consumers incur most ofthe costs of debit cards. The private costs of credit cards are almost equally shared betweenthe financial sector and retailers. Considering resource costs only, the largest share is borneby the financial sector, followed by retailers. This holds for each payment method. Theshare of resource costs incurred by consumers, the Bank and the Mint is limited.
The finding that the central bank and minting authority contribute least to the total
30Given the low inflation rate between 2013 and 2014, the weighted average transaction value was notadjusted for inflation.
31For comparability, the results are reported both when including and excluding consumers’ costs. Still,the studies differ in terms of methodology, the use of payment methods, and the year of study. Hence,caution should be taken when comparing the results.
32Internal calculations based on Stewart et al. (2014), Danmarks Nationalbank (2012), Jonker (2013),Norges Bank (2014) and Segendorf and Jansson (2012) suggest that the total value of cash and card paymentsas a percentage of GDP is highest in Canada, and that Canada ranks second in terms of number of cash andcard payments made per capita.
17
resource costs of cash is in line with the results found abroad (see Table 12). Also, thebreakdown of debit card and credit card costs by stakeholder is quite similar across mostcountries. The Canadian results, just like the Norwegian results, differ from the other studiesin that the largest share of the resource costs of cash is borne by financial institutions andinfrastructures, whereas in the majority of other studies, the financial sector and retailersare found to roughly carry the same share of the cash costs. The relatively high density ofATMs in Canada might be a potential explanation (see BIS (2015)).
Finding 3: Debit cards are the least costly in terms of total resource costs, followed bycredit cards, whereas cash is the most costly.
Cash
In 2014, all Canadian stakeholders together incurred a total private cost of $8,808 mil-lion for providing and using cash (see Table 7). Financial institutions and infrastructuresmade up the largest share with $3,944 million. Their main cost drivers related to providingover-the-counter and ATM services. The retail sector incurred a total cost of $2,384 million,with the main cost driver being the back-office time spent on cash activities. About a quarterof the total costs of cash was carried by consumers: $2,240 million. The lion’s share camefrom withdrawal fees, followed by time spent on obtaining cash and using it at the POS. Thetotal private costs of the Bank and the Mint were $239 million, most of which was relatedto the production of bank notes and coins.
Column 4 in Table 7 isolates the fees paid by stakeholder. Those of the Bank and Mintrefer to charges paid for the distribution of bank notes and coins. Financial institutions andinfrastructures also paid transportation fees, on top of interchange fees for cash withdrawals.Retailers’ fees included transportation fees as well as withdrawal and deposit fees to financialinstitutions. Given the low interest rates in 2014, forgone interest on outstanding cashbalances constituted a limited share of retailers’ transfers. Fees made up a large part ofconsumers’ private costs. These mainly included withdrawal fees and to a lesser extent theopportunity costs of holding cash on hand instead of in an interest-bearing account.
While the private costs help to understand the behaviour of individual stakeholders, froma social cost-efficiency perspective, the total resource costs are more informative. Subtract-ing the fees from the private costs (Column 5) shows that the total resources consumed bysociety as a whole were $6,811 million. With a total of $222 million, the Bank and theMint contributed fewest resources. Consumers also provided relatively few resources ($790million), which mainly included their cost of time. The majority of resources were consumedby financial institutions and infrastructures ($3,818 million), followed by retailers ($1,980million). The resources provided by financial institutions were mainly used for providingover-the-counter and ATM-related services, whereas retailers’ main costs were time spentreceiving payments and performing back-office activities.
Debit cards
The total private cost incurred for debit cards was $5,963 million (see Table 8). Almost halfwas borne by consumers—$2,883 million—in the form of debit card transaction fees paid to
18

financial institutions. The remaining private costs were almost equally shared between thefinancial sector and retailers, amounting to $1,594 million and $1,486 million, respectively.The costs to financial institutions were mainly related to the provision and processing ofpayments and the management of chequing accounts. The main costs for retailers includedacquiring fees and time spent on receiving payments and back-office tasks.33
Fees (Column 4) make up the majority of consumers’ private costs and a significant shareof those of retailers. In addition to acquiring fees, retailers’ fees also included rental fees anddepreciation costs for debit card terminals. Fees paid by financial institutions, mainly toother financial institutions, are limited.
Column 5 demonstrates that the total resource cost of debit cards was $2,777 million,which is less than half of total private costs. The contribution of consumers to total resourcecosts is relatively small. The resources they provided amounted to $303 million and mostlyrelated to the time spent at the POS making payments. By contrast, financial institutionsand infrastructures contributed most resources ($1,583 million) for the provision of debitcard services and the underlying chequing accounts. Retailers’ contributions to total re-source costs amounted to $891 million, which was mainly driven by the time spent receivingpayments and performing back-office activities.34
Credit cards
The total private cost of credit cards, including prepaid credit cards, was nearly $13,469million (see Table 9).35 The costs were almost equally shared between the financial sectorand retailers, with $6,868 million and $6,202 million, respectively. The costs of reward pro-grams constituted a considerable share of the costs for the financial sector, whereas acquirerfees were the main driver of the costs for the retail sector. The private costs of consumersamounted to $399 million and mainly consisted of annual credit card fees and the timeneeded at the POS for making a payment.
The fees in Column 4 show that they make up a significant part of stakeholders’ privatecosts, especially those of retailers. Retailers mainly paid acquirer fees, but also incurredtransfer costs for charge-backs and renting or owning card terminals. The fees paid by thefinancial sector mainly referred to loyalties paid out to consumers. Consumers did not payper-transaction fees for credit cards, but paid annual fees for holding a card. Their cost offorgone interest on outstanding prepaid credit card balances was limited.
When excluding the fees, Column 5 shows that the total resources used by society forcredit cards amounted to $5,705 million. With a total of $176 million, consumers contributedfewest resources, which mainly included their transaction time at the counter. The majorityof resource use was incurred by the financial sector ($4,757 million).36 Retailers accounted
33Due to the level of aggregation of the data received from financial institutions, a further breakdown byactivity is unavailable.
34Because of the level of aggregation of the data received from financial institutions, a further breakdownby activity is unavailable.
35Given the relatively low usage of prepaid credit cards, their contribution to total credit card costs isassumed to be limited. The data set does not allow for a breakdown of prepaid credit card costs for retailers,but prepaid credit cards accounted for approximately 10 per cent and 1 per cent of consumers’ and financialinstitutions’ credit card costs, respectively.
36Because of the level of aggregation of the data received from financial institutions, a breakdown by
19
for $772 million of total resource costs, mainly in terms of time spent receiving paymentsand performing back-office activities.
Finding 4: On average, debit cards are the least costly in terms of resource costs per trans-action (volume) as well as resource costs per dollar transacted (value). Credit cards carrythe highest resource cost per transaction, while cash is most costly in terms of resource costsper dollar transacted.
Given that the total resource costs of payment methods are strongly affected by the numberof transactions made, it is useful to look at the average resource costs per transaction whencomparing different methods of payment from a social cost-efficiency perspective (see Ta-ble 10). On average, debit card transactions carry the lowest resource cost per transaction($0.57), followed by cash ($0.84). Credit cards have the highest per-transaction cost ($1.92).The finding that credit card costs are higher than those of debit cards is consistent withthe fact that the provision of credit cards involves activities that are not required for debitcards, such as credit risk analyses, management of reward programs and chargebacks andprovision of credit card statements.
Other studies also demonstrate that debit cards carry the lowest resource per-transactioncost, followed by cash. The study conducted in the EU is an exception, which might beexplained by the relatively high cash usage in some of the participating EU countries. Also,in Australia, some debit card schemes turned out to be more costly than cash. Lookingat average costs per transaction, Canada is among the middle-ranking for each paymentmethod.
Although credit cards are most costly in terms of average resource costs per transaction,cash payments are most expensive when comparing the costs with the value of transactionsmade. The last row of the upper panel of Table 10 shows the total resource costs as apercentage of the total transaction value of each payment method. Overall, for every cashtransaction made, 4.7 per cent of the transaction value was spent on resources to enable,make and accept payment. For credit cards, the resource costs made up 2.2 per cent of thevalue of each transaction, whereas again it was lowest for debit cards (1.3 per cent).
Finding 5: Considering variable resource costs per transaction, cash is cheapest for trans-actions up to $6, while debit cards are the least costly for transactions larger than $6.
Cash and card payments are commonly known to be subject to economies of scale andscope. Therefore, it is useful to also look at the variable costs of payment instruments.Moreover, the costs of payments depend on the size of the payment. Table 11 breaks downthe total resource costs by fixed and variable costs, which allows for a calculation of thevariable resource costs per transaction at any possible transaction value. The composition offixed and variable costs strongly differs across payment methods. The costs of cash includea significant fixed portion (45 per cent), which mainly consists of fixed costs incurred by thefinancial sector related to cash handling and the provision of ATM and counter services. Theremainder of the cash costs varies with both the number and value of cash payments made
activity is unavailable.
20

in the economy. The total resource costs of debit cards also contain a considerable fixedcomponent, but mainly vary with the number of transactions made (57 per cent), especiallybecause of the time spent by consumers and retailers making and receiving payments. Theresource costs of credit cards are largely affected by the size of the payments (35 per cent).Credit card costs that vary with the size of the payment include the costs of fraud preventionand losses for retailers and financial institutions. Moreover, the resource costs of credit cardschemes and processors are assumed to depend on the size of the payments, as their feescharged to retailers and the financial sector are used as a proxy for these costs.
As explained in further detail in Box 3, the breakdown between transaction-linked andvalue-linked variable costs allows for the calculation of the variable resource costs of makingone additional payment for every transaction value. These are depicted in Figure 10. Thevariable resource costs of debit cards hardly vary with the transaction value, while those ofcash and credit cards increase with the size of the transaction. Because of these differingcost structures, the cost lines intersect at two points, which indicate the threshold valuesabove which one payment method becomes more costly than the other when looking at thesociety as a whole. Threshold A suggests that cash is the least costly payment instrumentfor transactions up to $6. For transactions higher than $6, debit cards carry the lowestresource cost. Threshold B indicates that cash becomes more costly than credit cards fortransactions higher than $80.73.
21

Box 3: Calculation of variable resource costs per transaction
The breakdown between transaction-linked variable costs (TV C) and value-linked vari-able costs (V V C) as presented in Table 11 allows for the calculation of the followingindices:
• Costs related to making one additional payment with payment method j irrespec-tive of its value: aj = TV Cj/Nj, with TV Cj representing the total transaction-linked variable costs of payment method j and Nj being the total number of trans-actions made with it.
• Costs related to using payment method j for transacting one additional dollar insales: bj = V V Cj/Vj, with V V Cj representing the total value-linked variable costsof payment method j and Vj being the total value of transactions made with it.
See bottom of Table 11 for the a and b of each payment method.
The concept of transaction-linked variable costs and value-linked variable costswas first introduced by Brits and Winder (2005) and later used in many othercost-of-payment studies. Following the same approach, one can calculate the vari-able costs of making one additional transaction (V CT ) for every transaction value (TV ):
V CT = a + (b ∗ TV ) (1)
These variable costs (VCT ) reflect the costs of making one additional transaction, whileassuming that all fixed costs have already been paid for. In other words, it shows howmuch one additional payment would cost if the underlying infrastructure is already inplace. For example, assuming that the payment terminals and underlying networks arealready there, one additional transaction of $20 would cost $0.48 if paid in cash (a, b,TV = 0.257, 0.011, 20) or $0.34 if paid by debit card (a, b, TV = 0.321, 0.001, 20).
The exact threshold amounts are sensitive to the underlying composition of fixed and variablecosts. Especially for cash, the current breakdown of variable costs into transaction-related(56 per cent) and value-related (44 per cent) components is not straightforward and requiressome assumptions. For example, it is difficult to determine what share of the costs of per-sonnel working at bank branches increases with the number of cash payments and whatshare is related to the value of the payments. Therefore, we perform some scenario analyses.Figure 11 and Figure 12 show how the turnaround points change when decreasing (increas-ing) the share of the value-related portion of cash by 10 percentage points. The thresholdamount between cash and debit card decreases (increases) to $3 ($9). The turnaround pointafter which cash becomes more costly than credit cards from a society’s perspective is moresensitive. Decreasing (increasing) the value-related costs of cash would increase (decrease)
22

the threshold amount to $201.61 ($54.23). In both cases, the conclusion that debit cards arecheapest, except for very small-value transactions, remains unchanged.37
Because of differences in methodology, the use of payment methods and the year of study,one should be careful when comparing the threshold values found in other countries (see Ta-ble 12). Yet all studies conclude that, from a resource cost perspective, cash is the leastcostly payment method for the smallest transactions. For all other transaction values, debitcards are found to be least costly.
Finding 6: If stakeholders make their payment choices based on their private costs alone,consumers would prefer to use credit cards, while retailers and financial institutions wouldprefer debit card payments.
What is least costly from a social perspective might not always be preferred by individualstakeholders, to whom private costs are often more important. Hence, a discrepancy betweenprivate and total resource costs may lead to an overuse of payment instruments that carrya higher resource cost, or an underuse of those with lower resource costs if stakeholders’decisions are driven purely by their private costs.
Figure 13 depicts, for each stakeholder, the variable private costs of each payment methodby transaction size. Figure 13a and Figure 13b show that, regardless of the transaction size,credit cards are most costly for both the financial sector and retailers. Debit cards are leastcostly for them, except for small-value transactions, when cash is cheapest. The turnaroundpoint lies near $5.50 for the financial sector. For retailers, debit cards are cheaper than cashfor transactions over $20.13, which is in line with the results found in the Bank of Canada2006 Survey of Merchants (see Box 4).
For consumers, the variable private costs are substantially different. Figure 13c showsthat they bear the highest private costs for debit cards, except for transactions over $77.87,when cash is most expensive. Consumers’ private costs of credit cards do not vary with thetransaction size, as they mainly consist of the time costs of making a payment. Also, theircosts for credit cards are lower than those of cash and debit cards, no matter the size of thetransaction. Although other factors might also come into play, such as the benefits related toeach method, the finding that credit cards and cash are least costly for consumers suggeststhat consumers would prefer to use these two payment methods when considering only theirprivate costs. This is consistent with the observation that credit cards and cash constitutea major share of POS transactions in Canada.
Although debit cards carry the lowest private costs for retailers for transactions over $20,only two-thirds of small and medium-sized retailers accept them, and the acceptance of creditcards is almost the same (see Box 5). This might indicate that not only variable costs but alsofixed costs are important for retailers. Since smaller retailers tend to have a lower number oftransactions, their average fixed costs of, for example, card terminals, might prevent themfrom accepting debit card payments. Another explanation of the relatively low debit cardacceptance might lie in the fact that costs are not the only driver of retailers’ decisions.Debit card acceptance might also be influenced by the payment methods that consumers
37Further analyses showed that the value-related portion of cash will have to decrease by 14 percentagepoints before debit cards become cheaper than cash for every transaction size.
23

prefer, even if retailers incur a higher cost. To further understand consumer and retailerbehaviour, further research would be useful, especially on the interaction between both sidesof the market. Such work, however, would need to take into account that one’s paymentbehaviour not only depends on costs, but also on related revenues and benefits. Consumers,for example, might receive rewards when using a credit card or desire the anonymity ofusing cash, whereas retailers might experience increased sales when accepting credit cardpayments. Therefore, further research into the benefits of payments is recommended tobetter understand how costs affect the use and acceptance of payment methods.
Box 4: The Bank of Canada 2006 Survey of Merchants
In 2006, the Bank of Canada conducted a survey of over 500 Canadian merchants ontheir accepted means of payment (see Arango and Taylor (2008)). Along with questionsabout perceptions of costs, they were asked to report some of their actual costs.
The 2006 study found that, for a transaction of $36.50, debit card payments had thelowest variable private costs ($0.19), followed by cash ($0.25) and credit cards ($0.82).Also, the study concluded that cash was cheaper than credit cards for all transactionvalues and that cash was less costly than debit cards for smaller transaction values only.The turnaround point at which cash became more costly than debit cards varied between$12.60 and $51.30, depending on the level of debit card fees paid (Arango and Taylor(2008-2009)).
Because of differences in methodology and scope, the estimated costs and turnaroundpoints from the 2006 study cannot be directly compared with those found in the currentstudy. For example, the cost calculations in 2006 were based on information from asubsample of 35 respondents, whereas the current study is based on a sample size ofaround 1,000 retailers. Arango and Taylor (2008) caution against a generalization of thesurvey findings owing to a high margin of error (see also Welte (2017) for a descriptionof the methodological differences between the two studies). Moreover, because of thelack of data, the 2006 study did not include all costs, such as cash transportation orcard-fraud-related costs, and for some costs other countries’ estimates were taken as aproxy, such as tender times, which were taken from the Netherlands.
Although caution should be taken when comparing the estimates, both studies arriveat the same conclusion that the costs of accepting different payment methods vary bytransaction value, and that debit cards are least costly except for small-value transac-tions, for which cash is cheapest. Moreover, in both studies, credit cards are found tobe most expensive for retailers, irrespective of the transaction value.
The 2006 study suggested that the costs of accepting different payment methods varyby merchant. A breakdown of the costs by size of merchant is out of scope of the currentstudy, but will become available under separate cover on the Bank’s website.
24

Box 5: Acceptance of payment methods in 2014
The RCPM survey shows that cash is widely accepted in Canada, whereas card accep-tance increases with business size; 68 per cent and 67 per cent of small and medium-sizedretailers accept debit cards and credit cards, respectively,a as opposed to nearly 100 percent of large retailers and chains (see Table 1).b
Table 1: Acceptance of payment methods in 2014, in per centCash Debit card Credit card
Small and medium independent retailers 94 68 67Large independent retailers and chains 98 97 98
aThe majority of retailers accept either both cards or no cards at all.bThe shares for small and medium-sized independent retailers are weighted and representative of all
small and medium-sized retailers in Canada. The shares for large retailers and retail chains reflect theaverage sample shares, which may not be fully representative.
6 Conclusion and Discussion
This study shows that the costs of POS payments in Canada are broadly consistent withfindings elsewhere that the costs of cash and card payments are non-negligible and that froma resource cost perspective, debit cards are the least costly payment instrument, except forthe smallest transactions, when cash is cheapest. Although the key findings are broadly inline with the results abroad, the specificities of the retail payments market and differencesin terms of methodology help to explain some of the main differences.
While total resource costs are most relevant from a social cost-efficiency perspective,private costs are more informative for understanding the behaviour of individual stakeholders.The study demonstrates that if they make their payment choices based on their private costsalone, consumers would prefer to use credit cards, while retailers and financial institutionswould prefer debit card payments.
It is important to recognize that the focus of the study was solely on costs, and onlythose that can be measured. However, stakeholders’ decisions of which payment instrumentsto provide, accept or use also depends on the overall revenues and benefits those instrumentsgenerate. For example, the provision of cash services may enable banks to attract and main-tain clientele, which in turn allows them to generate revenues from other banking products.Similarly, despite the relatively high costs, retailers may find it beneficial to accept creditcards if this leads to higher sales. Therefore, to better understand the overall efficiency ofpayment methods as well as the drivers of the use and acceptance of payments, further workon the benefits and revenues is recommended. Moreover, the estimates in this study dateback to 2014, and these estimates may now be different because of changes in the paymentsenvironment, such as further growth in the use of contactless debit and credit card paymentsand ongoing efforts by financial institutions to reduce costs, such as decreasing the number
25

of bank branches or promoting mobile payments among customers.This is the first comprehensive study on the cost of payments in Canada, and it provides
an objective measure of the costs of cash and card payments at the POS. The results allowfor exploration of how these costs could potentially be reduced. Also, the study enables anunderstanding of how these costs compare with costs in other countries. The study collecteda rich data set from retailers on the costs and acceptance of payment methods. This data setcan be used together with the Bank’s MOP survey to conduct further research to improveour understanding of the interaction between consumer and retailer payment choices.
26

References
Abele, H. A., and Schaefer, G. K. 2016. “The Cost of Cash and Debit Cards in Austria.”Journal of Financial Market Infrastructures 4 (4): 1–16.
Arango, C., Huynh, K. P., Fung, B., and Stuber, G. 2012. “The Changing Landscape forRetail Payments in Canada and the Implications for the Demand for Cash.” Bank ofCanada Review (Autumn): 31–40.
Arango, C., Huynh, K. P., and Sabetti, L. 2015. “Consumer Payment Choice: Merchant CardAcceptance Versus Pricing Incentives.” Journal of Banking and Finance 55 : 130–141.
Arango, C., and Taylor, V. 2008. “Merchant Acceptance, Costs, and Perceptions of RetailPayments: A Canadian Survey.” Bank of Canada Staff Discussion Paper No. 2008–12.
Arango, C., and Taylor, V. 2008-2009. “Merchants’ Costs of Accepting Means of Payment:Is Cash the Least Costly?” Bank of Canada Review (Winter): 17–25.
Arango, C., and Welte, A. 2012. “The Bank of Canada’s 2009 Methods-of-Payment Survey:Methodology and Key Results.” Bank of Canada Staff Discussion Paper No. 2012–6.
Bagnall, J., Bounie, D., Huynh, K. P., Kosse, A., Schmidt, T., Schuh, S., and Stix, H.2016. “Consumer Cash Usage: A Cross-Country Comparison with Payment Diary SurveyData.” International Journal of Central Banking 12 (4): 1–62.
BIS 2015. “Statistics on Payment, Clearing and Settlement Systems in the CPMI Countries,Figures for 2014.” http://www.bis.org/cpmi/publ/d142.pdf.
Boyce, J. 2015. “Police-reported crime statistics in Canada, 2014.” http://www.statcan.
gc.ca/pub/85-002-x/2015001/article/14211-eng.htm.
Brits, H., and Winder, C. 2005. “Payments are No Free Lunch.” DNB Occasional Studies302, Netherlands Central Bank, Research Department.
Carbo-Valverde, S., and Perez-Saiz, H. Forthcoming. “The Pricing of Financial Products inRetail Banking: Competition, Geographic Proximity, and Credit Limits.” Bank of CanadaStaff Discussion Paper.
Chen, H., Felt, M.-H., and Huynh, K. P. 2017. “Retail Payment Innovations and Cash Usage:Accounting for Attrition by Using Refreshment Samples.” Journal of the Royal StatisticalSociety: Series A (Statistics in Society) 180 (3): 503–530.
Chen, H., and Shen, R. Q. 2017. “The Bank of Canada 2015 Retailer Survey on the Cost ofPayment Methods: Calibration for Single-Location Retailers.” Bank of Canada TechnicalReport No. 109.
Conference Board of Canada 2013. “Burglaries.” http://www.conferenceboard.ca/hcp/
details/society/burglaries.aspx.
27

Danmarks Nationalbank 2012. “Costs of Payments in Denmark.” Danmarks NationalbankPapers.
Dillman, D. A., Smyth, J. D., and Christian, L. M. 2008. Internet, Mail, and Mixed-ModeSurveys: The Tailored Design Method. John Wiley & Sons, 3rd edn.
European Commission 2015. “Survey on Merchants’ Costs of Processing Cash and CardPayments, Final Results.” European Commission, Directorate-General for Competition.
Fung, B., Huynh, K. P., and Sabetti, L. 2014. “The Impact of Retail Payment Innovationson Cash Usage.” Journal of Financial Market Infrastructures 3 (1): 1–29.
Fung, B., Huynh, K. P., and Stuber, G. 2015. “The Use of Cash in Canada.” Bank of CanadaReview (Spring): 45–56.
Garcia-Swartz, D. D., Hahn, R. W., and Layne-Farrar, A. 2006. “The Move Toward aCashless Society: Calculating the Costs and Benefits.” Review of Network Economics5 (2): 1–30.
Hatko, S. 2017. “The Bank of Canada 2015 Retailer Survey on the Cost of Payment Methods:Nonresponse.” Bank of Canada Technical Report No. 107.
Hayashi, F., and Keeton, W. R. 2012. “Measuring the Costs of Retail Payment Methods.”Economic Review Q II.
Henry, C. S., Huynh, K. P., and Shen, Q. R. 2015. “2013 Methods-of-Payment SurveyResults.” Bank of Canada Staff Discussion Paper No. 2015–4.
Huynh, K. P., Schmidt-Dengler, P., and Stix, H. 2014. “The Role of Card Acceptance in theTransaction Demand for Money.” Bank of Canada Staff Working Paper No. 2014–44.
Jiongo, V. D. 2017. “The Bank of Canada 2015 Retailer Survey on the Cost of PaymentMethods: Estimation of the Total Private Cost for Large Businesses.” Bank of CanadaTechnical Report No. 110.
Jonker, N. 2013. “Social Costs of POS Payments in the Netherlands 2002-2012: EfficiencyGains From Increased Debit Card Usage.” DNB Occasional Studies, no. 11-2.
Koenker, R. 2005. Quantile Regression. Cambridge University Press.
Koenker, R., and Bassett, G. 1978. “Regression Quantiles.” Econometrica: Journal of theEconometric Society 46 (1): 33–50.
Kruger, M., and Seitz, F. 2014. “Costs and Benefits of Cash and Cashless Payment Instru-ments.” Study commissioned by the Deutsche Bundesbank.
Nilson 2015. “The Nilson Report.” April 2015, Issue 1061, https://www.nilsonreport.
com/.
Norges Bank 2014. “Costs in the Norwegian Payment System.” Norges Bank Papers, no. 5.
28

Polasik, M., Gorka, J., Wilczewski, G., and Przenajkowska, K. 2010. “Time Efficiency OfPoint-Of-Sale Payment Methods: Preliminary Results.” Journal of Internet Banking andCommerce 15 (3): 1–11.
Royal Canadian Mounted Police 2016. “Currency Counterfeiting Statistics.” http://www.
rcmp-grc.gc.ca/count-contre/cur-mon-eng.htm.
Schmiedel, H., Kostova, G., and Ruttenberg, W. 2013. “The Social and Private Costs ofRetail Payment Instruments: a European Perspective.” Journal of Financial Market In-frastructures 2 (1): 37–75.
Schwartz, C., Fabo, J., Bailey, O., and Carter, L. 2008. “Payment Costs in Australia.” InPayments System Review Conference, 88–138.
Segendorf, B. L., and Jansson, T. 2012. “The Cost of Consumer Payments in Sweden.”Sveriges Riksbank Research Paper Series, no. 262.
Stewart, C., Chan, I., Ossolinski, C., Halperin, D., and Ryan, P. 2014. “The Evolution ofPayment Costs in Australia.” Reserve Bank of Australia Research Discussion Papers, no.2014-14.
Tompkins, M. 2015. “Canadian Payment Methods and Trends: 2015.” Canadian PaymentAssociation Discussion Paper, no. 2015-4.
Wakamori, N., and Welte, A. 2017. “Why Do Shoppers Use Cash? Evidence from ShoppingDiary Data.” Journal of Money, Credit and Banking 49 (1): 115–169.
Welte, A. 2017. “The Bank of Canada 2015 Retailer Survey on the Cost of Payment Methods:Sampling.” Bank of Canada Technical Report No. 108.
29
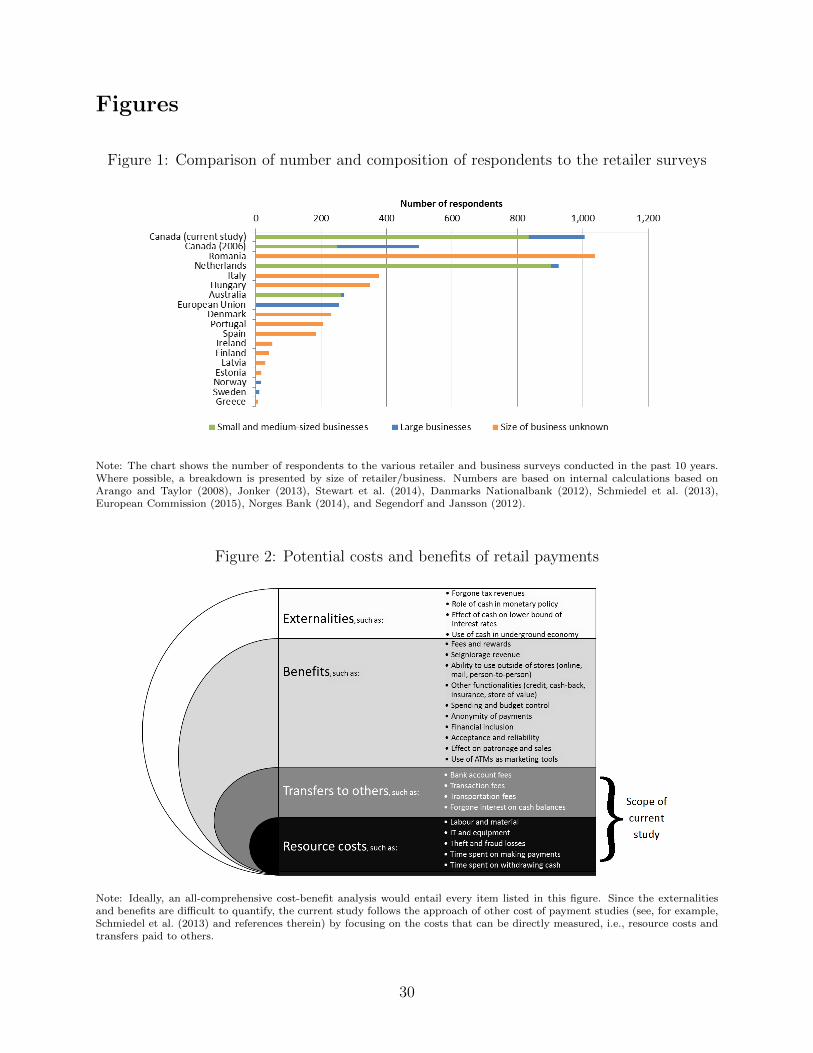
Figures
Figure 1: Comparison of number and composition of respondents to the retailer surveys
Note: The chart shows the number of respondents to the various retailer and business surveys conducted in the past 10 years.Where possible, a breakdown is presented by size of retailer/business. Numbers are based on internal calculations based onArango and Taylor (2008), Jonker (2013), Stewart et al. (2014), Danmarks Nationalbank (2012), Schmiedel et al. (2013),European Commission (2015), Norges Bank (2014), and Segendorf and Jansson (2012).
Figure 2: Potential costs and benefits of retail payments
Note: Ideally, an all-comprehensive cost-benefit analysis would entail every item listed in this figure. Since the externalitiesand benefits are difficult to quantify, the current study follows the approach of other cost of payment studies (see, for example,Schmiedel et al. (2013) and references therein) by focusing on the costs that can be directly measured, i.e., resource costs andtransfers paid to others.
30
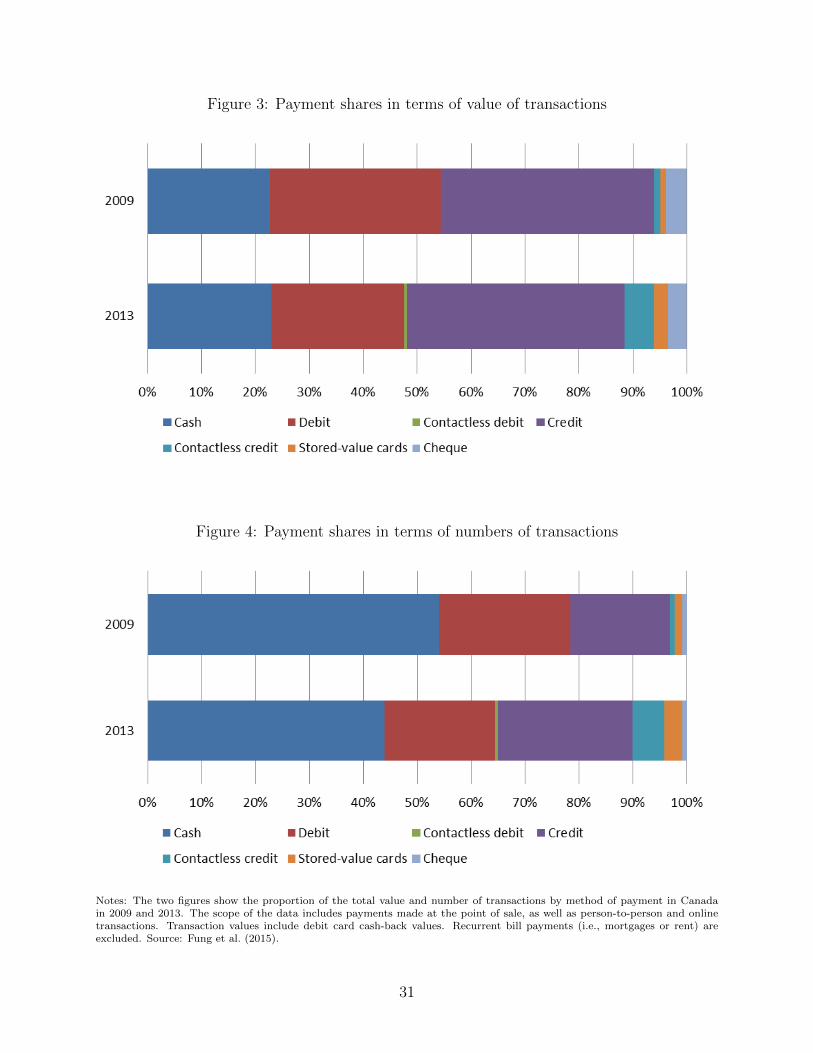
Figure 3: Payment shares in terms of value of transactions
Figure 4: Payment shares in terms of numbers of transactions
Notes: The two figures show the proportion of the total value and number of transactions by method of payment in Canadain 2009 and 2013. The scope of the data includes payments made at the point of sale, as well as person-to-person and onlinetransactions. Transaction values include debit card cash-back values. Recurrent bill payments (i.e., mortgages or rent) areexcluded. Source: Fung et al. (2015).
31

Figure 5: Stakeholders covered in current study
Notes: The banks and credit unions surveyed for this study cover about 96 per cent of all debit card transactions made inCanada, and approximately 78 per cent of all regular credit card payments and 94 per cent of all prepaid credit card transactions.Their costs have been scaled up to the national level based on the number and value of cash withdrawals and card payments.The final sample of small and medium-sized independent retailers provides good coverage of small and medium-sized retailstores, food and drink places and personal service providers in Canada in terms of industry and region. Survey weights are usedto extrapolate the results to the national level. The large independent retailers and headquarters studied represent about 41 percent and 18 per cent of the total turnover in the Canadian retail and restaurant sectors, respectively, and calibration methodswere used for the scale-up. The consumer portion of the study uses data from the Bank’s 2013 Methods-of-Payment Survey,which is representative of the Canadian population aged 18 years and older. The two cash transportation companies surveyedcover basically the entire Canadian cash transportation market. Other infrastructure providers were not directly surveyed, butcaptured through the information collected from the retail and financial sectors.
32

Figure 6: Overview of related Bank of Canada Technical Reports
Note: This figure provides an overview of the Bank of Canada Technical Reports associated with the current study. Welte(2017) describes and discusses the sampling methodology used in the RCPM survey, including recommendations for samplingstrategies in future retailer surveys. Chen and Shen (2017) describe the creation of calibrated weights for the RCPM surveyin order to reduce the nonresponse bias and coverage error and to make the weighted sample estimates consistent with thetarget population. Hatko (2017) provides a detailed description of the analyses undertaken for nonresponse among small andmedium-sized independent retailers in the RCPM survey and Jiongo (2017) describes the imputation and calibration methodsused for the large retailers sample.
33

Figure 7: Median transaction duration by payment method (in seconds)
Note: Data taken from the Bank of Canada 2014 Time Duration Study. The chart presents the median transaction durationsand the 95 per cent confidence intervals by payment method as estimated using a quantile regression model. The swipetechnology, which is hardly used anymore, requires customers to swipe the magnetic stripe of their card through the terminal.Debit card swipe transactions require a PIN, whereas a signature is requested for credit card swipe transactions.
34

Figure 8: Total private and resource costs (in millions)
Note: This figure presents the total private and resource costs incurred in 2014 by the stakeholders covered in the study. Privatecosts include both resource costs and transfers paid to others. Percentage of GDP is based on gross domestic product at mar-ket prices in 2014 as reported by Statistics Canada on http://www.statcan.gc.ca/tables-tableaux/sum-som/l01/cst01/econ04-eng.htm. Credit card costs include the costs of prepaid credit cards.
Figure 9: Total costs by stakeholder (in millions)
Note: This figure presents a breakdown of the total private and resource costs by stakeholder. Private costs include bothresource costs and transfers paid to others. Credit card costs include the costs of prepaid credit cards.
35

Figure 10: Variable resource costs per transaction by transaction value (Can$)
Note: This figure presents the variable resource costs of cash, debit card and credit card payments (VCT ) for various transactionvalues (TV ). They are calculated based on the costs of one additional transaction (a) and the costs for Can$1 in additionalsales (b) as listed in Table 11 using the following formula: (VCT ) = (a) + (b)*(TV ). Hence, they are based on the assumptionthat 44 per cent of the variable resource costs of cash are related to the transaction value, while 56 per cent vary with thenumber of transactions. Threshold A demonstrates that cash is more expensive than debit cards for transactions higher than$6.08 and Threshold B shows that cash is more expensive than credit cards for payments higher than $80.73.
36

Figure 11: Scenario 1—Decrease of share of value-related variable costs of cash (Can$)
Figure 12: Scenario 2—Increase of share of value-related variable costs of cash (Can$)
Note: The above graphs present the variable resource costs of cash, debit card and credit card payments (VCT ) for varioustransaction values (TV ). The solid lines equal the benchmark situation as depicted in Figure 10. These are based on theassumption that 44 per cent of the variable resource costs of cash vary with the value of transactions. The dashed lines depictthe costs of cash assuming that 35 per cent (Figure 11) and 55 per cent (Figure 12) of its variable resource costs are related tothe transaction value. In Figure 11, the slope of the cash cost curve decreases compared with the benchmark situation. As aresult, the threshold after which cash becomes more costly than debit cards decreases from A to A’, while the threshold afterwhich cash becomes more expensive than credit cards rises from B to B’. In Figure 12, the slope of the cash curve increases,which causes the cash/debit threshold to increase to A”, while the cash/credit threshold falls to B”.
37

Figure 13: Variable private costs per transaction by transaction value (Can$)
(a) Financial institutions and infrastructures
(b) Retailers
(c) Consumers
Note: The figures present the variable private costs of cash, debit card and credit card payments for financial institutions,retailers and consumers. Private costs include all variable resource costs plus all variable fees paid to others. Note that theexact threshold values strongly depend on the underlying composition of fixed and variable costs. The presented turnaroundpoints are therefore only indicative.
38
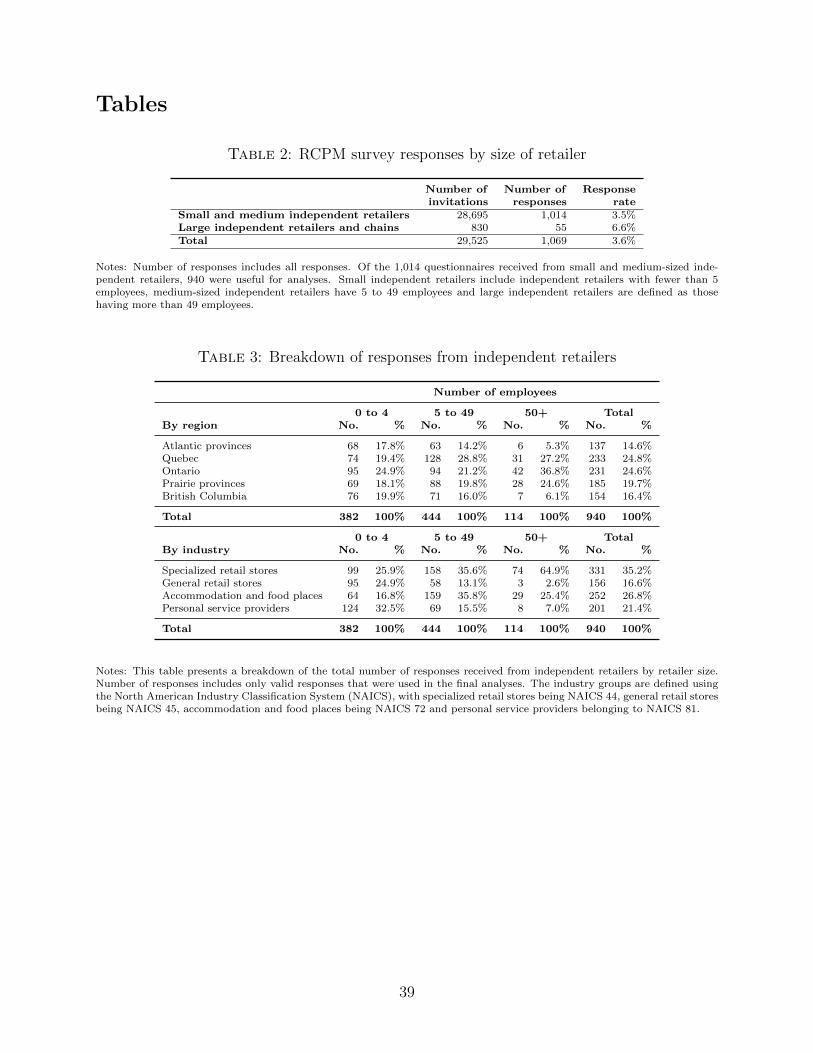
Tables
Table 2: RCPM survey responses by size of retailer
Number of Number of Responseinvitations responses rate
Small and medium independent retailers 28,695 1,014 3.5%Large independent retailers and chains 830 55 6.6%Total 29,525 1,069 3.6%
Notes: Number of responses includes all responses. Of the 1,014 questionnaires received from small and medium-sized inde-pendent retailers, 940 were useful for analyses. Small independent retailers include independent retailers with fewer than 5employees, medium-sized independent retailers have 5 to 49 employees and large independent retailers are defined as thosehaving more than 49 employees.
Table 3: Breakdown of responses from independent retailers
Number of employees
0 to 4 5 to 49 50+ TotalBy region No. % No. % No. % No. %
Atlantic provinces 68 17.8% 63 14.2% 6 5.3% 137 14.6%Quebec 74 19.4% 128 28.8% 31 27.2% 233 24.8%Ontario 95 24.9% 94 21.2% 42 36.8% 231 24.6%Prairie provinces 69 18.1% 88 19.8% 28 24.6% 185 19.7%British Columbia 76 19.9% 71 16.0% 7 6.1% 154 16.4%
Total 382 100% 444 100% 114 100% 940 100%
0 to 4 5 to 49 50+ TotalBy industry No. % No. % No. % No. %
Specialized retail stores 99 25.9% 158 35.6% 74 64.9% 331 35.2%General retail stores 95 24.9% 58 13.1% 3 2.6% 156 16.6%Accommodation and food places 64 16.8% 159 35.8% 29 25.4% 252 26.8%Personal service providers 124 32.5% 69 15.5% 8 7.0% 201 21.4%
Total 382 100% 444 100% 114 100% 940 100%
Notes: This table presents a breakdown of the total number of responses received from independent retailers by retailer size.Number of responses includes only valid responses that were used in the final analyses. The industry groups are defined usingthe North American Industry Classification System (NAICS), with specialized retail stores being NAICS 44, general retail storesbeing NAICS 45, accommodation and food places being NAICS 72 and personal service providers belonging to NAICS 81.
39

Table 4: Number and value of POS payments made in Canada in 2014
Cash Debit cards Credit cards
Total no. of POS transactions (in millions) 8,104 4,900 2,978Total value of POS transactions (in Can$ millions) $145,951 $211,000 $259,672
Average transaction amount (in Can$) $18.01 $43.06 $87.19
Notes: Numbers and values include only domestic POS transactions. Cash estimates are based on information from the RCPMsurvey, the Bank’s 2013 MOP survey and Statistics Canada. Debit and (prepaid) credit card statistics are based on informationfrom Interac, the Canadian Bankers Association, Nilson and individual market participants.
Table 5: Private costs of cash, debit card and credit card payments (in Can$ millions)
Cash Debit cards Credit cards Total
Bank of Canada and Royal Canadian Mint $ 239 $ - $ - $ 239Financial institutions and infrastructures $ 3,944 $ 1,594 $ 6,868 $ 12,406Retailers $ 2,384 $ 1,486 $ 6,202 $ 10,073Consumers $ 2,240 $ 2,883 $ 399 $ 5,522
Total $ 8,808 $ 5,963 $ 13,469 $ 28,240
% Share in total costs 31% 21% 48% 100%% GDP 0.446% 0.302% 0.683% 1.431%
Notes: This table presents the total private costs of each payment method. It is generated by adding together the privatecosts from Table 7, Table 8 and Table 9. Percentage of GDP is based on gross domestic product at market prices in 2014 asreported by Statistics Canada on http://www.statcan.gc.ca/tables-tableaux/sum-som/l01/cst01/econ04-eng.htm. Credit cardcosts include the costs of prepaid credit cards.
Table 6: Resource costs of cash, debit card and credit card payments (in Can$ millions)
Cash Debit cards Credit cards Total
Bank of Canada and Royal Canadian Mint $ 222 $ - $ - $ 222Financial institutions and infrastructures $ 3,818 $ 1,583 $ 4,757 $ 10,158Retailers $ 1,980 $ 891 $ 772 $ 3,643Consumers $ 790 $ 303 $ 176 $ 1,270
Total $ 6,811 $ 2,777 $ 5,705 $ 15,293
% Share in total costs 45% 18% 37% 100%% GDP 0.345% 0.141% 0.289% 0.775%
Notes: This table presents the total resource costs of each payment method. It is generated by adding together the resourcecosts from Table 7, Table 8 and Table 9. Percentage of GDP is based on gross domestic product at market prices in 2014 asreported by Statistics Canada on http://www.statcan.gc.ca/tables-tableaux/sum-som/l01/cst01/econ04-eng.htm. Credit cardcosts include the costs of prepaid credit cards.
40

Table 7: The private and resource costs of cash (in Can$ millions)
Private costs Share in Fees paid Resource costs Share intotal private total
costs resource costs
The Bank and the Mint $ 239 3% $ 17 $ 222 3%Financial inst. and infr. $ 3,944 45% $ 125 $ 3,818 56%Retailers $ 2,384 27% $ 404 $ 1,980 29%Consumers $ 2,240 25% $ 1,450 $ 790 12%
Total $ 8,808 100% $ 1,997 $ 6,811 100%
Notes: This table presents the private and resource costs of cash incurred by each stakeholder in 2014. The sum of the resourcecosts constitutes the total use of resources by society as a whole. The costs for the Bank of Canada, Royal Canadian Mint andfinancial sector include all costs related to the issuance and provision of cash, irrespective of how the cash was finally used bythe public. Part of this cash may have been used for purposes other than POS payments, so the total costs may overstate thecosts of POS payments only. The cash costs for consumers and merchants are calculated using POS cost information only, soare not subject to such an overestimation.
Table 8: The private and resource costs of debit cards (in Can$ millions)
Private costs Share in Fees paid Resource costs Share intotal private total
costs resource costs
Financial inst. and infr. $ 1,594 27% $ 12 $ 1,583 57%Retailers $ 1,486 25% $ 595 $ 891 32%Consumers $ 2,883 48% $ 2,579 $ 303 11%
Total $ 5,963 100% $ 3,186 $ 2,777 100%
Notes: This table presents the private and resource costs incurred for debit cards by each stakeholder in 2014. The sum of theresource costs constitutes the total use of resources by society as a whole. Costs refer only to card transactions made at thePOS in Canada and are calculated assuming that the per-transaction costs for the financial sector are the same for domesticand international debit card payments, as well as for POS and online debit card payments.
Table 9: The private and resource costs of credit cards (in Can$ millions)
Private costs Share in Fees paid Resource costs Share intotal private total
costs resource costs
Financial inst. and infr. $ 6,868 51% $ 2,111 $ 4,757 83%Retailers $ 6,202 46% $ 5,431 $ 772 14%Consumers $ 399 3% $ 222 $ 176 3%
Total $ 13,469 100% $ 7,764 $ 5,705 100%
Notes: This table presents the private and resource costs incurred for credit cards by each stakeholder in 2014. The sum of theresource costs constitutes the total use of resources by society as a whole. Costs include the costs of prepaid credit cards andrefer only to card transactions made at the POS in Canada. They are calculated assuming that the per-transaction costs forthe financial sector are the same for domestic and international credit card payments, as well as for POS and online credit cardpayments.
41

Table 10: Average resource costs per transaction (Can$)
Cash Debit cards Credit cards
Average resource costs per transaction $ 0.840 $ 0.567 $ 1.916Bank of Canada and Royal Canadian Mint $ 0.027 $ - $ -Financial institutions and infrastructures $ 0.471 $ 0.323 $ 1.597Retailers $ 0.244 $ 0.182 $ 0.259Consumers $ 0.098 $ 0.062 $ 0.059Resource costs as a percentage of transaction value 4.7% 1.3% 2.2%
Average private costs per transactionBank of Canada and Royal Canadian Mint $ 0.029 $ - $ -Financial institutions and infrastructures $ 0.487 $ 0.325 $ 2.306Retailers $ 0.294 $ 0.303 $ 2.083Consumers $ 0.276 $ 0.588 $ 0.134
Notes: The average resource (private) costs per transaction for each payment method are calculated by dividing its total resource(private) costs as presented in Table 6 (Table 5) by its number of transactions, as laid out in Table 4. The resource costs asa percentage of transaction value are generated by dividing the resource costs of each payment method by the total value oftransactions made with it, as listed in Table 4. It reflects how much of each transaction, irrespective of its size, was spent bysociety for enabling, making and accepting this payment.
Table 11: Breakdown of resource costs by fixed and variable costs (in Can$ millions)
Cash Debit cards Credit cards
Bank of Canada and Royal Canadian MintFixed costs $ 109 $ - $ -Transaction-linked variable costs $ 67 $ - $ -Value-linked variable costs $ 46 $ - $ -
Financial institutions and infrastructuresFixed costs $ 2,293 $ 827 $ 1,833Transaction-linked variable costs $ 684 $ 622 $ 966Value-linked variable costs $ 841 $ 134 $ 1,959
RetailersFixed costs $ 544 $ 181 $ 205Transaction-linked variable costs $ 875 $ 650 $ 515Value-linked variable costs $ 561 $ 61 $ 52
ConsumersFixed costs $ 108 $ - $ -Transaction-linked variable costs $ 461 $ 303 $ 176Value-linked variable costs $ 222 $ - $ -
TotalFixed costs $ 3,054 $ 1,008 $ 2,037Transaction-linked variable costs (TVC ) $ 2,086 $ 1,575 $ 1,657Value-linked variable costs (VVC ) $ 1,671 $ 194 $ 2,011
Costs of 1 additional transaction (a) $ 0.257 $ 0.321 $ 0.556Costs for CAN 1 in additional sales (b) $ 0.011 $ 0.001 $ 0.008
Notes: This table breaks down the total resource costs by fixed and variable costs, assuming a medium-term horizon of three tofive years. Any discrepancies between the sum of the fixed and variable costs presented in this table and the total costs listedin earlier tables are caused by rounding errors. The costs of one additional transaction (a) are calculated by dividing its totaltransaction-related variable costs (TV C) by the number of transactions from Table 4. The costs for Can$1 in additional sales(b) are generated by dividing the value-linked variable costs (V V C) by the total value of transactions from Table 4.
42

Table
12:
Res
ult
sof
rece
nt
cost
-of-
pay
men
tst
udie
s
Canada
EU
Australia*
Austria**
Neth
erlands*
**
Denm
ark****
Norway
Sweden
Cash
Shareofcash
into
talno.ofcash
and
card
paym
ents
51%
83%
55%
82%
52%
49%
24%
40%
Tota
lre
sou
rce
cost
s(%
of
GD
P)
excl
.co
nsu
mer
cost
s0.3
1%
0.4
9%
0.1
9%
0.3
6%
0.2
8%
0.2
7%
0.0
7%
0.2
8%
Tota
lre
sou
rce
cost
s(%
of
GD
P)
0.3
5%
0.4
9%
0.1
9%
0.3
6%
0.2
8%
0.3
5%
0.1
0%
0.2
8%
Sh
are
born
eby
cen
tra
lba
nk
an
dm
inti
ng
au
tho
rity
3%
4%
0%
4%
4%
2%
3%
2%
Sh
are
born
eby
fin
an
cia
lin
stit
uti
on
sa
nd
infr
ast
ruct
ure
56
%3
9%
45
%4
8%
48
%3
7%
59
%4
8%
Sh
are
born
eby
reta
iler
s2
9%
55
%5
5%
48
%4
8%
37
%1
1%
50
%S
ha
rebo
rne
byco
nsu
mer
s1
2%
n/
an
/a
n/
an
/a
23
%2
6%
0%
Res
ou
rce
cost
per
aver
age
cash
tran
sact
ion
$0.8
4$
0.6
4$
0.4
3$
0.6
5$
0.6
7$
1.1
5$
0.9
6$
1.1
2R
esou
rce
cost
per
aver
age
cash
tran
sact
ion
,ex
cl.
con
sum
erco
sts
$0.7
4$
0.6
4$
0.4
3$
0.6
5$
0.6
7$
0.8
8$
0.7
1$
1.1
2
Debit
card
Shareofdebit
into
talno.ofcash
and
card
paym
ents
31%
14%
30%
14%
41%
50%
67%
51%
Tota
lre
sou
rce
cost
s(%
of
GD
P)
excl
.co
nsu
mer
cost
s0.1
3%
0.1
0%
0.1
6%
0.0
5%
0.1
2%
0.1
1%
0.1
0%
0.1
9%
Tota
lre
sou
rce
cost
s(%
of
GD
P)
0.1
4%
0.1
0%
0.1
6%
0.0
5%
0.1
2%
0.1
5%
0.1
3%
0.1
9%
Sh
are
born
eby
cen
tra
lba
nk
an
dm
inti
ng
au
tho
rity
0%
0%
0%
0%
0%
0%
0%
0%
Sh
are
born
eby
fin
an
cia
lin
stit
uti
on
sa
nd
infr
ast
ruct
ure
57
%8
0%
72
%7
5%
52
%2
7%
34
%5
8%
Sh
are
born
eby
reta
iler
s3
2%
20
%2
8%
25
%4
8%
47
%4
0%
42
%S
ha
rebo
rne
byco
nsu
mer
s1
1%
n/
an
/a
n/
an
/a
26
%2
6%
0%
Res
ou
rce
cost
per
aver
age
deb
itca
rdtr
an
sact
ion
$0.5
7$
1.0
6$
0.6
4$
0.6
3$
0.4
5$
0.4
9$
0.4
0$
0.6
1R
esou
rce
cost
per
aver
age
deb
ittr
an
sact
ion
,ex
cl.
con
sum
erco
sts
$0.5
1$
1.0
6$
0.6
4$
0.6
3$
0.4
5$
0.3
6$
0.2
9$
0.6
0
Credit
card
Shareofcredit
into
talno.ofcash
and
card
paym
ents
19%
4%
15%
2%
1%
1%
10%
9%
Tota
lre
sou
rce
cost
s(%
of
GD
P)
excl
.co
nsu
mer
cost
s0.2
8%
0.0
9%
0.1
4%
n/a
n/a
0.0
2%
0.0
7%
0.0
9%
Tota
lre
sou
rce
cost
s(%
of
GD
P)
0.2
9%
0.0
9%
0.1
4%
n/a
n/a
0.0
2%
0.0
8%
0.0
9%
Sh
are
born
eby
cen
tra
lba
nk
an
dm
inti
ng
au
tho
rity
0%
0%
0%
n/
an
/a
0%
0%
0%
Sh
are
born
eby
fin
an
cia
lin
stit
uti
on
sa
nd
infr
ast
ruct
ure
83
%8
9%
84
%n
/a
n/
a8
8%
73
%8
4%
Sh
are
born
eby
reta
iler
s1
3%
11
%1
6%
n/
an
/a
8%
16
%1
6%
Sh
are
born
eby
con
sum
ers
3%
n/
an
/a
n/
an
/a
4%
11
%0
%R
esou
rce
cost
per
aver
age
cred
itca
rdtr
an
sact
ion
$1.9
2$
3.6
2$
1.1
3n
/a
n/
a$
3.2
9$
1.7
1$
1.5
8R
esou
rce
cost
per
aver
age
cred
ittr
an
sact
ion
,ex
cl.
con
sum
erco
sts
$1.8
6$
3.6
2$
1.1
3n
/a
n/
a$
3.1
7$
1.5
3$
1.5
8
Tota
lreso
urcecostsofcash
and
cards(%
ofGDP)
0.7
8%
0.6
8%
0.4
9%
0.4
1%
0.4
0%
0.5
2%
0.3
1%
0.5
6%
Exc
l.co
nsu
mer
cost
s0.7
2%
0.6
8%
0.4
9%
0.4
1%
0.4
0%
0.4
0%
0.2
4%
0.5
6%
Yearofstudy
2014
2009
2013
2013
2009
2009
2013
2009
Thresh
old
am
ountcash
/debit
(Can$)
$6.0
8n
/a
$16.7
8($
17.8
2−
$19.4
4)
$4.6
3n
/a
n/a
$2.7
0
Note
s:C
ost
sp
ertr
an
sact
ion
an
dth
eth
resh
old
am
ounts
are
exp
ress
edin
PP
P-a
dju
sted
Can
ad
ian
dollars
.P
PP
exch
an
ge
rate
sta
ken
from
htt
ps:
//d
ata
.oec
d.o
rg/co
nver
sion
/p
urc
hasi
ng-p
ow
er-p
ari
ties
-pp
p.h
tm.
Th
eth
resh
old
am
ou
nt
cash
/d
ebit
rep
rese
nts
the
tran
sact
ion
am
ou
nt
ab
ove
wh
ich
deb
itca
rds
are
chea
per
than
cash
inte
rms
of
vari
ab
leco
sts
per
tran
sact
ion
.*
Cost
sfo
rsm
all
reta
iler
sare
excl
ud
ed.
Cost
per
deb
itca
rdtr
an
sact
ion
base
don
wei
ghte
daver
age
for
elec
tron
icfu
nd
str
an
sfer
at
poin
tof
sale
(eft
pos)
an
dM
ast
erC
ard
an
dV
isa
deb
itca
rds.
Cre
dit
card
cost
sd
on
ot
incl
ud
eco
sts
ass
oci
ate
dw
ith
the
inte
rest
-fre
ep
erio
dor
rew
ard
s.**
Paym
ent
share
sare
taken
from
Bagn
all
etal.
(2016).
***
Bre
akd
ow
nby
stakeh
old
erb
ase
don
2009
resu
lts
an
dp
aym
ent
share
sta
ken
from
Bagn
all
etal.
(2016).
****
Deb
itca
rdre
sult
sre
fer
on
lyto
dom
esti
cd
ebit
card
sch
eme.
Sou
rces
:S
chm
ied
elet
al.
(2013),
Ste
wart
etal.
(2014),
Ab
ele
an
dS
chaef
er(2
016),
Jon
ker
(2013),
Dan
mark
sN
ati
on
alb
an
k(2
012),
Norg
esB
an
k(2
014),
an
dS
egen
dorf
an
dJan
sson
(2012).
43

Appendices
A Characteristics of recent cost-of-payment studies
The following table presents the key characteristics of cost-of-payment studies done elsewhereover the past 10 years. Noticeable differences can be observed in terms of year of study,stakeholders covered and payment methods considered. Also, some studies examined only theresource costs of payments, whereas others looked solely at private costs or both. Moreover,not every study analyzed the breakdown of the costs by fixed and variable costs. Hence,caution should be taken when comparing their results.
44

Table
13:
Key
char
acte
rist
ics
ofre
cent
cost
ofpay
men
tst
udie
s
Yea
rof
stu
dy
Typ
eof
cost
sco
ver
edS
takeh
old
ers
Inst
rum
ents
cover
ed
Res
ou
rce
Pri
vate
Fix
ed/vari
ab
leIn
clu
ded
inre
port
edre
sult
sD
irec
tly
bre
akd
ow
nsu
rvey
ed
Canada
2014
XX
XC
entr
al
ban
k&
min
t*
Cash
(currentstudy)
Fin
an
cial
inst
itu
tion
sX
Deb
itC
ash
tran
sport
ati
on
com
pan
ies
XC
red
it(i
ncl
.p
repaid
)O
ther
fin
an
cial
infr
ast
ruct
ure
sR
etailer
sX
Con
sum
ers
Australia
2013
XX
XC
entr
al
ban
k&
min
tX
Cash
Ste
wart
etal.
(2014)
Fin
an
cial
inst
itu
tion
sX
Deb
itC
ash
tran
sport
ati
on
com
pan
ies
Cre
dit
Oth
erfi
nan
cial
infr
ast
ruct
ure
sC
heq
ues
Ret
ailer
sX
Dir
ect
deb
itC
on
sum
ers
**
Cre
dit
tran
sfer
s
Austria
2013
XX
Cen
tral
ban
k&
min
tX
Cash
Ab
ele
an
dS
chaef
er(2
016)
Fin
an
cial
inst
itu
tion
sX
Deb
itC
ash
tran
sport
ati
on
com
pan
ies
Oth
erfi
nan
cial
infr
ast
ruct
ure
sX
Ret
ailer
s
Canada
2006
XX
Ret
ailer
sX
Cash
Ara
ngo
an
dT
aylo
r(2
008)
Deb
itC
red
it
Denm
ark
2009
XX
Cen
tral
ban
k(i
ncl
.m
int)
XC
ash
Dan
mark
sN
ati
on
alb
an
k(2
012)
Fin
an
cial
inst
itu
tion
sX
Deb
itC
ash
tran
sport
ati
on
com
pan
ies
Cre
dit
Oth
erfi
nan
cial
infr
ast
ruct
ure
sX
Dir
ect
deb
itR
etailer
sX
Cre
dit
tran
sfer
sC
on
sum
ers
X
Note
s:*T
he
centr
al
ban
kw
as
dir
ectl
ysu
rvey
ed,
wh
erea
sth
eco
sts
of
the
min
tw
ere
esti
mate
dbase
don
exte
rnal
data
.**
Res
ult
sn
ot
incl
ud
edin
rep
ort
edes
tim
ate
sof
tota
lre
sou
rce
cost
sfo
rth
eec
on
om
y.
45

Table
14:
Key
char
acte
rist
ics
ofco
stof
pay
men
tst
udie
s:co
nti
ntu
ed
Yea
rof
stu
dy
Typ
eof
cost
sco
ver
edS
takeh
old
ers
Inst
rum
ents
cover
ed
Res
ou
rce
Pri
vate
Fix
ed/vari
ab
leIn
clu
ded
inre
port
edre
sult
sD
irec
tly
bre
akd
ow
nsu
rvey
ed
European
2009
XX
Cen
tral
ban
k&
min
tX
Cash
Central
Fin
an
cial
inst
itu
tion
sX
Ch
equ
esBank
Cash
tran
sport
ati
on
com
pan
ies
***
Deb
itS
chm
ied
elet
al.
(2013)
Oth
erfi
nan
cial
infr
ast
ruct
ure
s***
Cre
dit
Ret
ailer
sX
Dir
ect
deb
itC
red
ittr
an
sfer
s
European
2013
XX
XR
etailer
sX
Cash
Com
mission
Deb
itE
uro
pea
nC
om
mis
sion
(2015)
Cre
dit
Neth
erlands
2009
XX
XC
entr
al
ban
k&
min
tX
Cash
Jon
ker
(2013)
Fin
an
cial
inst
itu
tion
sX
Deb
itC
ash
tran
sport
ati
on
com
pan
ies
Oth
erfi
nan
cial
infr
ast
ruct
ure
sR
etailer
sX
Norway
2013
XX
Cen
tral
ban
k(i
ncl
.m
int)
XC
ash
Norg
esB
an
k(2
014)
Fin
an
cial
inst
itu
tion
sX
Card
sC
ash
tran
sport
ati
on
com
pan
ies
Gir
op
aym
ents
Oth
erfi
nan
cial
infr
ast
ruct
ure
sR
etailer
sX
Con
sum
ers
X
Sweden
2009
XX
XC
entr
al
ban
k(i
ncl
.m
int)
XC
ash
Seg
end
orf
an
dJan
sson
(2012)
Fin
an
cial
inst
itu
tion
sX
Deb
itC
ash
tran
sport
ati
on
com
pan
ies
XC
red
itR
etailer
sX
Dir
ect
deb
itC
on
sum
ers
XC
red
ittr
an
sfer
s
Note
:***In
som
eco
untr
ies,
cash
tran
sport
ati
on
com
pan
ies
an
doth
erin
terb
an
kin
frast
ruct
ure
sw
ere
dir
ectl
ysu
rvey
ed,
inoth
erco
untr
ies
they
wer
en
ot.
46

B Key assumptions used in this study
Figure 14 summarizes the major assumptions made in this study and how these mightpotentially have affected the results. Overall, the total estimated costs of cash are likelyto be overestimated as they include all cash-related costs incurred by the Bank, Mint andfinancial sector, irrespective of how the public finally used the cash. Since cash can be usedfor other purposes than POS payments, such as person-to-person payments or maintaininga supply of cash on-hand, the total cash costs may overstate the costs of cash used for POSpayments only.
When approximating the costs of other entities not directly surveyed for the study, such ascredit card companies, Payments Canada or white-label ATM providers, their profit marginsare assumed to be zero. As a result, the true resource costs of cash, debit cards and creditcards might be overestimated if these entities are generating profits. As such, the total costsof debit cards and credit cards are likely to be an upper bound. Moreover, all costs andtransactions are assumed to be made for consumer payments. Hence, business-to-businesstransactions are ignored and assumed to be zero. As a result, the results might overstatethe true costs of consumer payments only. This holds for cash, debit card and credit cardpayments.
The other key assumptions listed below might have impacted the results in either anupward or downward direction.
Figure 14: Main assumptions and potential associated bias
Note: This figure provides an overview of the key assumptions underlying the study. A “+” indicates whether the assumptionis likely to have resulted in an overestimation of the costs, whereas a “+/-” indicates that it could have affected the results ineither an upward or downward direction.
47

C The concept of private and resource costs
Figure 15 provides an illustration of the concept of private and resource costs.
Figure 15: Overview of stakeholders and transfers made
As explained below in Table 15, the capital letters A to F represent the total resource costsconsumed by each stakeholder. These include the fees paid for products or services boughtfrom parties that are not included in this study. For example, “A” includes all resource costsincurred by the Bank, such as the costs of labour, IT and its premises, but also the fees paid
48

to the bank note printer or the substrate supplier. The arrows between the stakeholders(i.e., letters G to M) reflect the transfers made between the stakeholders covered in thisstudy. In the Bank’s example, “G” includes the fees paid to cash transportation companiesfor transporting bank notes across the country.
Table 15: Explanation and examples of resource costs and transfers paid
Explanation Examples
A Own resource costs, incl. fees to others outside study Labour, IT, premises, charges for printing, substrateB Own resource costs, incl. fees to others outside study Labour, IT, premises, charges for outsourcing cash handlingC Own resource costs, incl. fees to others outside study Labour, premises, depreciation of vehicles, fuelD Own resource costs, incl. fees to others outside study Labour, IT, premises, charges for electricityE Own resource costs, incl. fees to others outside study Time costs, depreciation of safes and cash registersF Own resource costs Time costsG Fees paid to others considered in study Transportation feesH Fees paid to others considered in study Card processing feesI Fees paid to others considered in study Transportation feesJ Fees paid to others considered in study Chequing account fees, forgone interest on cash on handK Fees paid to others considered in study Transportation feesL Fees paid to others considered in study Card acquiring feesM Fees paid to others considered in study Transaction fees, forgone interest on cash on hand
The total resource costs to society can be calculated by adding up all resource costs (seeTable 16). Adding up the total private costs of all stakeholders would generate a total cost ofA+G+B+C +D+H+I+D+J+K+L+F+M. This, however, would double-count the resourcecosts that stakeholders pass on to each other through fees. For example, the transportationfees paid by the Bank (G) are likely to (partly) reflect the resource costs incurred by thecash transportation companies (C).
Table 16: Calculation of resource costs
Resource costs Fees paid Private costs
Bank of Canada & Royal Canadian Mint A G A+GFinancial institutions & infrastructure providers B+C+D H+I B+C+D+H+IRetailers E J+K+L E+J+K+LConsumers F M F+M
Total resource costs A+B+C+D+E+F
Figure 16 provides a further illustration of why the total society’s resource costs cannot begenerated by adding together all private costs. In this fictitious example, the central bankuses $400 of resources in the form of labour, machinery and premises for the processing ofbank notes. The central bank then outsources the transportation to a cash transportationcompany at a cost of $300. The cash transportation company incurs a total resource costof $300, which includes the costs of fuel, personnel and depreciation of vehicles. At thesame time, it receives revenue from the central bank of $300. The total private costs inthis case would be $700 plus $300, hence $1,000. From a society’s perspective, this wouldoverstate the total net resource costs, as it includes the $300 income received by the cashtransportation. The net resource costs can therefore be generated by subtracting these fees,which would give $700. This is exactly the same as the sum of the resources consumed bythe central bank ($400) and cash transportation company ($300).
49

Figure 16: Fictitious example of private versus resource costs
Note: This figure illustrates a fictitious example of the difference between resource costs and private costs and demonstratesthat the total costs to society can be calculated by adding together the resources consumed by all stakeholders.
50

D RCPM Survey: Sampling, survey, incentives and
modes
D.1 Survey, sampling and incentives
The Bank conducted an extensive survey to collect data from Canadian retailers, the Re-tailer Survey on the Cost of Payment Methods (RCPM survey). The survey asked for allcosts tied to accepting cash and card payments at the POS in Canada in 2014. The surveyinstruments were tailored to the business structure, which resulted in two different question-naires being used: one for retailers who independently own and operate a business and onefor headquarters that operate a chain. Both questionnaires asked for the same information,but the headquarters’ survey was divided into two sections. The first section had to be com-pleted by someone at the head office, whereas the second one had to be forwarded to andfilled out by individual sales locations. For example, information about the total numberand value of payments received was expected to be available at the head office and thereforewas part of the first section. By contrast, the individual sales locations were expected to bemore capable of providing information about the time needed for back-office activities, suchas time spent counting coins and bank notes. Hence, these questions were part of the secondsection.38 Before being sent into the field, the survey was tested and discussed with variousindividual retailers and trade organizations.
The retailers were selected from different frames. The largest headquarters in Canadawere sampled with a probability of one based on information on the largest chains in theCanadian retail and restaurant industry. Smaller chains and independent retailers weresampled from the Dun & Bradstreet (D&B) database using stratified random sampling.The stratification levels were region (Atlantic provinces, Quebec, Ontario, Prairie provincesand British Columbia), industry group defined by the NAICS, and business size based onemployee count. For a detailed description on the sampling methodology, see Welte (2017).
To promote participation, the survey allowed respondents to select different incentives.Overall, a chance to win an iPad was most popular,39 followed by receiving the final researchreport and a more detailed report by region, industry and business size. A considerablenumber of retailers also chose to receive a certificate of appreciation or an invitation to awebinar.
D.2 Survey modes
The survey followed Dillman et al. (2008) and approached retailers with a mixed-modemethodology to maximize responses. Moreover, independent retailers were contacted differ-ently than headquarters operating a chain.
The independent retailers were first sent an invitation letter signed by the Governor ofthe Bank of Canada. One week later, a paper questionnaire was sent followed by a reminderpostcard several days after that. The packages went out in multiple waves in order to learnand, if needed, to modify the approach based on returns. At the same time, an online survey
38Copies of the questionnaires are available upon request.39This option was offered to independent retailers only.
51

provided invitees an alternative way to complete the survey. The Bank’s website also servedas a separate channel where all retailers in Canada were given an opportunity to downloadthe questionnaire or to complete the survey online. The paper questionnaire was availablein different languages, such as English, French and Cantonese/Mandarin, to accommodatedifferent preferences. Additionally, telephone interviews served as a complementary datacollection method among nonresponders and to boost response in certain strata.40 Telephoneinterviews were also used to retrieve missing information from those who had completed thesurvey on paper. Finally, Bank staff made personal visits to recruit retailers from industrieswith low response rates. In the end, 81 per cent of the responses from independent retailerswere received on paper, 8 per cent through the online tool and 12 per cent through telephoneinterviews.
Like the independent retailers, headquarters were sent an invitation letter signed by theGovernor of the Bank of Canada, followed by a paper questionnaire and a reminder postcard.They were also offered the opportunity to complete the survey online. However, lower thanexpected response rates motivated a more personalized outreach. The low response rate waslikely caused by the impersonal nature of the paper mailouts. The invitations were sentto the chief financial officer in the absence of actual names. As a result, many invitationswere likely intercepted by gate-keepers or lost within the company. Hence, Bank employeespersonally reached out to retailer headquarters through email and telephone to contact theappropriate individuals and seek their participation. Moreover, a further boost in responseswas achieved as a result of intermediation from retailer organizations. By far, the majorityof headquarters responses were through paper.
40The initial response rate was particularly low among small and medium-sized food places.
52

E Survey among financial institutions
After careful consideration of other potential methods, such as using the fees charged toconsumers and retailers (see Kruger and Seitz (2014)) or estimating a structural supplyand demand model, the most suitable approach to measure financial institutions costs wasto directly gather their cost information. A major limitation of using the fees charged toconsumers and retailers is that these may not properly reflect the financial sector’s costs if themarket is not perfectly competitive or characterized by cross-subsidization.41 Also, a rigorousmodelling approach would be needed to account for this, since prices faced by consumers andretailers are often not directly measurable when services are offered in packages and whenbanks apply implicit pricing through low or zero interest on deposits (see Kruger and Seitz(2014)).
To assist the financial institutions to collect the information, the Bank developed anautomated data collection tool based on the activity-based costing (ABC) framework. Re-spondents were free to use this tool or their own accounting methods. The ABC frameworkhas proven useful for measuring the costs of payment methods (see Stewart et al. (2014),Norges Bank (2014) and Schmiedel et al. (2013)). According to this framework, the costs ofindividual payment methods are calculated as the sum of the costs of all activities performedfor offering these methods of payment. Examples of activities in the provision of paymentinstruments by financial institutions include “issuing a credit card” or “processing a cashwithdrawal.” Table 17 provides an overview of all activities considered in the study.
41Carbo-Valverde and Perez-Saiz (Forthcoming) study the competition in Canadian retail banking andfind that competition has a significant downward effect on monthly fees paid for bank accounts and creditcards.
53

Table
17:
Act
ivit
ies
and
cost
item
sco
vere
din
surv
eyof
finan
cial
inst
ituti
ons
Activities
Exam
plesofcost
item
sand
activitiescovered
Apote
ntialcost
of:
Cash
Debit
Credit
Prepaid
cards
cards
credit
cards
Over-the-counte
r(O
TC)se
rvices:
Pro
cess
ing
OT
Cca
shd
eposi
tsR
ecei
vin
g,
cou
nti
ng
an
dre
gis
teri
ng
dep
osi
ts,
etc.
*X
Pro
cess
ing
OT
Cca
shw
ith
dra
wals
Ch
eckin
gacc
ou
nt
bala
nce
s,p
ayin
gan
dre
cord
ing
wit
hd
raw
als
,et
c.*
XO
ther
in-b
ran
chca
shor
card
act
ivit
ies
Pro
vid
ing
in-b
ran
chcu
stom
ersu
pp
ort
ass
oci
ate
dw
ith
cash
or
card
s,et
c.*
XX
XX
ATM
services:
Ser
vic
ing
AT
Ms
Fillin
gan
dm
ain
tain
ing
AT
Ms,
dep
reci
ati
on
or
rent
of
AT
Ms,
etc.
*X
Pro
cess
ing
AT
Mca
shw
ith
dra
wals
Fee
sp
aid
ton
etw
ork
or
fin
an
cial
inst
itu
tion
sfo
roth
erb
an
ks’
AT
Mu
sage,
etc.
XP
roce
ssin
gA
TM
cash
dep
osi
tsF
ees
paid
an
doth
erre
late
dco
sts.
XS
ervic
ing
oth
erd
eposi
tfa
ciliti
esO
per
ati
ng
an
dm
ain
tain
ing
nig
ht
safe
s,et
c.*
X
Cash
handling
services:
Cash
han
dlin
gan
dst
ora
ge
Sort
ing
an
dp
ack
ing
cash
,vau
ltm
ain
ten
ance
,ca
shce
ntr
efa
cility
cost
s,et
c.*
XC
ash
tran
sport
ati
on
Collec
tin
gan
dtr
an
sport
ing
cash
,fe
esp
aid
toca
shtr
an
sport
ati
on
com
pan
ies,
etc.
*X
Cash
frau
dIn
ves
tigati
ng
an
dp
roce
ssin
gfr
au
d,
train
ing
cost
s,fr
au
dor
thef
tlo
sses
,et
c.*
XP
rovid
ing
cust
om
ersu
pp
ort
for
cash
Res
pon
din
gto
cust
om
erqu
esti
on
s,on
lin
eor
by
ph
on
e.*
X
Card
services:
Pro
du
cin
g,
pro
curi
ng
an
dis
suin
gca
rds
Pro
du
cin
gca
rds,
card
manu
fact
ure
rfe
es,
lice
nse
fees
tocr
edit
card
com
pan
ies,
etc.
*X
XX
Main
tain
ing
card
sS
usp
end
ing
an
dact
ivati
ng
card
s,re
new
ing
agre
emen
ts,
etc.
*X
XX
(Pre
paid
)cr
edit
card
acc
ou
nt
man
agem
ent
Cre
ati
ng,
main
tain
ing
an
dcl
osi
ng
(pre
paid
)cr
edit
card
acc
ou
nts
.*X
XIs
suin
g(p
rep
aid
)cr
edit
card
state
men
tsIs
suin
g(p
rep
aid
)ca
rdst
ate
men
tsan
doth
erre
late
dco
sts.
*X
XP
roce
ssin
gca
rdtr
an
sact
ion
sA
uth
ori
zin
gan
dse
ttlin
gtr
an
sact
ion
s,in
terc
han
ge
an
dp
roce
ssin
gfe
es,
etc.
*X
XX
Pro
cess
ing
charg
e-b
ack
sP
roce
ssin
gch
arg
e-b
ack
san
doth
erre
late
dco
sts.
*X
XX
Card
frau
dT
ran
sact
ion
mon
itori
ng,
frau
din
ves
tigati
on
an
dlo
sses
,ri
skm
an
agem
ent
pro
gra
ms,
etc.
*X
XX
Insu
ran
cean
dlo
yalt
yp
rogra
ms
Loyalt
yp
rogra
ms,
such
as
insu
ran
cean
doth
erb
enefi
ts.*
XX
Oth
erp
aym
ents
-rel
ate
dcr
edit
card
cost
sP
erfo
rmin
gcr
edit
chec
ks,
cost
sass
oci
ate
dw
ith
pro
vid
ing
a21-d
ay
gra
cep
erio
d,
etc.
*X
Ad
ver
tise
men
tre
late
dto
card
sA
dver
tisi
ng
an
dm
ark
etin
gth
at
isd
irec
tly
ass
oci
ate
dw
ith
card
s.*
XX
XP
rovid
ing
cust
om
ersu
pp
ort
for
card
sR
esp
on
din
gto
cust
om
erqu
esti
on
s,on
lin
eor
by
ph
on
e.*
XX
X
Chequin
gaccountse
rvices:
Ch
equ
ing
acc
ou
nt
man
agem
ent
Cre
ati
ng,
main
tain
ing
an
dcl
osi
ng
cheq
uin
gacc
ou
nts
.*X
XIs
suin
gch
equ
ing
acc
ou
nt
state
men
tsIs
suin
gch
equ
ing
acc
ou
nt
state
men
tsto
cust
om
ers.
*X
XP
rovid
ing
cust
om
ersu
pp
ort
Res
pon
din
gto
qu
esti
on
sab
ou
tth
ech
equ
ing
acc
ou
nt
ingen
eral.*
XX
Overhead
costs:
Bra
nch
faci
lity
cost
sR
ent,
dep
reci
ati
on
,u
tiliti
esan
dse
curi
tyass
oci
ate
dw
ith
inst
itu
tion
bra
nch
es.*
XX
XX
Over
hea
dco
sts
Hea
doffi
ceco
sts,
acq
uir
ing
an
dtr
ain
ing
of
emp
loyee
s,et
c.*
XX
XX
Gen
eral
ad
ver
tisi
ng
an
dm
ark
etin
gE
xp
ense
sti
edto
gen
eral
ad
ver
tise
men
tsn
ot
spec
ifica
lly
ass
oci
ate
dw
ith
cash
or
card
s.X
XX
X
Oth
er:
Oth
erco
sts
not
cover
ed.
XX
XX
*In
clu
din
gst
aff
,in
form
ati
on
tech
nolo
gy,
com
mu
nic
ati
on
an
deq
uip
men
tco
sts.
54

An important element of the automated data collection tool was the allocation of indirectcosts. Indirect costs resulting from activities related to payments but not directly to onepayment method in particular (hereafter called payments-related indirect costs) were allo-cated using various allocation keys, depending on the main cost driver (see Figure 17). Forexample, costs related to the production of blank cards were allocated across debit and creditcards based on the number of cards issued per card type, whereas the costs of managing achequing account were allocated based on the number and value of transactions made fromthese accounts.
Figure 17: Allocation of payments-related indirect costs in survey of financial institutions
The branch and company-wide overhead costs were allocated in two steps (see Figure 18). Inthe first step, given their labour-intensive nature, the costs were allotted across the variousactivities based on the number of full-time equivalent (FTE) employees working on eachactivity. In the second step, the costs of each activity were traced to each individual paymentmethod. If the same activities were performed for various payment methods, a second roundof allocation was needed, in which case the same allocation keys were used as for the allocationof the payments-related indirect costs as illustrated in Figure 17.
55

Figure 18: Allocation of branch and company-wide costs in survey of financial institutions
56
F Time duration study
F.1 Methodology and sample
Tender time analyses conducted abroad show that the transaction times of payment meth-ods vary considerably across countries (see Schmiedel et al. (2013)). Given the impact oftransaction times on total costs of payments, the Bank undertook an extensive study in thefall of 2014 to properly estimate the tender times in Canada. Time data were gathered byobservers who visited stores to take note of the duration of payments made by customers.
The field work was conducted by an external research company. The main field work waspreceded by a pilot study that intended to determine the desired sample size, methodologyand requirements. Observers visited 6 stores in Montreal to observe all transactions over aone-hour period. Per store, an average of 37 transactions were logged. The results pointed atconsiderable variances in transaction times. Therefore, it was decided to increase the numberof stores and the length of the observation time for the main field work, to ensure enoughtransactions could be observed for cash, debit cards and credit cards. As a result, the mainstudy covered 29 stores and transactions were recorded for six hours. The sample was splitamong Montreal, Toronto and Ottawa to avoid potential store-fixed effects. Furthermore,visits were made on all seven days of the week and spread over a whole day (morning,afternoon and evening) to account for any day- or time-related effects. To account forvariation across different sizes and types of stores, the sample consisted of a large variety ofretailers, such as grocery stores, general merchandise stores, gasoline stations, and food anddrink places.
F.2 Definition and scope
The transaction duration was defined as the number of seconds between the moment thatthe total sum to be paid is made known to the customer and the moment that the receiptand billing slips are printed and taken out of the register. The transaction duration explicitlyended before any receipts and billing slips are handed over, since they are not always givento or accepted by the customer. Time used for social or productive activities that werenot directly related to payment, such as scanning purchases, packaging or socializing withclients, was included only when these activities occurred while the customer was waiting forthe transaction to be authorized and approved. If not, any such time was subtracted fromthe total time to measure only the payment activity.
All payments were logged, regardless of the payment instrument used. These included,but were not limited to, cash, debit card, credit card, store gift card and cheque payments.Transactions settled with more than one payment method were ignored. Similarly, paymentsmade at self-checkout tills, registers with a trainee and counters belonging to other companieswere out of scope.
F.3 Obtaining permission from retailers
The Bank was responsible to contact the stores to obtain their permission to participatein the study. This was especially challenging for larger retailers, which required permission
57
from both the head office as well the store owner in question. In general, it was pivotal thatthe observations not affect regular business activities and the customer experience. Retailerswith whom the Bank already had a relationship proved to be most willing to participate.All retailers were offered the outcomes of the observations made in their stores as well as thefinal research report.
F.4 Instructions
Observers were selected based on their profile and experience. They were sent detailedguidelines, and an online certification program was put in place to validate their knowledgeand understanding of the instructions. Highly accurate timers, such as those found on smartphones or similar devices, were used to record the transaction time. The observers stood nearthe cash registers, close enough to observe the payment instrument used by the customerand the transaction amount on the screen, but far enough for the customer to feel at ease.Since it may have been difficult for an observer to distinguish between debit and credit cards,cashiers were asked to confirm the payment instrument used.
Observers received clear instructions on how to select a cash register if a store had severalregisters in operation. To avoid potential selection biases, a random number generator wasused. However, if after 10 minutes the chosen cash register turned out to attract a minimumnumber of customers, the observer could select a new one from among the busier registers.Similarly, the observers were instructed to proceed to another register if the cash registerclosed or in the event of technical problems with the payment card terminal.
Besides the duration, observers recorded the payment method used and transactionamount of each single transaction. Other factors that could affect the tender time werealso logged, such as the day and time, type of payment methods accepted in store, gen-der and estimated age of the client and cashier, the number of cash registers in the storeand those in operation, and type of cash register chosen. The observers also logged anyirregularities, such as cashiers requesting help from colleagues, technical problems with cardterminals, or customers cancelling their transactions.
F.5 Data analysis
A total of 5,891 transactions were recorded. The reported durations presented some extremevalues for all payment methods. Therefore, the median transaction times are assumed to bea better measure of the tender times in Canada than the means. The medians are estimatedusing regression analysis instead of being taken directly from the data set. This makes itpossible to account for the fact that the durations might have been affected by factors such asthe type of store, the time of the day, the transaction amount and the number of cash registersin operation. A quantile regression model was used to account for potential skewness in thedistribution of the transaction durations. For more information about quantile regression,see, for example Koenker and Bassett (1978) and Koenker (2005).
58

F.6 Lessons learned
The time duration study generated a rich set of data, which enabled the Bank to estimate themedian transaction times of cash and card payments in Canada. The total observation timeper store was determined at six hours to ensure that a large enough number of transactionscould be observed. When evaluating the methodology with the observers at the end of thefieldwork period, the length of the observation period was raised as an issue to be reconsideredin potential future studies. Since observer fatigue might affect the precision of the records,it may be better to reduce the time to, for example, three hours. Moreover, by reducing theobservation period, the study would have a lower impact on the usual business of the store,which might increase the willingness of retailers to participate.
59


![Nederlandsche proefmunten van 1800 / [A.O. van Kerkwijk]](https://img.pdfslide.net/doc/110x75/577cb5811a28aba7118d32ef/nederlandsche-proefmunten-van-1800-ao-van-kerkwijk.jpg)