Embed Size (px)
Citation preview

The countryside living
TOOLBOXStormwater Management Device Design Details
April 2010

THE COUNTRYSIDE LIVING
TOOLBOX:
A GUIDE FOR THE MANAGEMENT OF STORMWATER DISCHARGES IN COUNTRYSIDE
LIVING AREAS IN THE AUCKLAND REGION
April 2010 There are 4 publications in this series The Countryside Living Toolbox: Background The Countryside Living Toolbox: Site Design and Prevention of Stormwater Effects The Countryside Living Toolbox: Stormwater Management Device Design Details The Countryside Living Toolbox: Water Supply Public Health Guidelines and Wastewater Management Considerations Acknowledgement: This Toolbox is Version 4.0 of several original documents done by and on behalf of the Rodney District Council and the Waitakere City Council over the past eight years. It has borrowed from the earlier versions where changes were not needed and it supercedes those documents. Permission was given by Rodney District Council and Waitakere City Council to use information from the earlier documents where use of that information was appropriate.
ISBN 978 – 1 – 877540 – 65 -3

Documents in the Series The Countryside Living Toolbox is divided into 4 publications. Countryside Living Toolbox: Background and Application – This section defines the applicability of the Toolbox; provides background information on stormwater effects in rural areas; details the regulatory context of this guideline; describes the key stormwater design objectives and approaches; and summarises the different techniques available for use. Countryside Living Toolbox: Site Design – This section provides information on how site design can affect the volume and rate of stormwater which is discharged as a result of development. This section of the Toolbox will assist developers to “avoid” or “prevent” effects. Countryside Living Toolbox: Stormwater Management Device Design Details – This section provides design information for structural stormwater practices. Ponds, wetlands, filter strips, swales, rain gardens, infiltration trenches and rain tanks are discussed. This section of the Toolbox will assist developers to “mitigate” effects. Countryside Living Toolbox: Water Supply and Wastewater Management Considerations – This section of the Toolbox briefly discusses requirements relating to both potable and non-potable water supply. It also provides an overview of the design features and maintenance considerations associated with on-site wastewater treatment and disposal systems.
Disclaimers Waitakere District Council In situations where there are differences to the earlier versions and where they have been relied on or embodied into planning documents such as Structure Plans or Resource Consents then the requirements of the earlier versions shall take precedence over Version 4.0. Rodney District Council Infiltration in Rodney District Council Rodney District Council has significant areas of countryside where soil stability is strongly dependent on and particularly sensitive to changes in moisture content and the hydrological cycle in general. for that reason infiltration as a means of stormwater management is not seen as a viable management tool. Water Supply for re-use This section is not applied in Rodney District Council. RDC has its own provisions for re-use. Where a particular re-use application is required RDC can make available a protocol for calculating storage v consumption requirements to estimate tankage against supply. Papakura District Council The guideline provides for a number of methods and tools to mitigate the effects of storm water run-off from countryside living areas but the acceptance of any particular method and tool will depend with the respective TLA (PDC) . The extent and sharing of responsibility by TLA, property owners and developers to ensure continued performance from these methods and tools is not covered in this guideline and will depend on the consenting and approval processes of respective TLA. © 2008 Auckland Regional Council This publication is provided strictly subject to Auckland Regional Council's (ARC) copyright and other intellectual property rights (if any) in the publication. Users of the publication may only access, reproduce and use the publication, in a secure digital medium or hard copy, for responsible genuine non-commercial purposes relating to personal, public service or educational purposes, provided that the publication is only ever accurately reproduced and proper attribution of its source, publication date and authorship is attached to any use or reproduction. This publication must not be used in any way for any commercial purpose without the prior written consent of ARC. ARC does not give any warranty whatsoever, including without limitation, as to the availability, accuracy, completeness, currency or reliability of the information or data (including third party data) made available via the publication and expressly disclaim (to the maximum extent permitted in law) all liability for any damage or loss resulting from your use of, or reliance on the publication or the information and data provided via the publication. The publication and information and data contained within it are provided on an "as is" basis.

Countryside Living Toolbox – Stormwater Management Device Design Details Page- i
Countryside Living Toolbox: STORMWATER MANAGEMENT DEVICE DESIGN
DETAILS
TABLE OF CONTENTS 1 INTRODUCTION .................................................................................................. 1 2 DESIGN TO MINIMISE FUTURE MAINTENANCE .............................................. 1
2.1 Spend a year at the practice ........................................................................ 1 2.2 Asking maintenance questions ..................................................................... 2
2.2.1 Who will perform the maintenance ........................................................... 2 2.2.2 What needs to be maintained ................................................................... 2 2.2.3 When will maintenance need to be performed ......................................... 2 2.2.4 Where will maintenance have to be performed ........................................ 2 2.2.5 How will maintenance be performed ........................................................ 3
2.3 Considering the use of durable materials ..................................................... 3 3 HYDROLOGY ....................................................................................................... 4
3.1 Hydrological design method ......................................................................... 4 3.2 Calculating water quality volumes ................................................................ 5 3.3 Extended detention ...................................................................................... 5
3.3.1 Rain gardens and infiltration trenches ...................................................... 6 3.3.2 Bush restoration ....................................................................................... 6 3.3.3 Rain tanks ................................................................................................. 6 3.3.4 Green roofs ............................................................................................... 6 3.3.5 Swales and filter strips .............................................................................. 6 3.3.6 Wetland swales ........................................................................................ 6 3.3.7 Ponds and wetlands ................................................................................. 7
3.4 Peak storm flow control ................................................................................ 7 3.4.1 Calculating peak discharge ...................................................................... 7 3.4.2 Determining volume needs for storage ..................................................... 7
3.4.2.1 Control of 2- and 10-year storms within practices.................. 8 3.5 Flooding analysis .......................................................................................... 8 3.6 Influence of climate change .......................................................................... 9
4 FLOW AND TREATMENT CONTROL ............................................................... 11 4.1 Swale Design ............................................................................................. 12
4.1.1 Description of practice ............................................................................ 12 4.1.2 Design considerations ............................................................................ 12
4.1.2.1 Residence time .......................................................................... 13 4.1.2.2 Manning’s coefficient of roughness ........................................ 13 4.1.2.3 Lateral inflow .............................................................................. 14
4.1.3 Targeted contaminants ........................................................................... 14 4.1.4 Advantages ............................................................................................. 14 4.1.5 Limitations .............................................................................................. 15
Countryside Living Toolbox – Stormwater Management Device Design Details Page- ii
4.1.6 Design sizing .......................................................................................... 15 4.1.6.1 Flows in excess of the water quality storm............................ 16 4.1.6.2 Shallow slope situations ........................................................... 16
4.1.7 Case study .............................................................................................. 17 4.1.7.1 Project description ..................................................................... 17 4.1.7.2 Hydrology .................................................................................... 17 4.1.7.3 Swale Design ............................................................................. 18
4.2 Filter strip design ........................................................................................ 20 4.2.1 Description of practice ............................................................................ 20 4.2.2 Design considerations ............................................................................ 20 4.2.3 Targeted contaminants ........................................................................... 21 4.2.4 Advantages ............................................................................................. 21 4.2.5 Limitations .............................................................................................. 21 4.2.6 Design sizing .......................................................................................... 22 4.2.7 Case study .............................................................................................. 23
4.2.7.1 Hydrology .................................................................................... 23 4.2.7.2 Filter strip design ....................................................................... 23
4.3 Rain gardens .............................................................................................. 25 4.3.1 Description of practice ............................................................................ 25 4.3.2 Design considerations ............................................................................ 25 4.3.3 Targeted contaminants ........................................................................... 26 4.3.4 Advantages ............................................................................................. 26 4.3.5 Limitations .............................................................................................. 27 4.3.6 Design sizing .......................................................................................... 27 4.3.7 Case study .............................................................................................. 32
4.3.7.1 Project description ..................................................................... 32 4.3.7.2 Hydrology .................................................................................... 32 4.3.7.3 Rain garden design ................................................................... 32
4.4 Infiltration trenches ..................................................................................... 34 4.4.1 Description of practice ............................................................................ 34 4.4.2 Design considerations ............................................................................ 34
4.4.2.1 Permeability rates ...................................................................... 34 4.4.2.2 Sufficient depth to groundwater or bedrock .......................... 36 4.4.2.3 Influent concentrations causing clogging or groundwater quality threat ................................................................................................... 36
4.4.3 Targeted contaminants ........................................................................... 37 4.4.4 Advantages ............................................................................................. 37 4.4.5 Limitations .............................................................................................. 37 4.4.6 Design sizing .......................................................................................... 38 4.4.7 Case study .............................................................................................. 39
4.4.7.1 Project description ..................................................................... 39 4.4.7.2 Hydrology .................................................................................... 39 4.4.7.3 Infiltration trench design ........................................................... 40
4.5 Wetland swales .......................................................................................... 41 4.5.1 Description of practice ............................................................................ 41 4.5.2 Design considerations ............................................................................ 41 4.5.3 Targeted contaminants ........................................................................... 42 4.5.4 Advantages ............................................................................................. 42 4.5.5 Limitations .............................................................................................. 42 4.5.6 Design sizing .......................................................................................... 42
4.5.6.1 Flows in excess of the water quality storm............................ 44 4.5.7 Case study .............................................................................................. 44
4.5.7.1 Project description ..................................................................... 44
Countryside Living Toolbox – Stormwater Management Device Design Details Page- iii
4.5.7.2 Hydrology .................................................................................... 44 4.5.7.3 Swale Design ............................................................................. 45
4.6 Water tanks ................................................................................................ 47 4.6.1 Description of practice ............................................................................ 47 4.6.2 Design considerations ............................................................................ 47 4.6.3 Targeted contaminants ........................................................................... 48 4.6.4 Advantages ............................................................................................. 48 4.6.5 Limitations .............................................................................................. 48 4.6.6 Design sizing .......................................................................................... 48
4.6.6.1 How much water can be captured from the roof .................. 48 4.6.6.2 The anticipated water use ........................................................ 50 4.6.6.3 The percent of water from the roof that can be used .......... 51 4.6.6.4 Peak flow consideration ........................................................... 52 4.6.6.5 Determining detention volumes and sizing outlets .............. 53
4.6.7 Case studies ........................................................................................... 54 4.6.7.1 Case Study 1 .............................................................................. 54 4.6.7.2 Case study 2 .............................................................................. 55
4.7 Bush Revegetation ..................................................................................... 57 4.7.1 Description of practice ............................................................................ 57 4.7.2 Design considerations ............................................................................ 57 4.7.3 Targeted contaminants ........................................................................... 58 4.7.4 Advantages ............................................................................................. 58 4.7.5 Limitations .............................................................................................. 58 4.7.6 Design sizing .......................................................................................... 58 4.7.7 Case study .............................................................................................. 59
4.8 Green roofs ................................................................................................ 60 4.8.1 Description of practice ............................................................................ 60 4.8.2 Design considerations ............................................................................ 60 4.8.3 Targeted contaminants ........................................................................... 61 4.8.4 Advantages ............................................................................................. 61 4.8.5 Limitations .............................................................................................. 61 4.8.6 Design sizing .......................................................................................... 62
4.8.6.1 Depth of media .......................................................................... 62 4.8.6.2 Composition of media ............................................................... 62 4.8.6.3 Plant selection ............................................................................ 62 4.8.6.4 Additional support consideration ............................................. 63 4.8.6.5 Roof slope .................................................................................. 63 4.8.6.6 Drainage layer and impermeable liner ................................... 63 4.8.6.7 Stormwater management benefits .......................................... 63
4.8.7 Case study .............................................................................................. 64 4.9 Access roads and driveways ...................................................................... 65
4.9.1 Introduction ............................................................................................. 65 4.9.2 Driveways ............................................................................................... 65 4.9.3 Drainage across a driveway ................................................................... 67
4.10 Dispersal devices ....................................................................................... 69 4.10.1 Introduction ......................................................................................... 69 4.10.2 Description .......................................................................................... 69 4.10.3 Application .......................................................................................... 69 4.10.4 Design considerations ........................................................................ 69
5 BIBLIOGRAPHY ................................................................................................. 73

Countryside Living Toolbox – Stormwater Management Device Design Details Page- 1
1 INTRODUCTION Parts A and B of this Toolbox discuss the background behind why stormwater management is an issue and prevention of stormwater effects. Part C provides a detailed discussion on how to design those practices that reduce adverse effects. There are three key elements in designing stormwater management practices: • Designing to minimise future maintenance, • Hydrologic design methodology, and • Detailed practice design.
Maintenance is such a key issue and is most appropriately addressed at the design phase to minimise long-term maintenance problems. As such, it is discussed in the detailed device design section of the toolbox.
2 DESIGN TO MINIMISE FUTURE MAINTENANCE A key element that must be considered during the design phase is operation and maintenance of stormwater management practices. There are several key elements that must be considered during the design phase. Asking and answering some questions or giving serious consideration to operation of the stormwater practice and system can answer them. • Spend a year at the practice • Asking maintenance questions such as who, what, when, where and how • Considering the use of uniform materials or components
2.1 Spend a year at the practice There are three possible entities that may maintain stormwater management practices: • The District Council, • A body corporate, or • Individual property owners.
While the District Council has expertise in asset management, the other two entities probably won’t. Practice selection needs to consider the lack of expertise that will exist for maintenance and ensure that maintenance is kept as simple as possible to ensure long-term practice function. As such, the stormwater designer must imagine conditions at the completed practice throughout an entire year. This should not only include rainy and sunny weather but also consider time of year when evapotranspiration rates are different. Other site conditions may include hot, dry weather or drought when vegetation is stressed or dies. Finally, for safety purposes, the designer should also imagine what the system would be like at night.

Countryside Living Toolbox – Stormwater Management Device Design Details Page- 2
As these conditions are visualised, the designer should also imagine how they might affect not only the operation of the practice itself, but also the people who will maintain it or otherwise interact with it. Is there a safety issue related to maintenance of a practice such as an in-ground water tank? This approach is intended to assist the designer to consider and design for possible conditions at the practice, not just for specific storm events.
2.2 Asking maintenance questions Another key element of design should involve asking specific questions that focus on operation and maintenance characteristics or functions of the practice. The questions should include at least: the following: • Who will perform maintenance, • What needs to be maintained, • When will maintenance need to be performed, • Where is maintenance needed, and • How will maintenance be done.
2.2.1 Who will perform the maintenance Does the design of the practice require operation and maintenance specialists or can an average individual be able to do the maintenance.
2.2.2 What needs to be maintained A list of practice components that are part of the design may prompt a revised design with either a shorter list or one that modifies a practice component to facilitate maintenance. An example of this could be a rain garden that has underdrains, dense vegetation and an overflow spillway. Access has to be provided to ensure that a maintenance person can get to the site to conduct contaminant removal or replacement of key elements as needed.
2.2.3 When will maintenance need to be performed Does maintenance have to be done once a day, once a week, monthly or annually? The recurring costs of maintenance can be substantial. In addition, can maintenance only be done during dry weather? If so, what happens during the lengthy time periods of wet, rainy weather? In terms of effort and possible consequences, it is easier for the designer to provide answers to these questions now rather than having a relatively uninformed person developing an approach later.
2.2.4 Where will maintenance have to be performed Recognising that these practices are being done primarily in residential areas, there will always be potential interaction with the public and safety concerns that have to be addressed. Will the maintenance person be able to gain easy access to the
Countryside Living Toolbox – Stormwater Management Device Design Details Page- 3
practice? Once there, will they have a stable, safe place to stand and work? Can the design provide a means for the maintenance entity to reduce the time on site to conduct maintenance inspections and perform maintenance?
2.2.5 How will maintenance be performed The simple instruction to remove sediment or harvest vegetation can become complicated if there hasn’t been any provision made to allow equipment access to the practice or even to the site. Are slopes too steep for mowing equipment to reach or are outfall dispersal trenches located in areas that will be overlooked? Stormwater practices cannot become a liability to the local community.
2.3 Considering the use of durable materials Specify materials that will last for as long as the life expectancy of the intended land use. Reducing construction costs may have a significant adverse impact on long-term maintenance costs. It is absolutely essential that the designer consider these issues during the design phase so they can be addressed now rather than being left for later resolution. The design phase may be the shortest amount of time given to a project when considering construction time and whole-of-life aspects. It is vital that the design attempts to minimise future maintenance obligations and cost while providing for proper protection of downstream areas.

Countryside Living Toolbox – Stormwater Management Device Design Details Page- 4
3 HYDROLOGY
3.1 Hydrological design method The hydrologic analysis approach for this toolbox is the Rational Formula. This is not consistent with ARC consenting requirements using TP 108 (ARC, 1999) but this toolbox is for permitted activities under the ALW Plan in addition to ARC consents under the Air, Land and Water Plan. The end result is similar in terms of level of control but the Rational Formula is simpler to use for a broader audience who may be impacted by local requirements. The Rational Method was developed approximately 150 years ago and is still widely used internationally. There are some limitations to use of the method but it does provide reasonable peak discharge results on small catchments with relatively uniform land use. There is a good discussion on the use of the Rational Method in Appendix C of the NZWERF Guideline (2004). In addition to that the City of Christchurch has a detailed discussion of the Rational Method in their Waterways, Wetlands and Drainage Guide (2003). It is only suitable for small catchments as the method does not account for catchment storage during flood events, but it is appropriate for small sites (that is it fits within limitations on the use of the toolbox set out in Part A. NZWWA (2004) recommends that it not be used for catchment areas in excess of 50 hectares. The Rational Formula is the following: Qwq = 0.00278CIA Q = peak discharge (m3/s) C = Runoff coefficient (-) I = Rainfall intensity (mm/hr.) A = catchment area (ha) The runoff coefficient = Predevelopment pervious Cpre factor + 0.65(%Impervious cover/100) Where predevelopment C factor related to soil conditions is provided in Table C1.
Table C1 Rational Formula Runoff Coefficients (C Factor)
Land use Soil Group A B C Row crops .55 .65 .70 Pasture .10 .20 .30 Woods - no grazing
.06 .13 .16
Impervious Surface
.95 .95 .95
The soil groups listed are those taken out of TP 108 where: • Group A soils are volcanic granular loam, • Group B soils are alluvial soils, and
Countryside Living Toolbox – Stormwater Management Device Design Details Page- 5
• Group C soils are mudstone/sandstone. For much of the Auckland Region, soils will be in the Group C category. While the design examples will use the Rational Formula for design, the ARC’s TP 108 or another hydrologic method acceptable to the approving entity are also acceptable to use for design. When ARC consents are required, hydrologic design shall be in accordance with ARC requirements, which at this time is for the hydrologic analysis to be done by TP 108.
3.2 Calculating water quality volumes The Rational Formula does not calculate volumes of runoff but rather calculates peak discharges for various storm intensities. Calculate the water quality volume to be treated by using the 1/3 of the 2-year storm as shown in the ARC’s TP 108. The City of Christchurch has a simple method of determining the first flush volume in their Waterways, Wetlands and Drainage Guide (2003) where the water quality volume (their first flush volume) is based on the following: The catchment effective first flush runoff area = Aeff = impervious%/100 x total Area (ha)
The first flush volume Vff = 10 x Aeff x dff (m3)
Where dff = first flush water quality depth (water quality storm = 1/3 of 2-year 24-hour storm in TP 108 rainfall table)
Use this method to calculate the water quality volume storage.
3.3 Extended detention As discussed in Parts A and B, critical issues in rural development design, from a stormwater management perspective, are related to increases in stormwater runoff adversely impacting on receiving system physical structure. As such, the extended detention of flows to minimise downstream channel erosion is an important issue. Minimising increases in the total volume of stormwater being discharged will mitigate increases and may through careful design and use of a treatment train approach significantly reduce or eliminate stormwater runoff volume increases to reduce or eliminate the extended detention requirement. An example of this is shown in Table A4 regarding stormwater practices commonly used in a rural environment. A key difference in calculating stormwater runoff from rural properties versus urban ones is that significant site regrading is minimised in rural areas and there is no change to pervious area predevelopment C factors for most of the site. If impervious surface volume is reduced or mitigated for from a flow perspective, receiving system stability can be maintained. Another point to mention is time of year. Winter months in the Auckland Region have negligible levels of evaporation so runoff naturally increases over the winter months for a given amount of rainfall. Thus having limited storage volumes for rain tanks does not necessarily compromise their overall stormwater function.
Countryside Living Toolbox – Stormwater Management Device Design Details Page- 6
Implementation of the following practices can significantly reduce the need for a formal extended detention on a site design basis.
3.3.1 Rain gardens and infiltration trenches Rain gardens and infiltration trenches (Sections 4.3 and 4.4) having a larger volume of storage beyond the water quality storm can function for extended detention design. To provide for the 34.5 mm rainfall event, the water quality volume should be multiplied by 1.3. This volume would then be used in the design approach equation detailed in the rain garden design and infiltration trench sections.
3.3.2 Bush restoration As can be seen from Table C1, woods have a significantly lower runoff coefficient than other land uses. Using the approach detailed in the bush design section (Section 4.7), revegetation of bush can provide a reduction in total runoff volume and minimise extended detention requirements. In a similar manner, cutting down existing bush will, of itself, increase stormwater runoff and must be included in any analysis for calculating extended detention volumes. The discharge calculations must be modified in the post-developed condition to account for the change in pervious landuse to the appropriate value and not just account for impervious surfaces.
3.3.3 Rain tanks Rain tanks (Section 4.6) can provide for extended detention in both domestic water consumption and extended detention release.
3.3.4 Green roofs Green roofs (Section 4.8) can also provide extended detention benefits but their depth of media must be at least 70 mm to provide for significant storage. This toolbox recommends 150 mm of media to ensure plant survival.
3.3.5 Swales and filter strips Swales and filter strips (Sections 4.1 and 4.2) do not provide extended detention benefits using a conventional design. The swale design section does discuss the use of underdrains in shallow slope areas and having a modified soil profile with an underdrain can provide extended detention benefits. Filter strips do not generally provide extended detention benefits, as modification of soils on shallow slope areas is not a recommended approach.
3.3.6 Wetland swales
Countryside Living Toolbox – Stormwater Management Device Design Details Page- 7
In a similar manner as swales and filter strips, wetland swales (Section 4.5) do not provide extended detention. Having a series of check dams can provide for extended detention if designed specifically to provide that function.
3.3.7 Ponds and wetlands Ponds and wetlands can easily be modified to provide for extended detention. There may be situations where an existing pond can be modified to provide for additional storage either by lowering the normal pool level or modifying the embankment or outlet structure. Design of ponds and wetlands are discussed in the ARC’s TP 10 and are not addressed further in this countryside guideline.
3.4 Peak storm flow control Control of peak discharges for the 2- and 10-year storms is a requirement of the Permitted Activity Section of Chapter 5 of the ARC’s Air, Land and Water Plan. There are two levels of analysis that are necessary to determine peak control levels and requirements.
1. What is the change in peak discharge for the 2- and 10-year storms, and 2. How much storage is required to mitigate downstream effects.
3.4.1 Calculating peak discharge In calculating the peak discharge, the storm duration is normally equal to the time of concentration (tc) of the catchment. For the purposes of this toolbox tc is calculated as the following: Tc = 0.305(L/180) + 10 Where: Tc = Time of concentration (minutes) L = Maximum distance from study location to upper
catchment boundary limit (m) Unless a greater duration is indicated by the site analysis, the storm duration to use for peak control purposes is the 1-hour storm. Rainfall intensities can be obtained using territorial authority information or NIWA’s High Intensity Rainfall Design System (HIRDS) that is available for purchase from NIWA.
3.4.2 Determining volume needs for storage The estimated volume of storage for a 2- and 10-year storm can be determined by using the following equation. Vestimated = 1.5(Qpost)D
Where Vestimated = required storage volume (m3) Qpost = Post-development peak discharge rate (m3/s)
Countryside Living Toolbox – Stormwater Management Device Design Details Page- 8
D = Duration of storm (sec)
This equation gives the total runoff volume for the storm analyses. For the purposes of this toolbox, the storm duration is 1 hour (3600 seconds). The 1.5 constant was used to provide consistency in volume requirements with TP 108. The general equation is based on a trapezoidal hydrograph with a storm duration greater than the time of concentration. If the storm duration equaled the time of concentration, a triangular hydrograph would have been used but the volume requirements fit a one-hour storm better than a 10-minute Tc. The calculation should be done for 2- and 10-year storms.
3.4.2.1 Control of 2- and 10-year storms within practices Rural development normally does not involve mass grading of an entire development site. This ensures that the runoff from pervious areas is essentially unchanged from the predevelopment condition. As such, stormwater management practices should only be designed and constructed for those specific areas that need management. Certain practices can provide control of the differences in the 2- and 10-year storms by providing storage within the practice. Practices that can provide volume control of the difference in peak discharges for the 2- and 10-year storms are the following: • Swales with underdrains and check dams, • Rain gardens, • Infiltration trenches, • Water tanks, • Revegetation, and • Green roofs
The discussion on extended detention control by providing 1.3 times the water quality volume for design also provides for control of the volume increases for the 2- and 10-year storms if designed correctly. The combination of live storage on the practice and void ratios in the practices themselves provides for separation of the 2- and 10-year volume increases from the storm hydrograph. If this approach is taken, there is no need to design and construct separate peak control devices for developments. A key point is that the practice must manage only those areas that require management such as driveways and impervious surfaces. If runoff from additional land area not needing management drains to the practice, the volumes needed for storage increase greatly and control of the 2- and 10-year storms becomes more difficult. If extraneous drainage cannot be kept out of the stormwater practice, peak control of the 2- and 10-year storms may be necessary and the equations provided above for calculating volumes must be used to determine detention storage.
3.5 Flooding analysis When there exists documented downstream flooding of habitable structures in a catchment, there can be no increased risk as a result of rural land use development. The issue of where in a catchment storage of runoff to prevent increased potential

Countryside Living Toolbox – Stormwater Management Device Design Details Page- 9
flooding is beneficial and where storage may increase flood potential due to delay in release of water coinciding with peak flows when they arrive from upstream is discussed in Part A. In a similar fashion, criteria are also provided for storage to ensure that potential flood increases are avoided. The purpose of this discussion is to provide a storm duration for which analysis must be done on the 100-year storm peak discharge. The storm to consider again relates to the Tc of the area being developed. This may be different from design of individual practices where catchment areas are small, as the flooding consideration must consider the development as a whole. Where there is documented downstream flooding of habitable structures the best approach, in the absence of a catchment management plan, is to ensure that the post-development peak discharge for the 100-year storm not exceed 80% of the pre-development peak discharge for the 100-year storm. This will minimise the potential increase in downstream flooding.
3.6 Influence of climate change The Resource Management Act Amendment Act (March 2004) requires councils to have particular regard to the effects of climate change. Incorporating climate change predictions into stormwater design is important if infrastructure is to maintain the same level of service throughout its lifetime. In terms of rainfall (Ministry for the Environment, 2008), annual rainfall will slightly decrease in the Region from 3% in the Warkworth area to only 1% in Mangere by 2040. This decrease is expected to increase by 2090 to 5% in the Warkworth area to only 3% in Mangere. In terms of extreme rainfall, heavier and/or more frequent extreme rainfalls are expected. For example, for Auckland, the worst case (most severe) end of the range for 2100 indicates that a rainfall amount currently with a return period of 50 years would have a return period of less than 10 years. The 2- and 10-year ARI daily storm events are used to confirm a device’s ability to convey peak flows under moderately severe conditions. For device components with a design life greater than 25 years the storm event precipitation values (2- and 10-year) should be adjusted to account for climate change. The values obtained from TP 108 should be increased by the percentages listed in Table C-2 unless locally, more detailed data provides more accurate recommendations.
Table C-2 Factors (percentage adjustments) for Use in Deriving Extreme Rainfall Information for
Stormwater Design (MfE, 2008) ARI (years) Duration
2
5
10
20
30
50
100
< 10 minutes
8.0 8.0 8.0 8.0 8.0 8.0 8.0
10 minutes 8.0 8.0 8.0 8.0 8.0 8.0 8.0 30 minutes 7.2 7.4 7.6 7.8 8.0 8.0 8.0 1 hour 6.7 7.1 7.4 7.7 8.0 8.0 8.0 2 hours 6.2 6.7 7.2 7.6 8.0 8.0 8.0 3 hours 5.9 6.5 7.0 7.5 8.0 8.0 8.0 6 hours 5.3 6.1 6.8 7.4 8.0 8.0 8.0 12 hours 4.8 5.8 6.3 7.3 8.0 8.0 8.0

Countryside Living Toolbox – Stormwater Management Device Design Details Page- 10
24 hours 4.3 5.4 6.3 7.2 8.0 8.0 8.0 48 hours 3.8 5.0 6.1 7.1 7.8 8.0 8.0 72 hours 3.5 4.8 5.9 7.0 7.7 8.0 8.0
Note: This table recommends percentage adjustments to apply to extreme rainfall per 1o C of warming, for a range of average recurrence intervals (ARIs). The percentage changes are mid-range estimates per 1o C and should be used only in a screening assessment. The entries in this table for a duration of 24 hours are based on results from a regional climate model driven for the A2 SRES (Special Report on Emissions Scenarios - see MfE, 2008 Appendix 1) emissions scenario. The entries for 10-minute duration are based on the theoretical increase in the amount of water held in the atmosphere for a 1oC increase in temperature (8%). Entries for other durations are based on logarithmic (in time) interpolation between the 10-minute and 24-hour rates.
Countryside Living Toolbox – Stormwater Management Device Design Details Page- 11
4 FLOW AND TREATMENT CONTROL Specific design guidance is provided in this Section for the following practices:
• Swales, • Filter strips, • Rain gardens, • Infiltration trenches, • Wetland swales, • Water tanks, • Bush revegetation, • Green roofs, • Access roads and driveways, and • Dispersal devices
These practices are seen as particularly applicable in countryside living areas. The issue of stormwater management ponds or wetlands is best discussed in Technical Publication 10 (ARC, 2003) as ponds for stormwater management are not recommended for use in rural areas. They are more appropriate in those areas where a higher intensity of development warrants their use. The case studies shown for each practice relate to a specific part of rural land use. As an example, the swale case study details treatment for a small access road that will service a rural residential community. Due to the large area of a rural development site that is expected to remain undisturbed and undeveloped, it is considered appropriate to consider the individual elements separately to provide overall site management.
Countryside Living Toolbox – Stormwater Management Device Design Details Page- 12
4.1 Swale Design
4.1.1 Description of practice A swale is a vegetated earth channel that provides stormwater conveyance and whose vegetation and organic matter provide treatment of the runoff.
4.1.2 Design considerations The key elements of a swale are low velocities of flow and residence time. Swales impact on stormwater runoff in two ways: Conveyance of stormwater flows at a low velocity compared with flow in stormwater pipes. As water passes through the vegetation it encounters frictional resistance due to the vegetation, and water quality treatment is provided by passage of the water through the vegetation. Physical, chemical and biological processes occur that reduce contaminant discharge. Table C3 provides guidance from a design perspective.
Table C3 Swale design elements
Design parameter Criteria Longitudinal slope < 5% Maximum velocity 0.8 m/s for water quality storm Maximum water depth above vegetation
The water quality design water depth should not exceed design height for grass. This is a key criterion for ensuring Manning roughness coefficient is provided.
Design vegetation height 100 - 150 mm Manning coefficient 0.25 for WQ storm, 0.03 for
submerged flow (10-yr. Storm) Maximum bottom width 2 m Minimum hydraulic residence time
9 minutes
Minimum length 30 m Maximum catchment area served
2 hectares
Maximum lateral slope 0% Maximum side slope 4H:1V (shallow as possible for
mowing purposes) Where longitudinal slope < 2% Perforated underdrains shall be
provided
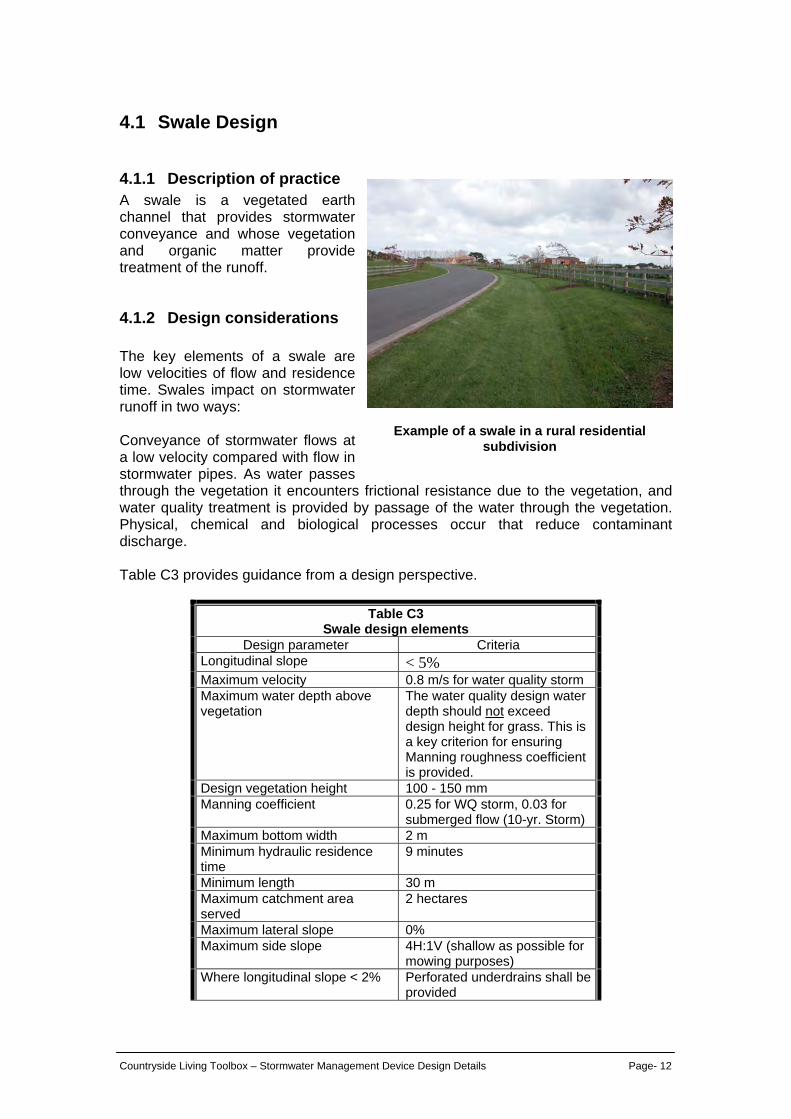
Example of a swale in a rural residential subdivision
Countryside Living Toolbox – Stormwater Management Device Design Details Page- 13
Where longitudinal slope > 5% Check dams shall be provided to ensure effective slope < 5%
Where concentrated flows enter the swale (from pipes)
Level spreaders shall be placed at the head of the swale to disperse flows
10-year storm velocities < 1.5 m/s unless erosion protection is provided
As can be seen, there are several key differences in Table C3 to the ARC’s TP 10 where this standard is more restrictive.
1. The water quality storm should not exceed the design height of grass. TP 10 allows for a maximum flow depth above the grass of 100 mm. This change is felt necessary to improve water quality performance.
2. Using a standard Manning’s roughness coefficient of 0.25 rather than the series of equations given in TP 10. This is done for simplicity as either approach is felt to provide credible results.
3. Maximum swale side slopes can be no steeper than 4 horizontal: 1 vertical. This change from a maximum of 3 horizontal: 1 vertical is done based on input from asset managers who feel that mowing is much easier on the flatter slope.
4. Catchment drainage areas should be less than 2 hectares to minimise scour potential.
There are several points that need some discussion and they include:
• Residence time • Manning’s coefficient of roughness • Lateral inflow
4.1.2.1 Residence time There have not been many studies that relate water quality performance in swale design. The most recognised work has been done in the U.S. (Metropolitan Seattle, 1992). That study recommended a residence of 9 minutes for flow to pass through the swale and provide approximately an 80+% removal of total suspended solids. The swale monitored there had a grass height of approximately 150 mm with a grass blade density of approximately 18,000 blades/m2. The grass species was predominantly tall fescue. Most governmental agencies in the U.S. have adopted that criterion. More recently, the recommendation has been recommended upward to 22 minutes due to the uncertainty of performance (Washington State Department of Ecology, 2001). That change in residence time is a significant change from the 9-minute criterion and it is not recommended that the time be increased until further investigation of swale performance is done in New Zealand.
4.1.2.2 Manning’s coefficient of roughness Determining roughness coefficients is more art than science. Many design handbooks provide one value for Manning’s coefficient of roughness of 0.2 (Metropolitan Seattle, 1992) or 0.25 (California Stormwater Quality Association, 2003). The ARC funded a swale study (Larcombe, 2003) where dye tests were done on a swale to determine “n” by measuring flow times through the swale. In all of the
Countryside Living Toolbox – Stormwater Management Device Design Details Page- 14
test trials the values of Manning’s coefficient of roughness varied from 0.18 - 0.30. In reality the range is very consistent with the recommendations provided in the literature. The ARC recommended a series of equations for determination of “n” and using those equations provides values lower than Larcombe found in his study. It is recommended that a standardised value for Manning’s coefficient of roughness be set at 0.25. It is a mid-point in the Larcombe study and agrees favorably with The California recommendation. It is not felt that using the equations would provide necessarily a better result in design. For the 10-year storm analysis, it is assumed that the vegetation is submerged so the coefficient of roughness is reduced accordingly. The value selected is 0.03 (Chow, 1959).
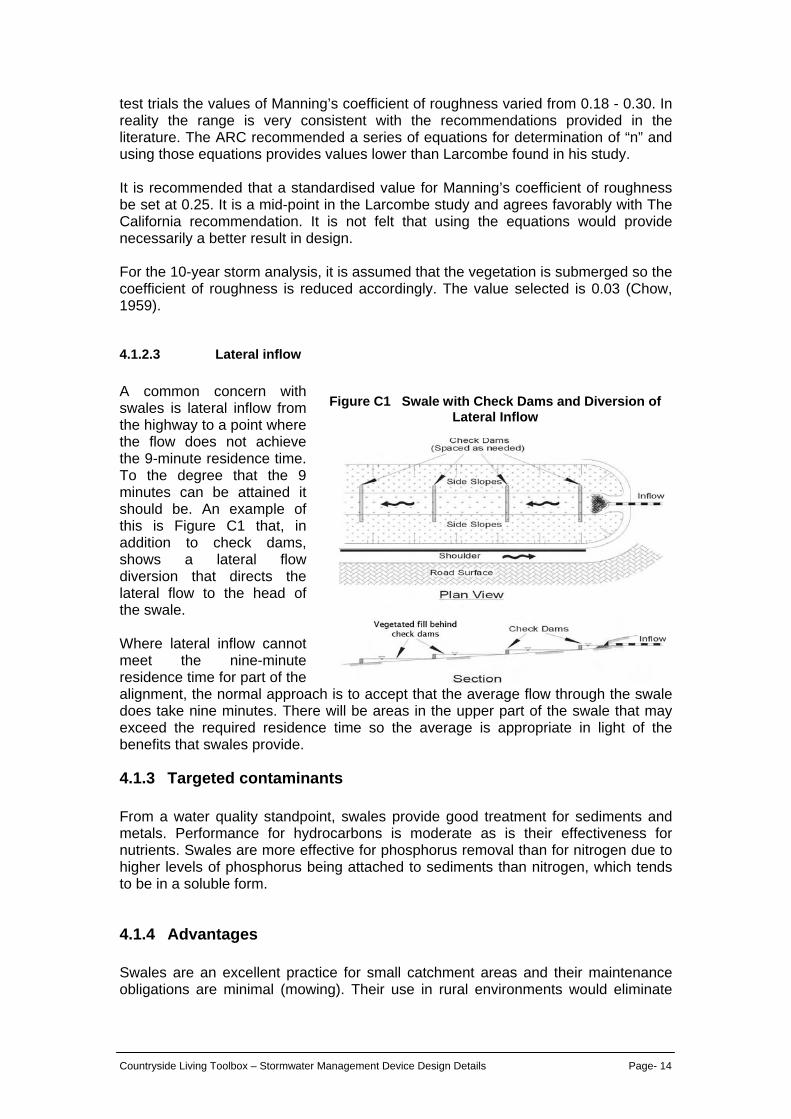
4.1.2.3 Lateral inflow A common concern with swales is lateral inflow from the highway to a point where the flow does not achieve the 9-minute residence time. To the degree that the 9 minutes can be attained it should be. An example of this is Figure C1 that, in addition to check dams, shows a lateral flow diversion that directs the lateral flow to the head of the swale. Where lateral inflow cannot meet the nine-minute residence time for part of the alignment, the normal approach is to accept that the average flow through the swale does take nine minutes. There will be areas in the upper part of the swale that may exceed the required residence time so the average is appropriate in light of the benefits that swales provide.
4.1.3 Targeted contaminants From a water quality standpoint, swales provide good treatment for sediments and metals. Performance for hydrocarbons is moderate as is their effectiveness for nutrients. Swales are more effective for phosphorus removal than for nitrogen due to higher levels of phosphorus being attached to sediments than nitrogen, which tends to be in a soluble form.
4.1.4 Advantages Swales are an excellent practice for small catchment areas and their maintenance obligations are minimal (mowing). Their use in rural environments would eliminate
Figure C1 Swale with Check Dams and Diversion of Lateral Inflow

Countryside Living Toolbox – Stormwater Management Device Design Details Page- 15
the need for kerbing and have lower stormwater flow velocities than would enclosed pipe systems. Swales are also a good practice to use as part of a treatment train to mitigate for the adverse effects that result from impervious surfaces.
4.1.5 Limitations Swales are limited to shallow slope areas to ensure low velocities of flow and meet residence time requirements. They are also only suitable for small catchment areas of less than 2 hectares.
4.1.6 Design sizing The design approach takes the designer through a series of steps that consider swale performance for water quality treatment and consideration of larger flows to ensure that scour or resuspension of deposited sediments does not occur.
1. Estimate runoff flow rate from the water quality storm using 1/3 of the 2-year storm as the water quality storm and calculate the flows. One difference between swale and filter strip design and other stormwater management practices is that they are designed by flow rate where other practices are designed by calculation of the water quality volume.
2. In using the Rational Formula for design, use the entire water quality storm as I. This would be the maximum possible value for discharge calculations and thus be conservative.
3. Establish the longitudinal slope of the swale. 4. Select a vegetation cover. It should
be grass and would generally be either perennial rye or fescue.
5. The value for Manning’s coefficient of roughness is 0.25
6. Select a swale shape. Two shapes are proposed as they ensure distributed flow throughout the bottom of the swale. Triangular swales are not recommended as they concentrate flow at the bottom of the swale. Channel geometry and equations for calculating cross-sectional areas and hydraulic radius are provided under the individual configurations in Figure C2.
7. An assumption is made on the depth of flow in the swale for the water quality storm. This assumed depth is used for calculating the bottom width of the swale and cross-sectional area.
8. Use Manning’s equation for calculating dimensions of the swale by using first approximations for the hydraulic radius and dimensions for selected shape.
Figure C2 Channel Geometry
Countryside Living Toolbox – Stormwater Management Device Design Details Page- 16
Q = AR0.67s0.5/n
By making some assumptions about depth and width ratios such as the hydraulic radius for a trapezoid approximating the depth (d), the bottom width of a trapezoid (b) equals the following:
b = (Qn/d1.67s0.5) - Zd The slope, depth, discharge and side slope are all known and b can be determined. Where: Q = design discharge flow rate (m3/s) n = Manning’s n (-) s = longitudinal slope (m/m) A = cross-sectional area (m2) R = hydraulic radius (m) T = top width of trapezoid/parabolic shape (m) d = depth of flow (m) b = bottom width of trapezoid (m) For a parabola, the depth and discharge are known so the top width can be solved for.
8. Knowing b (trapezoid) or T (parabola), the cross-sectional area can be
determined by the equations in Figure C2. 9. Calculate the swale velocity from the following equation: V = Q/A If V > 0.8 m/s repeat steps 1 - 9 until the velocity is less than 0.8 m/s. 10. Calculate the swale length (L in metres) L = Vt(60 s/minute) Where t = residence time in minutes.
4.1.6.1 Flows in excess of the water quality storm It is expected that runoff from events larger than the water quality design storm will go through the swale. In that situation, a stability check should be performed to ensure that the 10-year, 24-hour storm does not cause erosion. For the 10-year storm, flow velocities should not exceed 1.5 m/s, although higher velocities may be designed for with appropriate erosion protection. When considering larger storms consideration must be given to increased rainfall values as a result of climate change. Table C5 provides information on the percentage increase for design purposes.
4.1.6.2 Shallow slope situations
Countryside Living Toolbox – Stormwater Management Device Design Details Page- 17
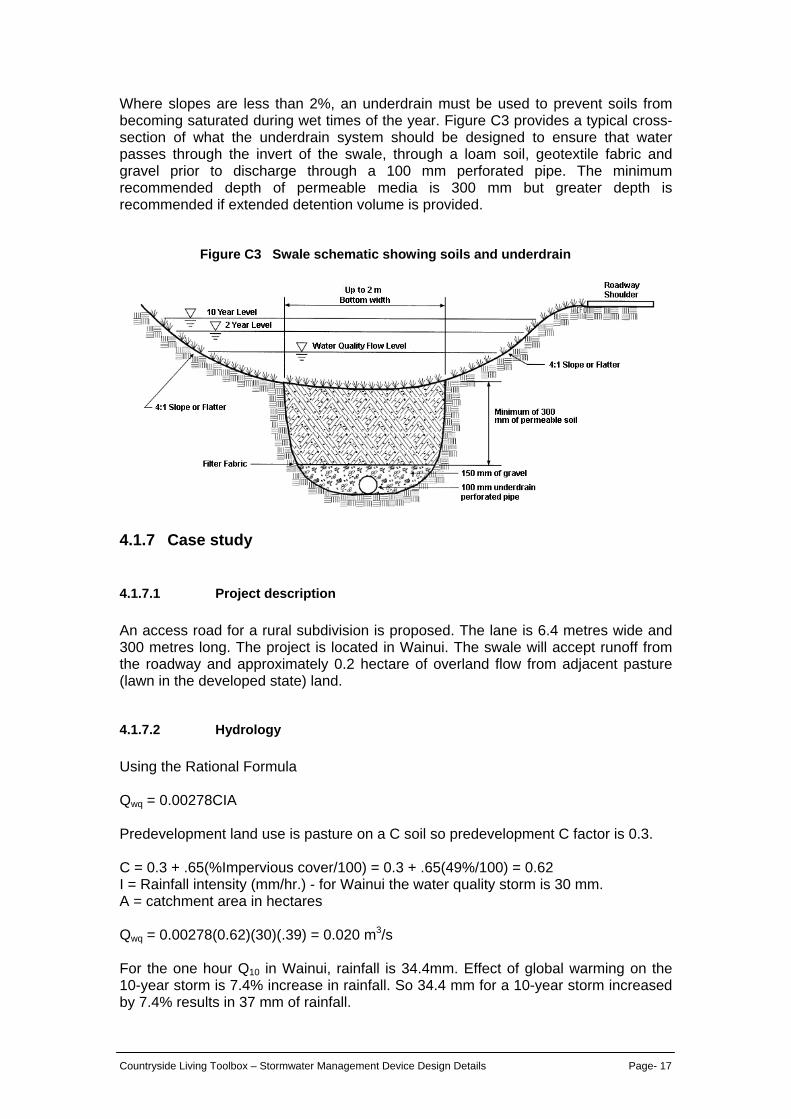
Where slopes are less than 2%, an underdrain must be used to prevent soils from becoming saturated during wet times of the year. Figure C3 provides a typical cross-section of what the underdrain system should be designed to ensure that water passes through the invert of the swale, through a loam soil, geotextile fabric and gravel prior to discharge through a 100 mm perforated pipe. The minimum recommended depth of permeable media is 300 mm but greater depth is recommended if extended detention volume is provided.
4.1.7 Case study
4.1.7.1 Project description An access road for a rural subdivision is proposed. The lane is 6.4 metres wide and 300 metres long. The project is located in Wainui. The swale will accept runoff from the roadway and approximately 0.2 hectare of overland flow from adjacent pasture (lawn in the developed state) land.
4.1.7.2 Hydrology Using the Rational Formula Qwq = 0.00278CIA Predevelopment land use is pasture on a C soil so predevelopment C factor is 0.3. C = 0.3 + .65(%Impervious cover/100) = 0.3 + .65(49%/100) = 0.62 I = Rainfall intensity (mm/hr.) - for Wainui the water quality storm is 30 mm. A = catchment area in hectares Qwq = 0.00278(0.62)(30)(.39) = 0.020 m3/s For the one hour Q10 in Wainui, rainfall is 34.4mm. Effect of global warming on the 10-year storm is 7.4% increase in rainfall. So 34.4 mm for a 10-year storm increased by 7.4% results in 37 mm of rainfall.
Figure C3 Swale schematic showing soils and underdrain

Countryside Living Toolbox – Stormwater Management Device Design Details Page- 18
Q10 = 0.00278(.62)(37)(0.39) = 0.024 m3/s
4.1.7.3 Swale Design Slope of swale alignment = 0.015 Several assumptions have to be made regarding the swale, first of which is that the swale will have a trapezoidal design. Side slopes (Z) will then be recommended and an assumption of design storm depth should be made. That value may change depending on the velocity of flow being less than 0.8 m/s. For this case study, Z = 4 and the depth of flow = 100 mm, which is also the design height of the grass. Based on the value for Q and s, and the assumptions for n and d, solve for the swale bottom width (b). b = (Qn/d1.67s0.5) - Zd b = ((.020)(.25)/(.11.67)(.0150.5)) - (4)(.1) = 1.52 m Calculate the top width T = b + 2dZ = 1.52 + 2(.1)(4) = 2.32 m Calculate the cross-sectional area A = bd + Zd2 = (1.52)(.1) + 4(.12) = 0.192 m2 Calculate the flow velocity V = Q/A = 0.020/0.192 = 0.1 m/s which is well under than the 0.8 m/s maximum - good. Calculate the swale length L = Vt = 0.1(540 sec.) = 54 metres As the swale will probably have larger flows pass through it, the swale design can be adjusted to account for the larger flows. In this situation the Manning coefficient of roughness will have to be decreased, as flow will be above the grass height so assume n = .03 as the vegetation is completely submerged. Solve for d and ensure that velocities are not erosive. Q10 = 0.024 m3/s. The following Table C4 relating flow depth to Manning’s n to discharge provides information on swale flow under larger flow conditions.
Table C4 - Flow Depth vs. Manning’s n versus Discharge Flow depth (m) Manning’s n Discharge (m3/s) 0.1 0.25 0.020 0.1 - 0.2 0.03 0.19 Total Discharge 0.206
Countryside Living Toolbox – Stormwater Management Device Design Details Page- 19
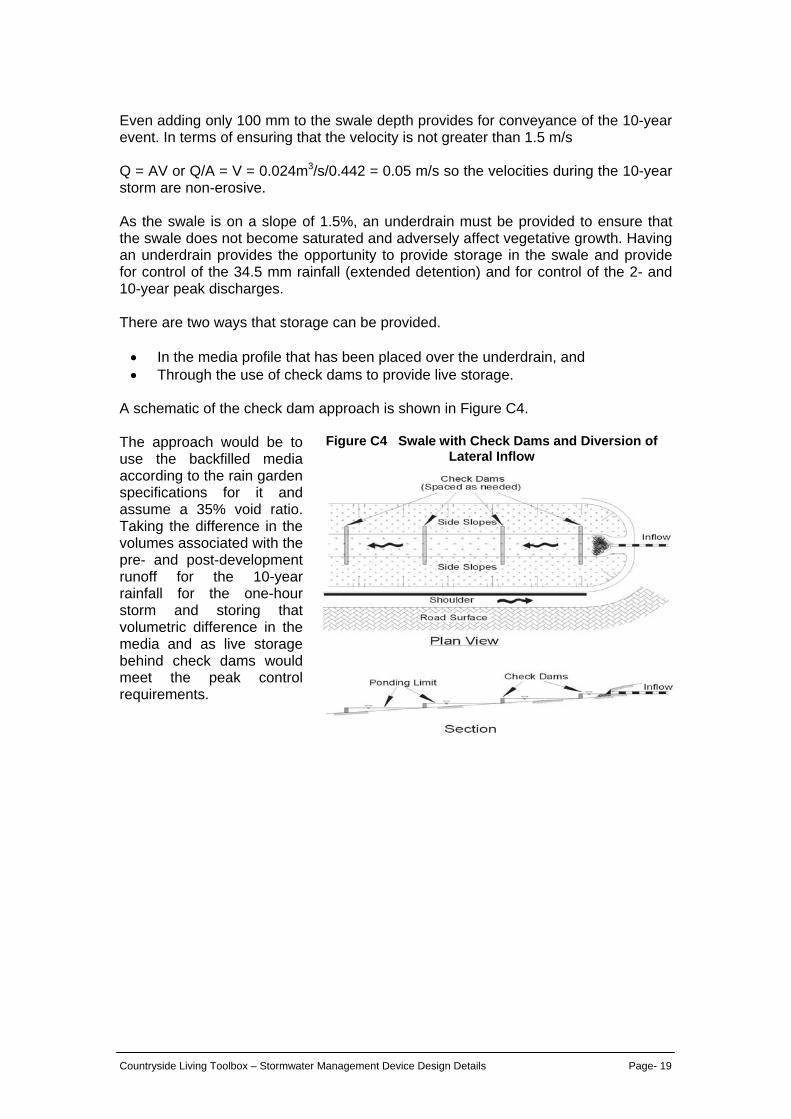
Even adding only 100 mm to the swale depth provides for conveyance of the 10-year event. In terms of ensuring that the velocity is not greater than 1.5 m/s Q = AV or Q/A = V = 0.024m3/s/0.442 = 0.05 m/s so the velocities during the 10-year storm are non-erosive. As the swale is on a slope of 1.5%, an underdrain must be provided to ensure that the swale does not become saturated and adversely affect vegetative growth. Having an underdrain provides the opportunity to provide storage in the swale and provide for control of the 34.5 mm rainfall (extended detention) and for control of the 2- and 10-year peak discharges. There are two ways that storage can be provided. • In the media profile that has been placed over the underdrain, and • Through the use of check dams to provide live storage.
A schematic of the check dam approach is shown in Figure C4. The approach would be to use the backfilled media according to the rain garden specifications for it and assume a 35% void ratio. Taking the difference in the volumes associated with the pre- and post-development runoff for the 10-year rainfall for the one-hour storm and storing that volumetric difference in the media and as live storage behind check dams would meet the peak control requirements.
Figure C4 Swale with Check Dams and Diversion of Lateral Inflow
Countryside Living Toolbox – Stormwater Management Device Design Details Page- 20
4.2 Filter strip design
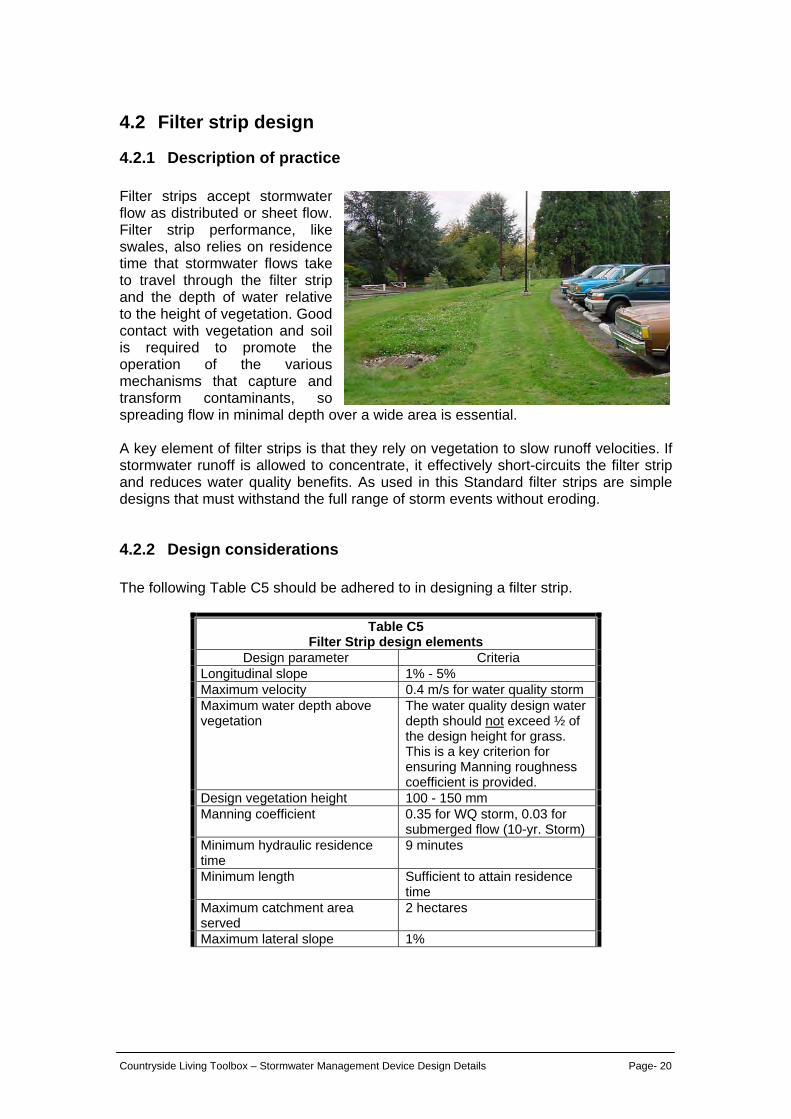
4.2.1 Description of practice Filter strips accept stormwater flow as distributed or sheet flow. Filter strip performance, like swales, also relies on residence time that stormwater flows take to travel through the filter strip and the depth of water relative to the height of vegetation. Good contact with vegetation and soil is required to promote the operation of the various mechanisms that capture and transform contaminants, so spreading flow in minimal depth over a wide area is essential. A key element of filter strips is that they rely on vegetation to slow runoff velocities. If stormwater runoff is allowed to concentrate, it effectively short-circuits the filter strip and reduces water quality benefits. As used in this Standard filter strips are simple designs that must withstand the full range of storm events without eroding.
4.2.2 Design considerations The following Table C5 should be adhered to in designing a filter strip.
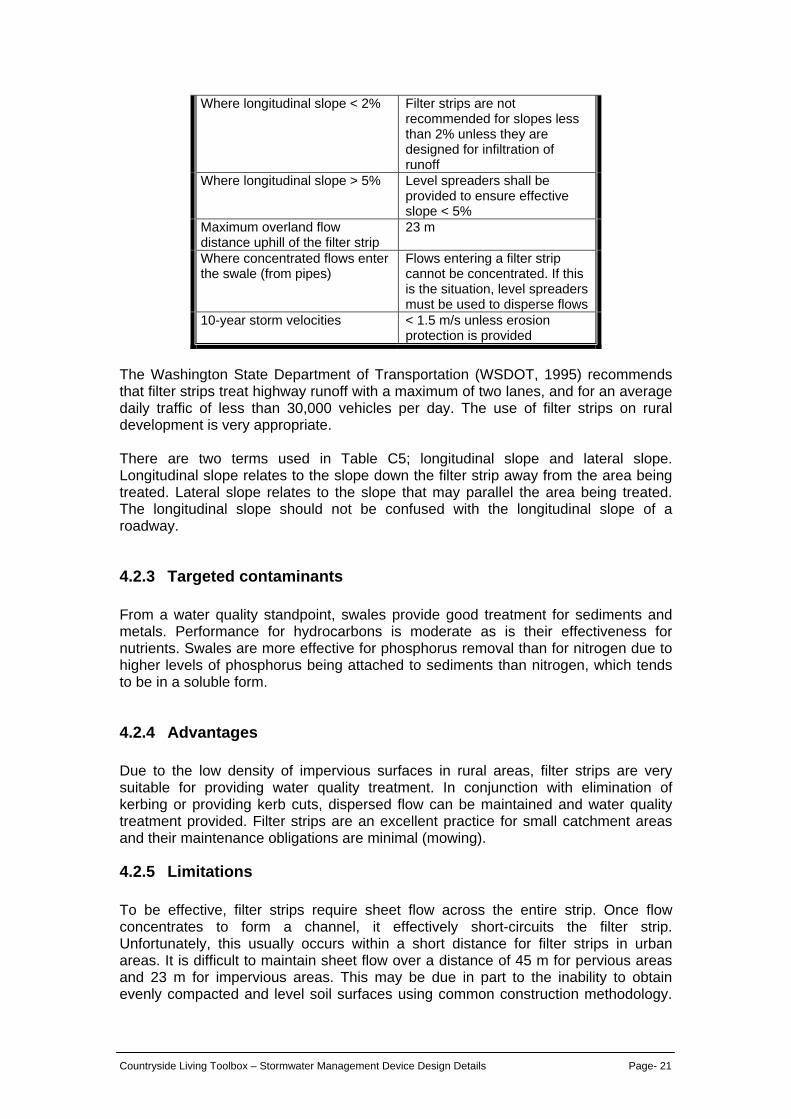
Table C5 Filter Strip design elements
Design parameter Criteria Longitudinal slope 1% - 5% Maximum velocity 0.4 m/s for water quality storm Maximum water depth above vegetation
The water quality design water depth should not exceed ½ of the design height for grass. This is a key criterion for ensuring Manning roughness coefficient is provided.
Design vegetation height 100 - 150 mm Manning coefficient 0.35 for WQ storm, 0.03 for
submerged flow (10-yr. Storm) Minimum hydraulic residence time
9 minutes
Minimum length Sufficient to attain residence time
Maximum catchment area served
2 hectares
Maximum lateral slope 1%
Countryside Living Toolbox – Stormwater Management Device Design Details Page- 21
Where longitudinal slope < 2% Filter strips are not recommended for slopes less than 2% unless they are designed for infiltration of runoff
Where longitudinal slope > 5% Level spreaders shall be provided to ensure effective slope < 5%
Maximum overland flow distance uphill of the filter strip
23 m
Where concentrated flows enter the swale (from pipes)
Flows entering a filter strip cannot be concentrated. If this is the situation, level spreaders must be used to disperse flows
10-year storm velocities < 1.5 m/s unless erosion protection is provided
The Washington State Department of Transportation (WSDOT, 1995) recommends that filter strips treat highway runoff with a maximum of two lanes, and for an average daily traffic of less than 30,000 vehicles per day. The use of filter strips on rural development is very appropriate. There are two terms used in Table C5; longitudinal slope and lateral slope. Longitudinal slope relates to the slope down the filter strip away from the area being treated. Lateral slope relates to the slope that may parallel the area being treated. The longitudinal slope should not be confused with the longitudinal slope of a roadway.
4.2.3 Targeted contaminants From a water quality standpoint, swales provide good treatment for sediments and metals. Performance for hydrocarbons is moderate as is their effectiveness for nutrients. Swales are more effective for phosphorus removal than for nitrogen due to higher levels of phosphorus being attached to sediments than nitrogen, which tends to be in a soluble form.
4.2.4 Advantages Due to the low density of impervious surfaces in rural areas, filter strips are very suitable for providing water quality treatment. In conjunction with elimination of kerbing or providing kerb cuts, dispersed flow can be maintained and water quality treatment provided. Filter strips are an excellent practice for small catchment areas and their maintenance obligations are minimal (mowing).
4.2.5 Limitations To be effective, filter strips require sheet flow across the entire strip. Once flow concentrates to form a channel, it effectively short-circuits the filter strip. Unfortunately, this usually occurs within a short distance for filter strips in urban areas. It is difficult to maintain sheet flow over a distance of 45 m for pervious areas and 23 m for impervious areas. This may be due in part to the inability to obtain evenly compacted and level soil surfaces using common construction methodology.
Countryside Living Toolbox – Stormwater Management Device Design Details Page- 22
For some applications, a level spreader can be used to help ensure even distribution of stormwater onto the filter strip. Due to the limited distance that flow can be maintained in sheet flow, they are only suitable for small catchment areas. In addition, they are primarily water quality practices and have little benefit for peak flow control or storage and release of the extended detention volume.
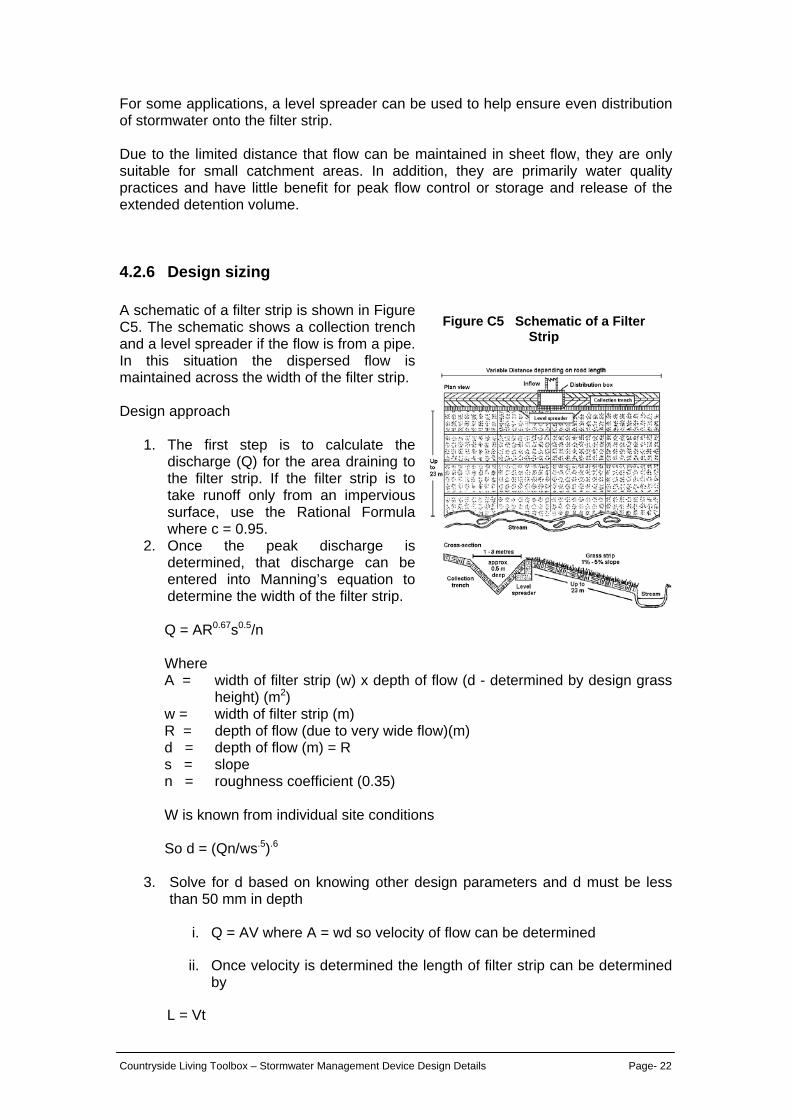
4.2.6 Design sizing A schematic of a filter strip is shown in Figure C5. The schematic shows a collection trench and a level spreader if the flow is from a pipe. In this situation the dispersed flow is maintained across the width of the filter strip. Design approach
1. The first step is to calculate the discharge (Q) for the area draining to the filter strip. If the filter strip is to take runoff only from an impervious surface, use the Rational Formula where c = 0.95.
2. Once the peak discharge is determined, that discharge can be entered into Manning’s equation to determine the width of the filter strip.
Q = AR0.67s0.5/n
Where A = width of filter strip (w) x depth of flow (d - determined by design grass
height) (m2) w = width of filter strip (m) R = depth of flow (due to very wide flow)(m) d = depth of flow (m) = R s = slope n = roughness coefficient (0.35) W is known from individual site conditions So d = (Qn/ws.5).6
3. Solve for d based on knowing other design parameters and d must be less
than 50 mm in depth
i. Q = AV where A = wd so velocity of flow can be determined
ii. Once velocity is determined the length of filter strip can be determined by
L = Vt
Figure C5 Schematic of a Filter Strip
Countryside Living Toolbox – Stormwater Management Device Design Details Page- 23
Where: L = length in metres V = velocity in m/s t = time in seconds (540 seconds for 9 minute residence time)
4.2.7 Case study A driveway is being constructed with a filter strip providing stormwater treatment. The project is located in Swanson so the water quality storm depth is 29 mm. The slope of land adjacent to the driveway is 3% and the driveway is 100 metres long with a width of 3.4 metres wide.
4.2.7.1 Hydrology Using the Rational Formula Qwq = 0.00278CIA C = 0.3 + .65(%Impervious cover/100) = 0.3 + .65(100%/100) = 0.95 I = Rainfall intensity (mm/hr.) - for Swanson the water quality storm is 29 mm. A = catchment area in hectares Qwq = 0.00278(0.95)(29)(0.034) = 0.0026 m3/s For Swanson, the 10-year 1-hour storm is 34.8 mm; the effect of global warming for the 10-year/1 hour storm is predicted to be 7.4% increase in rainfall. So, design rainfall for the 10-year storm = 37.4 mm. Q10 = 0.00278(.95)(37.4)(0..034) = 0.034 m3/s
4.2.7.2 Filter strip design
1. Q = AR0.67s0.5/n
Where Q = water quality discharge (m3/s) A = area of filter strip = (w -width in m)(depth of flow - d - in metres) R = 0.029 m based on water quality storm and very wide flow path s = .03 n = .35
2. The width is given based on site conditions so solve for y and ensure
that it is less than 0.05 m. d = (Qn/ws.5).6
You will know “w” based on local site conditions. For this example, assume w = 75 metres.
d = (.0026(.35)/75(.03).5).6

Countryside Living Toolbox – Stormwater Management Device Design Details Page- 24
d = 3.2 mm which is well under the maximum of 50 mm.
3. Calculate the flow velocity
V = Q/wd = .0026/75(.0032) = .01 m/s which is well under the maximum 0.4 m/s allowed.
4. Calculate the length of the filter strip.
L = Vt = .01(540) = 5.4 metres in length.
As can be seen from this example, the filter strip width can be reduced substantially to adjust to site conditions. The two key elements are a maximum depth of flow during the water quality storm of 50 mm and a residence time of at least 9 minutes (540 seconds) to establish the length of the filter strip. In terms of a 2- or 10-year storm, the main concern is that velocities of flow not exceed 1.5 m/s. An analysis of the 10-year storm (worst case scenario) is now provided. Q10 = 0.034 m3/s Again using Manning’s equation: Q = AR0.67s0.5/n and solve for d through the equation: d = (Qn/ws.5).6 As the depth of flow still does not exceed the grass height the same n factor will be used. If the width of the filter strip were smaller and the depth of flow would exceed the design grass height an appropriate roughness coefficient to be used would be n = 0.15 d = (.034(.15)/75(.03).5).6 d = 0.009 m Using the value to ensure that the velocity of flow during a 10-year storm will not exceed 1.5 m/s V = Q/wd = 0.034/75(.009) V = 0.05 m/s which is well under an erosive velocity.
Countryside Living Toolbox – Stormwater Management Device Design Details Page- 25
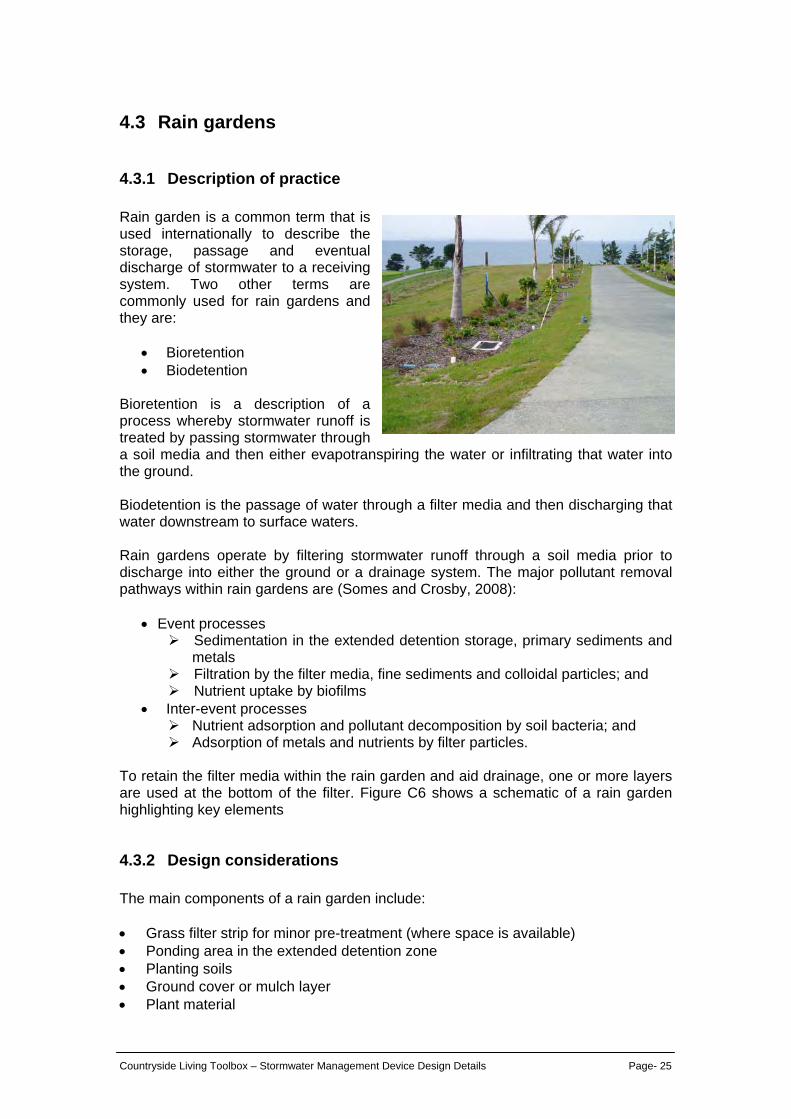
4.3 Rain gardens
4.3.1 Description of practice Rain garden is a common term that is used internationally to describe the storage, passage and eventual discharge of stormwater to a receiving system. Two other terms are commonly used for rain gardens and they are:
• Bioretention • Biodetention
Bioretention is a description of a process whereby stormwater runoff is treated by passing stormwater through a soil media and then either evapotranspiring the water or infiltrating that water into the ground. Biodetention is the passage of water through a filter media and then discharging that water downstream to surface waters. Rain gardens operate by filtering stormwater runoff through a soil media prior to discharge into either the ground or a drainage system. The major pollutant removal pathways within rain gardens are (Somes and Crosby, 2008):
• Event processes Sedimentation in the extended detention storage, primary sediments and
metals Filtration by the filter media, fine sediments and colloidal particles; and Nutrient uptake by biofilms
• Inter-event processes Nutrient adsorption and pollutant decomposition by soil bacteria; and Adsorption of metals and nutrients by filter particles.
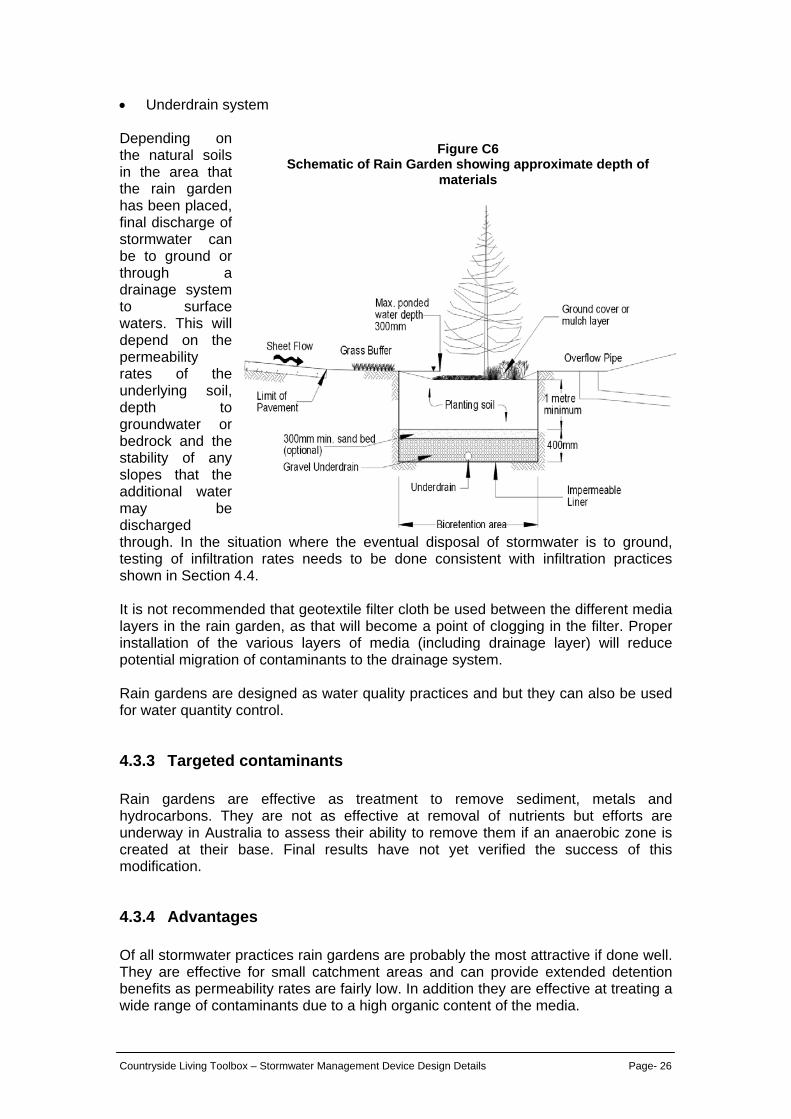
To retain the filter media within the rain garden and aid drainage, one or more layers are used at the bottom of the filter. Figure C6 shows a schematic of a rain garden highlighting key elements
4.3.2 Design considerations The main components of a rain garden include: • Grass filter strip for minor pre-treatment (where space is available) • Ponding area in the extended detention zone • Planting soils • Ground cover or mulch layer • Plant material
Countryside Living Toolbox – Stormwater Management Device Design Details Page- 26
• Underdrain system Depending on the natural soils in the area that the rain garden has been placed, final discharge of stormwater can be to ground or through a drainage system to surface waters. This will depend on the permeability rates of the underlying soil, depth to groundwater or bedrock and the stability of any slopes that the additional water may be discharged through. In the situation where the eventual disposal of stormwater is to ground, testing of infiltration rates needs to be done consistent with infiltration practices shown in Section 4.4. It is not recommended that geotextile filter cloth be used between the different media layers in the rain garden, as that will become a point of clogging in the filter. Proper installation of the various layers of media (including drainage layer) will reduce potential migration of contaminants to the drainage system. Rain gardens are designed as water quality practices and but they can also be used for water quantity control.
4.3.3 Targeted contaminants Rain gardens are effective as treatment to remove sediment, metals and hydrocarbons. They are not as effective at removal of nutrients but efforts are underway in Australia to assess their ability to remove them if an anaerobic zone is created at their base. Final results have not yet verified the success of this modification.
4.3.4 Advantages Of all stormwater practices rain gardens are probably the most attractive if done well. They are effective for small catchment areas and can provide extended detention benefits as permeability rates are fairly low. In addition they are effective at treating a wide range of contaminants due to a high organic content of the media.
Figure C6 Schematic of Rain Garden showing approximate depth of
materials
Countryside Living Toolbox – Stormwater Management Device Design Details Page- 27
4.3.5 Limitations Rain gardens are only suitable for small catchment areas below approximately 2 hectares. For larger areas a constructed wetland would be a better alternative. Another practical limitation is steeper slopes. While a rain garden can be engineered to fit steeper sites there are practical limitations such as retaining wall height or very deep cuts in a given slope.
4.3.6 Design sizing Design approach:
1. Determine the water quality storage volume using 1/3 of the 2-year storm rainfall depth as shown in the ARC’s TP 108.
2. Minimum live storage provided above the soil media is 40% of the water quality volume to ensure that the entire water quality storm passes through the rain garden. Failure to provide the storage will result in system bypass and reduced water quality expectations.
3. Calculate the required surface area of the rain garden.
Arg = (WQV)(drg)/k(h+drg)trg Where: Arg = surface area of rain garden (m2) WQV = water quality treatment volume (m3) drg = planting soil depth (m) k = coefficient of permeability (m/day) h = average height of water (m) = ½ maximum depth trg = time to pass WQV through soil bed (days) The following values should be used. drg = 1.0 metre (limiting media) k = 0.5 m/d (slightly higher than TP 10 recommendation) h = 0.15 m (maximum water depth 300 mm) trg = 1.0 for residential, 1.5 days for commercial or industrial
4. General comments on rain gardens
• If less depth of media must be used due to local constrictions (bedrock, groundwater) the area of storage must be increased so the same volume of storage in the media is maintained. The simplest way to ensure the storage volume is maintained is the following ratio:
Arev. = Arg/drev. Where: Arev = revised surface area resulting from decreased depth Arg = Area of rain garden calculated in step 3 (m2) drev. = actual depth provided
Countryside Living Toolbox – Stormwater Management Device Design Details Page- 28
• The coefficient of permeability will initially decline during the establishment phase, as the filter media settles and compacts, but this will level out and then start to increase as the plant community establishes itself and the rooting depth increases.
• Keep drainage areas small and avoid sizing them for too large a catchment area. It is better to have more rain gardens than larger ones.
• Place them in areas where they will not interfere with normal use of the property and where they don’t interfere with sight lines, which may present safety issues.
• Where possible, design them as off-line systems so that larger flows do not scour the surface of the rain gardens.
5. Composition of planting soil
The Facility for Advancing Water Biofiltration (FAWB) has been investigating filter media for several years and has developed the following recommendations for the composition of planting soil (FAWB, 2008). The FAWB bioretention filter media guidelines require three layers of media. The filter media itself (400 - 600 mm deep), a transition layer (100 mm deep) and a drainage layer (50 mm minimum under drainage pipe cover. The FAWB recommendations are shallower than those recommended here as storage is available in the toolbox requirements for storage and release of the 34.5 mm rainfall over a 24-hour period. The filter media is required to support a range of vegetation types (from groundcovers to trees) that are adapted to freely draining soils with occasional flooding. The material should be: • Based on natural soils or amended natural soils and can be of siliceous or
calcareous origin, • In general, the media should be loamy sand with an appropriately high
permeability under compaction and should be free of rubbish, deleterious material, toxicants, noxious plants and local weeds and should not be hydrophobic.
• The filter media should contain some organic matter for increased water holding capacity but low in nutrient content.
6. Determination of hydraulic conductivity
If required for maintenance reasons, the hydraulic conductivity of potential filter media should be measured using the ASTM F1815-06 method (ASTM International, 2006). This test method uses a compaction method that best represents field conditions and so provides a more realistic assessment of hydraulic conductivity than other test methods. The hydraulic conductivity, or permeability, has been selected as 0.5 m/day. If the conductivity were measured upon construction completion the permeability may be much higher. The value selected accounts for partial clogging over time, which does occur and the rain garden size is then appropriate in surface area for the partial clogged condition.
7. Particle size distribution
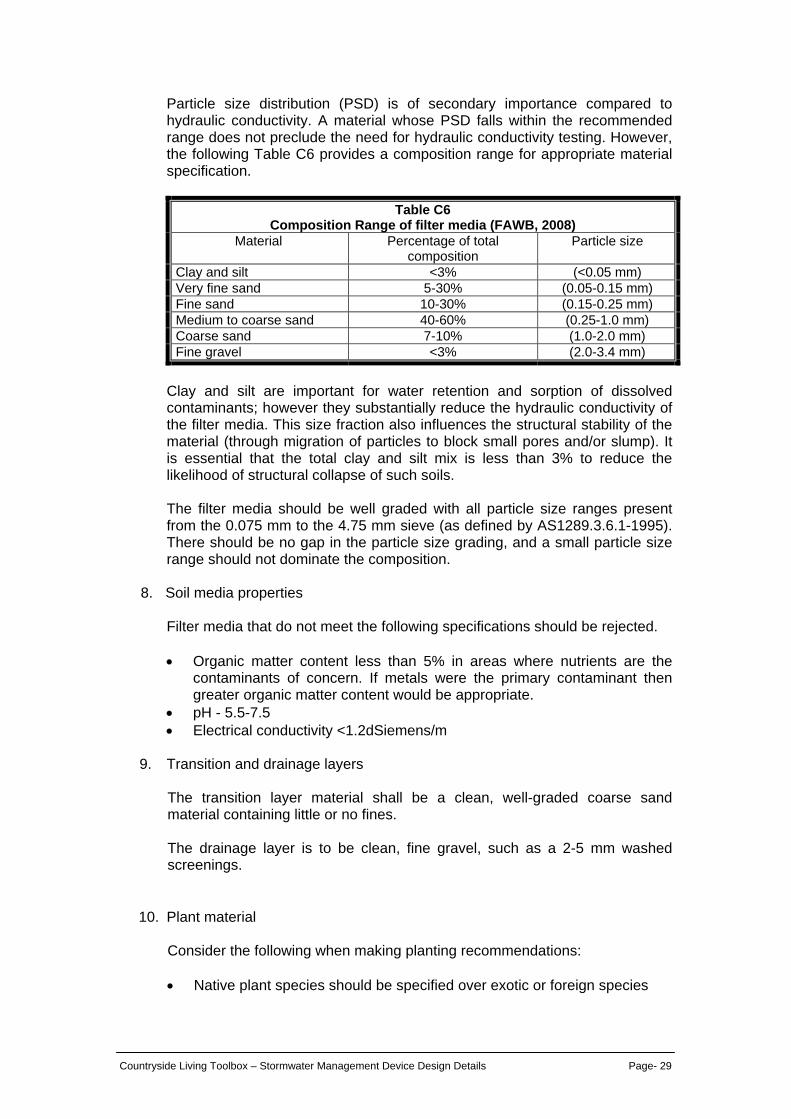
Countryside Living Toolbox – Stormwater Management Device Design Details Page- 29
Particle size distribution (PSD) is of secondary importance compared to hydraulic conductivity. A material whose PSD falls within the recommended range does not preclude the need for hydraulic conductivity testing. However, the following Table C6 provides a composition range for appropriate material specification.
Table C6 Composition Range of filter media (FAWB, 2008)
Material Percentage of total composition
Particle size
Clay and silt <3% (<0.05 mm) Very fine sand 5-30% (0.05-0.15 mm) Fine sand 10-30% (0.15-0.25 mm) Medium to coarse sand 40-60% (0.25-1.0 mm) Coarse sand 7-10% (1.0-2.0 mm) Fine gravel <3% (2.0-3.4 mm)
Clay and silt are important for water retention and sorption of dissolved contaminants; however they substantially reduce the hydraulic conductivity of the filter media. This size fraction also influences the structural stability of the material (through migration of particles to block small pores and/or slump). It is essential that the total clay and silt mix is less than 3% to reduce the likelihood of structural collapse of such soils. The filter media should be well graded with all particle size ranges present from the 0.075 mm to the 4.75 mm sieve (as defined by AS1289.3.6.1-1995). There should be no gap in the particle size grading, and a small particle size range should not dominate the composition.
8. Soil media properties
Filter media that do not meet the following specifications should be rejected. • Organic matter content less than 5% in areas where nutrients are the
contaminants of concern. If metals were the primary contaminant then greater organic matter content would be appropriate.
• pH - 5.5-7.5 • Electrical conductivity <1.2dSiemens/m
9. Transition and drainage layers
The transition layer material shall be a clean, well-graded coarse sand material containing little or no fines. The drainage layer is to be clean, fine gravel, such as a 2-5 mm washed screenings.
10. Plant material
Consider the following when making planting recommendations: • Native plant species should be specified over exotic or foreign species
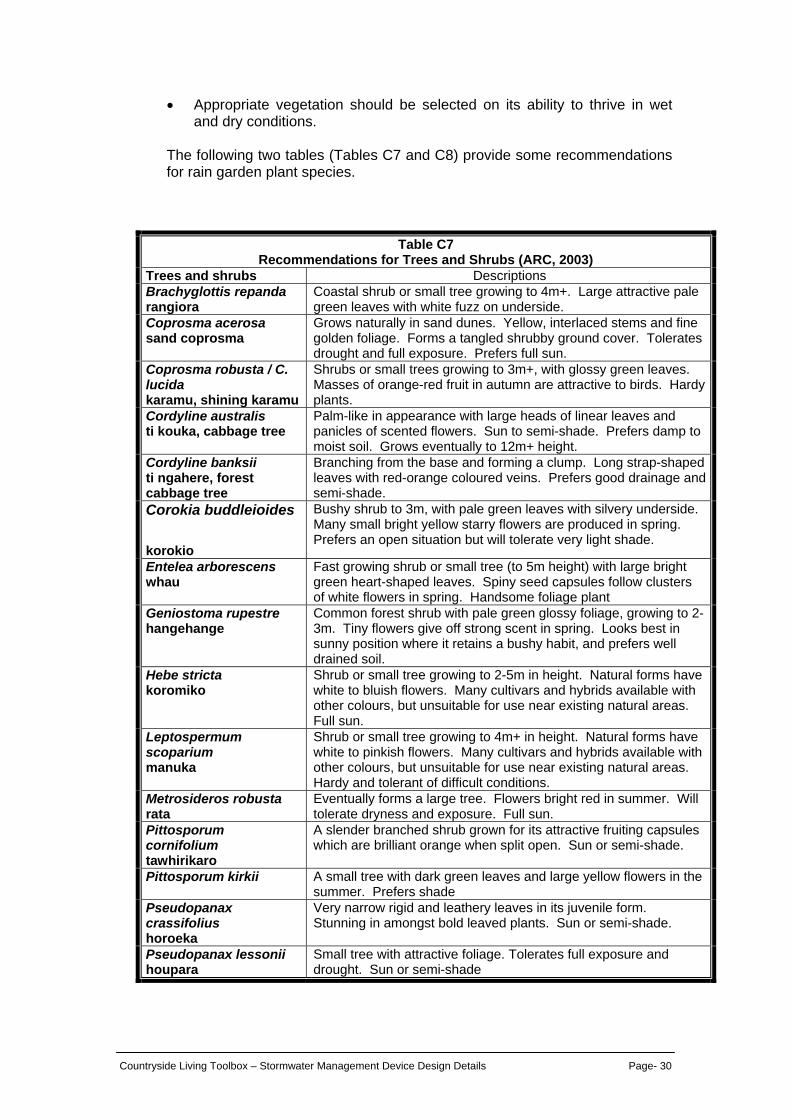
Countryside Living Toolbox – Stormwater Management Device Design Details Page- 30
• Appropriate vegetation should be selected on its ability to thrive in wet and dry conditions.
The following two tables (Tables C7 and C8) provide some recommendations for rain garden plant species.
Table C7
Recommendations for Trees and Shrubs (ARC, 2003) Trees and shrubs Descriptions Brachyglottis repanda rangiora
Coastal shrub or small tree growing to 4m+. Large attractive pale green leaves with white fuzz on underside.
Coprosma acerosa sand coprosma
Grows naturally in sand dunes. Yellow, interlaced stems and fine golden foliage. Forms a tangled shrubby ground cover. Tolerates drought and full exposure. Prefers full sun.
Coprosma robusta / C. lucida karamu, shining karamu
Shrubs or small trees growing to 3m+, with glossy green leaves. Masses of orange-red fruit in autumn are attractive to birds. Hardy plants.
Cordyline australis ti kouka, cabbage tree
Palm-like in appearance with large heads of linear leaves and panicles of scented flowers. Sun to semi-shade. Prefers damp to moist soil. Grows eventually to 12m+ height.
Cordyline banksii ti ngahere, forest cabbage tree
Branching from the base and forming a clump. Long strap-shaped leaves with red-orange coloured veins. Prefers good drainage and semi-shade.
Corokia buddleioides
korokio
Bushy shrub to 3m, with pale green leaves with silvery underside. Many small bright yellow starry flowers are produced in spring. Prefers an open situation but will tolerate very light shade.
Entelea arborescens whau
Fast growing shrub or small tree (to 5m height) with large bright green heart-shaped leaves. Spiny seed capsules follow clusters of white flowers in spring. Handsome foliage plant
Geniostoma rupestre hangehange
Common forest shrub with pale green glossy foliage, growing to 2-3m. Tiny flowers give off strong scent in spring. Looks best in sunny position where it retains a bushy habit, and prefers well drained soil.
Hebe stricta koromiko
Shrub or small tree growing to 2-5m in height. Natural forms have white to bluish flowers. Many cultivars and hybrids available with other colours, but unsuitable for use near existing natural areas. Full sun.
Leptospermum scoparium manuka
Shrub or small tree growing to 4m+ in height. Natural forms have white to pinkish flowers. Many cultivars and hybrids available with other colours, but unsuitable for use near existing natural areas. Hardy and tolerant of difficult conditions.
Metrosideros robusta rata
Eventually forms a large tree. Flowers bright red in summer. Will tolerate dryness and exposure. Full sun.
Pittosporum cornifolium tawhirikaro
A slender branched shrub grown for its attractive fruiting capsules which are brilliant orange when split open. Sun or semi-shade.
Pittosporum kirkii A small tree with dark green leaves and large yellow flowers in the summer. Prefers shade
Pseudopanax crassifolius horoeka
Very narrow rigid and leathery leaves in its juvenile form. Stunning in amongst bold leaved plants. Sun or semi-shade.
Pseudopanax lessonii houpara
Small tree with attractive foliage. Tolerates full exposure and drought. Sun or semi-shade
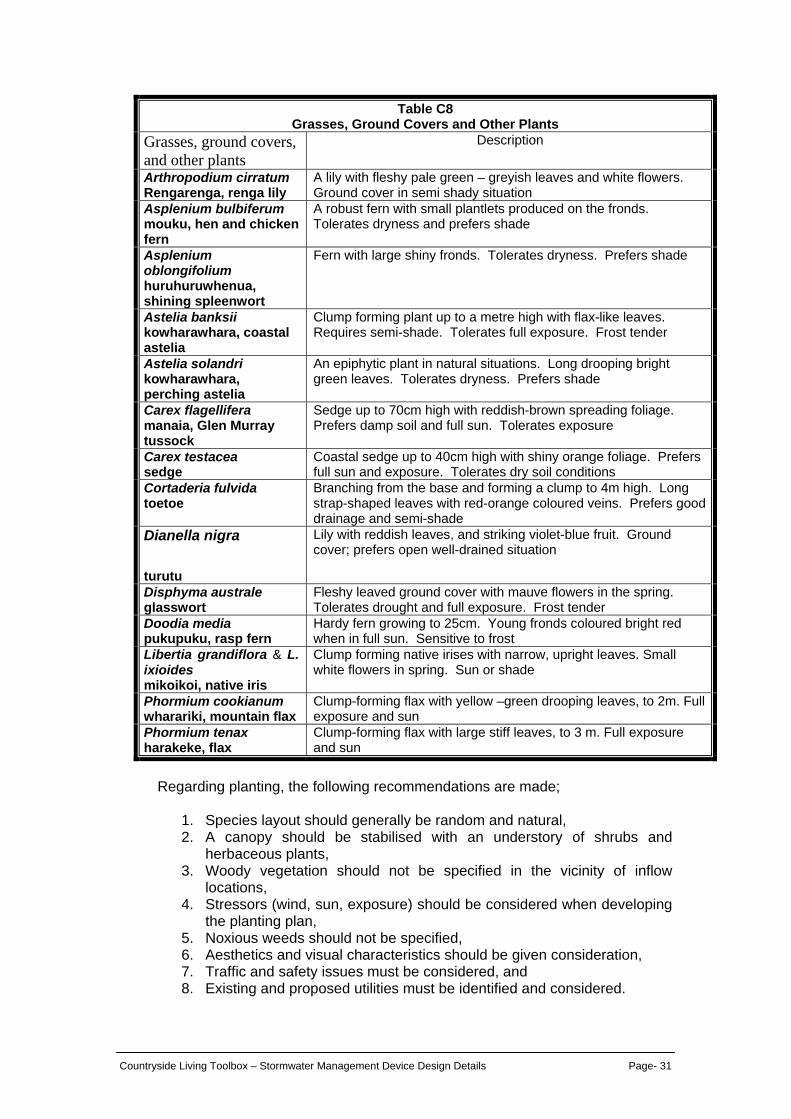
Countryside Living Toolbox – Stormwater Management Device Design Details Page- 31
Table C8 Grasses, Ground Covers and Other Plants
Grasses, ground covers, and other plants
Description
Arthropodium cirratum Rengarenga, renga lily
A lily with fleshy pale green – greyish leaves and white flowers. Ground cover in semi shady situation
Asplenium bulbiferum mouku, hen and chicken fern
A robust fern with small plantlets produced on the fronds. Tolerates dryness and prefers shade
Asplenium oblongifolium huruhuruwhenua, shining spleenwort
Fern with large shiny fronds. Tolerates dryness. Prefers shade
Astelia banksii kowharawhara, coastal astelia
Clump forming plant up to a metre high with flax-like leaves. Requires semi-shade. Tolerates full exposure. Frost tender
Astelia solandri kowharawhara, perching astelia
An epiphytic plant in natural situations. Long drooping bright green leaves. Tolerates dryness. Prefers shade
Carex flagellifera manaia, Glen Murray tussock
Sedge up to 70cm high with reddish-brown spreading foliage. Prefers damp soil and full sun. Tolerates exposure
Carex testacea sedge
Coastal sedge up to 40cm high with shiny orange foliage. Prefers full sun and exposure. Tolerates dry soil conditions
Cortaderia fulvida toetoe
Branching from the base and forming a clump to 4m high. Long strap-shaped leaves with red-orange coloured veins. Prefers good drainage and semi-shade
Dianella nigra
turutu
Lily with reddish leaves, and striking violet-blue fruit. Ground cover; prefers open well-drained situation
Disphyma australe glasswort
Fleshy leaved ground cover with mauve flowers in the spring. Tolerates drought and full exposure. Frost tender
Doodia media pukupuku, rasp fern
Hardy fern growing to 25cm. Young fronds coloured bright red when in full sun. Sensitive to frost
Libertia grandiflora & L. ixioides mikoikoi, native iris
Clump forming native irises with narrow, upright leaves. Small white flowers in spring. Sun or shade
Phormium cookianum wharariki, mountain flax
Clump-forming flax with yellow –green drooping leaves, to 2m. Full exposure and sun
Phormium tenax harakeke, flax
Clump-forming flax with large stiff leaves, to 3 m. Full exposure and sun
Regarding planting, the following recommendations are made;
1. Species layout should generally be random and natural, 2. A canopy should be stabilised with an understory of shrubs and
herbaceous plants, 3. Woody vegetation should not be specified in the vicinity of inflow
locations, 4. Stressors (wind, sun, exposure) should be considered when developing
the planting plan, 5. Noxious weeds should not be specified, 6. Aesthetics and visual characteristics should be given consideration, 7. Traffic and safety issues must be considered, and 8. Existing and proposed utilities must be identified and considered.
Countryside Living Toolbox – Stormwater Management Device Design Details Page- 32
4.3.7 Case study
4.3.7.1 Project description A driveway/access interchange (road crowned in the centre so only ½ road area is included) is proposed in Papakura with a rain garden proposed due to aesthetics, peak control and water quality treatment. The total extent of the catchment being served is 820 m2 of which 60% is impervious with the remainder being road or driveway verge.
4.3.7.2 Hydrology
1. Calculate the water quality volume to be treated.
Water quality storm from TP 108 = 23 mm of rainfall
The catchment effective first flush runoff area = Aeff = impervious% x total Area (ha). Aeff = (.6)0.082 = 0.049 The first flush volume Vff = 10 x Aeff x dff (m3)
Where dff = first flush water quality depth (water quality storm) So, Vff = 10 x 0.049 x 23 = 11.3 m3
To account for extended detention from the impervious surfaces, 30% more storage must be added to the water quality volume to provide additional control. Revised WQV = 14.7 m3
4.3.7.3 Rain garden design
2. Live volume of storage needed Vlive = .40(14.7 m3) = 5.9 m3
3. Calculate the required surface area of the rain garden.
Arg = (WQV)(drg)/k(h+drg)trg Where: Arg = surface area of rain garden (m2) WQV = water quality treatment volume (m3) drg = planting soil depth (m) k = coefficient of permeability (m/day) h = average height of water (m) = ½ maximum depth trg time to pass WQV through soil bed The following values should be used. drg = 1.0 metre k = 0.5 m/d h = 0.15 m (maximum water depth 300 mm) trg = 1.0 days

Countryside Living Toolbox – Stormwater Management Device Design Details Page- 33
Arg = 14.7(1)/0.5(0.15+1)(1.0) Arg = 25.6 m2 Check to ensure that the surface area calculated and having 0.3 m of live storage provides at least 5.9 m3. (25.6)(0.3) = 7.68 m3 so the surface area of the rain garden provides for the necessary live storage. By sizing the rain garden for 1.3 times the water quality volume, extended detention is provided along with storing the difference between the 2- and 10-year storms.
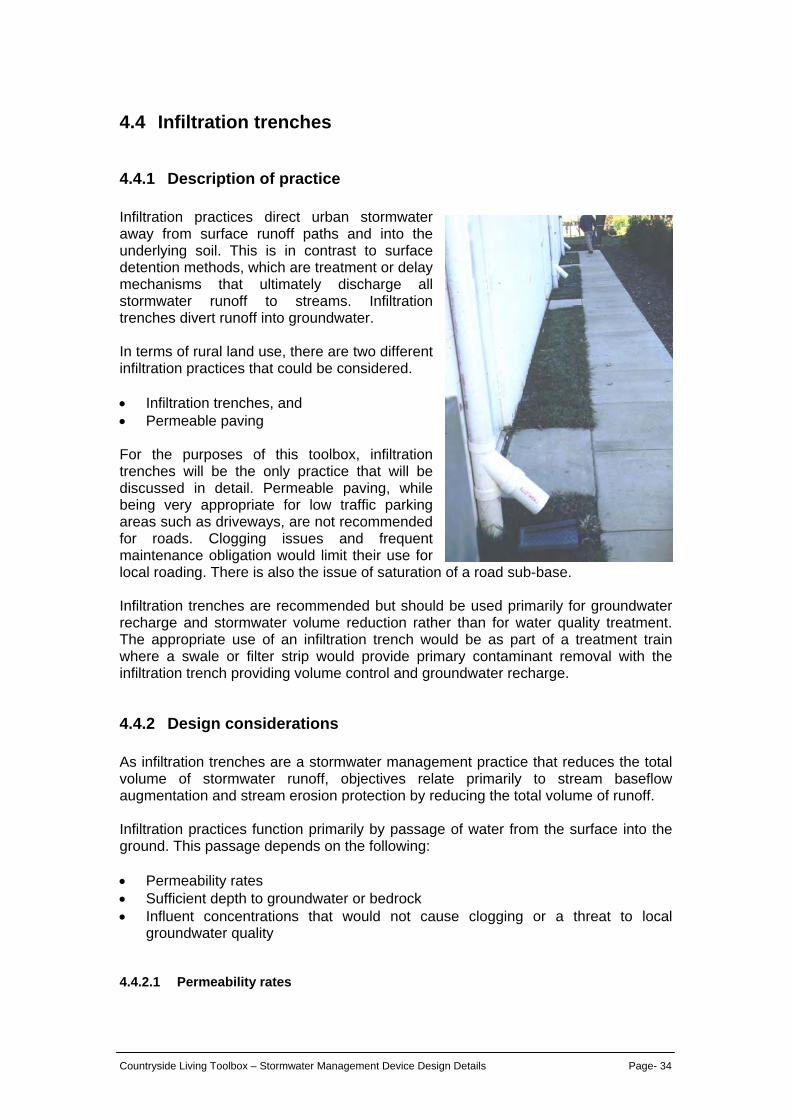
Countryside Living Toolbox – Stormwater Management Device Design Details Page- 34
4.4 Infiltration trenches
4.4.1 Description of practice Infiltration practices direct urban stormwater away from surface runoff paths and into the underlying soil. This is in contrast to surface detention methods, which are treatment or delay mechanisms that ultimately discharge all stormwater runoff to streams. Infiltration trenches divert runoff into groundwater. In terms of rural land use, there are two different infiltration practices that could be considered. • Infiltration trenches, and • Permeable paving For the purposes of this toolbox, infiltration trenches will be the only practice that will be discussed in detail. Permeable paving, while being very appropriate for low traffic parking areas such as driveways, are not recommended for roads. Clogging issues and frequent maintenance obligation would limit their use for local roading. There is also the issue of saturation of a road sub-base. Infiltration trenches are recommended but should be used primarily for groundwater recharge and stormwater volume reduction rather than for water quality treatment. The appropriate use of an infiltration trench would be as part of a treatment train where a swale or filter strip would provide primary contaminant removal with the infiltration trench providing volume control and groundwater recharge.
4.4.2 Design considerations As infiltration trenches are a stormwater management practice that reduces the total volume of stormwater runoff, objectives relate primarily to stream baseflow augmentation and stream erosion protection by reducing the total volume of runoff. Infiltration practices function primarily by passage of water from the surface into the ground. This passage depends on the following: • Permeability rates • Sufficient depth to groundwater or bedrock • Influent concentrations that would not cause clogging or a threat to local
groundwater quality
4.4.2.1 Permeability rates
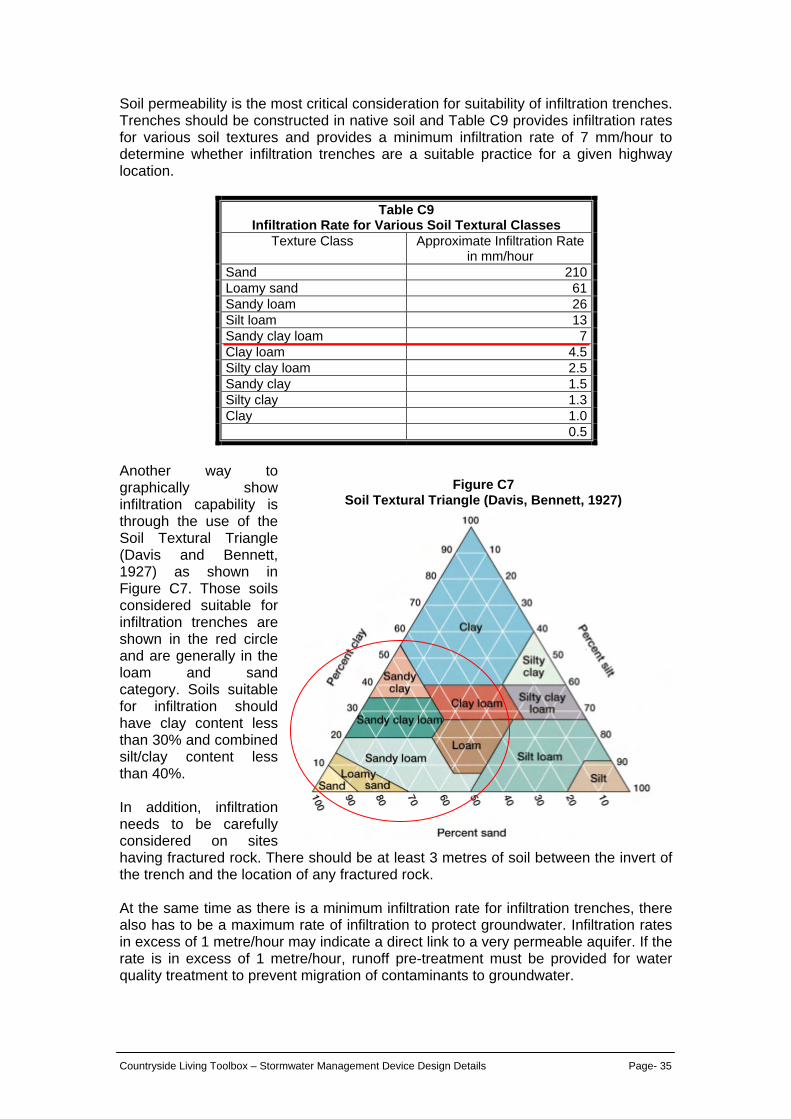
Countryside Living Toolbox – Stormwater Management Device Design Details Page- 35
Soil permeability is the most critical consideration for suitability of infiltration trenches. Trenches should be constructed in native soil and Table C9 provides infiltration rates for various soil textures and provides a minimum infiltration rate of 7 mm/hour to determine whether infiltration trenches are a suitable practice for a given highway location.
Table C9 Infiltration Rate for Various Soil Textural Classes
Texture Class Approximate Infiltration Rate in mm/hour
Sand 210 Loamy sand 61 Sandy loam 26 Silt loam 13 Sandy clay loam 7 Clay loam 4.5 Silty clay loam 2.5 Sandy clay 1.5 Silty clay 1.3 Clay 1.0 0.5
Another way to graphically show infiltration capability is through the use of the Soil Textural Triangle (Davis and Bennett, 1927) as shown in Figure C7. Those soils considered suitable for infiltration trenches are shown in the red circle and are generally in the loam and sand category. Soils suitable for infiltration should have clay content less than 30% and combined silt/clay content less than 40%. In addition, infiltration needs to be carefully considered on sites having fractured rock. There should be at least 3 metres of soil between the invert of the trench and the location of any fractured rock. At the same time as there is a minimum infiltration rate for infiltration trenches, there also has to be a maximum rate of infiltration to protect groundwater. Infiltration rates in excess of 1 metre/hour may indicate a direct link to a very permeable aquifer. If the rate is in excess of 1 metre/hour, runoff pre-treatment must be provided for water quality treatment to prevent migration of contaminants to groundwater.
Figure C7 Soil Textural Triangle (Davis, Bennett, 1927)

Countryside Living Toolbox – Stormwater Management Device Design Details Page- 36
4.4.2.2 Sufficient depth to groundwater or bedrock There are two issues related to depth of groundwater or bedrock. • Shallow groundwater or bedrock providing no ability to infiltrate stormwater
runoff, and • Having little depth between the ground surface and groundwater or bedrock may
allow for groundwater mounding to enter the infiltration practice and limit effective function of the trench.
Due to these concerns there should be at least 3 metres difference between the invert of the infiltration trench and the elevation of the seasonal groundwater table or bedrock. In terms of the seasonal groundwater table, that elevation must be found at the time of year when the water table is at its highest elevation.
4.4.2.3 Influent concentrations causing clogging or groundwater quality threat Due to concerns about clogging, excessive sediment loads should not be allowed to enter the trench. Because of this potential, pre-treatment upstream of the trench is vital to increasing the time period when maintenance has to be accomplished. To further minimise the clogging potential, the design employs an upper gravel or stone layer, approximately 300 mm in thickness with filter fabric placed below at 300 mm below the surface. This upper layer acts as an initial filter and can periodically be removed and replaced as conditions warrant rather than removing the entire rock volume. There are several other criteria that should be considered before infiltration trenches are used for stormwater management. • Infiltration trenches must not be constructed in fill material, • Trenches must not be constructed on slopes in excess of 15%, • Catchment areas draining to a single trench should not exceed two hectares, • Trenches should be located at least 300 metres from any municipal or private
water supply bore or 30 metres from on-site wastewater systems,
• Infiltration trenches should not be used over limestone where there is potential for a sinkhole to develop,
Figures C8 and C9 provide schematics of infiltration trenches used to receive roof runoff and to receive overland flow runoff.
Figure C8 Infiltration Trench for Roof Runoff
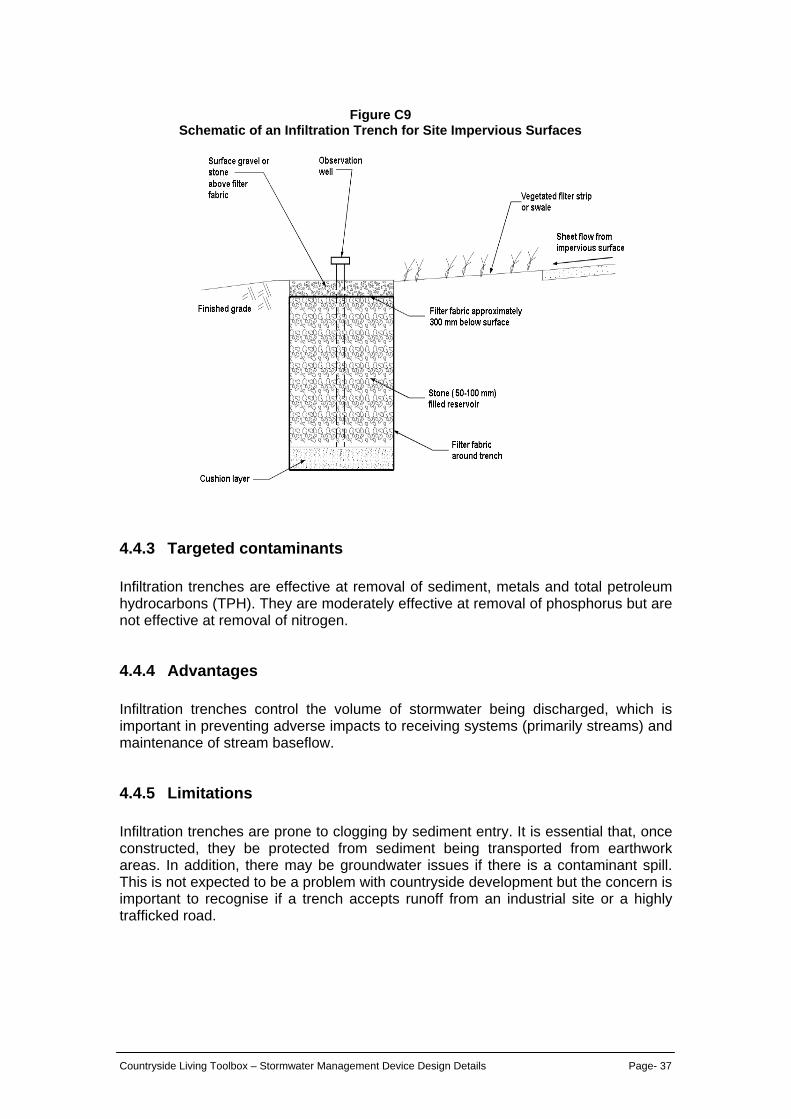
Countryside Living Toolbox – Stormwater Management Device Design Details Page- 37
4.4.3 Targeted contaminants Infiltration trenches are effective at removal of sediment, metals and total petroleum hydrocarbons (TPH). They are moderately effective at removal of phosphorus but are not effective at removal of nitrogen.
4.4.4 Advantages Infiltration trenches control the volume of stormwater being discharged, which is important in preventing adverse impacts to receiving systems (primarily streams) and maintenance of stream baseflow.
4.4.5 Limitations Infiltration trenches are prone to clogging by sediment entry. It is essential that, once constructed, they be protected from sediment being transported from earthwork areas. In addition, there may be groundwater issues if there is a contaminant spill. This is not expected to be a problem with countryside development but the concern is important to recognise if a trench accepts runoff from an industrial site or a highly trafficked road.
Figure C9 Schematic of an Infiltration Trench for Site Impervious Surfaces
Countryside Living Toolbox – Stormwater Management Device Design Details Page- 38
4.4.6 Design sizing This approach relies on Darcy’s Law (1856), which expresses flow through a porous media. There are two equations that are used: one for surface area of the trench (As) and the trench volume (Vt). In terms of the design approach: 1. Determine the water quality rainfall by using 1/3 of the 2-year storm in TP 108. 2. Determine the water quality volume from the following equation. The catchment
effective first flush runoff area = Aeff = impervious% x total Area (ha) The first flush volume Vff = 10 x Aeff x dff (m3) = WQV
Where dff = first flush water quality depth (water quality storm) 3. Size the trench surface area to allow complete infiltration within 48 hours,
including rainfall falling directly on the trench. Use the following equation to determine surface area:
As = WQV/((fd)(i)(t)-p) Where: As = surface area of the trench (m2) WQV = water quality volume (m3) fd = infiltration rate (m/hr) - rate reduced by ½ from measured i = hydraulic gradient (m/m) - assumed to be 1 t = time to drain from full condition (hours) - maximum time 48 hours p = rainfall depth for water quality storm (m) There is a simple test to see how deep an infiltration trench can be to achieve the discharge of the water quality storm. Any deeper than the amount calculated will not achieve the two-day draw down period. The equation is the following: dmax = fd(t/Vr) Where: dmax = maximum depth of trench fd = infiltration rate (m/hr) t = time to drain from full condition (hours) Vr = void ratio of reservoir stone (normally 0.35 for stone or 0.5 if scoria is
used) Once dmax has been defined, the actual needed depth can be calculated. If the actual depth exceeds the maximum depth the surface area must be increased to account
4. Find the trench volume to provide storage for 37% of the volume required to infiltrate. This allows for storage of excess runoff during those periods when the runoff exceed the infiltration rate.
Vt = 0.37(WQV + pAs/Vr) Where: Vt = trench volume with the aggregate added
Countryside Living Toolbox – Stormwater Management Device Design Details Page- 39
5. Calculate the trench depth and compare with the maximum depth
Vt/As = depth of trench (d) If d < dmax the design is adequate. If d > dmax then trench surface area must be increased and depth decreased.
6. If extended detention is a requirement, take the water quality volume and multiply by 1.3 and use this in the equation for calculating the trench surface area.
7. If peak flow control of the 2- and 10-year storms is required, the trench can
provide capacity to limit peak discharge increases if the catchment area contributing to the trench is kept as small as possible. If extraneous flows cannot bypass the trench, the difference in volume of the 10-year storm must be calculated and the trench volume increased if the 10-year storm volume exceeds that provided by 1.3 times the water quality volume.
Note The Franklin District Council has a design manual for soakage retention pits (infiltration trenches) that provides an easy approach to calculating water quality volumes for trenches. Using their approach will provide comparable volumes as would be used for sizing the trench for water quality treatment. Using the Franklin District Council approach can be used to calculate the water quality volume in steps 1 and 2 of this design sizing but the volume calculated flow will need to be increased to provide for extended detention or peak flow control.
4.4.7 Case study
4.4.7.1 Project description A house is being constructed for in the vicinity of Pukekohe. The house roof area will be 200 m2 and an infiltration trench will be sized to handle the runoff. While water quality is not an issue from a residential roof constructed of a benign material, the trench will provide extended detention control and peak flow control. The measured infiltration rate for the trench location is 14 mm/hour.
4.4.7.2 Hydrology 1. Calculate the water quality volume
The 2-year storm for Pukekohe is 70 mm of rainfall so the water quality storm is 23 mm of rainfall.
2. Using that rainfall, the water quality volume is calculated. The catchment effective first flush runoff area = Aeff = impervious% x total Area (ha) The first flush volume Vff = 10 x Aeff x dff (m3)
Where dff = first flush water quality depth (water quality storm) Aeff = (1) x .02 = 0.02

Countryside Living Toolbox – Stormwater Management Device Design Details Page- 40
Vff = 10x(0,02)(23) = 4.6 m3
WQV = 4.6 m3
4.4.7.3 Infiltration trench design
3. Calculate the practice surface area
As = WQV/((fd)(i)(t)-p) Where: As = surface area of the trench (m2) WQV = water quality volume (m3) = 4.6 m3
fd = infiltration rate (m/hr) - rate reduced by ½ from measured =14 mm/hour reduced by ½ as a factor of safety, so fd = 7 mm/hour = 0.007 m/hour
i = hydraulic gradient (m/m) - assumed to be 1 t = time to drain from full condition (hours) - maximum time 48 hours p = rainfall depth for water quality storm (m) = .023 m As = 4.6/(.007)(1)(48) - .023 = 14.7 m2 Calculate the maximum trench depth dmax = fd(t/Vr) Where: dmax = maximum depth of trench fd = infiltration rate (m/hr) = 0.007 m/hour t = time to drain from full condition (hours) = 48 hours Vr = void ratio of reservoir stone (scoria) = 0.5 dmax = .007(48/.5) = 0.67 m
4. Find the trench volume
Vt = 0.37(WQV + pAs)/Vr = 0.37(4.6 + 0.023(14.7)/.5 = 3.65 m3 5. Calculate the trench depth and compare with the maximum depth
d = Vt/As = depth of trench (d) = 3.6/14.7 = 0.25 m d < dmax so the design is adequate
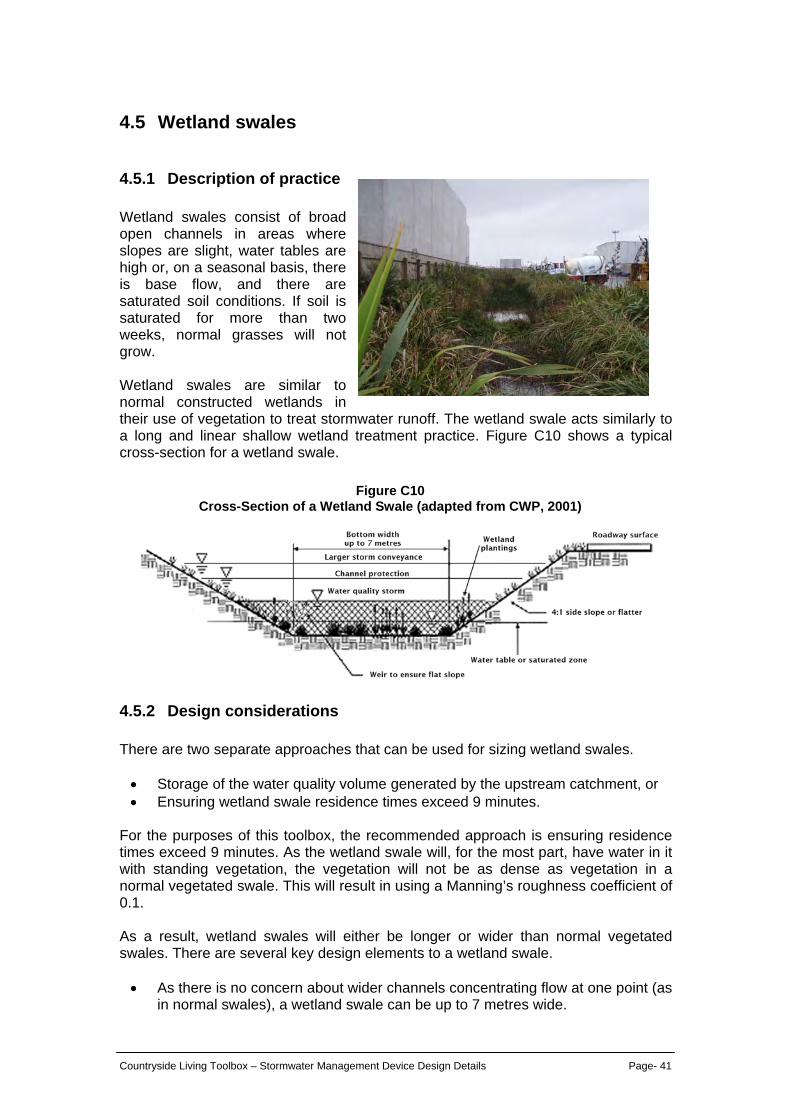
Countryside Living Toolbox – Stormwater Management Device Design Details Page- 41
4.5 Wetland swales
4.5.1 Description of practice Wetland swales consist of broad open channels in areas where slopes are slight, water tables are high or, on a seasonal basis, there is base flow, and there are saturated soil conditions. If soil is saturated for more than two weeks, normal grasses will not grow. Wetland swales are similar to normal constructed wetlands in their use of vegetation to treat stormwater runoff. The wetland swale acts similarly to a long and linear shallow wetland treatment practice. Figure C10 shows a typical cross-section for a wetland swale.
4.5.2 Design considerations There are two separate approaches that can be used for sizing wetland swales. • Storage of the water quality volume generated by the upstream catchment, or • Ensuring wetland swale residence times exceed 9 minutes.
For the purposes of this toolbox, the recommended approach is ensuring residence times exceed 9 minutes. As the wetland swale will, for the most part, have water in it with standing vegetation, the vegetation will not be as dense as vegetation in a normal vegetated swale. This will result in using a Manning’s roughness coefficient of 0.1. As a result, wetland swales will either be longer or wider than normal vegetated swales. There are several key design elements to a wetland swale. • As there is no concern about wider channels concentrating flow at one point (as
in normal swales), a wetland swale can be up to 7 metres wide.
Figure C10 Cross-Section of a Wetland Swale (adapted from CWP, 2001)
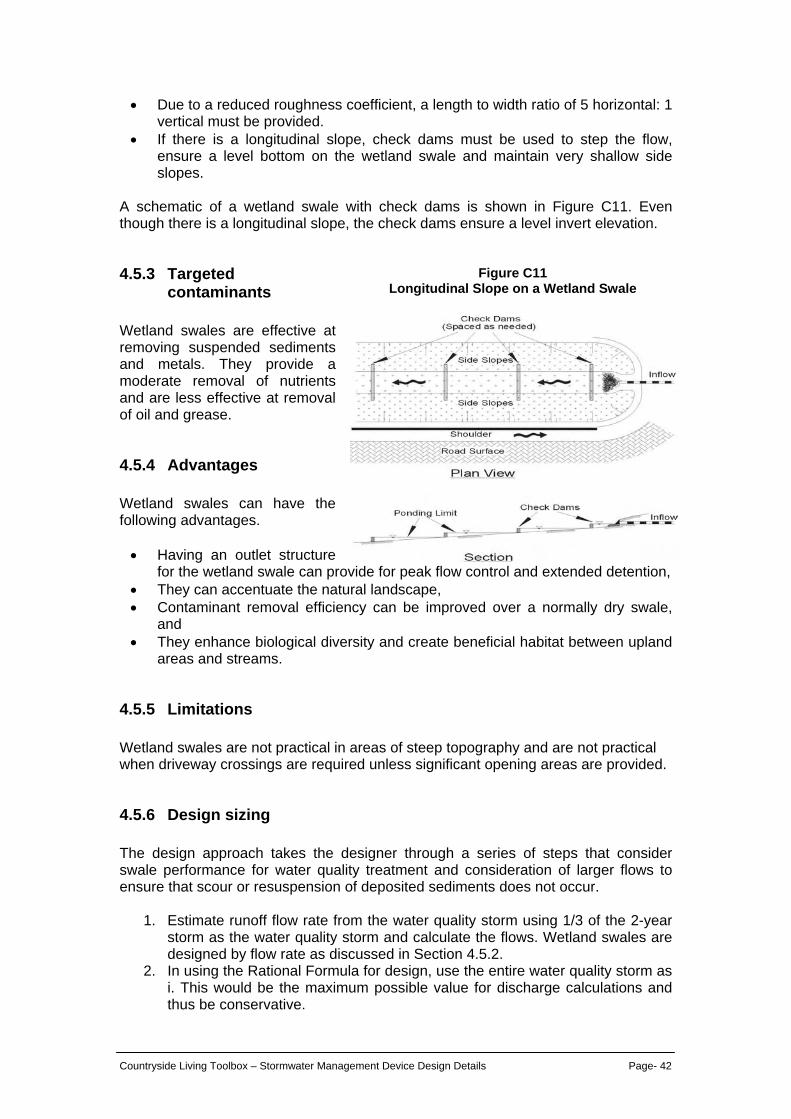
Countryside Living Toolbox – Stormwater Management Device Design Details Page- 42
• Due to a reduced roughness coefficient, a length to width ratio of 5 horizontal: 1 vertical must be provided.
• If there is a longitudinal slope, check dams must be used to step the flow, ensure a level bottom on the wetland swale and maintain very shallow side slopes.
A schematic of a wetland swale with check dams is shown in Figure C11. Even though there is a longitudinal slope, the check dams ensure a level invert elevation.
4.5.3 Targeted contaminants
Wetland swales are effective at removing suspended sediments and metals. They provide a moderate removal of nutrients and are less effective at removal of oil and grease.
4.5.4 Advantages Wetland swales can have the following advantages. • Having an outlet structure
for the wetland swale can provide for peak flow control and extended detention, • They can accentuate the natural landscape, • Contaminant removal efficiency can be improved over a normally dry swale,
and • They enhance biological diversity and create beneficial habitat between upland
areas and streams.
4.5.5 Limitations Wetland swales are not practical in areas of steep topography and are not practical when driveway crossings are required unless significant opening areas are provided.
4.5.6 Design sizing The design approach takes the designer through a series of steps that consider swale performance for water quality treatment and consideration of larger flows to ensure that scour or resuspension of deposited sediments does not occur.
1. Estimate runoff flow rate from the water quality storm using 1/3 of the 2-year storm as the water quality storm and calculate the flows. Wetland swales are designed by flow rate as discussed in Section 4.5.2.
2. In using the Rational Formula for design, use the entire water quality storm as i. This would be the maximum possible value for discharge calculations and thus be conservative.
Figure C11 Longitudinal Slope on a Wetland Swale
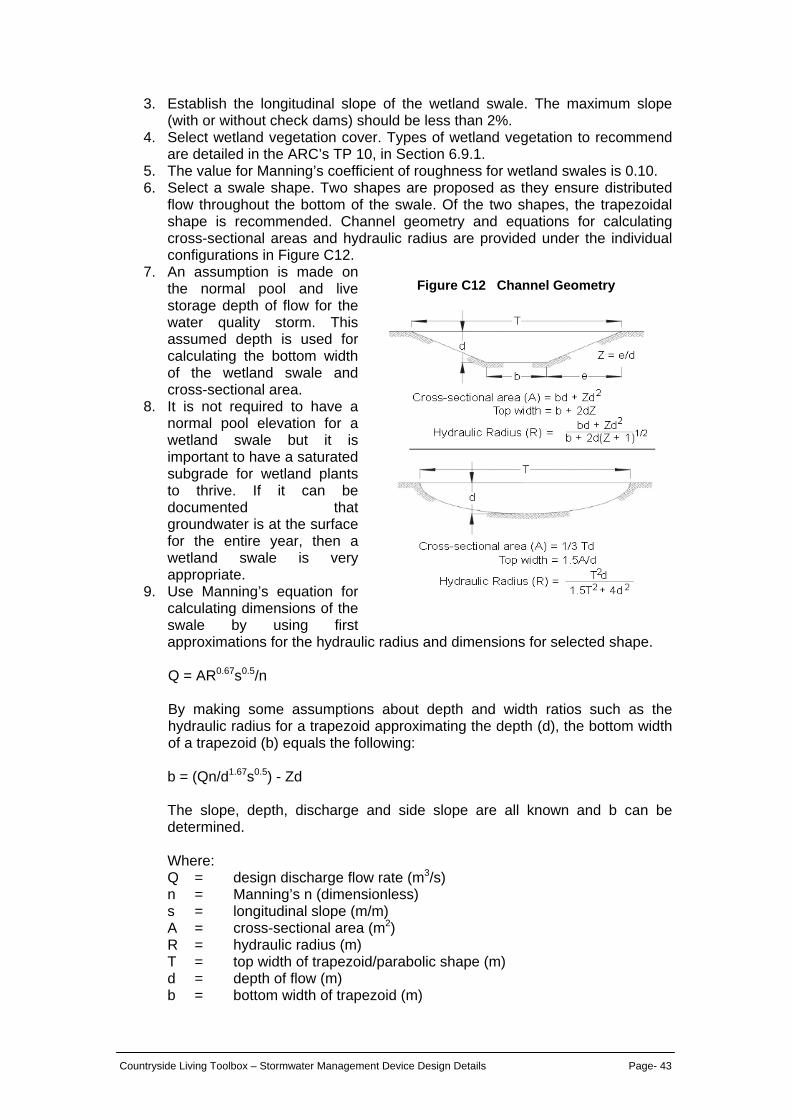
Countryside Living Toolbox – Stormwater Management Device Design Details Page- 43
3. Establish the longitudinal slope of the wetland swale. The maximum slope (with or without check dams) should be less than 2%.
4. Select wetland vegetation cover. Types of wetland vegetation to recommend are detailed in the ARC’s TP 10, in Section 6.9.1.
5. The value for Manning’s coefficient of roughness for wetland swales is 0.10. 6. Select a swale shape. Two shapes are proposed as they ensure distributed
flow throughout the bottom of the swale. Of the two shapes, the trapezoidal shape is recommended. Channel geometry and equations for calculating cross-sectional areas and hydraulic radius are provided under the individual configurations in Figure C12.
7. An assumption is made on the normal pool and live storage depth of flow for the water quality storm. This assumed depth is used for calculating the bottom width of the wetland swale and cross-sectional area.
8. It is not required to have a normal pool elevation for a wetland swale but it is important to have a saturated subgrade for wetland plants to thrive. If it can be documented that groundwater is at the surface for the entire year, then a wetland swale is very appropriate.
9. Use Manning’s equation for calculating dimensions of the swale by using first approximations for the hydraulic radius and dimensions for selected shape.
Q = AR0.67s0.5/n By making some assumptions about depth and width ratios such as the hydraulic radius for a trapezoid approximating the depth (d), the bottom width of a trapezoid (b) equals the following: b = (Qn/d1.67s0.5) - Zd The slope, depth, discharge and side slope are all known and b can be determined. Where: Q = design discharge flow rate (m3/s) n = Manning’s n (dimensionless) s = longitudinal slope (m/m) A = cross-sectional area (m2) R = hydraulic radius (m) T = top width of trapezoid/parabolic shape (m) d = depth of flow (m) b = bottom width of trapezoid (m)
Figure C12 Channel Geometry
Countryside Living Toolbox – Stormwater Management Device Design Details Page- 44
For a parabola, the depth and discharge are known so the top width can be solved for.
8. Knowing b (trapezoid) or T (parabola), the cross-sectional area can be
determined by the equations in Figure C2. 9. Calculate the swale velocity from the following equation: V = Q/A If V > 0.8 m/s repeat steps 1 - 9 until the velocity is less than 0.8 m/s. 10. Calculate the swale length (L in metres) L = Vt (60 s/minute) Where t = residence time in minutes.
4.5.6.1 Flows in excess of the water quality storm It is expected that runoff from events larger than the water quality design storm will go through the wetland swale. In that situation, a stability check should be performed to ensure that the 10-year, 24-hour storm does not cause erosion. For the 10-year storm, flow velocities should not exceed 1.5 m/s, although higher velocities may be designed for with appropriate erosion protection. When considering larger storms consideration must be given to increased rainfall values as a result of climate change. Table C5 provides information on the percentage increase for design purposes. If extended detention and/or peak flow control is a requirement for a specific project, the outlet of the wetland swale can be modified so that storage volumes are provided. In that situation, outlet design is based on a typical detention pond design and guidance on detention pond design is given in the ARC’s TP 10.
4.5.7 Case study
4.5.7.1 Project description An access road, driveways and pasture for a 3 lot rural subdivision is proposed to drain to a wetland swale. The lane is 6.4 metres wide and 400 metres long, the three driveways are each 3.4 metres wide and 75 metres long and the pasture area is approximately 10,000 m2. The project is located in the upper Flatbush catchment.
4.5.7.2 Hydrology Using the Rational Formula Qwq = 0.00278CIA Predevelopment land use is pasture on a C soil so predevelopment C factor is 0.3. C = 0.3 + .65(%Impervious cover/100) = 0.3 + .65(25%/100) = 0.46
Countryside Living Toolbox – Stormwater Management Device Design Details Page- 45
I = Rainfall intensity (mm/hr.) - for Flatbush the water quality storm is 23 mm. A = catchment area in hectares = 1.33 ha. Qwq = 0.00278(0.46)(23)(1.33) = 0.039 m3/s For the one hour Q10 in Flatbush, rainfall is 33.6mm. Effect of global warming on the 10-year storm is 7.4% increase in rainfall. So 33.6 mm for a 10-year storm increased by 7.4% results in 36.1 mm of rainfall. Q10 = 0.00278(.46)(36.1)(1.33) = 0.06 m3/s
4.5.7.3 Swale Design Slope of swale alignment = 0.02 Several assumptions have to be made regarding the swale, first of which is that the wetland swale will have a trapezoidal design. Side slopes (Z) will then be recommended and an assumption of design storm depth should be made. That value may change depending on the velocity of flow being less than 0.8 m/s. For this case study, Z = 4 and the depth of flow = 100 mm. The static water level (or dead storage) in the wetland swale is estimated to be 100 mm deep as check dams have been designed to maintain a level bottom, but that storage cannot be considered in terms of flow velocities. Since storm flow will overtop the check dams, the slope to use in calculations is the longitudinal slope and not permanent water elevation slope. Based on the value for Q and s, and the assumptions for n and d, solve for the swale bottom width (b). b = (Qn/d1.67s0.5) - Zd b = ((.039)(.1)/(.11.67)(.020.5)) - (4)(.1) = 0.94 m Calculate the top width T = b + 2dZ = 0.94 + 2(.1)(4) = 1.74 m Calculate the cross-sectional area A = bd + Zd2 = (0.94)(.1) + 4(.12) = 0.1 m2 Calculate the flow velocity V = Q/A = 0.039/0.1 = 0.39 m/s which is well under than the 0.8 m/s maximum - good. Calculate the wetland swale length L = Vt = 0.39(540 sec.) = 210 metres long The wetland swale length can be reduced significantly if it were made wider. A wetland swale can have a bottom width up to 7 metres as standing water will not

Countryside Living Toolbox – Stormwater Management Device Design Details Page- 46
cause flow to concentrate in one area. As an example, if the swale bottom width were increased to 3 metres, the following calculations will provide an adjusted length.
b = 3 metres T = 3 + 2(.1)(4) = 3.8 m A = 0.34 m2 V = Q/A = 0.039/0.34 = 0.11 m/s L = 0.11(540) = 59.4 m (150 m less length than the previously calculated
length) As the swale will probably have larger flows pass through it, the swale design can be adjusted to account for the larger flows. In this situation the Manning coefficient of roughness will not have to be decreased as wetlands vegetation is expected to be considerably higher than the static water level, so assume n = .1. Solve for d and ensure that velocities are not erosive. Q10 = 0.06 m3/s.
b = (Qn/d1.67s0.5) - Zd 0.94 = (0.06(.1)/ d1.67s0.5) - 4d by trial and error, the wetland swale must have a depth of 120 mm to convey the 10-year storm A = bd + Zd2 = (0.94)(.12) + 4(.122) = 0.17 m2
Q = AV or Q/A = V = 0.06 m3/s/0.17 = 0.35 m/s so the velocities during the 10-year storm are non-erosive.
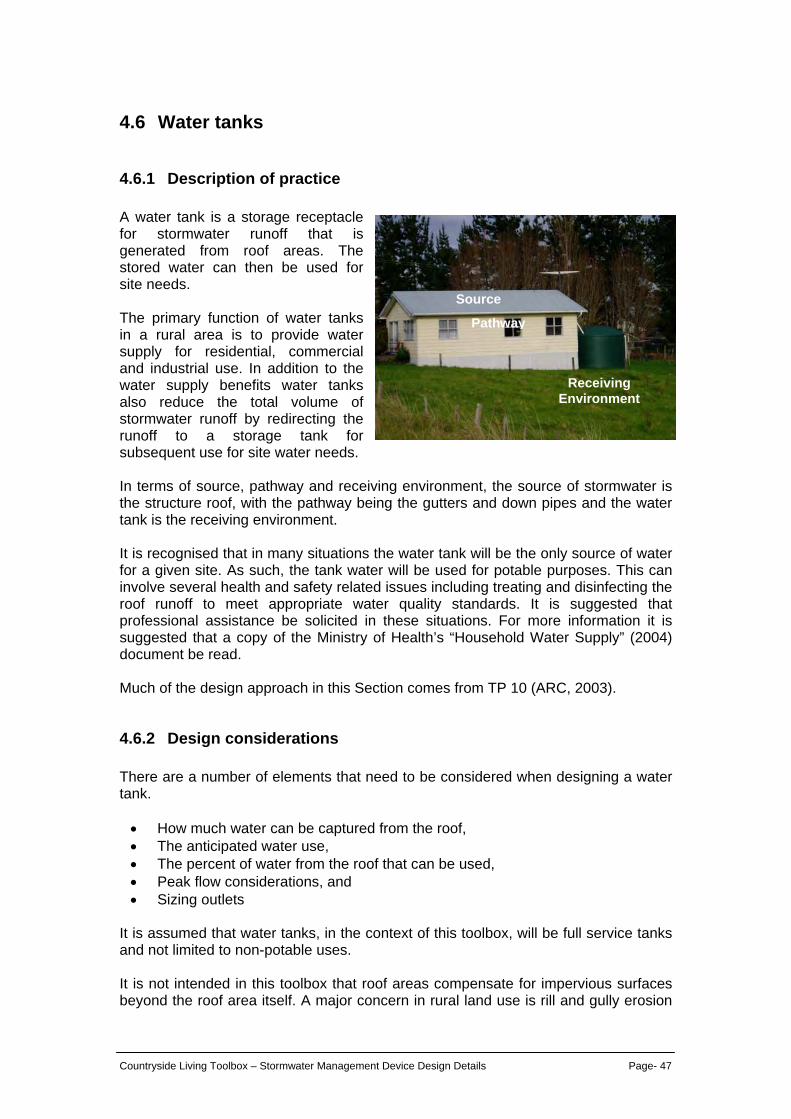
Countryside Living Toolbox – Stormwater Management Device Design Details Page- 47
4.6 Water tanks
4.6.1 Description of practice A water tank is a storage receptacle for stormwater runoff that is generated from roof areas. The stored water can then be used for site needs. The primary function of water tanks in a rural area is to provide water supply for residential, commercial and industrial use. In addition to the water supply benefits water tanks also reduce the total volume of stormwater runoff by redirecting the runoff to a storage tank for subsequent use for site water needs. In terms of source, pathway and receiving environment, the source of stormwater is the structure roof, with the pathway being the gutters and down pipes and the water tank is the receiving environment. It is recognised that in many situations the water tank will be the only source of water for a given site. As such, the tank water will be used for potable purposes. This can involve several health and safety related issues including treating and disinfecting the roof runoff to meet appropriate water quality standards. It is suggested that professional assistance be solicited in these situations. For more information it is suggested that a copy of the Ministry of Health’s “Household Water Supply” (2004) document be read. Much of the design approach in this Section comes from TP 10 (ARC, 2003).
4.6.2 Design considerations There are a number of elements that need to be considered when designing a water tank. • How much water can be captured from the roof, • The anticipated water use, • The percent of water from the roof that can be used, • Peak flow considerations, and • Sizing outlets
It is assumed that water tanks, in the context of this toolbox, will be full service tanks and not limited to non-potable uses. It is not intended in this toolbox that roof areas compensate for impervious surfaces beyond the roof area itself. A major concern in rural land use is rill and gully erosion
Source
Pathway
Receiving Environment
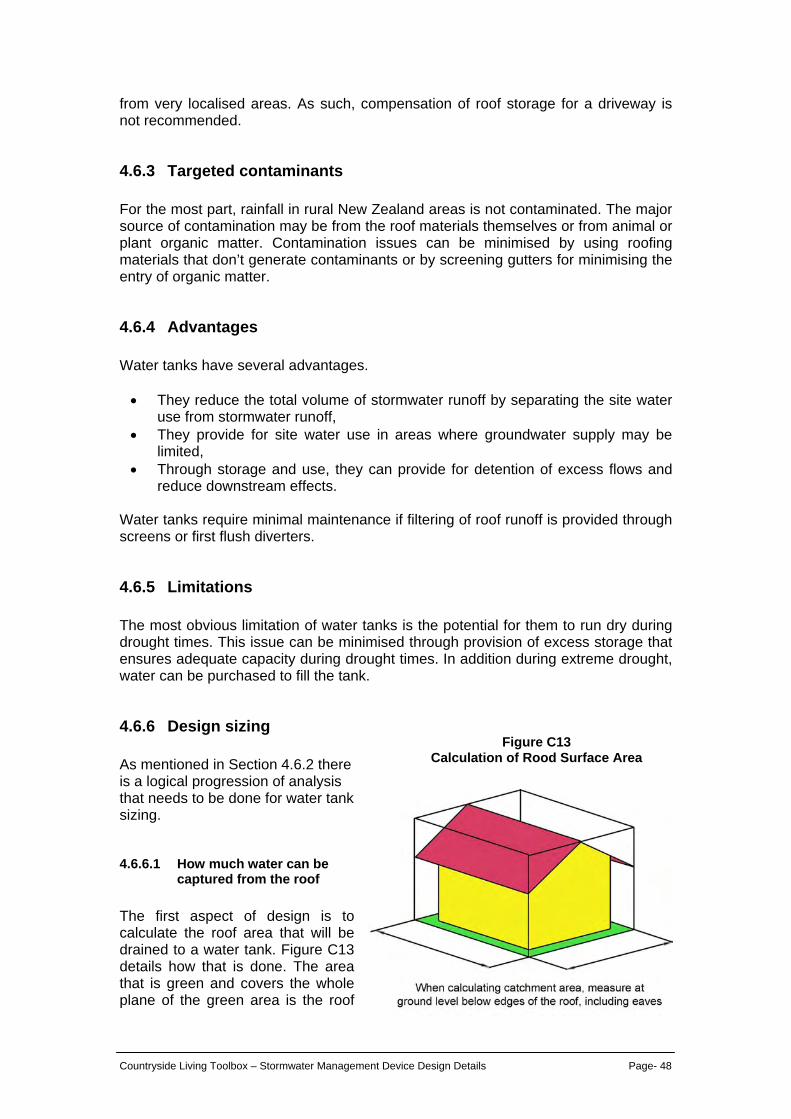
Countryside Living Toolbox – Stormwater Management Device Design Details Page- 48
from very localised areas. As such, compensation of roof storage for a driveway is not recommended.
4.6.3 Targeted contaminants For the most part, rainfall in rural New Zealand areas is not contaminated. The major source of contamination may be from the roof materials themselves or from animal or plant organic matter. Contamination issues can be minimised by using roofing materials that don’t generate contaminants or by screening gutters for minimising the entry of organic matter.
4.6.4 Advantages Water tanks have several advantages. • They reduce the total volume of stormwater runoff by separating the site water
use from stormwater runoff, • They provide for site water use in areas where groundwater supply may be
limited, • Through storage and use, they can provide for detention of excess flows and
reduce downstream effects. Water tanks require minimal maintenance if filtering of roof runoff is provided through screens or first flush diverters.
4.6.5 Limitations The most obvious limitation of water tanks is the potential for them to run dry during drought times. This issue can be minimised through provision of excess storage that ensures adequate capacity during drought times. In addition during extreme drought, water can be purchased to fill the tank.
4.6.6 Design sizing As mentioned in Section 4.6.2 there is a logical progression of analysis that needs to be done for water tank sizing.
4.6.6.1 How much water can be captured from the roof
The first aspect of design is to calculate the roof area that will be drained to a water tank. Figure C13 details how that is done. The area that is green and covers the whole plane of the green area is the roof
Figure C13 Calculation of Rood Surface Area

Countryside Living Toolbox – Stormwater Management Device Design Details Page- 49
area that is then used in calculations. Another component of roof runoff capture is what percentage of stormwater that runs off the roof can be used depending on roof area, tank size and daily usage. Table C10 provides this information. There are two key assumptions with considering Table C10. • Tank water is the
only water supply for rural development, and
• Water tank sizes are at least 25,000 litres. It is recommended that rural residential land use have two 25,000 litre tanks or a total water supply of 50,000 litres to ensure an adequate supply and, for commercial or industrial land use, to provide detention for times when the tank is full.
Several points can be observed. Daily water use for a residential home on tank water for all water needs will be at least 500 litres/day for three people so 100% of the runoff from the roof can be used if the roof area is 150 m2. As the roof area gets larger, the runoff from the roof is too great for the water tank to completely handle so there is runoff. A 200 m2 roof with the same water consumption will have approximately 20% of the roof runoff released. A review of Table C10 provides information on various roof sizes and rainfall runoff expectations.
Table C10 Percent of Stormwater Captured
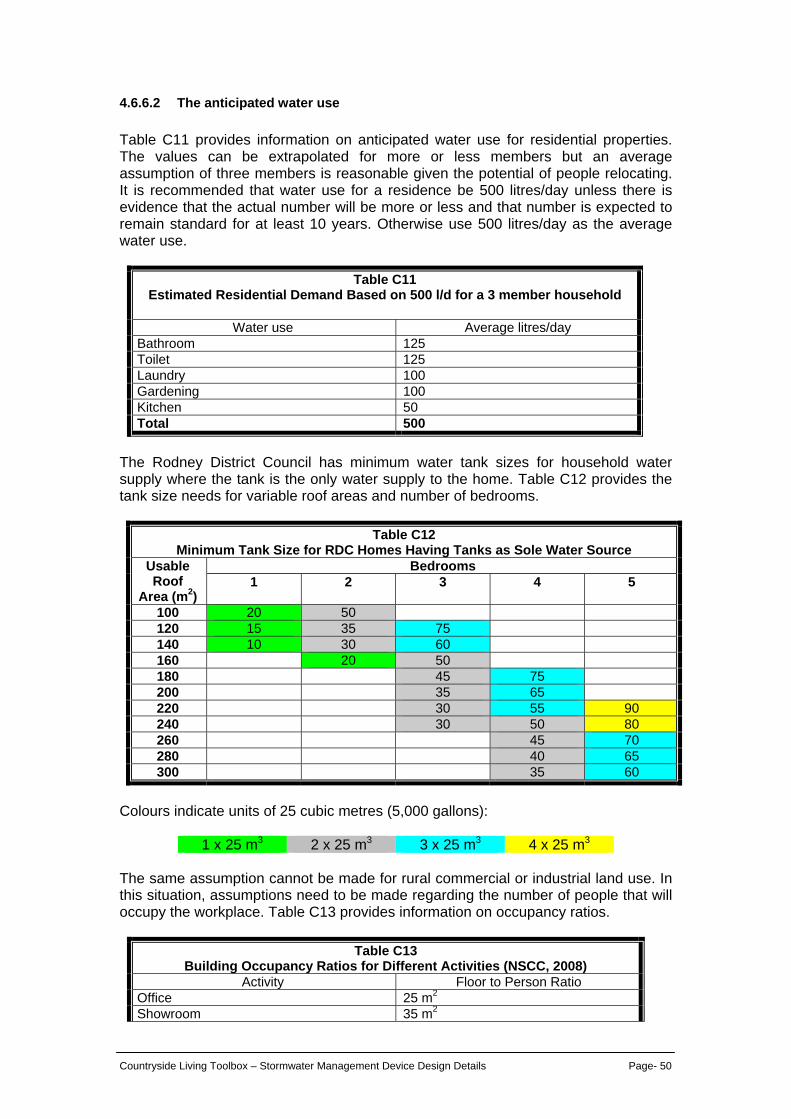
Countryside Living Toolbox – Stormwater Management Device Design Details Page- 50
4.6.6.2 The anticipated water use Table C11 provides information on anticipated water use for residential properties. The values can be extrapolated for more or less members but an average assumption of three members is reasonable given the potential of people relocating. It is recommended that water use for a residence be 500 litres/day unless there is evidence that the actual number will be more or less and that number is expected to remain standard for at least 10 years. Otherwise use 500 litres/day as the average water use.
Table C11 Estimated Residential Demand Based on 500 l/d for a 3 member household
Water use Average litres/day
Bathroom 125 Toilet 125 Laundry 100 Gardening 100 Kitchen 50 Total 500
The Rodney District Council has minimum water tank sizes for household water supply where the tank is the only water supply to the home. Table C12 provides the tank size needs for variable roof areas and number of bedrooms.
Table C12 Minimum Tank Size for RDC Homes Having Tanks as Sole Water Source
Usable Roof
Area (m2)
Bedrooms 1 2 3 4 5
100 20 50 120 15 35 75 140 10 30 60 160 20 50 180 45 75 200 35 65 220 30 55 90 240 30 50 80 260 45 70 280 40 65 300 35 60
Colours indicate units of 25 cubic metres (5,000 gallons):
1 x 25 m3 2 x 25 m3 3 x 25 m3 4 x 25 m3 The same assumption cannot be made for rural commercial or industrial land use. In this situation, assumptions need to be made regarding the number of people that will occupy the workplace. Table C13 provides information on occupancy ratios.
Table C13 Building Occupancy Ratios for Different Activities (NSCC, 2008)
Activity Floor to Person Ratio Office 25 m2
Showroom 35 m2

Countryside Living Toolbox – Stormwater Management Device Design Details Page- 51
Warehouse 50 m2 Shops, retail 35 m2 Restaurant/dining areas 15 m2 Local shopping centres 35 m2 Manufacturing 25 m2
The number of individuals occupying the building will be the gross floor area divided by the floor to person ratio. The amount of water used per day is the number of individuals times 25 litres/day. At a minimum the value should total 125 litres/day. Industrial sites will have to be considered on an individual basis as the industrial usage may require water use in its operation. The total expected amount of use will then be based on employee and operations usage.
4.6.6.3 The percent of water from the roof that can be used
Knowing the roof area and the anticipated need, the next step is to determine whether the water supplied can meet daily needs. Table C14 provides information on water demand, roof area and the percentage of time that roof runoff can meet daily demand. In a similar fashion to the percentage of runoff that can be captured, Table C14 shows how important tank size and roof area are to determining whether daily water demand can be met. What can be seen is that a daily water need of 500 l/d cannot be supplied 100% of the time even with a 25,000 litre tank and a 500 m2 roof area. This is one reason why the toolbox recommends 50,000 litres of tank storage for rural residential properties.
Table C14 Percentage of Demand that can be Met Relating Tank Size, Roof Area and Daily
Water Needs.
Countryside Living Toolbox – Stormwater Management Device Design Details Page- 52
4.6.6.4 Peak flow consideration When sizing a water tank, there are two possible storage components. • The water needs component, and • For commercial and industrial land use, an attenuation volume that reduces
peak rate of discharge. The attenuation volume occupies the upper storage area of the tank with its outlet orifice placed immediately above the water needs volume. It is possible that the combined storage would provide more benefit than is estimated. A higher level of attenuation may be achieved in some instances when the tank water level is lower than the orifice level at the start of the storm. These benefits are very difficult to estimate and are not taken into account in design. There will be a portion of the year when roof runoff will exceed water use and runoff during that time needs to be considered in terms of attenuation. The volume can be determined by use of Table C13 in conjunction with knowledge of the roof area and intended water use. The amount of water that needs to be addressed through this approach is determined through the following equation.
% of rainfall becoming runoff = 1 – (0.75 x fraction of rainfall used) 0.75 is the percentage of the time that the water tank is full due to excess rainfall.
As an example, 500 l/d for a roof of 225 m2 and a 25,000 litre tank would equate to the following: % of rainfall becoming runoff = 1 – (0.75 x 0.95) = 29% of the rainfall becoming runoff.
TP 108 analysis of a one hectare pasture for a 2-year storm indicates that approximately 45% of the rainfall becomes runoff while 58% becomes runoff during a 10-year storm. This would indicate that peak control of stormwater flow rates is not needed in the situation where a residence uses 500 l/d until the % of rainfall that becomes runoff is greater than 45%. Commercial and industrial sites will have more concern over the percentage of rainfall that becomes runoff than residential development. As detailed above, the percentage of time that rainfall becomes runoff needs to be calculated using daily water use, roof area and tank size. Roof areas above 500 m2 need to be considered individually and a water budget established.
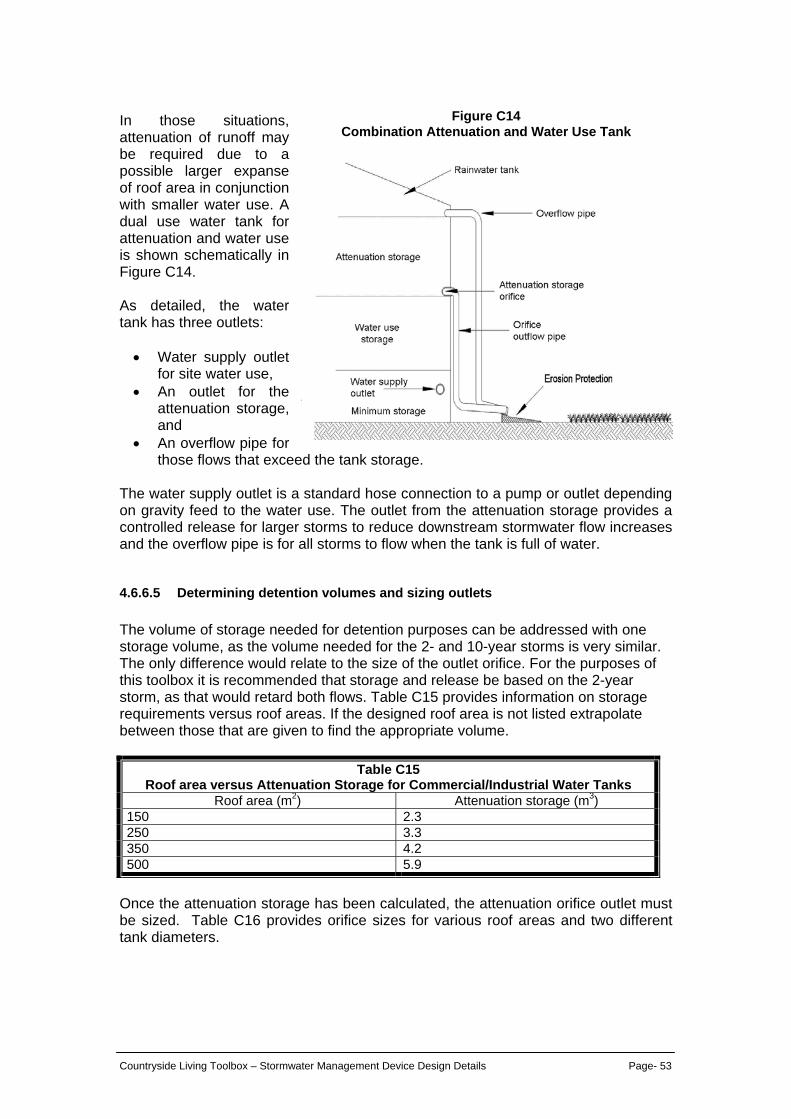
Countryside Living Toolbox – Stormwater Management Device Design Details Page- 53
In those situations, attenuation of runoff may be required due to a possible larger expanse of roof area in conjunction with smaller water use. A dual use water tank for attenuation and water use is shown schematically in Figure C14. As detailed, the water tank has three outlets: • Water supply outlet
for site water use, • An outlet for the
attenuation storage, and
• An overflow pipe for those flows that exceed the tank storage.
The water supply outlet is a standard hose connection to a pump or outlet depending on gravity feed to the water use. The outlet from the attenuation storage provides a controlled release for larger storms to reduce downstream stormwater flow increases and the overflow pipe is for all storms to flow when the tank is full of water.
4.6.6.5 Determining detention volumes and sizing outlets The volume of storage needed for detention purposes can be addressed with one storage volume, as the volume needed for the 2- and 10-year storms is very similar. The only difference would relate to the size of the outlet orifice. For the purposes of this toolbox it is recommended that storage and release be based on the 2-year storm, as that would retard both flows. Table C15 provides information on storage requirements versus roof areas. If the designed roof area is not listed extrapolate between those that are given to find the appropriate volume.
Table C15 Roof area versus Attenuation Storage for Commercial/Industrial Water Tanks
Roof area (m2) Attenuation storage (m3) 150 2.3 250 3.3 350 4.2 500 5.9
Once the attenuation storage has been calculated, the attenuation orifice outlet must be sized. Table C16 provides orifice sizes for various roof areas and two different tank diameters.
Figure C14 Combination Attenuation and Water Use Tank
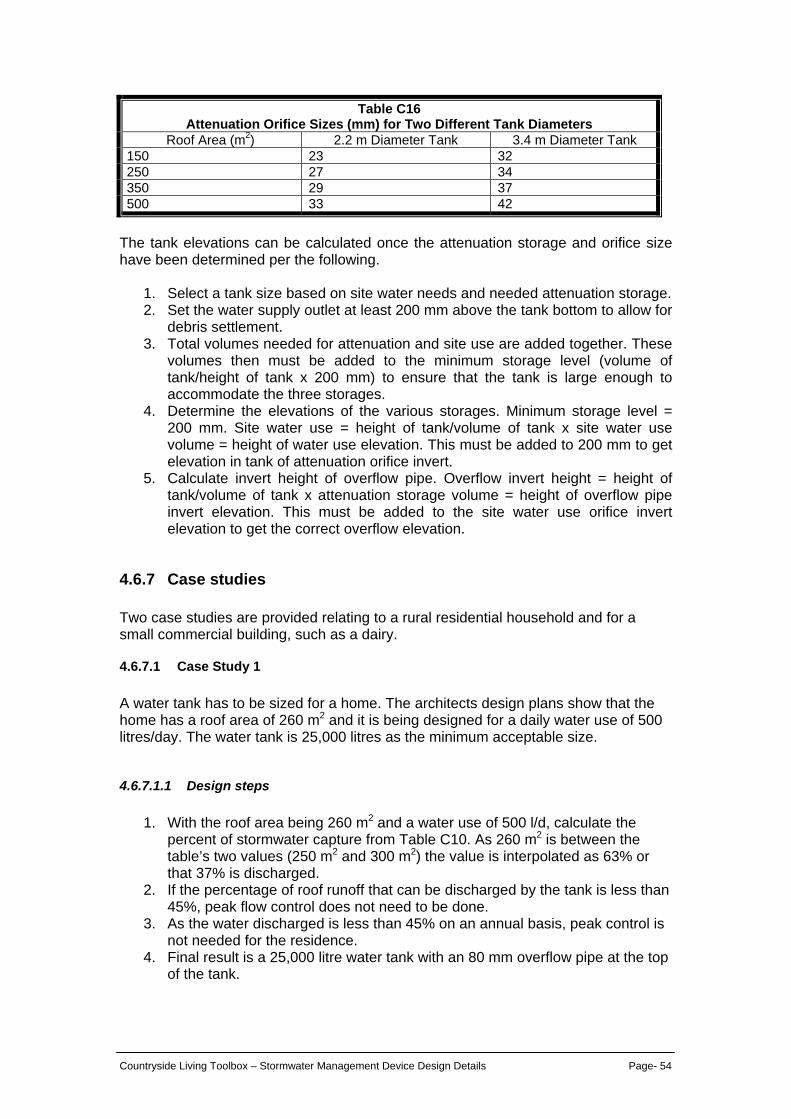
Countryside Living Toolbox – Stormwater Management Device Design Details Page- 54
Table C16 Attenuation Orifice Sizes (mm) for Two Different Tank Diameters
Roof Area (m2) 2.2 m Diameter Tank 3.4 m Diameter Tank 150 23 32 250 27 34 350 29 37 500 33 42
The tank elevations can be calculated once the attenuation storage and orifice size have been determined per the following.
1. Select a tank size based on site water needs and needed attenuation storage. 2. Set the water supply outlet at least 200 mm above the tank bottom to allow for
debris settlement. 3. Total volumes needed for attenuation and site use are added together. These
volumes then must be added to the minimum storage level (volume of tank/height of tank x 200 mm) to ensure that the tank is large enough to accommodate the three storages.
4. Determine the elevations of the various storages. Minimum storage level = 200 mm. Site water use = height of tank/volume of tank x site water use volume = height of water use elevation. This must be added to 200 mm to get elevation in tank of attenuation orifice invert.
5. Calculate invert height of overflow pipe. Overflow invert height = height of tank/volume of tank x attenuation storage volume = height of overflow pipe invert elevation. This must be added to the site water use orifice invert elevation to get the correct overflow elevation.
4.6.7 Case studies Two case studies are provided relating to a rural residential household and for a small commercial building, such as a dairy.
4.6.7.1 Case Study 1 A water tank has to be sized for a home. The architects design plans show that the home has a roof area of 260 m2 and it is being designed for a daily water use of 500 litres/day. The water tank is 25,000 litres as the minimum acceptable size.
4.6.7.1.1 Design steps
1. With the roof area being 260 m2 and a water use of 500 l/d, calculate the percent of stormwater capture from Table C10. As 260 m2 is between the table’s two values (250 m2 and 300 m2) the value is interpolated as 63% or that 37% is discharged.
2. If the percentage of roof runoff that can be discharged by the tank is less than 45%, peak flow control does not need to be done.
3. As the water discharged is less than 45% on an annual basis, peak control is not needed for the residence.
4. Final result is a 25,000 litre water tank with an 80 mm overflow pipe at the top of the tank.

Countryside Living Toolbox – Stormwater Management Device Design Details Page- 55
4.6.7.2 Case study 2 A dairy is constructed in a rural area. The cross sectional area of the roof is 200 m2 and the gross floor area is 165 m2.
4.6.7.2.1 Design steps
1. Based on the gross floor area calculate the number of individuals who will be working in the dairy. Use a local shopping centre figure of 35 m2/person to calculate the number of individuals. The result is 4.7 individuals so say 5 people working at any one time.
2. Calculate the water used by 5 individuals at 25 l/individual or 125 l/d of water being used.
3. Select a storage amount that will supply needs. At 125 l/d 3000 litres would last 24 days if there is no additional rain during that period. The selection of volume should be based on a reasonable assumption of storage needs during the summer months when several weeks can go by without rainfall.
4. From Table C14, the amount of detention storage needed is 2.8 m3 or 2,800 litres.
5. From Table C15 the peak flow control orifice is 33 mm. 6. Calculate the minimum storage volume needed. If the tank is a 10,000 litre
tank its dimensions will be 2.2 m diameter and 3.2 metres tall. To check the minimum storage volume amounts, divide the volume of the tank by its height and multiply by 200 mm. 10,000/3200 x 200 = 625 litres.
7. The tank volume needs to be 3000 litres + 2,800 litres + 625 litres = 6,425 litres so the 10,000 litre tank has more than enough capacity.
8. Determine the elevations of the various storages. Minimum storage level = 200 mm. Site water use = 3200/10,000 = 0.32 mm/l x 3000 l = height of water use elevation or 960 mm. This must be added to 200 mm to get elevation in tank of attenuation orifice invert = 1,160 mm from the bottom of the tank.
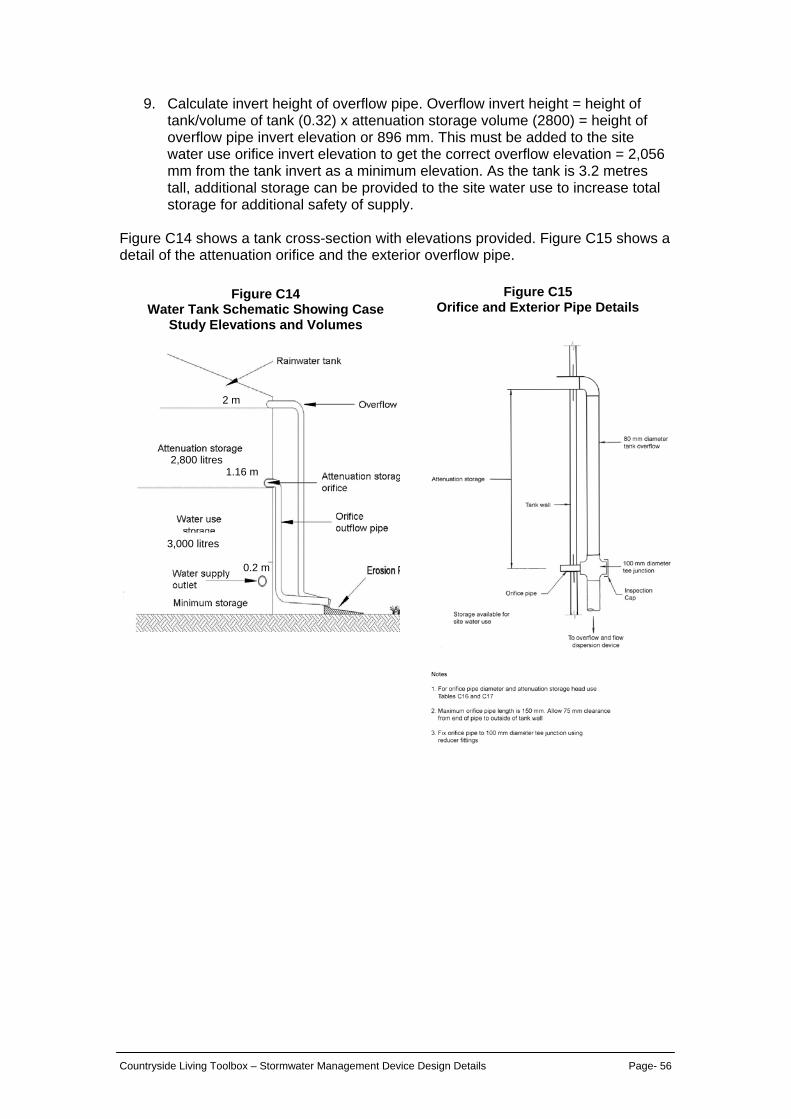
Countryside Living Toolbox – Stormwater Management Device Design Details Page- 56
9. Calculate invert height of overflow pipe. Overflow invert height = height of tank/volume of tank (0.32) x attenuation storage volume (2800) = height of overflow pipe invert elevation or 896 mm. This must be added to the site water use orifice invert elevation to get the correct overflow elevation = 2,056 mm from the tank invert as a minimum elevation. As the tank is 3.2 metres tall, additional storage can be provided to the site water use to increase total storage for additional safety of supply.
Figure C14 shows a tank cross-section with elevations provided. Figure C15 shows a detail of the attenuation orifice and the exterior overflow pipe.
Figure C14 Water Tank Schematic Showing Case
Study Elevations and Volumes
2,800 litres
3,000 litres
2 m
1.16 m
0.2 m
Figure C15 Orifice and Exterior Pipe Details
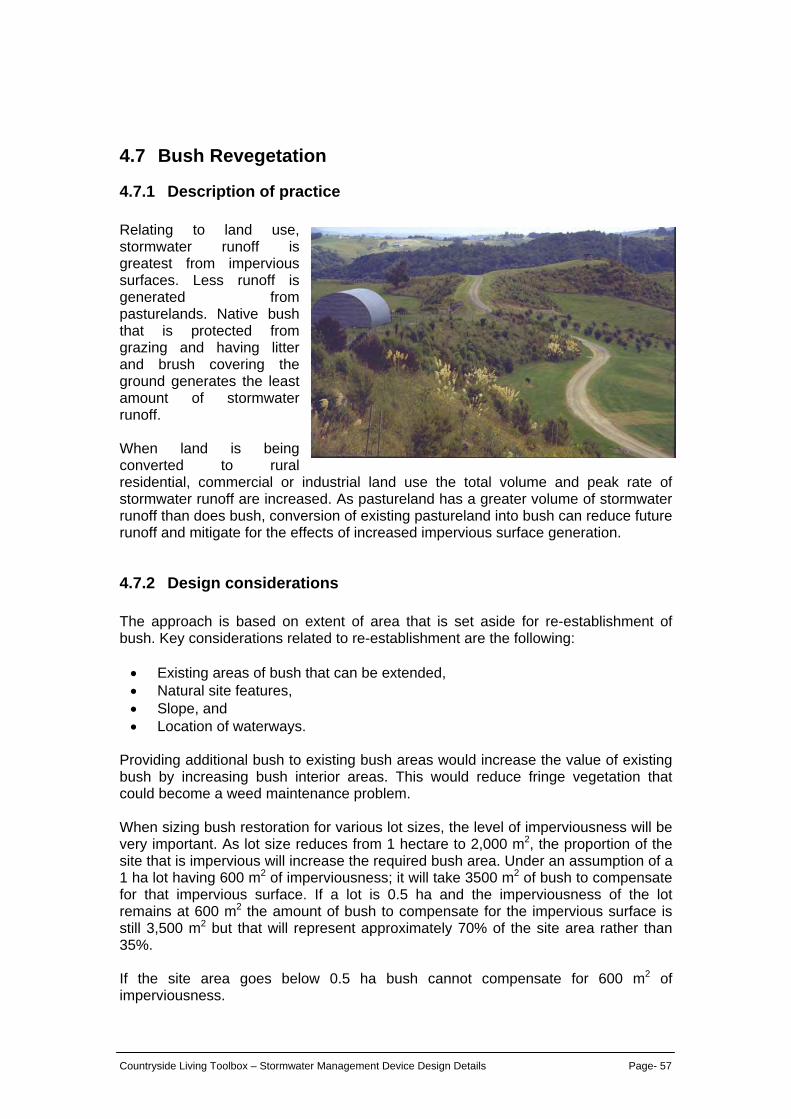
Countryside Living Toolbox – Stormwater Management Device Design Details Page- 57
4.7 Bush Revegetation
4.7.1 Description of practice Relating to land use, stormwater runoff is greatest from impervious surfaces. Less runoff is generated from pasturelands. Native bush that is protected from grazing and having litter and brush covering the ground generates the least amount of stormwater runoff. When land is being converted to rural residential, commercial or industrial land use the total volume and peak rate of stormwater runoff are increased. As pastureland has a greater volume of stormwater runoff than does bush, conversion of existing pastureland into bush can reduce future runoff and mitigate for the effects of increased impervious surface generation.
4.7.2 Design considerations The approach is based on extent of area that is set aside for re-establishment of bush. Key considerations related to re-establishment are the following: • Existing areas of bush that can be extended, • Natural site features, • Slope, and • Location of waterways.
Providing additional bush to existing bush areas would increase the value of existing bush by increasing bush interior areas. This would reduce fringe vegetation that could become a weed maintenance problem. When sizing bush restoration for various lot sizes, the level of imperviousness will be very important. As lot size reduces from 1 hectare to 2,000 m2, the proportion of the site that is impervious will increase the required bush area. Under an assumption of a 1 ha lot having 600 m2 of imperviousness; it will take 3500 m2 of bush to compensate for that impervious surface. If a lot is 0.5 ha and the imperviousness of the lot remains at 600 m2 the amount of bush to compensate for the impervious surface is still 3,500 m2 but that will represent approximately 70% of the site area rather than 35%. If the site area goes below 0.5 ha bush cannot compensate for 600 m2 of imperviousness.
Countryside Living Toolbox – Stormwater Management Device Design Details Page- 58
4.7.3 Targeted contaminants While native bush vegetation having a good ground cover can provide contaminant reduction benefits, the main purpose in this toolbox is the reduction of stormwater runoff volumes. Organic matter on the bush floor will remove metals and assist in removal of sediments but residential land use in rural areas does not generate large contaminant loads. Commercial and industrial land use may increase contaminant loads but other practices provided in the toolbox would provide greater levels of treatment.
4.7.4 Advantages Native bush grows over time and maintenance concerns diminish. Where other stormwater management practices need maintenance to ensure long-term performance, bush revegetation improves its hydrological function over time and maintenance needs become minimal. Native bush also provides benefits for wildlife habitat, shading and cooling during summer. It can act as a windbreak and can be an aesthetic amenity.
4.7.5 Limitations Native bush planting can have fairly high maintenance needs during the first 2-3 years of growth relating to weed control and possible watering needs during drought conditions. Native bush can also be seen as limiting site usage. If some livestock were a desired activity on the site, they must be excluded from access to the bush areas to ensure that bush growth is not adversely affected. When planted in widths of less than 20 metres, weeding can remain a problem for years.
4.7.6 Design sizing Bush re-establishment is based on the following Table C17.
Table C17 Bush Planting Requirements
Proposed site impervious area (m2) Area of bush required (m2) 100 1,000 200 1,500 300 2,000 400 2,500 500 3,000 600 3,500
The calculations, using a variation of TP 108 that calculates storm and base flow under various landuse scenarios (Beca Carter Hollings & Ferner, 2000), work out to be very even throughout the Region. For every 100 m2 of imperviousness beyond the first 100 m2 of imperviousness there is a 500 m2 requirement for bush establishment.
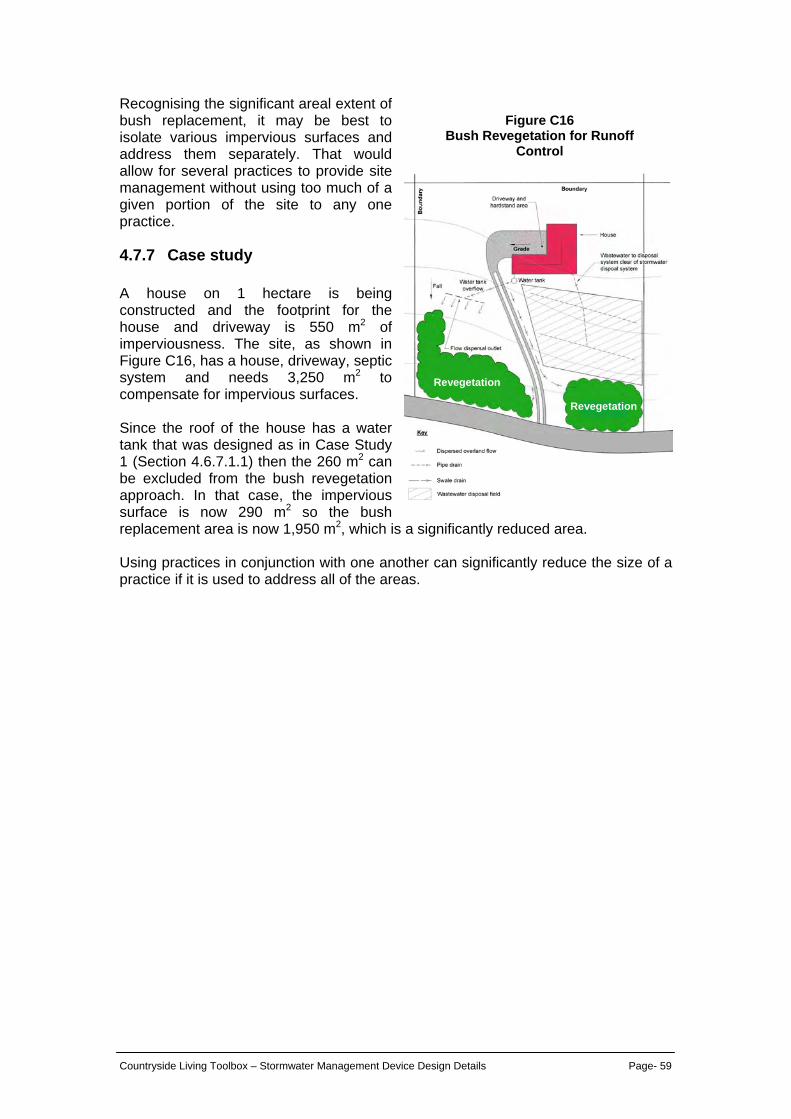
Countryside Living Toolbox – Stormwater Management Device Design Details Page- 59
Recognising the significant areal extent of bush replacement, it may be best to isolate various impervious surfaces and address them separately. That would allow for several practices to provide site management without using too much of a given portion of the site to any one practice.
4.7.7 Case study A house on 1 hectare is being constructed and the footprint for the house and driveway is 550 m2 of imperviousness. The site, as shown in Figure C16, has a house, driveway, septic system and needs 3,250 m2 to compensate for impervious surfaces. Since the roof of the house has a water tank that was designed as in Case Study 1 (Section 4.6.7.1.1) then the 260 m2 can be excluded from the bush revegetation approach. In that case, the impervious surface is now 290 m2 so the bush replacement area is now 1,950 m2, which is a significantly reduced area. Using practices in conjunction with one another can significantly reduce the size of a practice if it is used to address all of the areas.
Figure C16 Bush Revegetation for Runoff
Control
Revegetation
Revegetation
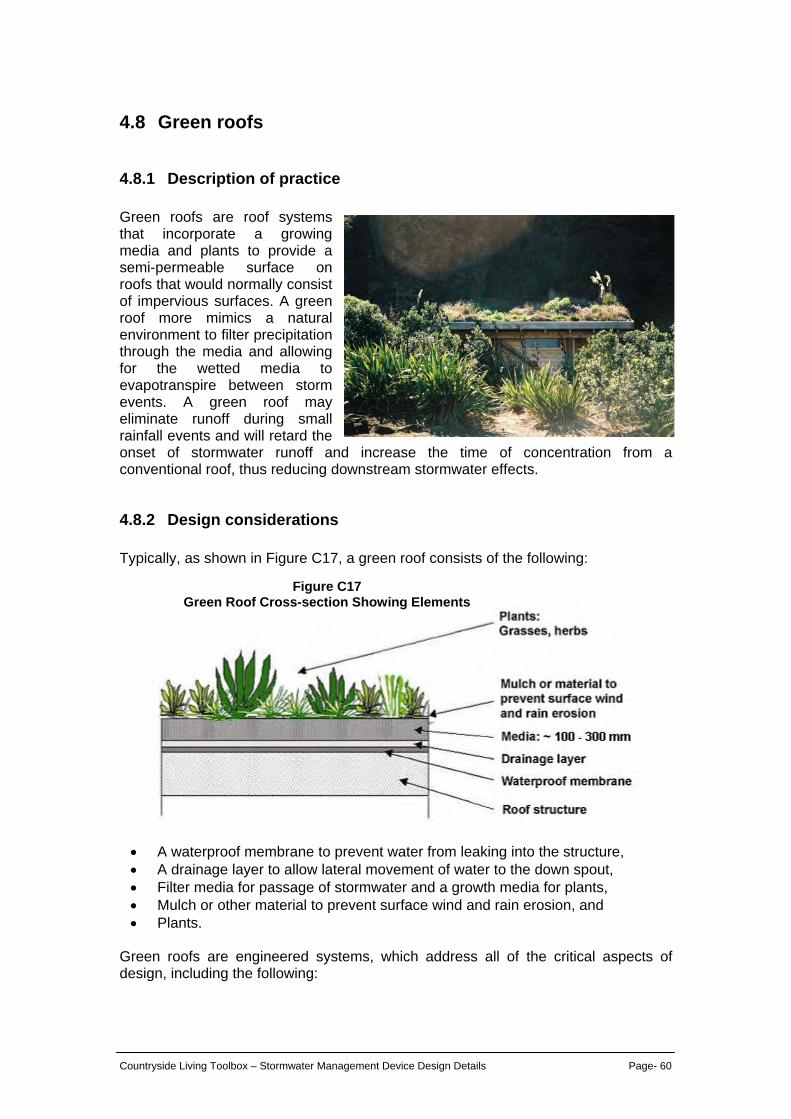
Countryside Living Toolbox – Stormwater Management Device Design Details Page- 60
4.8 Green roofs
4.8.1 Description of practice Green roofs are roof systems that incorporate a growing media and plants to provide a semi-permeable surface on roofs that would normally consist of impervious surfaces. A green roof more mimics a natural environment to filter precipitation through the media and allowing for the wetted media to evapotranspire between storm events. A green roof may eliminate runoff during small rainfall events and will retard the onset of stormwater runoff and increase the time of concentration from a conventional roof, thus reducing downstream stormwater effects.
4.8.2 Design considerations Typically, as shown in Figure C17, a green roof consists of the following:
• A waterproof membrane to prevent water from leaking into the structure, • A drainage layer to allow lateral movement of water to the down spout, • Filter media for passage of stormwater and a growth media for plants, • Mulch or other material to prevent surface wind and rain erosion, and • Plants.
Green roofs are engineered systems, which address all of the critical aspects of design, including the following:
Figure C17 Green Roof Cross-section Showing Elements
Countryside Living Toolbox – Stormwater Management Device Design Details Page- 61
• The saturated weight of the system and load bearing capacity of the underlying roof,
• Moisture and root penetration resistance through use of a waterproof membrane,
• Resistance to wind sheer, management of drainage, and • The suitability of the proposed plant material.
There are generally considered to be two types of green roofs. • Extensive green roofs, which are shallow systems having less than 100 mm of
media, which are not being advocated by this toolbox, and • Intensive green roofs, which are deeper systems having more than 150 mm of
media.
4.8.3 Targeted contaminants From a water quality perspective, green roofs would be effective in retention of fine, wind blown sediments and dissolved metals.
4.8.4 Advantages Overseas data indicates that green roofs can be very effective at reducing the total volume of stormwater runoff. A study in North Carolina (Moran, Hunt and Smith, 2005) indicated that a green roof retained 45% of total annual runoff. Green roofs can be used on a variety of roof types and on any property size, as their installation will not require the use of additional land. In Auckland’s temperate climate, green roofs should not be limited by the ability to establish and maintain vegetative cover. Another key advantage of green roofs is that they are aesthetically pleasing. They can be very attractive. There are also benefits related to urban cooling during the summer months and insulation benefits for air conditioning and heating.
4.8.5 Limitations The first consideration that might limit the use of green roofs for rural development is that most rural development will need the runoff that comes from their roof for site water use. A significant reduction in annual runoff may not be beneficial for water needs. There are several other issues that may be considered as limitations. • Green roofs, as recommended in this toolbox, will necessitate increased
structural strength of the roof that would increase costs. • Maintenance needs, while expected to be minimal, may be costly and difficult
depending on height above ground. • Establishment of plants and their overall survival may require watering during
dry periods, at least for the first several years. • Weed removal may be a requirement depending on individual conditions.
Countryside Living Toolbox – Stormwater Management Device Design Details Page- 62
4.8.6 Design sizing There are several key elements of design that need to be addressed. • Depth of media, • Composition of media, • Plant selection, • Additional support consideration, • Roof slope, • Drainage layer and impermeable liner, and • Stormwater management benefits
4.8.6.1 Depth of media There are two green roofs in the Auckland Region that are being studied: the University of Auckland Engineering Building green roof, and the Waitakere City Council Headquarters building green roof. While these are both fairly new installations, some guidance can be given on plant propagation that relates to the depth of media. The University of Auckland site has media between 50 mm - 70 mm in depth. Over the past summer, plants were severely stressed due to the lack of moisture in the shallow subgrade. The Waitakere City green roof fared much better due to its depth being 70 - 150 mm. Deeper media depths are better than shallower ones. It is recommended that there be at least 150 mm of media to promote a sustainable plant community.
4.8.6.2 Composition of media The University of Auckland site investigated a number of different media and has found that the mixture of the following provides the best results and that mixture is recommended for use. • 30% zeolite, • 50% pumice, and • 20% composted bark.
4.8.6.3 Plant selection New Zealand does not have any native succulents, which is the plant of choice internationally due to their ability to thrive in both wet and dry conditions. There are New Zealand plants that are suitable for green roofs, especially with the recommended depth of media being at least 150 mm. Recommended plants include the following:
Countryside Living Toolbox – Stormwater Management Device Design Details Page- 63
• Disphymae australe (NZ ice plant) • Pimelea prostrata (NZ daphne) • Libertia peregrinans (NZ Iris) • Festuca coxii (native tussock) • Comprosma Hawera • Acaena microphylla (NZ bidibid) • Lepostigma setulosa
Other plants will be acceptable, but a plant specialist should be consulted prior to use due to the shallow media depths and the extremes of wetting and drying that will be encountered.
4.8.6.4 Additional support consideration The additional load of materials comprising the various components and an assumption of having saturated media conditions needs to be considered when accommodating the roofs structural load. The calculation has to be based on an assumption of a saturated state. A chartered Professional Engineer must be consulted in the design and construction of a green roof system.
4.8.6.5 Roof slope Generally, the construction effort and cost of green roofing increases with slope. Minimal slopes slow down water flow and slopes above 5o will have more rapid runoff. Due to native plants not providing the density of vegetation that would bind the media, it is recommended that green roof slopes not exceed 5o unless steps are taken to prevent media slippage and erosion.
4.8.6.6 Drainage layer and impermeable liner The drainage layer should be a Delta NP drainage layer, or equivalent, with a nonwoven geotextile, which is a two-layer drainage and waterproofing system with the cloth facing the media. The impermeable liner should be Permathene flexible polypropylene geomembrane (250 um), or equivalent. Both of these products can be substituted for if the substitution meets the same standards as the two presented.
4.8.6.7 Stormwater management benefits Green roofs provide an excellent media for water quality treatment of any airborne contaminants and thus meet water quality treatment guidelines. The media recommended includes zeolite, which is a hydrated aluminosilicate mineral having a micro-porous structure. Pumice also has a very high porosity and
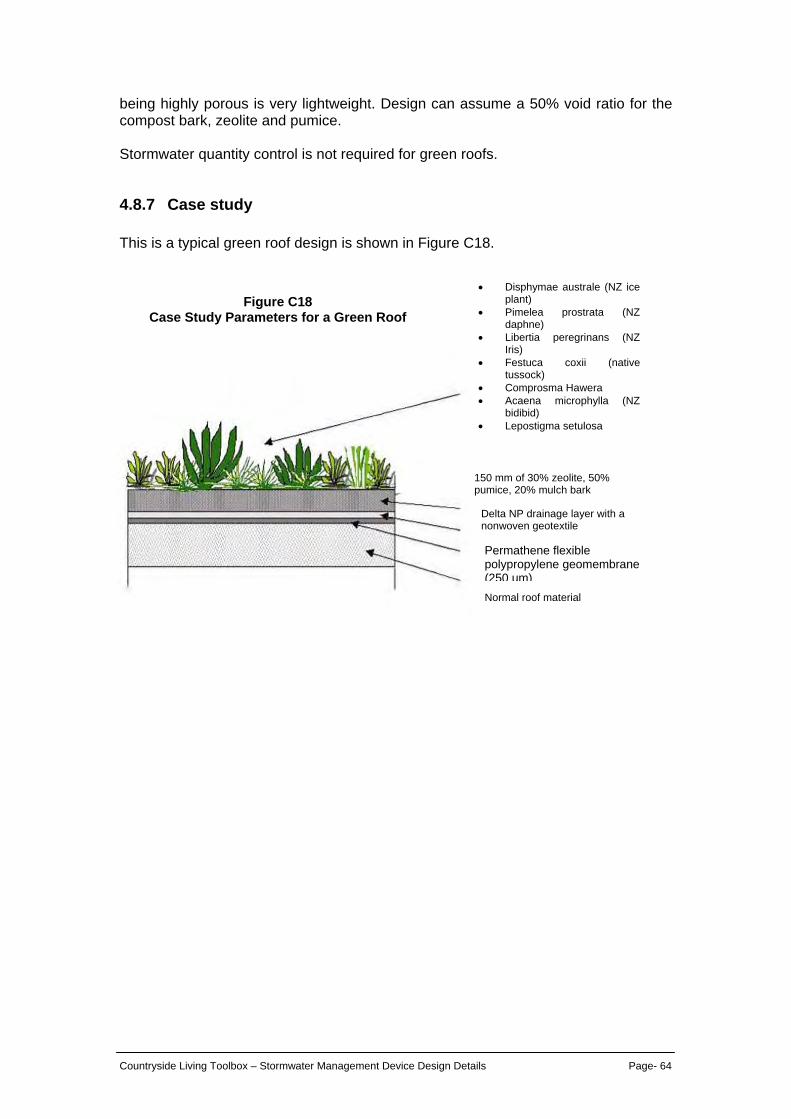
Countryside Living Toolbox – Stormwater Management Device Design Details Page- 64
being highly porous is very lightweight. Design can assume a 50% void ratio for the compost bark, zeolite and pumice. Stormwater quantity control is not required for green roofs.
4.8.7 Case study This is a typical green roof design is shown in Figure C18.
• Disphymae australe (NZ ice plant)
• Pimelea prostrata (NZ daphne)
• Libertia peregrinans (NZ Iris)
• Festuca coxii (native tussock)
• Comprosma Hawera • Acaena microphylla (NZ
bidibid) • Lepostigma setulosa
150 mm of 30% zeolite, 50% pumice, 20% mulch bark
Delta NP drainage layer with a nonwoven geotextile
Permathene flexible polypropylene geomembrane (250 um)Normal roof material
Figure C18 Case Study Parameters for a Green Roof
Countryside Living Toolbox – Stormwater Management Device Design Details Page- 65
4.9 Access roads and driveways
4.9.1 Introduction Development usually results in the need for more roads and an associated increase in road runoff. In designing and locating new roads, developers will be expected to take account of the general objectives set by the local territorial authorities to minimise stormwater flow increases associated with development and provide ongoing stormwater management. General guidelines for new roads include: • Roads should be located, where practicable, away from watercourses and
existing areas of established bush, • Roads should be aligned to minimise cuts and fills, • Road and pavement widths should be kept to a minimum, and • Houses should be sited to minimise the length of access road needed and the
opportunity for shared access should be explored. Runoff from roads increases the volumes and rates of stormwater runoff above that of pervious areas and contains contaminants that require treatment. This section of the toolbox will focus on driveway design although management of new access roads will also require stormwater management approval; either from the ARC through a resource consent or through building consent approval by the territorial authority.
4.9.2 Driveways The driveway design is the responsibility of the property owner. The general principals identified above for access roads also apply to driveways. Options to consider for driveways include: • The use of dual strip driveways with a grassed central strip, and • Shared driveways serving several sites.
Figure C19 shows typical cross-sections of a driveway. It is important that the driveway design takes into account the ground conditions under the driveway. Figure C20 shows the detail for a strip driveway.
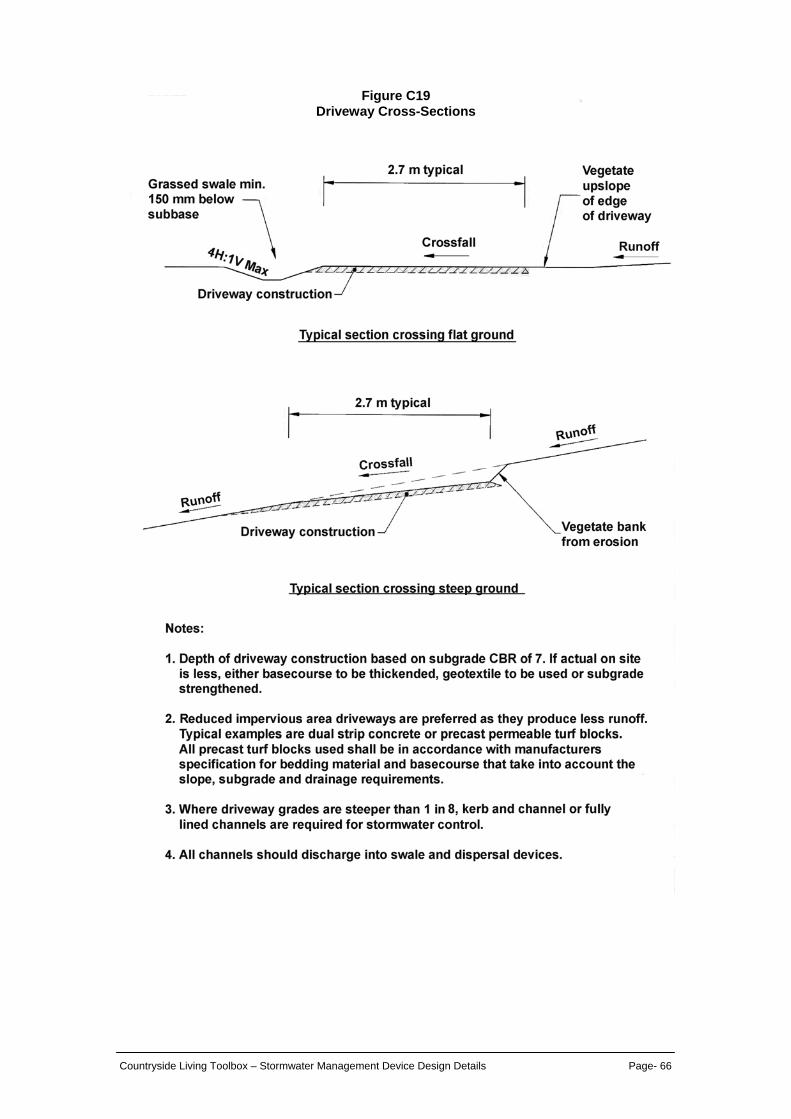
Countryside Living Toolbox – Stormwater Management Device Design Details Page- 66
Figure C19 Driveway Cross-Sections
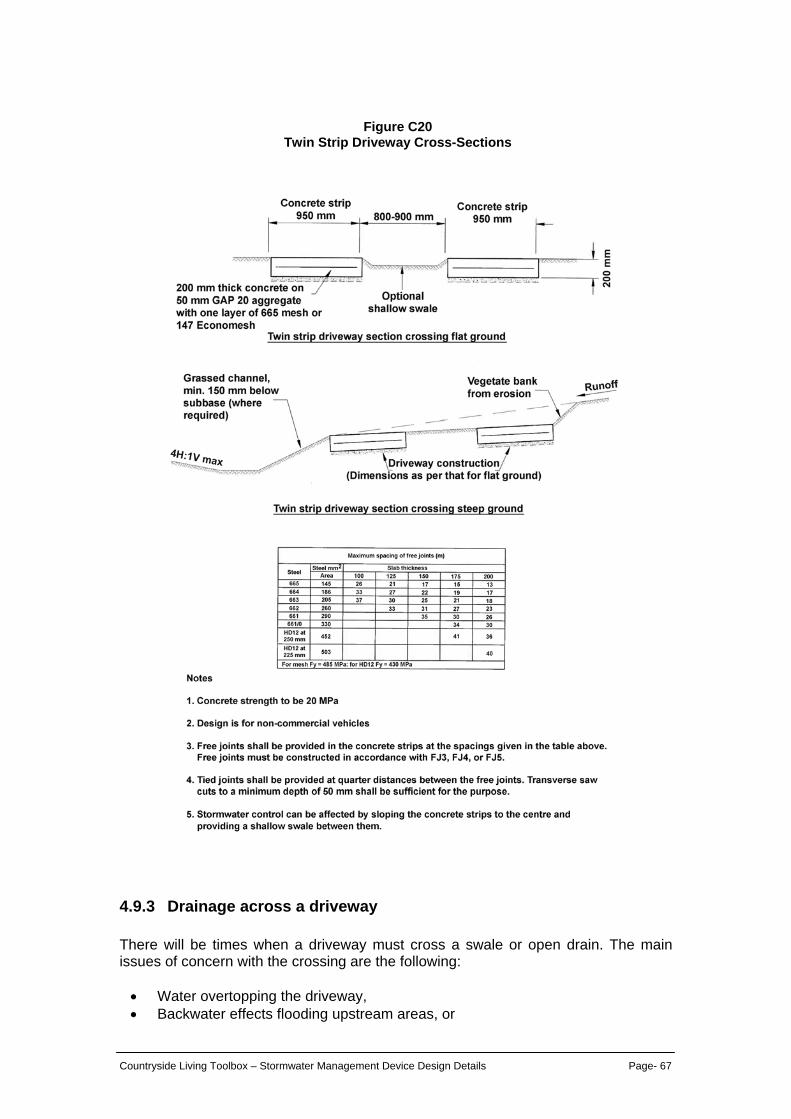
Countryside Living Toolbox – Stormwater Management Device Design Details Page- 67
4.9.3 Drainage across a driveway There will be times when a driveway must cross a swale or open drain. The main issues of concern with the crossing are the following: • Water overtopping the driveway, • Backwater effects flooding upstream areas, or
Figure C20 Twin Strip Driveway Cross-Sections

Countryside Living Toolbox – Stormwater Management Device Design Details Page- 68
• Erosion of the outfall. All of these issues can be addressed through good design and that design will depend on the capacity of the swale. In most instances, the swale will be designed for a 10-year storm and the swale design already considers the 10-year velocity to ensure that they do not exceed 1.5 m/s. It is recommended for conveyance of a 10-year storm for a 1-hectare site that a pipe size for driveway entrances is at least 200 mm in diameter. In addition to the size, the pipe should be buried approximately 50 mm below grade to allow for sedimentation of the invert that will reduce flow velocities. Flows beyond a 10-year storm should be allowed to overtop the driveway to prevent pressure flow in the pipe. Larger catchment areas draining via an open vegetated channel will require an individual design for pipe sizing. This criterion only applies to countryside living areas where levels of imperviousness are small.
Countryside Living Toolbox – Stormwater Management Device Design Details Page- 69
4.10 Dispersal devices
4.10.1 Introduction When flows exceed the ability of water tanks to accept water, tanks have an overflow system through an 80 mm outfall pipe. In the same regard, rain garden underdrain pipes must also discharge in a manner that does not cause erosion. Swales and wetland swales also need to discharge in a non-erosive manner to minimise receiving system impacts. These practices all need a dispersal device to distribute flows to avoid concentration and possible downstream scour.
4.10.2 Description There are three alternative dispersal devices: a trench, an above ground dispersal device and a rigid boundary device. The intended function of these devices is to spread any discharges from the system over a sufficiently large area to avoid concentrations of flow. In this way it attempts to mimic the predevelopment conditions on site. The length of the dispersal devices may require confirmation based on site conditions during the consent or permit approval stage. The use of an above ground dispersal device must consider the effects of UV rays and the approach must be submitted to the local council for review and approval.
4.10.3 Application Dispersal devices are the preferred means to disperse concentrated flows from stormwater management practices on rural projects. Figures C21, C22 and C23 provide conceptual details for the design of dispersal devices.
4.10.4 Design considerations There are several key elements related to the placement of dispersal devices. • They should be sited clear of any wastewater effluent disposal fields. • They should not be located above or on a slope that has geotechnical stability
issues. This is especially true of the dispersal trench that may have water ponding in it on a routine basis causing saturated subsoil conditions.
• The dispersal devices should be sited such that flows will not concentrate for a distance of at least 30 metres past the outlet.
• The dispersal device should be constructed of durable materials and should minimise to the degree possible future maintenance requirements.
• The dispersal device design should give due regard to the potential conflict that may occur with any proposed activity on site. In this regard, fencing or isolation from other activities may be required.
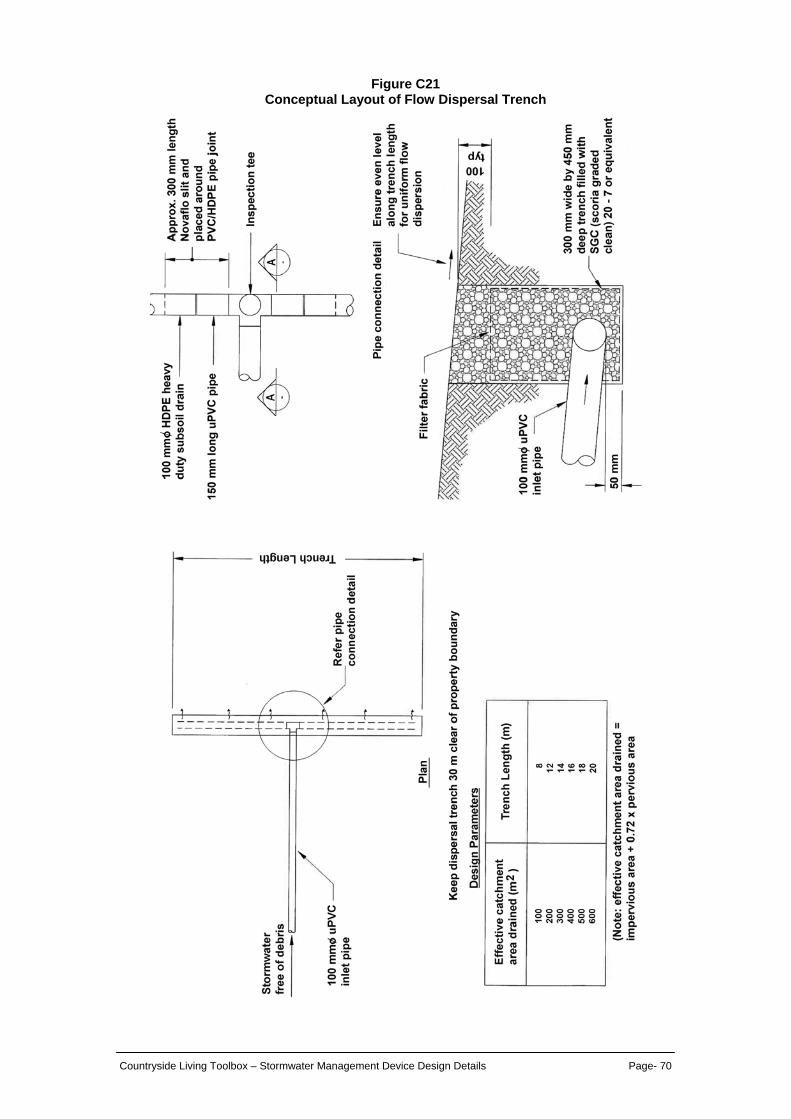
Countryside Living Toolbox – Stormwater Management Device Design Details Page- 70
Figure C21 Conceptual Layout of Flow Dispersal Trench
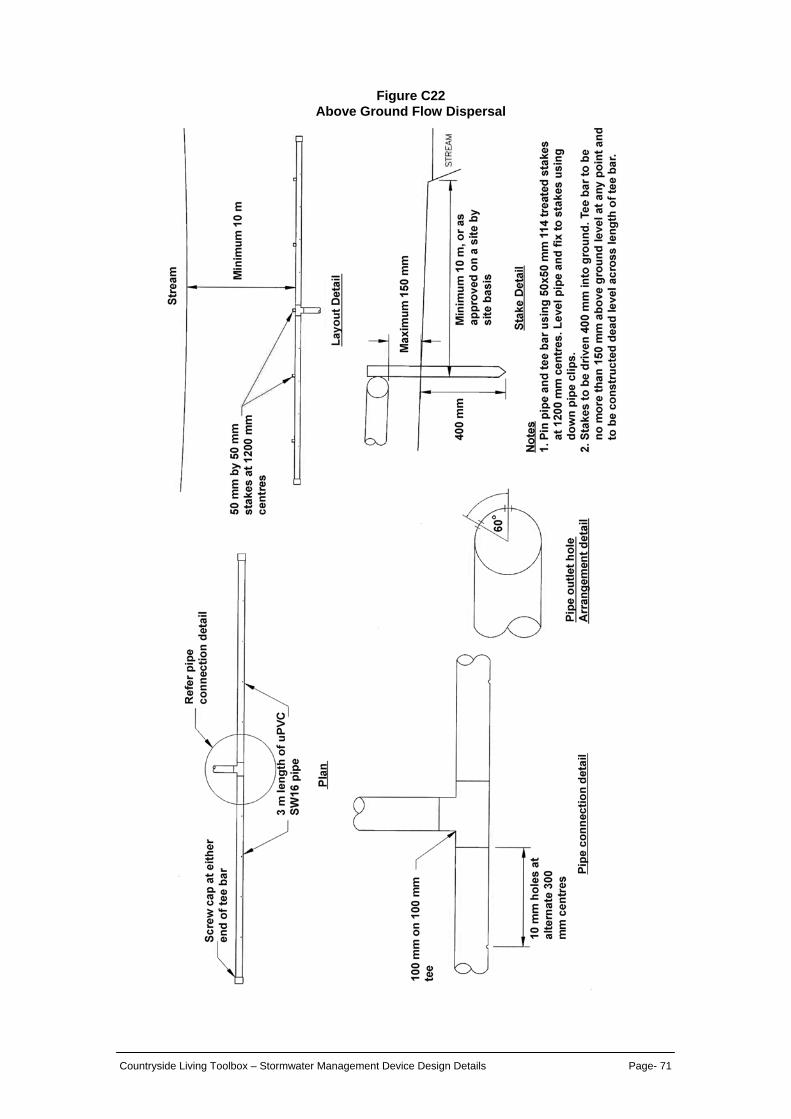
Countryside Living Toolbox – Stormwater Management Device Design Details Page- 71
Figure C22 Above Ground Flow Dispersal
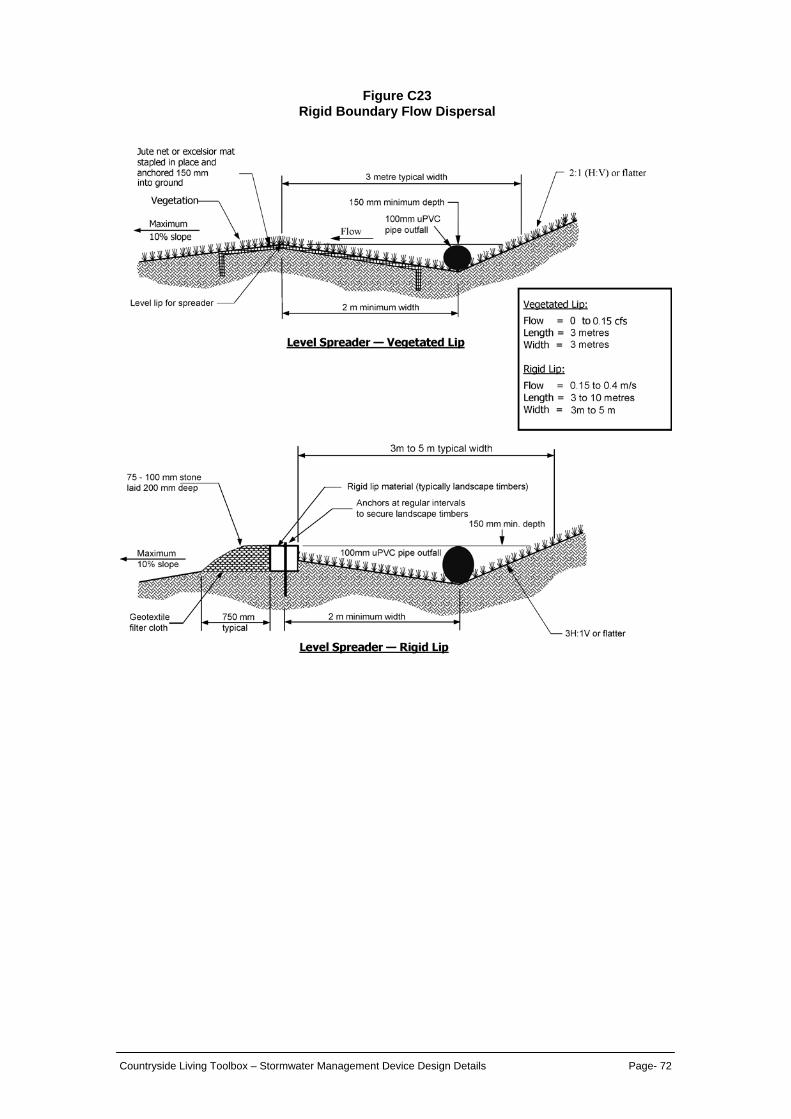
Countryside Living Toolbox – Stormwater Management Device Design Details Page- 72
Figure C23 Rigid Boundary Flow Dispersal

Countryside Living Toolbox – Stormwater Management Device Design Details Page- 73
5 BIBLIOGRAPHY Auckland Regional Council, Guidelines for Stormwater Runoff Modelling in the Auckland Region, Technical Publication No. 108, April 1999. Auckland Regional Council, Stormwater Management Devices: Design Guidelines Manual, Second Edition, May 2003. ASTM International, ASTM 1815-06: Standard test methods for saturated hydraulic conductivity, water retention, porosity, and bulk density of putting green and sports turb root zones, West Conshohocken, U.S.A., 2006. Beca, Carter Hollings & Ferner Ltd., Stormwater Runoff Volumes, Prepared for the Auckland Regional Council, February 2000. California Stormwater Quality Association, California Stormwater BMP Handbook, New Development and Redevelopment, January 2003. Center for Watershed Protection, Grass Channel fact sheet in Stormwater Manager’s Resource Center, Ellicott City, Maryland, 2001. Chow, Ven Te, Open Channel Hydraulics, McGraw-Hill Book Company, Inc., 1959. Christchurch City Council, Waterways, Wetlands and Drainage Guide, Part B: Design, 2003. Darcy, H.,, Les Fontaines Publiques de la Ville de Dijon, Dalmont, Paris, 1856. Davis, ROE, Bennett, H., H., Grouping of Soils on the Basis of Mechanical Analysis, United States Department of Agriculture, Departmental Circulation No. 419, 1927. Facility for Advancing Water Biofiltration, Guidelines for Soil Media in Bioretention Systems, Version 2.01, March 2008. Larcombe, Michael, Removal of Stormwater Contaminants Using Grass Swales, prepared for the Auckland Regional Council, January 2003. Maidment, David, R. (editor in chief), Handbook of Hydrology, McGraw-Hill, Inc. 1993. Maunsell Ltd., Raintank Guidelines, First Edition, prepared for North Shore City Council, July 2008. Ministry for the Environment, Climate Change Effects and Impacts Assessment: A Guidance Manual for Local Government in New Zealand, 2nd Edition, May 2008. Ministry of Health, Household Water Supply, commissioned from the Works Counsultancy Services Ltd., Water Treatment Centre, by the Department of Health, 1992, Updated by the Public Health Commission 1995, updated by the Ministry of Health, 2004.
Countryside Living Toolbox – Stormwater Management Device Design Details Page- 74
Moran, A., Hunt, B., and Smith, J., Hydrologic and Water Quality Performance from Green Roofs in Goldsboro and Raleigh, North Carolina, Proceedings, Greening Rooftops for Sustainable Communities, Washington DC, 2005. Municipality of Metropolitan Seattle, Biofiltration Swale Performance, Recommendations, and Design Considerations, Water Pollution Control Department, Publication 657, October 1992. New Zealand Water Environment Research Foundation, On-Site Stormwater Management Guideline, October 2004. Somes, N., Crosby, J., Review of Street Scale WSUD in Melbourne Study Findings, Kingston City Council and the Better Bays and Waterways, 13/1/01 (It is believed that the date is a typographical error as an earlier revision was dated 2007), the date is probably 13.1.08. Standards Australia, AS1289.3.6.1 – 1995: Methods of Testing Soils for Engineering Purposes – Soil Classification Tests – Determination of the Particle Size Distribution of a Soil – Standard Method of Analysis by Sieving, Sydney, Australia, Standards Australia International Ltd., 1995. Washington State Department of Transportation (WSDOT). 1995. Highway Runoff Manual. Washington State Department of Transportation. Washington State Department of Ecology, Stormwater Management Manual for Western Washington, Volume 1 - Minimum technical Requirements for Site Planning, Publication Numbers 99-11 through 99-13, August 2001.