Embed Size (px)
Citation preview
Staff memo
The COVID-19 pandemic crisis and vulnerable firms. Evidence
from Sweden.
Cristina Cella
October 2021

2
3
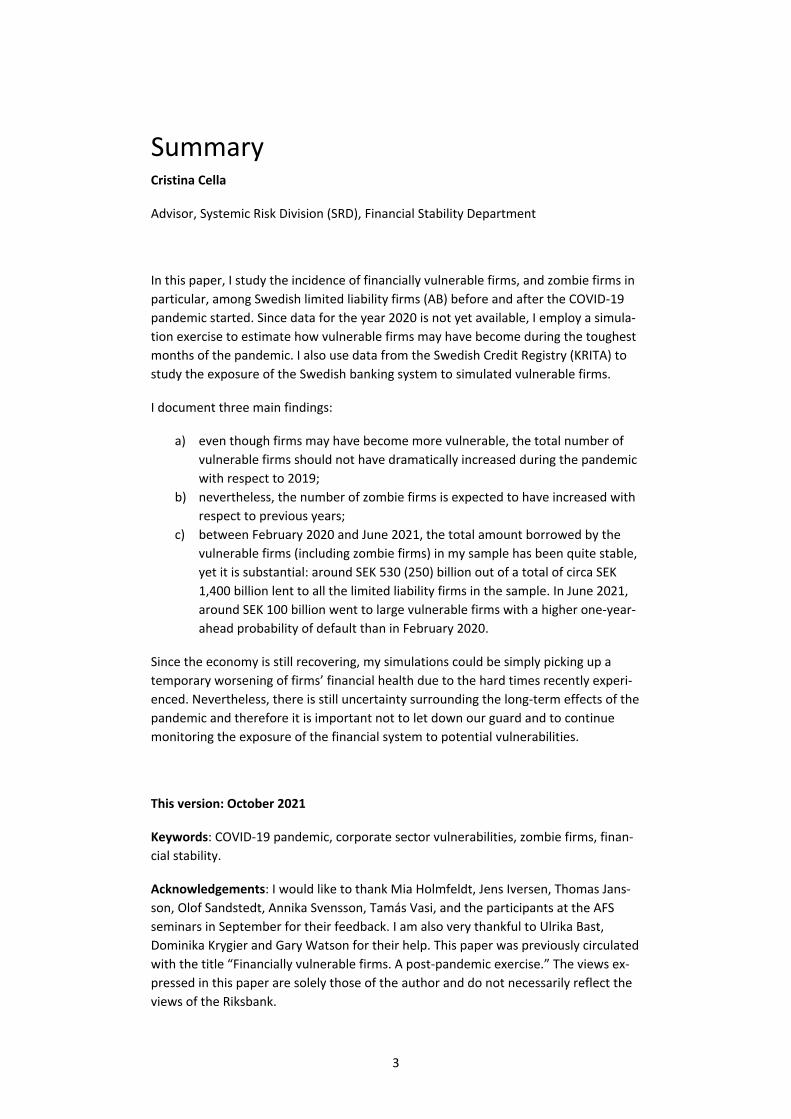
Summary Cristina Cella
Advisor, Systemic Risk Division (SRD), Financial Stability Department
In this paper, I study the incidence of financially vulnerable firms, and zombie firms in
particular, among Swedish limited liability firms (AB) before and after the COVID-19
pandemic started. Since data for the year 2020 is not yet available, I employ a simula-
tion exercise to estimate how vulnerable firms may have become during the toughest
months of the pandemic. I also use data from the Swedish Credit Registry (KRITA) to
study the exposure of the Swedish banking system to simulated vulnerable firms.
I document three main findings:
a) even though firms may have become more vulnerable, the total number of
vulnerable firms should not have dramatically increased during the pandemic
with respect to 2019;
b) nevertheless, the number of zombie firms is expected to have increased with
respect to previous years;
c) between February 2020 and June 2021, the total amount borrowed by the
vulnerable firms (including zombie firms) in my sample has been quite stable,
yet it is substantial: around SEK 530 (250) billion out of a total of circa SEK
1,400 billion lent to all the limited liability firms in the sample. In June 2021,
around SEK 100 billion went to large vulnerable firms with a higher one-year-
ahead probability of default than in February 2020.
Since the economy is still recovering, my simulations could be simply picking up a
temporary worsening of firms’ financial health due to the hard times recently experi-
enced. Nevertheless, there is still uncertainty surrounding the long-term effects of the
pandemic and therefore it is important not to let down our guard and to continue
monitoring the exposure of the financial system to potential vulnerabilities.
This version: October 2021
Keywords: COVID-19 pandemic, corporate sector vulnerabilities, zombie firms, finan-
cial stability.
Acknowledgements: I would like to thank Mia Holmfeldt, Jens Iversen, Thomas Jans-
son, Olof Sandstedt, Annika Svensson, Tamás Vasi, and the participants at the AFS
seminars in September for their feedback. I am also very thankful to Ulrika Bast,
Dominika Krygier and Gary Watson for their help. This paper was previously circulated
with the title “Financially vulnerable firms. A post-pandemic exercise.” The views ex-
pressed in this paper are solely those of the author and do not necessarily reflect the
views of the Riksbank.
4
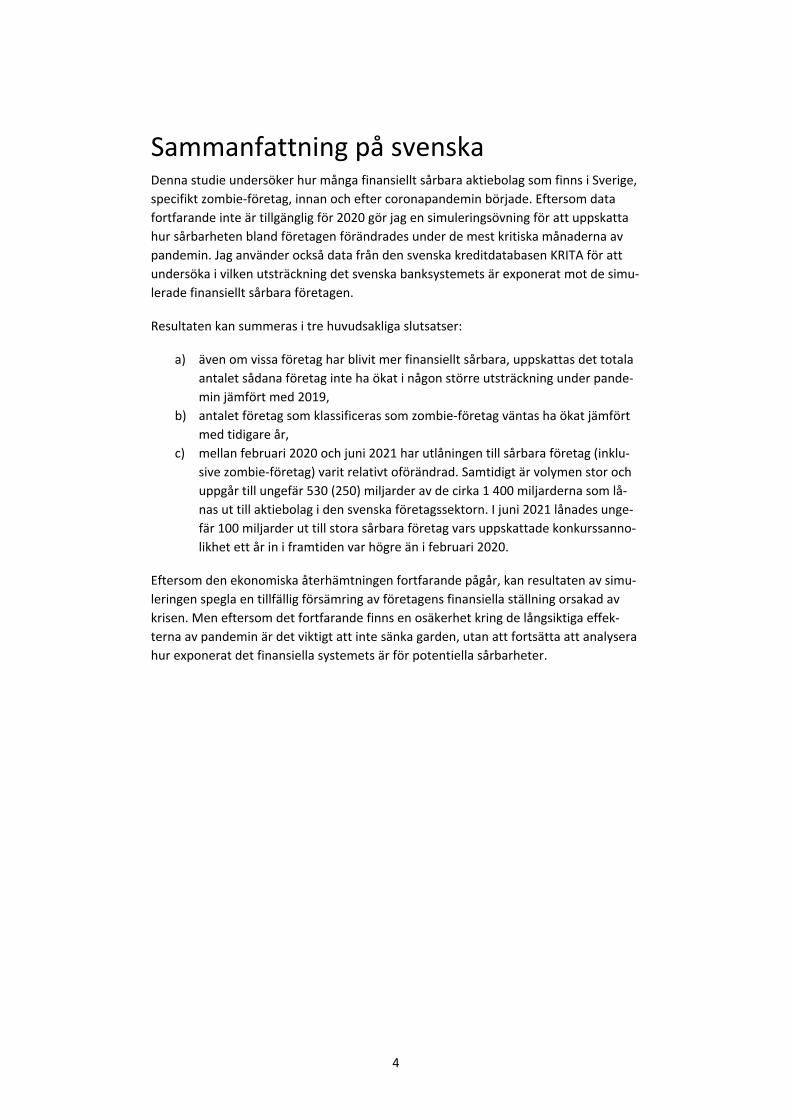
Sammanfattning på svenska Denna studie undersöker hur många finansiellt sårbara aktiebolag som finns i Sverige,
specifikt zombie-företag, innan och efter coronapandemin började. Eftersom data
fortfarande inte är tillgänglig för 2020 gör jag en simuleringsövning för att uppskatta
hur sårbarheten bland företagen förändrades under de mest kritiska månaderna av
pandemin. Jag använder också data från den svenska kreditdatabasen KRITA för att
undersöka i vilken utsträckning det svenska banksystemets är exponerat mot de simu-
lerade finansiellt sårbara företagen.
Resultaten kan summeras i tre huvudsakliga slutsatser:
a) även om vissa företag har blivit mer finansiellt sårbara, uppskattas det totala
antalet sådana företag inte ha ökat i någon större utsträckning under pande-
min jämfört med 2019,
b) antalet företag som klassificeras som zombie-företag väntas ha ökat jämfört
med tidigare år,
c) mellan februari 2020 och juni 2021 har utlåningen till sårbara företag (inklu-
sive zombie-företag) varit relativt oförändrad. Samtidigt är volymen stor och
uppgår till ungefär 530 (250) miljarder av de cirka 1 400 miljarderna som lå-
nas ut till aktiebolag i den svenska företagssektorn. I juni 2021 lånades unge-
fär 100 miljarder ut till stora sårbara företag vars uppskattade konkurssanno-
likhet ett år in i framtiden var högre än i februari 2020.
Eftersom den ekonomiska återhämtningen fortfarande pågår, kan resultaten av simu-
leringen spegla en tillfällig försämring av företagens finansiella ställning orsakad av
krisen. Men eftersom det fortfarande finns en osäkerhet kring de långsiktiga effek-
terna av pandemin är det viktigt att inte sänka garden, utan att fortsätta att analysera
hur exponerat det finansiella systemets är för potentiella sårbarheter.
5
Table of contents
1 Introduction 6
2 Vulnerable firms before the pandemic struck 8
2.1 How vulnerable were firms before the pandemic struck? 8
3 Vulnerable firms after the pandemic 14
3.1 Simulation exercise: How the economic consequences of the COVID-19 pandemic may have exacerbated firms’ financial vulnerabilities in 2020-2021 14
4 Banks’ exposure to vulnerable firms in June 2021 23
5 Conclusions 29
References 31 APPENDIX A. Evolution of zombie firms over the period 2016- 2019 and simulated data for 2020. 33 Appendix B: Additional material for simulated data 35 Appendix C: Government support and vulnerable firms 37
Introduction
6
1 Introduction This memo studies financially vulnerable firms, and in particular zombie firms, in the
universe of Swedish non-financial limited liability firms (aktiebolag) before and after
the COVID-19 pandemic struck.
Building on existing work on financial vulnerabilities and weak firms (International
Monetary Fund 2019, McGowan et al. 2017a, 2017b and 2018 and Cella 2020a,
2020b, and 2021a among others) and on the literature on distressed firms (Altman et
al. 2019), this study starts by identifying firms that, in 2019, may have been particu-
larly vulnerable to financial distress. In general, firms that cannot fully pay the interest
on their debt (i.e. firms with an interest coverage ratio below or equal to 1) are con-
sidered among the most financially vulnerable. Because of their limited ability to ser-
vice their debt, if these firms experience a negative shock to their revenues (even a
small one depending on how levered they are), they may end up defaulting on their
debt. Therefore, the natural question is: to what extent has the economic crisis
caused by the pandemic affected financial vulnerabilities in Sweden?
To address this question, since data for the year 2020 is not yet available, I simulate
the possible impact of the economic crisis on firms’ revenues using the results of the
extra bi-weekly economic tendency survey conducted by the Swedish National Insti-
tute of Economic Research (Konjunkturinstitutet, KI) over the period May 2020-June
2021.
My simulation exercise suggests that the total number of vulnerable firms in the sam-
ple may have only slightly increased during the pandemic. Yet, it also shows a clear ef-
fect of the crisis: firms may have become more vulnerable in most industries, not only
in those industries that have been more directly affected by the measures taken to
contain the spread of the virus (for example, the hotel and restaurant industry and
the transportation industry). In particular, if we focus on the firms that can be identi-
fied as zombie firms (firms that are at least ten years old and have had three consecu-
tive years of interest coverage ratio below 1), my simulation suggests an increase in
their total number to around 6% in 2020 compared to 3.5% in 2019.1
To better assess how important a possible increase in firms’ vulnerabilities may be for
financial stability, using credit registry data (KRITA), I study how much of the lending
portfolio of the largest Swedish monetary financial institutions (MFIs) was allocated to
vulnerable firms, and to zombie firms in particular, in February 2020 and June 2021.
The analyses suggest that in June 2021, simulated vulnerable firms borrowed almost
39% of the total amount of money lent by the MFIs surveyed in KRITA to the limited
liability firms in the sample (about SEK 1,400 billion), around SEK 530 billion. If we fo-
cus on firms that were classified as vulnerable using the original data for 2019, they
would have borrowed a total of circa SEK 500 billion in June 2021. Therefore, inde-
pendent of the data employed, the total amount borrowed by vulnerable firms is
quite similar. This is the case because the simulation predicts that the total number of
1 See Cella 2020a for a discussion of zombie firms in Sweden over the period 2002-2016 and Appendix A in this memo for results for the period 2017-2019.
Introduction
7
vulnerable firms may have not increased dramatically. However, within vulnerable
firms, the simulation also suggests a substantial increase in the number of zombie
firms. In fact, if we focus on zombie firms only, the simulated sub-sample received, in
June 2021, a total of around SEK 250 billion while the sub-sample identified with data
in 2019 would have received around SEK 200 billion. Importantly, in June 2021, al-
most SEK 100 billion went to simulated vulnerable firms that the MFIs themselves ex-
pect to be more at risk of distress in the coming year.
These results suggest that vulnerable firms represent an important part of the lending
portfolios of banks and therefore monitoring their evolution (and better understand-
ing what makes these firms vulnerable) becomes a key issue for the stability of the
Swedish financial system. Yet, while most of the literature focuses on zombie firms,
the results in this study clearly illustrate that the definition of zombie firms can induce
significant biases in the identification of vulnerabilities and could further lead to un-
derestimating (or even overestimating) the actual vulnerabilities that are building up
in the system.
The rest of this study is organized as follows. Section 2 focuses on firms’ financial vul-
nerabilities before the pandemic started. Section 3 focuses on the results of the simu-
lation exercise. Section 4 describes how exposed the largest Swedish banks are to vul-
nerable firms identified at different points in time. Section 5 concludes.
Vulnerable firms before the pandemic struck
8
2 Vulnerable firms before the pandemic struck
2.1 How vulnerable were firms before the pandemic struck?
2.1.1. Data description
In this study, the main source of data is the Serrano database provided by Bisnode in
November 2020. The Serrano database contains detailed financial statement infor-
mation for all Swedish limited liability companies (aktiebolag) that reported to the
Swedish Companies Registration Office (Bolagsverket) in 2019.2
To be able to have a robust analysis, ensure data quality and build the final dataset, I
follow the same methodology employed in Cella (2020a) Section 4.3 After all data
quality screenings have been applied and after dropping all firms (23,068) in the finan-
cial and insurance activities industry (SNI07 64110-66309), I am left with a total of
466,960 firms in 2019.4 For each firm in the sample, I calculate variables that capture
the firm’s ability to service its debt, its leverage and performance among other char-
acteristics. A description of the methodology employed and a discussion of the main
results are presented in the following sections.
2.1.2. Financially vulnerable firms in 2019, definitions and main results
Following my previous work on financial vulnerabilities, (Cella 2020a and 2020b) and
building on the existing literature (see for example, International Monetary Fund 2019
and Altman et al. 2019), I use financial statement information for the entire universe
of limited liability firms in Serrano in 2019 to identify firms that may be more exposed
to the risk of financial distress (i.e. financially vulnerable firms).5 In particular, I try to
2 Besides all main accounting variables, I also know from Serrano whether a firm belongs to a group or not. Yet, because of limited access to consolidated data, I consider all firms as independent firms (also referred to as stand-alone firms), even if they belong to a group. By considering all firms as stand-alone, the total amount of vulnerabilities in the sample may be overestimated. This is because firms that belong to a group may appear to be more vulnerable when considered as independent since group-level synergies and the fact that these firms have access to the internal capital market of the group are not taken into considera-tion. 3 The Serrano database used in this paper is a richer version than the (unidentified) version employed in Cella (2020a). Importantly, I also want to point out that there are two differences in the methodology em-ployed here with respect to the work done in Cella (2020a). First, in this paper I drop all firms that are iden-tified as inactive (as defined in the Serrano database documentation in Section 1.9.8). Second, I also keep in the sample firms that have reported less than 12 months of accounting data and for which data has been processed and imputed by Bisnode. Including these firms allows for a richer and more complete analysis. In fact, by removing firms that have reported less than 12 months of accounting data from the analysis, the sample would shrink down to 325,576, yet the proportions of vulnerable firms in each industry will stay very similar to that calculated in the largest sample. 4 Consistent with the most common practices, I winsorize all of the relevant variables at the 5%-level by year and sector. 5 Financial distress usually precedes bankruptcy, however the definition of financial distress is less rigorous than the definition of bankruptcy. For example, the International Monetary Fund (2019) defines firms with ICR below 1 as firms at imminent risk of distress since these firms are technically insolvent (they are unable to pay the interest on their debt). However, the literature does not only use this definition to identify firms
Vulnerable firms before the pandemic struck
9
capture as many potentially vulnerable firms as possible by employing a broad defini-
tion based on leverage, return on assets (ROA) and interest coverage ratio.6 Using
these variables, I sort all of the firms in the sample in 2019 into the following sub-sets:
1. ICR (interest coverage ratio) <=1: This category includes all firms that in 2019
had an ICR below or equal to 1. I also include in the group firms that had filed
for bankruptcy or restructuring in either 2019 or 2020 but for which the bank-
ruptcy process was not yet concluded by October 2020.
2. High leverage-poor performance: This category contains firms with leverage
above the median in their industry-size category and profitability (ROA) be-
low the median in their industry-size category.
3. High leverage-good performance: This group contains all firms with leverage
and profitability (ROA) above the median in their industry-size category.
4. Other firms: This category contains all firms that could not be otherwise clas-
sified.
The group of firms with ICR<=1 also contains so-called “zombie firms”7 which are
firms older than 10 years that in 2019 had recorded an ICR below 1 for at least three
consecutive years (2019, 2018 and 2017). However, there is also a substantial number
of firms, about 9,400, that in 2019 were already older than 10 years and for two con-
secutive years (2018 and 2019) had had an ICR largely below 1 (a median ICR of -10 in
2019). These firms are “technically” not classifiable as zombie firms in 2019 since they
have registered an ICR<1 only for two consecutive years. Yet, unless their ability to re-
pay the interest on their debt has improved dramatically in 2020, there is a good
chance that these firms could be classified as zombie firms in 2020. I refer to these
firms as “almost-zombie” firms.
Table 1 reports descriptive statistics for the main variables of interest for each of the
sub-sets described above and also specifically for the sub-set of zombie and almost
zombie firms contained in the firms with ICR<=1 group.8
at risk of distress. See Platt et al. (2006) for a discussion of the differences between financial distress and bankruptcy. For more information about the Swedish legal system for bankruptcies and re-organization, see Cella (2020b). 6 A firm’s leverage is calculated as the ratio between its debt and the sum of its debt and equity. A firm’s debt is calculated as the sum of long-term debt (excluding “other non-current liabilities” for example, lease liabilities and convertible loans) and short-term debt. A firm’s performance is calculated by its return on as-sets (ROA) obtained as the ratio between its earnings before interest and taxes (EBIT) and its total assets. A firm’s ICR is obtained as the ratio between a firm’s earnings before interest and taxes (EBIT), and (the abso-lute value) of its interest expenses. 7 Cella 2020a and Cella 2021a for a discussion about shortcomings in the definitions of zombie firms and vulnerable firms, respectively.
8 Importantly, for a total of almost half a million firms in 2019, the data contains 208,833 firms for which
the ICR is missing because it cannot be calculated. A missing ICR is due to interest payment either being
zero or missing in a given year. Firms with missing ICR are included in the analysis and contribute to every
group of firms. In the group of firms with ICR<=1, the ICR is missing for 175 firms (out of a total of 907 firms)
that filed for bankruptcy or restructuring in 2019 and 500 (out of a total of 2,689 firms) that filed in 2020. In
the group of high leverage-poor performance firms, these firms amount to 41,799. Hence, a substantial
number of high leverage-good performance firms with poor performance report either zero interest pay-
ments on their debt or this information is missing for these firms. A total of 39,857 firms with missing ICR
are in the group of high leverage-good performance firms, and 126,502 are classified as other firms. In the
Vulnerable firms before the pandemic struck
10
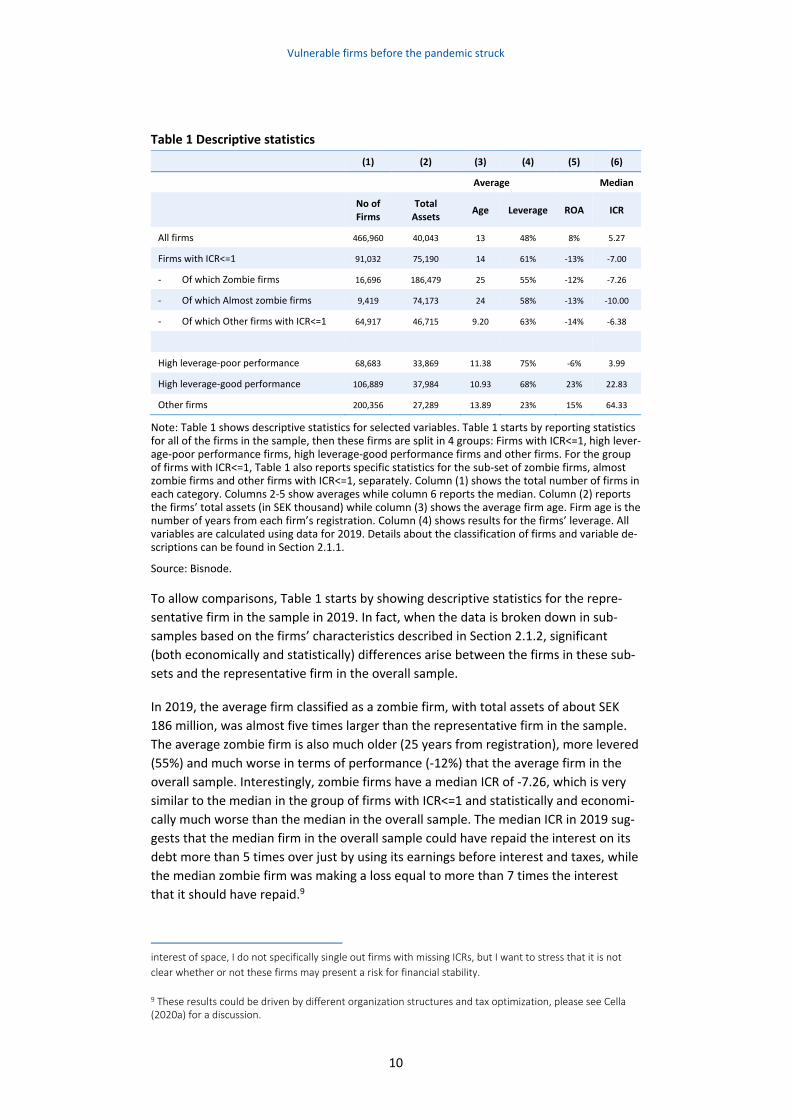
Table 1 Descriptive statistics
(1) (2) (3) (4) (5) (6)
Average Median
No of
Firms
Total
Assets Age Leverage ROA ICR
All firms 466,960 40,043 13 48% 8% 5.27
Firms with ICR<=1 91,032 75,190 14 61% -13% -7.00
- Of which Zombie firms 16,696 186,479 25 55% -12% -7.26
- Of which Almost zombie firms 9,419 74,173 24 58% -13% -10.00
- Of which Other firms with ICR<=1 64,917 46,715 9.20 63% -14% -6.38
High leverage-poor performance 68,683 33,869 11.38 75% -6% 3.99
High leverage-good performance 106,889 37,984 10.93 68% 23% 22.83
Other firms 200,356 27,289 13.89 23% 15% 64.33
Note: Table 1 shows descriptive statistics for selected variables. Table 1 starts by reporting statistics for all of the firms in the sample, then these firms are split in 4 groups: Firms with ICR<=1, high lever-age-poor performance firms, high leverage-good performance firms and other firms. For the group of firms with ICR<=1, Table 1 also reports specific statistics for the sub-set of zombie firms, almost zombie firms and other firms with ICR<=1, separately. Column (1) shows the total number of firms in each category. Columns 2-5 show averages while column 6 reports the median. Column (2) reports the firms’ total assets (in SEK thousand) while column (3) shows the average firm age. Firm age is the number of years from each firm’s registration. Column (4) shows results for the firms’ leverage. All variables are calculated using data for 2019. Details about the classification of firms and variable de-scriptions can be found in Section 2.1.1.
Source: Bisnode.
To allow comparisons, Table 1 starts by showing descriptive statistics for the repre-
sentative firm in the sample in 2019. In fact, when the data is broken down in sub-
samples based on the firms’ characteristics described in Section 2.1.2, significant
(both economically and statistically) differences arise between the firms in these sub-
sets and the representative firm in the overall sample.
In 2019, the average firm classified as a zombie firm, with total assets of about SEK
186 million, was almost five times larger than the representative firm in the sample.
The average zombie firm is also much older (25 years from registration), more levered
(55%) and much worse in terms of performance (-12%) that the average firm in the
overall sample. Interestingly, zombie firms have a median ICR of -7.26, which is very
similar to the median in the group of firms with ICR<=1 and statistically and economi-
cally much worse than the median in the overall sample. The median ICR in 2019 sug-
gests that the median firm in the overall sample could have repaid the interest on its
debt more than 5 times over just by using its earnings before interest and taxes, while
the median zombie firm was making a loss equal to more than 7 times the interest
that it should have repaid.9
interest of space, I do not specifically single out firms with missing ICRs, but I want to stress that it is not
clear whether or not these firms may present a risk for financial stability.
9 These results could be driven by different organization structures and tax optimization, please see Cella (2020a) for a discussion.
Vulnerable firms before the pandemic struck
11
Similar to zombie firms, the average almost zombie firm is also larger (about SEK 74
million in total assets), older (24 years) and worse performing (ROA of -13%) than the
average firm in the sample. Moreover, the median ICR for this group (-10) is worse
than that of firms with ICR<=1 (-7) and zombie firms (-7.26) suggesting that this group
of firms is faced with significant difficulties in repaying the interest on its debt. Finally,
the rest of the firms with ICR<=1 also have quite a poor median ICR (-6.38) and, on av-
erage, perform substantially worse (-14) and are more levered than the average firm
in the sample, still they tend to be smaller and younger than the other vulnerable
firms. These simple descriptive statistics again suggest that firms with ICR<=1 may in-
deed be more vulnerable to changes in economic and financial conditions that may
further worsen their financial health.
The rest of Table 1 suggests that, if compared to firms with an ICR<=1, the other firms
in the sample are on average younger, smaller and have quite good ICRs and there-
fore could be less sensitive to financial distress, although many are quite levered and
perform poorly. Therefore, in the rest of the study, unless otherwise specified, I refer
to firms with ICR<=1 as “vulnerable firms” and I use the terms “firms with ICR<=1” and
“vulnerable firms” interchangeably. However, in the rest of the paper, I further de-
compose the group of vulnerable firms and show results for the following three
groups of firms: Zombie firms, almost zombie firms and other firms with ICR<=1.
Next, to better understand the importance of vulnerable firms for financial stability, I
look at how these firms are distributed by firm size. I focus on firm size for several rea-
sons. To begin with, in the descriptive statistics above, I show that vulnerable firms
tend to be on average larger (and older) than the representative firm in the sample.
Then, in Cella (2020b) I document that Swedish firms’ leverage increases with size,
which means that larger firms use more leverage, consistent with the fact that large
firms may be less financially constrained.10 Moreover, during the worse months of the
pandemic, credit conditions seemed favourable for large firms,11 so it is likely that
many large firms may eventually emerge from this crisis with more leverage than they
had before the pandemic started.
Finally, the default (or distress) of even a few very large firms could affect banks’ lend-
ing to them. Importantly, in untabulated results, I find that, in contrast with smaller
firms, large and medium-sized firms, on average, not only borrow larger amounts but
also have relationships with more than one bank. This suggests that potential distress
among large firms may even affect several banks at once and, therefore, it is im-
portant to understand where vulnerabilities are nested. I present relevant results for
this discussion in Figure 1.
10 Angelini and Generale (2008), using a survey of Italian firms, show that firms that say they are con-strained are on average smaller than those that do not. The authors also show that young firms also tend to be more constrained. Similar evidence is also found by Cabral and Mata (2003). 11 The Riksbank’s Business Survey September 2020 (Sveriges Riksbank, October 2020) reported that the ma-
jor Swedish firms had not experienced difficulties to obtain funding since the spring. These firms reported good access to liquidity and perceived that funding terms were favourable. Also see Frohm et al. (2020).
Vulnerable firms before the pandemic struck
12
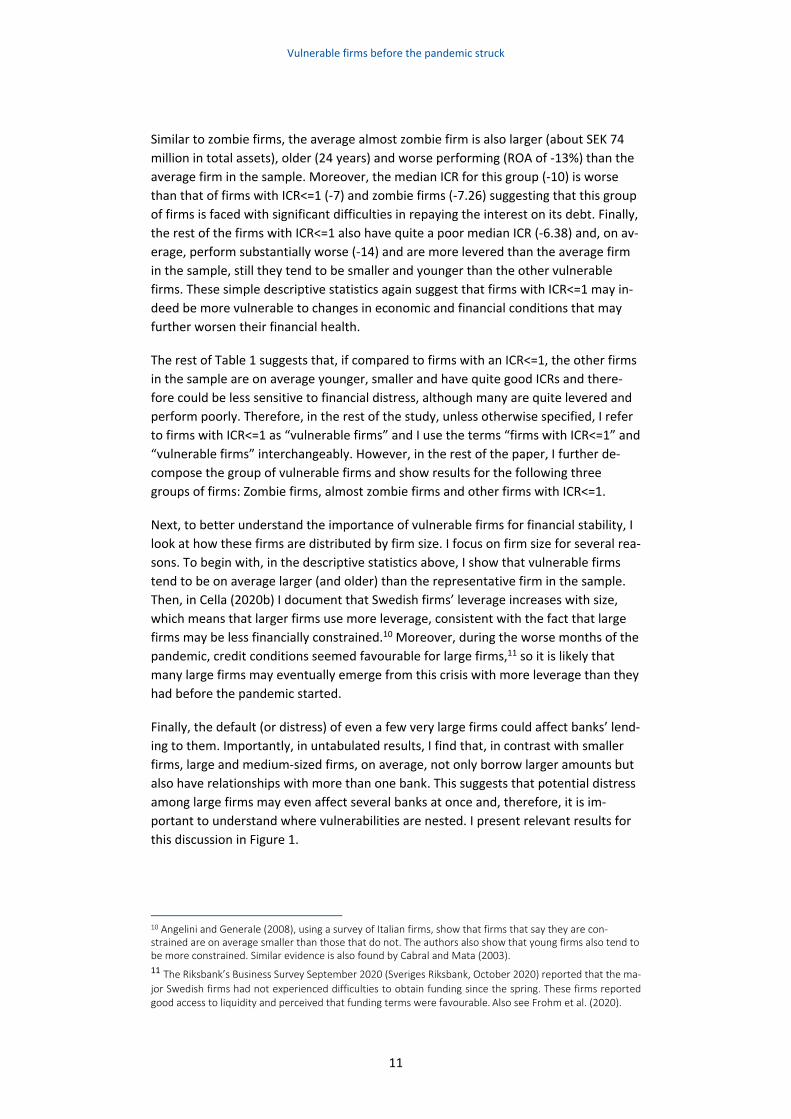
Figure 1. Distribution of vulnerable firms by firm size
Per cent, quartiles of total assets
Note: Figure 1 shows the percentage of firms with ICR<=1 in the sub-sample of firms based on firm size. Micro (Large) firms belong to the bottom (top) quartile of the total asset distribution in their industry. Small (medium) firms are classified in the second (third) quartile of total as-sets distribution. The sub-sets of micro and small firms in the graphs contain a total of about 20,000 firms. The sub-sets of medium and large firms contain around 23,000 and 27,000 firms, respectively. For each group, the total amount of firms with ICR<=1 is reported and further split into 3 groups: Zombie firms (dark blue), almost zombie firms (red), rest of the firms with ICR<=1 (light blue). All variables are described in detail in Section 2.1.1.
Source: Bisnode.
In Figure 1, using firms’ total assets, I group all firms into four size quartiles (micro,
small, medium and large)12 and I show what percentage of the firms in each quartile
are zombie firms, almost zombie firms and other firms with ICR<=1.
Figure 1 shows that the total amount of firms with an ICR<=1 increases with size,
therefore there are significantly more firms with ICR<=1 in the group of large firms
than in the group of micro and small firms, a total of 25% versus circa 17-19%. Inter-
estingly, consistent with what I already documented in Cella (2020a) for the year
2016, Figure 1 confirms that zombie firms are more common among large firms.
Out of the total amount of large firms, about 7% can be classified as zombie firms
(dark blue) and 3% can be classified as almost zombie firms (red). If we instead look at
firms in the medium-sized group, there is a smaller number of firms with ICR<=1 com-
pared with the group of large firms and a substantially smaller number of zombie
firms (4%).
In unreported descriptive statistics, I find that among large vulnerable firms, firms be-
longing to a corporate group (i.e. are either a Swedish parent company or a subsidiary
in a group) represent almost 70% of the total of about 27,000 firms. However, if we
12 The average firm in the group of micro firms has total assets of about SEK 272 thousand. The average small and medium firm have total assets of about SEK 1,016 and SEK 3,385 thousand, respectively, while the average firm in the group of large firms reports about SEK 165 million in total assets.
13% 13% 14% 16%
1% 2%2%
3%
2% 2%
4%
7%
0%
5%
10%
15%
20%
25%
30%
Micro Small Medium Large
Zombie Firms
Almost Zombie Firms
Other firms with ICR<=1
Vulnerable firms before the pandemic struck
13
look at the medium-sized firms, almost 62% of this subset comprises stand-alone
firms that have no connection to a corporate group. I also find that despite having the
largest number of zombie and almost zombie firms, the subset of medium and large
firms with ICR<=1 in 2019 had, on average, the same amount of leverage as small
firms (approximately 60%) and less than micro firms (which have an average of 66%).
Most importantly, their ICR is substantially better. These latter results suggest that
more work should be done to understand why, in Sweden at least, large firms classi-
fied as vulnerable often belong to corporate groups. While this type of investigation is
outside the scope of this specific project, the results just described suggest that be-
cause of characteristics that are not considered in the definition of firms’ vulnerabili-
ties, firms may be misclassified as financially vulnerable firm, and vice-versa. There-
fore, caution should be employed when interpreting the results.
In addition to the analyses presented above, I also combine firm size with market
power (calculated as shares of total industry sales at the 5-digit SNI07 code level).
These statistics suggest that large zombie firms (almost zombie firms) represent about
2.6% (1.4%) of firms with the largest shares of sales, on average. Hence, zombie firms,
because of their size and market power, could represent a real entry barrier for other
(more innovative) firms and crowd-out resources that could have been allocated to
more productive and innovative firms. These potential distortions are particularly rel-
evant given the large amount of government support that many industries have re-
ceived during the crisis. See Appendix C for a discussion about zombie firms’ (poten-
tial) access to government support and its consequences.
To conclude, the results in Section 2 show how vulnerabilities have been identified us-
ing firm’s accounting data and describe the characteristics, in 2019, of the firms in
each sub-sample. Building on these results, in the next section, I study how firms ex-
isting vulnerabilities might have been exacerbated by the economic crisis triggered by
the restrictions introduced to reduce the spread of the COVID-19 virus.
Vulnerable firms after the pandemic
14
3 Vulnerable firms after the pandemic
3.1 Simulation exercise: How the economic consequences of the COVID-19 pandemic may have exacerbated firms’ financial vulnerabilities in 2020-2021
3.1.1 Data and methodology
Building on the analysis discussed in Section 2, this section will address the question
of how the COVID-19 pandemic may have worsen firms’ financial vulnerabilities. To
study this question and since official accounting data for the year 2020 are not yet
available, I use the analysis in 2019 as a starting point and follow a simulation meth-
odology similar in spirit to the one employed by Banerjee, Illes, Kharroubi, and Gar-
ralda (2020).
Banerjee et al. study how the economic crisis caused by the pandemic might have af-
fected firms’ cash buffer and their ability to service their debt obligations. To do so,
they assume that all firms in their data have experienced a 25% drop in their 2020
revenues relative to 2019. Moreover, they adjust the firms’ costs using a cost-revenue
elasticity of 0.6. Using these assumptions, they project how much firms should have
borrowed to meet operating losses. Inspired by this exercise, I try to understand how
Swedish non-financial limited liability firms may have been affected by the crisis using
a simulation exercise based on survey data collected by KI.
In this study, to understand a firm’s ability to meet the interest payments on its debt, I
use the firm ICR which employs the firm EBIT in the numerator. Therefore, in my sim-
ulation I shock directly each firm’s EBIT in 2019 to obtain the simulated EBIT in June
2021. This exercise implies that both the revenues and the operating costs of the firm
are affected in the same way by the shock and it also assumes that, besides revenues
and operating costs changing, everything else stays the same as reported by the firm
in 2019.
In my simulation, I begin by summarizing the answers collected by KI over the period
11-13 May 2020 to 7-9 June 2021.13 From the KI survey it appears that over the period
May-December 2020, most of the respondent firms experienced a large drop in their
revenues. As expected, this drop was particularly felt in the hotel and restaurant in-
dustry where the respondents reported a drop in revenues of between approximately
-40% and -70%. Importantly, it also appears from the survey that firms within the
same industry were not affected in the same way. In the wholesale and retail indus-
try, for example, some firms have reported a drop in revenues of about -20%, while
13 Even though KI reports the results of the survey up to 9-11 August 2021, for my simulation I use data up to the 7-9 June 2021for consistency with the KRITA data that, at the time I started this memo, where availa-ble up to June 2021. . However, including the available responses up to August does not really change any of the simulation results.
Vulnerable firms after the pandemic
15
firms in the sub-industry category of grocery stores have reported almost a 10% in-
crease in revenues.
Importantly, the results of the survey clearly show that most of the industries have re-
covered some ground in the first five months of 2021. Yet, the recovery has been
quite heterogeneous. For example, while the hotel and restaurant industry has recov-
ered substantially (an average of 5 percentage points), it still has a long way to go be-
fore it is back to more “normal” levels, according to the interviewed firms. However,
firms surveyed in industries such as transportation equipment, vehicles and machin-
ery production report that they have almost fully recovered their losses.
The statistics reported above reinforce the idea that utilizing industry (and within in-
dustry) variation is much superior to assuming that all firms were affected equally by
the crisis. Then, using the fine industry definition employed by KI, I adjust the EBIT of
each firm in each of the 46 industries surveyed as illustrated in equation 1.14
(1) 𝐸𝐵𝐼𝑇𝑠𝑖𝑚𝑢𝑙𝑎𝑡𝑒𝑑 = 𝐸𝐵𝐼𝑇2019 ∙ (1 + 𝑎𝑣𝑟𝑎𝑔𝑒 𝑖𝑛𝑑𝑢𝑠𝑡𝑟𝑦 𝑟𝑒𝑝𝑙𝑦𝑀𝑎𝑦20−𝐽𝑢𝑛𝑒21)
A firm’s EBIT is calculated as operating revenues minus operating costs. Operating
costs are the sum of labour costs, depreciation and amortization expenses and other
operating expenses (for example, marketing expenses, rent and utilities, etc.).There-
fore, by adjusting a firm’s EBIT, I am assuming that both operating revenues and oper-
ating costs will be adjusted by the same amount. In other words, that operating costs
decrease (increase) one to one with the fall (rise) in operating revenues. While this as-
sumption may seem extreme given that one could reasonably expect the operating
revenues - operating costs sensitivity to vary considerably across industries and most
likely not to be one, I estimate this relationship in each of the 46 industries in the KI
survey and find that assuming an operating revenue-operating costs sensitivity of 1 is
not so unreasonable.
For each of the 46 industries interviewed by KI, using data for the period 1998-2019, I
estimate the relationship between operating costs and operating revenues. This anal-
ysis shows that the revenues-cost sensitivity varies substantially among industries but
in 34 out of 46 industries, the operating costs to operating revenues sensitivity is
above 90%. Over the period 1998-2019, the average sensitivity is around 90% (70% in
the industry with the minimum sensitivity (Real Estate Activities (SNI codes 68310-
68320)) and 98% in the industry with the largest sensitivity (Retail (SNI codes 45110-
45400 and 47111-47999)).15
Given the discussion above and to keep things simple, I do not directly adjust each
firm’s operating costs using its specific industry sensitivity but simply adjust both the
operating revenues and operating costs by the same amount. While using the esti-
mated revenue-cost sensitivity would make the analysis richer, since for most of the
industries the assumption that the sensitivity is not too different from the estimated
14 I simulate the EBIT of firms in industries with missing SNI07 codes using the overall sample average re-ported in the survey. 15 The panel regressions include firm- and year-fixed effects and robust standard errors clustered at the firm level. Results are unreported for the sake of brevity but are available from the author upon request.
Vulnerable firms after the pandemic
16
coefficient results should not be affected too much. Nevertheless, I acknowledge that
assuming that firms can adjust their operating costs in full overestimates the ability of
these firms to scale down when a shock hits. Therefore, even if the fall in revenues
captured by the KI’s survey may be very close to the one actually experienced by the
firms during the pandemic, the firms’ real EBIT is still likely to be smaller than the one
estimated by my simulations since firms may not have been able to fully adjust the
costs of their operations.
Another important issue is that many firms have benefited of the support of the gov-
ernment during the months of the pandemic and therefore, at least for these firms,
depending on the type of support that they have received, the simulated results may
be very far from what the firms may have actually experienced. Unfortunately, I can-
not identify which firms have received which form of government support and there-
fore I cannot really assess the impact of this support on the firms in the sample.
However, my simulation assumes that the firms in the sample have not received any
support and therefore all firms were forced to adjust operating costs as revenues fell.
Therefore, my exercise could be interpreted as a potential “counterfactual exercise”
for those firms that have received support and did not need to cut their costs to sur-
vive. While I cannot enrich the analysis employing firm level data on government sup-
port, in Appendix C, I try to discuss the possibility that even vulnerable firms may have
had access to government support and what the consequences of this may be.
3.1.2 Main results
3.1.2.1 How were the firms reallocated by the simulation?
Using the methodology in Section 3.1.1, I simulate what each firm’s ICR and ROA may
have looked like in June 2021 using 2019 data as a starting point. Using the results of
this simulation, I then re-organize all firms in sub-samples based on the vulnerabilities
identified by using the newly calculated variables as described in Section 3.1.1.
Following the discussion in Section 2.1.2, I focus mostly on firms with ICR<=1 and fur-
ther decompose this group in zombie firms*, almost zombie firms* and other firms
with ICR<=1*. Figure 2 below shows how firms in the sample in 2019 were re-classi-
fied in 2020 using the data simulated as described above. Descriptive statistics can be
found in Table 1.B in Appendix B while Figure 1.A in Appendix A shows the percentage
number of simulated zombie firms.
Vulnerable firms after the pandemic
17
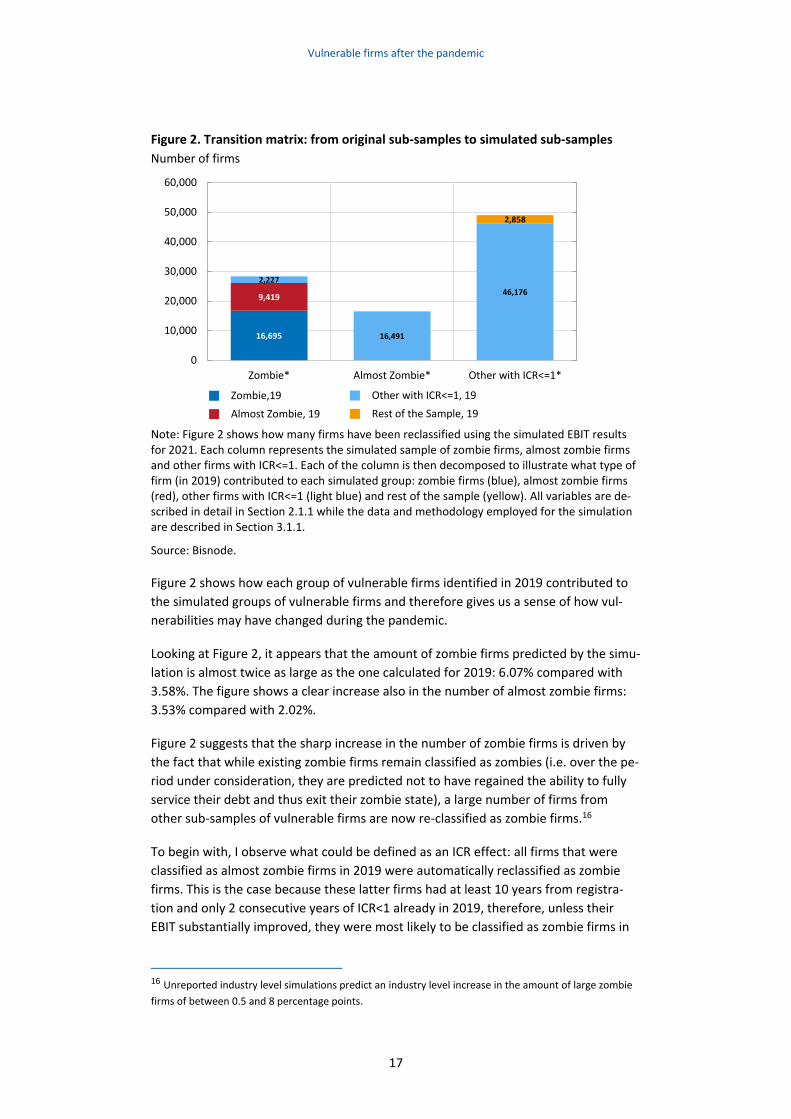
Figure 2. Transition matrix: from original sub-samples to simulated sub-samples
Number of firms
Note: Figure 2 shows how many firms have been reclassified using the simulated EBIT results for 2021. Each column represents the simulated sample of zombie firms, almost zombie firms and other firms with ICR<=1. Each of the column is then decomposed to illustrate what type of firm (in 2019) contributed to each simulated group: zombie firms (blue), almost zombie firms (red), other firms with ICR<=1 (light blue) and rest of the sample (yellow). All variables are de-scribed in detail in Section 2.1.1 while the data and methodology employed for the simulation are described in Section 3.1.1.
Source: Bisnode.
Figure 2 shows how each group of vulnerable firms identified in 2019 contributed to
the simulated groups of vulnerable firms and therefore gives us a sense of how vul-
nerabilities may have changed during the pandemic.
Looking at Figure 2, it appears that the amount of zombie firms predicted by the simu-
lation is almost twice as large as the one calculated for 2019: 6.07% compared with
3.58%. The figure shows a clear increase also in the number of almost zombie firms:
3.53% compared with 2.02%.
Figure 2 suggests that the sharp increase in the number of zombie firms is driven by
the fact that while existing zombie firms remain classified as zombies (i.e. over the pe-
riod under consideration, they are predicted not to have regained the ability to fully
service their debt and thus exit their zombie state), a large number of firms from
other sub-samples of vulnerable firms are now re-classified as zombie firms.16
To begin with, I observe what could be defined as an ICR effect: all firms that were
classified as almost zombie firms in 2019 were automatically reclassified as zombie
firms. This is the case because these latter firms had at least 10 years from registra-
tion and only 2 consecutive years of ICR<1 already in 2019, therefore, unless their
EBIT substantially improved, they were most likely to be classified as zombie firms in
16 Unreported industry level simulations predict an industry level increase in the amount of large zombie
firms of between 0.5 and 8 percentage points.
16,695
9,419
2,227
16,491
46,176
2,858
0
10,000
20,000
30,000
40,000
50,000
60,000
Zombie* Almost Zombie* Other with ICR<=1*
Zombie,19
Almost Zombie, 19
Other with ICR<=1, 19
Rest of the Sample, 19
Vulnerable firms after the pandemic
18
2020/2021. This is exactly what my simulation predicts: all almost zombie firms identi-
fied in 2019 are not expected to have improved their ICR at all or significantly enough
to be out of the zombie zone and therefore they were all mechanically reallocated
into the sub-sample of zombie firms.
The group of other firms with ICR<=1 also makes a large contribution to the simulated
group of zombie firms. This contribution is driven by an aging effect. In fact, the set of
about 2,000 firms that joins the sub-sample of zombie firms had already had an ICR<1
for at least 2 consecutive years in 2019 but they were younger than 10 years and thus
where not yet classified as almost zombie firms. Importantly, this sub-sample of firms
had a quiet poor median ICR (-8.5) in 2019 and therefore, even though they are classi-
fied as zombie firms just because of their aging, they rightly belong to the group of
potentially vulnerable firms.
Next, while all firms originally identified as almost zombie firms move to the simu-
lated group of zombie firms, a large set of firms move from the original group of firms
with ICR<=1 to the simulated group of almost zombie firms. This result is driven by the
fact that while these firms had only 1 year of ICR<1 in 2019, they are now expected to
have 2 consecutive years of ICR<1 and therefore are at risk of being classified as zom-
bie firms in the near future. Importantly, though, these firms (a total 16,491) already
showed a very poor median ICR (-8) in 2019 and unless their ICR improves substan-
tially in the coming years, these firms are quite vulnerable from a financial stability
perspective.
Interestingly, my simulation shows that of all the firms that were not classified as vul-
nerable (i.e. firms with an ICR>1), only a small group is re-classified as such and enters
the simulated group of other firms with ICR<=1. These firms (a total of 2,858) are
mostly large firms that, on average, in 2019, were about 9 years old. Yet, around
1,600 of these firms had high leverage and poor performance in 2019 and, after simu-
lation, their median (and mean) ICR becomes a little less than 1. Therefore, although
they may still perform poorly, as the economic recovery continues, these firms may
be able to easily move out of a potentially vulnerable state.
Finally, even though the sub-set of other firms with an ICR<=1 is quite substantial, I
would like to point out that the simulated sample is less financially vulnerable than
the group identified using 2019 data. This is the case not only because it contains a
smaller number of firms but also because the simulation reallocates the most vulnera-
ble firms within this group to either the group of zombie firms or almost zombie firms
and thus, on average, the firms in this group appear to be financially healthier than in
the past. This can be seen clearly when comparing the descriptive statistics for the
simulated sub-samples reported Table 1.B in Appendix B with those for sub-samples
based on 2019 data in Table 1 in Section2.
Next, to fully understand how exposed firms may have been to bankruptcy during the
pandemic, I study how well capitalized firms in different size categories were in 2019
and how their capitalization could have been affected by the economic effects of the
social restrictions. Results are reported in the next sub-section.
Vulnerable firms after the pandemic
19
3.1.2.2 How much equity was held by simulated vulnerable firms before the pandemic hit?
In this section, inspired by the work of Carletti et al. (2020),17 I try to understand how
well capitalized firms were in the different sub-sets based on simulated vulnerabilities
when the pandemic struck. I then discuss how the large losses that they may have
faced during the period March 2020-June 2021 could have made them undercapital-
ized or even distressed. For this analysis, in Figure 3, I present a box plot of the firms’
equity ratios calculated as the book value of equity divided by the book value of total
assets. Results are show for sub-sets of firms classified by type of vulnerabilities and
size.
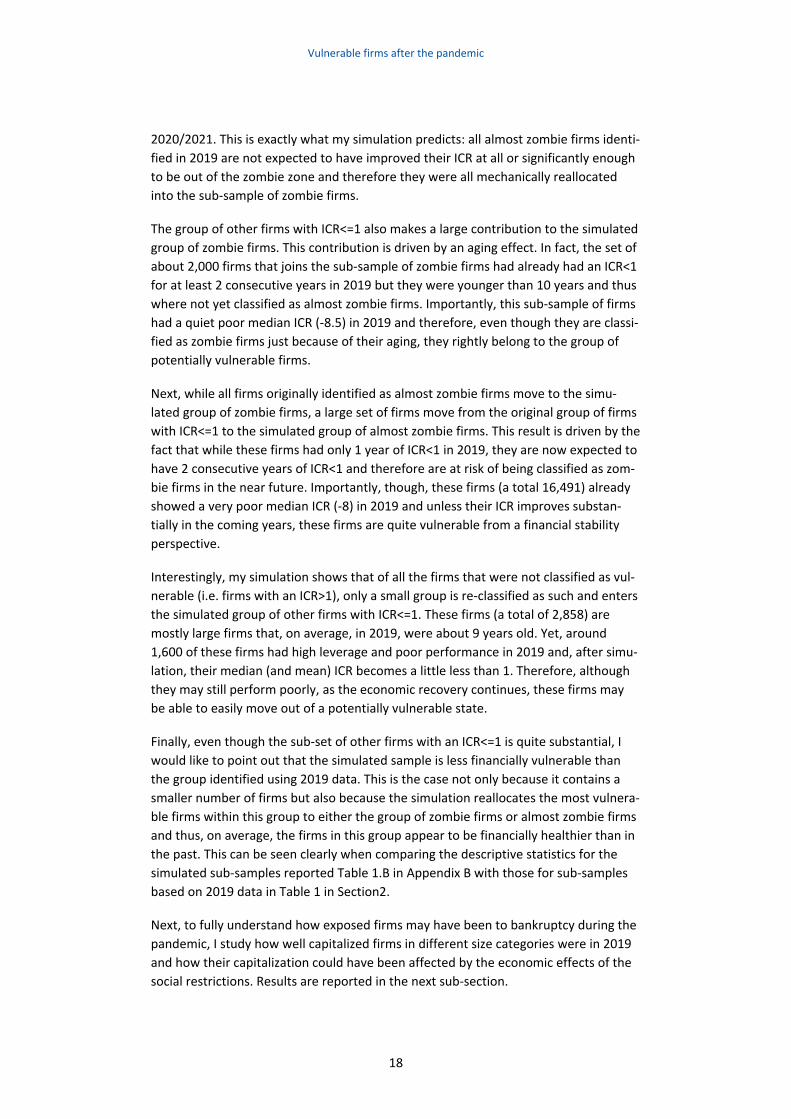
Figure 3. Firms’ capitalization in 2019
Simulated firms sorted by size in 2019
Panel A. Micro and small firms Panel B. Medium and large firms
Note: Figure 3 shows a box plot of firms’ equity ratios in 2019 by sub-samples based on simu-lated data: zombie firms*, almost zombie firms*, other firms with ICR<=1* and rest of the sam-ple*. Firms are further categorized in quartiles of size (total assets). The graph on the left shows results for micro and small firms, while the graph of the right show results for medium and large firms. The box plot displays the distribution of data. From the bottom to the top, for each sub-set, the graph shows: the minimum, the first quartile (Q1), the median, the third quartile (Q3), and the maximum of the distribution. Firms that have filed for bankruptcy in 2019 and 2020 are excluded. Firms with an equity ratio smaller than the 1st and 99th decile of the distribution (-0.45 and 0.99) are excluded so that results are not driven by outliers. All vari-ables are described in detail in Section 2.1.1 while the data and methodology employed for the simulation are described in Section 3.1.1.
Source: Bisnode.
To create Figure 3, I start by sorting all firms into quartiles of total assets using data
from 2019 (the last available observation). The figure then presents two panels. Fig-
ure 3 Panel A shows results for the firms in the first and second quartile of the distri-
bution of total assets (micro and small firms). Figure 3 Panel B shows results for the
firms in the third and fourth quartile of the distribution of total assets (medium and
17 The work by Carletti et al. (2020) is on equity shortfall of Italian firms as a consequence of the protracted lock-down.
-1-.
50
.51
Equ
ity/T
ota
l A
sse
ts,
201
9
Zombies* Almost Zombies* Others with ICR<=1* Rest of the Sample*
Micro and Small Firms
0.2
.4.6
.81
Equ
ity/T
ota
l A
sse
ts,
201
9
Zombies* Almost Zombies* Others with ICR<=1* Rest of the Sample*
Medium and Large Firms
Vulnerable firms after the pandemic
20
large firms). Each panel shows results for a total of about 200,000 firms further di-
vided in sub-samples based on simulated vulnerabilities: zombie firms*, almost zom-
bie firms*, other firms with ICR<=1* and, for comparability, rest of the sample*.
Figure 3 Panel A shows the box plot graph for small and micro firms in the sample. In
2019, these firms had on average (median) a capital ratio (equity over total assets)
around 48% (51%), however, if we look at the different sub-sample based on simu-
lated vulnerabilities, there is large variation. In particular, the sub-samples of simu-
lated zombie firms and other firms with an ICR<=1 show a mean (median) equity ratio
substantially poorer than that shown by simulated almost zombie firms. On the other
hand, firms in the rest of the sample appear to be better capitalized than the rest of
the small and micro firms.
Next, Figure 3 Panel B shows results for the medium and large firms in the sample.
Although, it is hard to see it directly from the graph itself because of scaling issues,
these firms entered the pandemic slightly worse capitalized than the small and micro
firms. The average (median) medium/large firm had an equity ratio of about 40%
(35%) in 2019. These results are mostly driven by other firms with ICR<=1 followed by
zombie firms.
Interestingly, if we look at zombie firms and other firms with an ICR<=1, regardless of
size, their equity ratio distribution appears to be skewed toward zero (right-skewed).
These means that, if we plotted a histogram of the equity ratio distribution for these
firms, a larger number of them would be on the right side of the median, in this case
closer to zero. Hence, a large number of firms may have been at risk of distress if they
suffered losses during the pandemic.
Importantly, I also find that a meaningful set of vulnerable firms (especially zombie
firms and other firms with ICR<=1) in the small and micro size category already had an
equity ratio below or equal to zero in 2019. Many of them were in some of the indus-
tries most affected by the crisis.
The negative equity ratio of these firms could be explained by several factors.18 For
example, the firms may have accumulated losses in the past or may have borrowed
excessively to cover these losses. For many of the vulnerable firms, this latter possibil-
ity is consistent with one or more consecutive years of negative EBIT and losses larger
than the interest on their debt (ICR<1). A negative equity ratio could be also explained
by an aggressive pay-out policy that has led to a smaller accumulation of retained
earnings. Whatever the reason behind a negative equity ratio is, these statistics shows
that many micro and small firms already needed to be recapitalized before the pan-
demic.
On the other hand, just a handful of medium and large firms already had an equity ra-
tio below or equal to zero in 2019. However, Figure 3.B in Appendix B shows that a
18 From a legal perspective, firms with negative equity ratio could be forced into liquidation (Bolagsverket 2019). However, exceptions apply so that firms, under strict supervision, may temporarily have negative equity. For details, see Bolagsverket (2020) and Aktiebolagslag (2005:551).
Vulnerable firms after the pandemic
21
substantial amount of firms in both sub-samples based on size had an equity ratio
close to zero in 2019. Since my simulations suggest that most firms in the dataset
have experienced significant losses during the period May 2020-June 2020, especially
in the industries most affected by the restrictions, it is possible that many firms, even
non-weak firms, may have become undercapitalized or even distressed and, until the
recovery is completed, they may still be in jeopardy.
The results above may seem at odds with the fact that bankruptcies and reorganiza-
tion filings have been subdued over the pandemic (FSR 2021:1). Yet, they are not. In
fact, although firms may already have been weak and/or poorly capitalized in 2019,
they did not necessarily have to go bankrupt as long as they had access to liquidity
(for example, they could draw on their credit line, obtain additional bank credit or is-
sue bonds) or could restructure19 their liabilities or raise new equity. These alterna-
tives were also available to most firms during the COVID-19 pandemic, which for al-
most all firms in the economy has caused a severe liquidity crisis.
To survive the crisis, many firms have operated within their existing financial contracts
and, for example, have drawn as much as they could from their existing lines of credit.
Those that were eligible to apply have benefited directly from government support
programs. Other firms could get access to additional debt financing because of inter-
est rates kept low by the Riksbank. And, finally, many firms may have been able to re-
structure by raising new debt to meet their liquidity needs.
Finally, while I calculate the firms’ equity ratio using book value of equity and assets,
market values could deviate from the book values. Therefore, a firm’s net worth could
be zero or negative on a book basis and yet the firm may appear to be viable in terms
of market values (and the opposite is also possible). Then, since the strong govern-
ment response to help firms deal with the shock has boosted market expectations, it
has also provided additional, indirect support to firms.
The options described above together with the quick recovery that started when re-
strictions around the world were lifted may have enabled many firms to survive de-
spite entering the pandemic on a weak footing and quite levered. However, it is im-
portant to keep in mind that while the effect of the crisis for some firms may have
been just temporary, for other firms the effects could be more long term. This means
that we need to keep monitoring firms, and debt accumulation by weak firms in par-
ticular, because bankruptcy risk could still materialize.
Overall, Section 3 shows that, if the average drop in revenues reported by the firms
answering the KI survey resembles reality for most firms in the sample,20 the overall
number of vulnerable firms may have only slightly increased during the pandemic yet
19 In my analysis of firms’ equity ratios, I exclude firms that filed for bankruptcy or restructuring in 2019 and over the period January-October 2020 (the last observation I have). Therefore, none of the firms I observe had filed for bankruptcy or reconstruction up until October 2020. Nevertheless, it is still possible that many of them have recapitalized or renegotiated their contracts with financial stakeholders out of court. An over-view of the possible out-of-court (and in-court) restructuring tools can be found in Harmon (2020). 20 Since some firms could have done much better than the average firm responding to the survey, I am ex-acerbating the losses for those firms. On the other hand, for those firms that have done better than the av-erage firm, losses will be simulated as smaller than what they may have actually experienced.
Vulnerable firms after the pandemic
22
vulnerabilities may become more acute especially within the sub-sample of zombie
firms. Many firms also seem to have already entered the pandemic with quite small
net worth. In particular, I find that the firms simulated as vulnerable, despite their
size, entered the crisis much less capitalized than the “healthier” firms in the sample
(rest of the sample). If these firms have accumulated further losses (and/or borrowed
more to survive) during the pandemic then many of them may face an equity shortfall
and even the risk of distress and will soon need to restructure. This is important from
a financial stability perspective since, depending on banks’ exposure to vulnerable
firms, a sudden increase in the number of bankruptcies could potentially affect the
health of the Swedish banking system. I further study this issue in the next section.
Banks’ exposure to vulnerable firms in June 2021
23
4 Banks’ exposure to vulnerable firms in June 2021 To study banks’ lending to non-financial firms, I match the data from the Serrano da-
tabase with data reported in the Swedish Credit Registry (henceforth, KRITA) using
each firm’s corporate registration number. KRITA is a survey run by Statistic Sweden
on behalf of the Riksbank to collect information on loans to companies and to the
public sector.21 Eighteen monetary financial institutions are surveyed to compile the
data collected in KRITA. The data covers about 95% of all loans to sectors other than
households.
In June 2021, KRITA reported information for a total of about 126,562 firms that
matched with the Serrano database (out of a total of 466,960) and for which data on
the total amount lent is available in the credit registry for the months of February
2020 and June 2021.22 The data covers about 36% of the zombie firms, 41% of almost
zombie firms and 30% of the sub-set of other firms with ICR<=1, all identified in 2019.
These percentages are also similar after the simulation exercise.
Using the sub-sets of firms classified using data for 2019 (i.e. assuming that the eco-
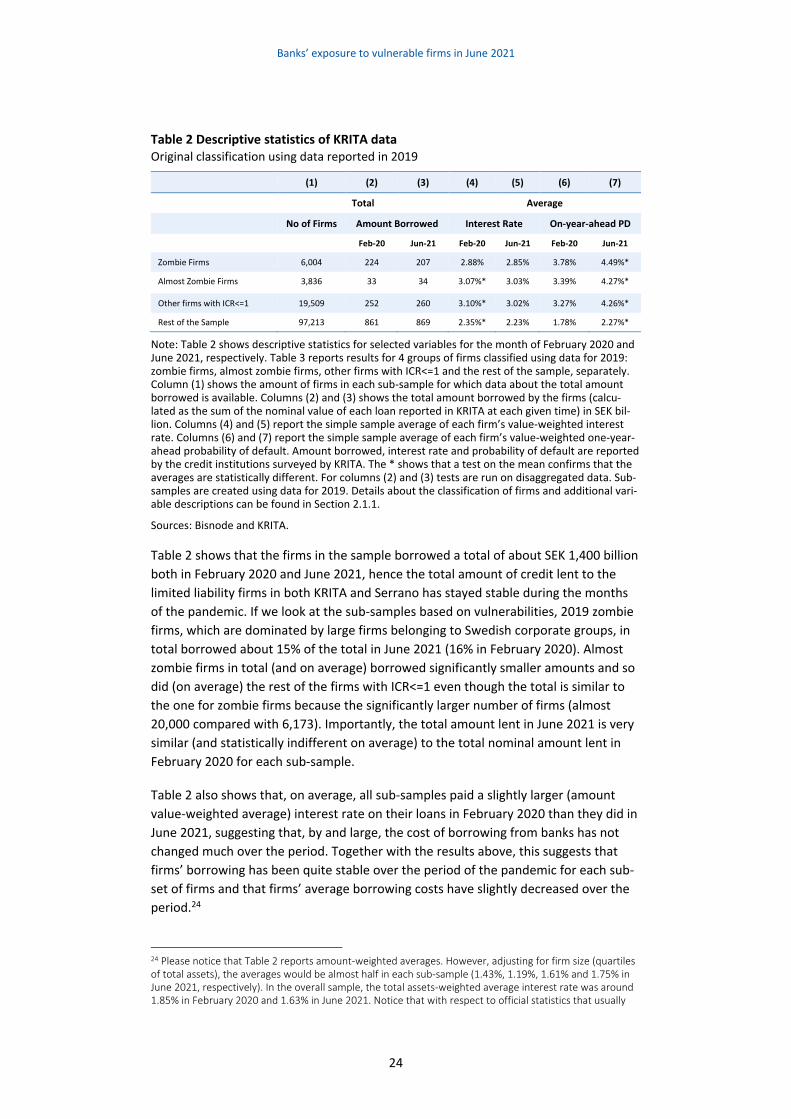
nomic crisis during the pandemic has left vulnerabilities unchanged), in Table 2, I pre-
sent descriptive statistics for the main variables of interest: total amount borrowed,
interest rate and the one-year-ahead probability of default (henceforth PD).23 Results
are shown for the months of February 2020 and June 2021, respectively, and firms are
divided in sub-samples based on vulnerabilities calculated using data in 2019.
21 KRITA is a rather new dataset and work is still ongoing to improve and insure data quality so results using KRITA data must be interpreted with some caution. The results in this paper are based on a data extraction conducted on 14 September 2021. 22 The interest rate paid in June 2021 and February 2020 is available for about 120,000 firms while for about 100,000 firms information about the one-year-ahead probability of default is also available. For about 97,000 firms, data on total amount borrowed, interest paid and one-year-ahead probability of default is all available.
23 The PDs reported to KRITA are the counterparty’s probability of default over one year. They are calcu-
lated internally by the MFI in accordance with the articles 160, 163, 179 and 180 of the Regulation (EU) No
575/2013 (“the CRR”) if the MFI employs the internal ratings-based (IRB) approach for credit risk. If the MFI
does not use the IRB approach, currently, it can choose to voluntary report the PDs. In this case, the PDs are
calculated using an alternative model approved by the Swedish Financial Supervisory Authority (FI).
Banks’ exposure to vulnerable firms in June 2021
24
Table 2 Descriptive statistics of KRITA data Original classification using data reported in 2019
(1) (2) (3) (4) (5) (6) (7)
Total Average
No of Firms Amount Borrowed Interest Rate On-year-ahead PD
Feb-20 Jun-21 Feb-20 Jun-21 Feb-20 Jun-21
Zombie Firms 6,004 224 207 2.88% 2.85% 3.78% 4.49%*
Almost Zombie Firms 3,836 33 34 3.07%* 3.03% 3.39% 4.27%*
Other firms with ICR<=1 19,509 252 260 3.10%* 3.02% 3.27% 4.26%*
Rest of the Sample 97,213 861 869 2.35%* 2.23% 1.78% 2.27%*
Note: Table 2 shows descriptive statistics for selected variables for the month of February 2020 and June 2021, respectively. Table 3 reports results for 4 groups of firms classified using data for 2019: zombie firms, almost zombie firms, other firms with ICR<=1 and the rest of the sample, separately. Column (1) shows the amount of firms in each sub-sample for which data about the total amount borrowed is available. Columns (2) and (3) shows the total amount borrowed by the firms (calcu-lated as the sum of the nominal value of each loan reported in KRITA at each given time) in SEK bil-lion. Columns (4) and (5) report the simple sample average of each firm’s value-weighted interest rate. Columns (6) and (7) report the simple sample average of each firm’s value-weighted one-year-ahead probability of default. Amount borrowed, interest rate and probability of default are reported by the credit institutions surveyed by KRITA. The * shows that a test on the mean confirms that the averages are statistically different. For columns (2) and (3) tests are run on disaggregated data. Sub-samples are created using data for 2019. Details about the classification of firms and additional vari-able descriptions can be found in Section 2.1.1.
Sources: Bisnode and KRITA.
Table 2 shows that the firms in the sample borrowed a total of about SEK 1,400 billion
both in February 2020 and June 2021, hence the total amount of credit lent to the
limited liability firms in both KRITA and Serrano has stayed stable during the months
of the pandemic. If we look at the sub-samples based on vulnerabilities, 2019 zombie
firms, which are dominated by large firms belonging to Swedish corporate groups, in
total borrowed about 15% of the total in June 2021 (16% in February 2020). Almost
zombie firms in total (and on average) borrowed significantly smaller amounts and so
did (on average) the rest of the firms with ICR<=1 even though the total is similar to
the one for zombie firms because the significantly larger number of firms (almost
20,000 compared with 6,173). Importantly, the total amount lent in June 2021 is very
similar (and statistically indifferent on average) to the total nominal amount lent in
February 2020 for each sub-sample.
Table 2 also shows that, on average, all sub-samples paid a slightly larger (amount
value-weighted average) interest rate on their loans in February 2020 than they did in
June 2021, suggesting that, by and large, the cost of borrowing from banks has not
changed much over the period. Together with the results above, this suggests that
firms’ borrowing has been quite stable over the period of the pandemic for each sub-
set of firms and that firms’ average borrowing costs have slightly decreased over the
period.24
24 Please notice that Table 2 reports amount-weighted averages. However, adjusting for firm size (quartiles of total assets), the averages would be almost half in each sub-sample (1.43%, 1.19%, 1.61% and 1.75% in June 2021, respectively). In the overall sample, the total assets-weighted average interest rate was around 1.85% in February 2020 and 1.63% in June 2021. Notice that with respect to official statistics that usually
Banks’ exposure to vulnerable firms in June 2021
25
Concerning the one-year-ahead probability of default, Table 2 shows that all sub-sam-
ples in June 2021 were considered at higher risk of defaulting within a year than they
were in February 2020. Interestingly, Table 2 also shows that, both in February 2020
and June 2021, zombie firms had the highest average one-year-ahead probability of
default, consistent with the fact that these are among the most vulnerable firms.
However, if we look at the change in the average PDs between June 2021 and Febru-
ary 2021, this has increased the most in the sub-samples of other firms with an
ICR<=1, consistent with the idea that the crisis have exacerbated existing vulnerabili-
ties. Table 2.B in Appendix B shows similar results for the sub-samples of firms classi-
fied using simulated data.
Next, in addition to the variables that go into my firms’ classification and simulations, I
also want to take into account the richer set of information that banks use when cal-
culating firms’ one-year-ahead probabilities of default that they report to KRITA. In
particular, to capture how the pandemic may have affected firms’ financial health, I
want to capture what banks believe is the firms’ risk of default within a year in June
2021 compared to what they expected in February 2020. To do so, for each firm in the
dataset for which data is available, I calculate the difference between the amount-
weighted average one-year-ahead probability of default reported in June 2021 and
February 2020 (henceforth PD change) and divide all firms into quartiles based on
these differences.25
The first quartile of the PD change distribution contains all firms for which the average
probability of default in June 2021 is lower than February 2020. These are firms that
are expected to be less at risk of default than before. Instead, the fourth quartile con-
tains all the firms with the largest average increase in the one-year-head probability
of default between February 2020 and June 2021. These are firms that are expected
to be more at risk of default within one year than they were before the pandemic
started.
Importantly, in unreported analyses, I also find that more than 90% of the amount
lent by the credit institutions reporting to KRITA to the firms that match with Serrano
went to large firms both in February 2020 and June 2021. Therefore, I further refine
my focus and base the rest of the analyses on the largest firms in the Serrano data-
base (the fourth quartile of total assets in 2019). For each sub-sample of large firms
and quartile of the PD change, Figure 4 reports the total amount borrowed in June
2021. Results are based on a total of about 43,000 large firms.
employ EU standards (2003/361/EC), the definition of size in this memo is based on quartiles of total assets calculated over the entire universe of firms in the Serrano database at the end of 2019. 25 The majority of the firms in the sample have borrowed very similar amounts in June 2021 and February 2020, so it is unlikely that the difference in the amount borrowed largely affects the difference in the amount-weighted probability of default. However, to address this issue further, I also calculate amount weighted averages only using as weights the amount borrowed in February 2020. Firms’ classification into quartiles stays stable. I also employ different methodologies to check the robustness of my classification and I establish that all firms are classified in the same quartile of PD change regardless of the methodology used. I find that in the quartiles of firms with almost unchanged PDs and slightly less at risk firms (the 2nd and 3th quartiles of the distribution), some firms are assigned to different quartiles depending on the meth-odology I employ. However, in the quartiles of less at risk and more at risk firms, almost all firms are classi-fied in the same quartile regardless of the methodology used to calculate the weighted average probability of default.
Banks’ exposure to vulnerable firms in June 2021
26
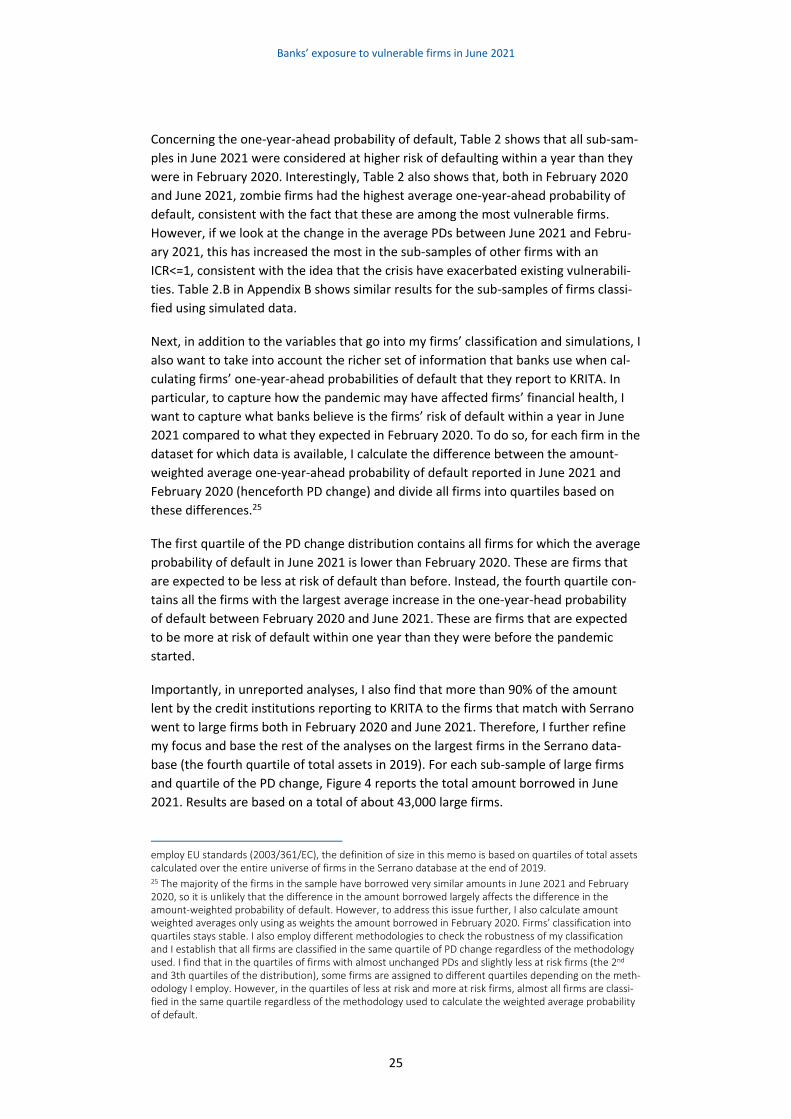
Figure 4. Total amount borrowed by large firms
SEK billion
Note: Figure 4 shows the total amount borrowed by large firms in different sub-samples based on simulated data: zombie firms*, almost zombie firms*, other firms with ICR<=1* and rest of the sample*. Each bar is then further divided into sub-sets based on quartiles of change in the firms’ one-year-ahead probability of default between June 2021 and February 2020: less at risk (dark blue), slightly less at risk (red), almost unchanged risk (light blue) and substantially more at risk (yellow). The graph is based on large firms for which information on the probability of default is available. All variables are described in detail in Section 2.1.1 while the data and methodology employed for the simulation are described in Section 3.1.1.
Sources: Bisnode and KRITA.
To begin with, Figure 4 shows that across all sub-sets of firms, the large majority of
credit went in June 2021 to firms that are expected to be equally or less at risk of dis-
tress within a year than before (the dark blue, red portion and light blue portions of
the bars). This is also the case among zombie firms. These results suggest that, despite
the problems created by the pandemic, most firms, even firms already vulnerable be-
fore the pandemic started, are expected by their lenders to have become less vulnera-
ble to financial distress. This in turn suggests that the recovery is indeed expected to
be strong and that many firms, according to their average lender, may have suffered
only temporarily from the liquidity shock. However, of the total of almost SEK 1,200
billion borrowed by the large firms in the sample, almost SEK 220 billion still went to
firms that were expected to be more at risk of distress within a year than before the
pandemic. Although bankruptcy risk can also materialize in the other sub-samples,
these are the firms that, according to the average bank lending to them, pose the
largest risk of losses. These are therefore the firms I focus on next. Descriptive statis-
tics for these firms are reported in Table 3.
0
100
200
300
400
500
600
700
800
Zombie Firms* Almost ZombieFirms*
Other firms withICR<=1*
Rest of theSample*
Less at risk
Slightely less at risk
Almost unchanged risk
More at risk
Banks’ exposure to vulnerable firms in June 2021
27
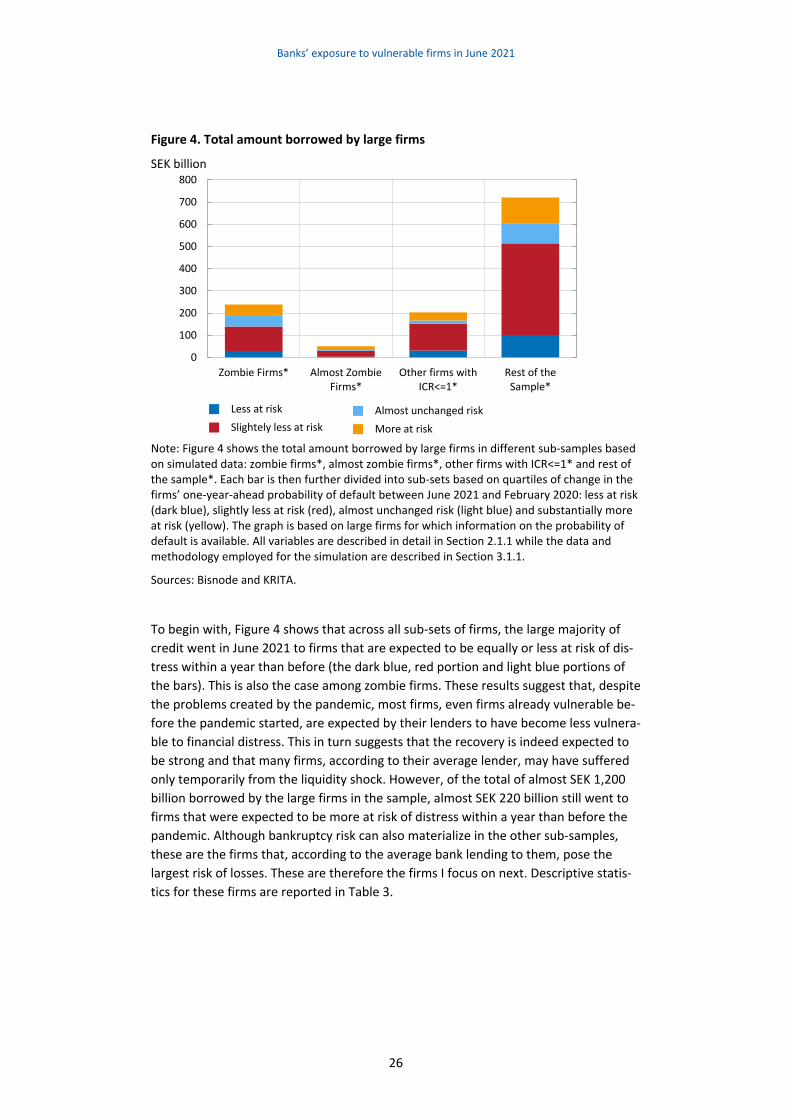
Table 3 Descriptive statistics of KRITA data Simulated data, large firms with the largest (average) increase in PDs
(1) (2) (3) (4) (5) (6) (7) (8) (9)
Total Average Median
No of Firms
Amount Borrowed
Interest Rate
On-year-ahead PD
Total Assets
Equity Ratio
Feb-20 Jun-21 Feb-20 Jun-21 Feb-20 Jun-21
Zombie Firms 1,333 35 48* 2.35% 2.39% 2.35% 8.84%* 264 23%
Almost Zombie Firms 1,040 21 17 2.43% 2.48% 1.35% 5.70%* 245 21%
Other firms with ICR<=1 1,264 34 37 2.40% 2.48%* 1.98% 6.56%* 129 9%
Rest of the Sample 7,514 121 118 2.07% 2.09% 0.95% 5.29%* 120 24%
Note: Table 3 shows descriptive statistics for selected variables for February 2020 and June 2021, respectively. Table 3 reports results for large firms with the largest increase in the reported probabil-ity of default and divided in 4 different sub-sets: zombie firms, almost zombie firms, other firms with ICR<=1 and the rest of the sample, separately. Column (1) shows the number of firms in each sub-sample. Columns (2) and (3) shows the total amount borrowed by the firms (calculated as the sum of the nominal value of each loan reported in KRITA at each given time) in SEK billion. Columns (4) and (5) report the simple sample average of each firm’s value-weighted interest rate. Columns (6) and (7) report the simple sample average of each firm’s value-weighted one-year-ahead probability of default. Column (8) reports the average amount of total assets (in SEK million) and column (9) re-ports the firms’ median equity ratio. The latter variables are calculated using data for 2019. Amount borrowed, interest rate and probability of default are reported by the credit institutions surveyed by KRITA. The * shows that a test on the mean confirms that the averages are statistically different. Sub-samples are created using simulated data. Details about the classification of firms and addi-tional variable descriptions can be found in Section 2.1.1 and Section 3.1.1.
Sources: Bisnode and KRITA.
Table 3 shows that a total of 11,151 firms (out of approximately 43,000 for which in-
formation on PDs is available) in the sample were large and were considered more at
risk in June 2021 than in February 2020. In particular, if we focus on zombie firms (al-
most zombie firms and other firms with ICR<=1), these type of firms represent 13%
(15% and 9%) of the total number of simulated zombie firms (almost zombie firms
and other firms with ICR<=1). Interestingly, 779 firms were already classified as zom-
bie firms in 2019.26
Although limited in number, the zombie firms described above borrowed more than
SEK 48 billion (an average loan size of SEK 36 million per firm) in June 2021. This ac-
counts for little more than 3.5% of the total lent to all firms (circa SEK 1,400 billion)
and 19% of the total amount lent to all simulated zombie firms (circa SEK 250 billion),
even though, on average their (amount-weighted) probability of default has increased
26 Importantly, when interpreting the results above a few caveats apply. While the majority of the firms in
the sample borrow from one bank only, a number of firms have relationships with more than one bank. For
some of the latter firms, sometimes banks report diverging PDs (for instance, one bank would report a
higher PD in June 2021 than in February 2020, while another would report a smaller one). In these cases,
the weighted average gives a larger weight to the banks with which the firm has the biggest commitment
when the averages are calculated. Moreover, most of the MFI reporting PDs in KRITA employ the internal
ratings-based (IRB) approach, however those that do not use this approach can report PDs calculated using
a different model that has been approved by the Swedish FSA. Therefore, if a firm borrows both from a
bank that employs the IRB credit model and from a bank that does not but still reports, then some differ-
ence in the PDs could also arise.
Banks’ exposure to vulnerable firms in June 2021
28
from 2.35% to more than 8% over the period under consideration. Interestingly, in to-
tal, these firms have also borrowed more than they did right before the crisis (SEK 48
compared to SEK 35 billion) but, all in all, their weighted average interest rate has re-
mained (statistically) unchanged. So the increase in the PDs reported by the banks
does not seem to be reflected either in the amount of loans taken by the firms or the
cost of these loans. I also obtain the same result if I focus only on the firms already
classified as zombie firms in 2019. I find similar results for both the firms in the sub-
sample of almost zombie firms.
Table 3 also shows that, despite being more at risk of distress, the median equity ratio
in each sub-sample was around 21% in 2019 with the exception of the subsample of
firms with an ICR<=1 whose median equity ratio was around 9%. These results are
consistent with the patterns shown in Figure 3, Panel B, and suggest that, if compared
with the median firm in the other sub-samples, the median firm in the sub-sample of
other firms with ICR<=1 was already “more at risk” of distress in 2019. This is particu-
larly the case for those firms with an equity ratio below the median. If these firms
have faced losses during the pandemic, then, as reflected also in the PDs, they may
have become more at risk of distress. This is also consistent with the fact that this set
of firms is the only one for which I find (on average) a slightly higher interest rate in
June 2021 compared to February 2020.
To conclude, results in Section 4 show that, in June 2021, a total of around SEK 530
billion was borrowed by simulated vulnerable firms. While this amount is similar to
what these firms borrowed in February 2020, almost SEK 100 billion went to vulnera-
ble firms that the MFIs themselves expect to be more at risk of distress in the coming
year. These same firms already borrowed circa SEK 90 billion in February 2020. Hope-
fully, consistent with good risk management practices, credit institutions have already
correctly provisioned for the potential losses they may incur.
Conclusions
29
5 Conclusions The COVID-19 pandemic has caused one of the worst health and economic crises of all
time. Finally, thanks to vaccination programs, many people have been able to return
to a less restricted life and the economic recovery has started. Yet, because of its pe-
culiar nature, there is still uncertainty about the possible long-term effects of this cri-
sis on firms.
In autumn 2020 (Cella 2020b), I studied the characteristics of the firms that had filed
for bankruptcies and re-organization in the months immediately after the COVID-19
pandemic crisis began. In that study, I found that the crisis may have contributed to
the exit of some firms that, already in 2018, showed quite weak financial ratios and
poor profitability. I also documented that firms that filed for bankruptcy in March-
June 2020 had a higher probability of default (reported in KRITA) than their competi-
tors in different periods preceding the COVID-pandemic and were statistically similar
to firms that had filed for bankruptcy in the fourteen months before the pandemic
started.
In the months after my study time period (March-June 2020), statistics show that
bankruptcies and re-organizations have remained low with respect to the period be-
fore the crisis and many have suggested that, at least in part, this outcome could have
been driven by the government support offered to firms (Sveriges Riksbank FSR
2021:1). Nevertheless, despite the fact that some level of bankruptcy is normal (and
healthy), the question remains of whether bankruptcies may spike up once the econ-
omy returns to more normal levels and government support is withdrawn.
This study tries to contribute to this debate by investigating how the crisis may have
affected firms’ financial health. I start by illustrating how vulnerable Swedish firms
were before the COVID-19 outbreak. Then, since data for 2020 is still not available, I
employ a simulation exercise to illustrate how the economic crisis, brought about by
the restrictions to minimize the spread of the coronavirus, may have exacerbated ex-
isting vulnerabilities.
My exercise suggests that the total number of vulnerable firms in the sample may
have only slightly increased during the pandemic. Yet, it also shows a clear effect of
the crisis: firms may have become more vulnerable in most industries, not only in
those industries that have been, and still are, most affected by the measures taken to
contain the spread of the virus (for example the hotel and restaurant industry).
Using data from the KRITA, I also document that in June 2021, simulated vulnerable
firms borrowed almost 39% of total amount of money lent by the MFIs surveyed in
KRITA to the limited liability firms in the sample (circa SEK 1,400 billion). A total of
around SEK 250 billion was lent to firms classified as zombie firms by the simulation.
Finally, vulnerable firms for which the reporting MFIs attached a higher probability of
default in June 2021 than in February 2020 received almost SEK 100 billion in credit.

Conclusions
30
These results corroborate my previous findings that vulnerable firms represent an im-
portant part of the lending portfolios of banks and therefore monitoring their evolu-
tion is crucial to insure the stability of the Swedish financial system.
References
31
References Altman, Edward I., Edith Hotchkiss and Wei Wang (2019), Corporate financial distress, restructuring, and bankruptcy: analyze leveraged finance, distressed debt, and bank-ruptcy. John Wiley & Sons.
Angelini, Paolo, and Andrea Generale (2008), On the Evolution of Firm Size Distribu-tions. American Economic Review 98 (1): 426–38.
Banerjee, Ryan, Anamaria Illes, Enisse Kharroubi, and José María Serena Garralda (2020), Covid-19 and corporate sector liquidity. BIS Bulletin no. 10. Bank for Interna-tional Settlements.
Bolagsverket (2019), Compulsory liquidation of limited liability companies/Tvångslik-vidation av aktiebolag – Bolagsverket. https://bolagsverket.se/ff/foretagsformer/ak-tiebolag/avveckla/likvidation/tvangslikvidation-1.8190
Bolagsverket (2020), Balance sheet in case of suspicion that half of the registered share capital has been used up/ Kontrollbalansräkning vid misstanke om att hälften av det registrerade aktiekapitalet är förbrukat. https://bolagsverket.se/ff/foretags-former/aktiebolag/driva/kontrollbalansrakning-vid-misstanke-om-att-halften-av-det-registrerade-aktiekapitalet-ar-forbrukat-1.20953
Brunnermeier, Markus, and Arvind Krishnamurthy (2020), Corporate debt overhang and credit policy. Brookings Papers on Economic Activity 2020 (2): 447-502.
Cabral, Luis M. B., and Jose Mata. 2003. “On the Evolution of the Firm Size Distribu-tion: Facts and Theory.” American Economic Review 93 (4): 1075–90.
Carletti, Elena, Tommaso Oliviero, Marco Pagano, Loriana Pelizzon, and Marti G. Subrahmanyam (2020), The COVID-19 shock and equity shortfall: Firm-level evidence from Italy. The Review of Corporate Finance Studies 9 (3): 534-568.
Cella, Cristina (2020a), Zombie firms in Sweden: implications for the real economy and financial stability, Staff Memo, September 2020. Sveriges Riksbank.
Cella, Cristina (2020b), Bankruptcy at the time of COVID-19: the Swedish Experience, Staff Memo, November 2020. Sveriges Riksbank.
Cella, Cristina (2021a), Banking and climate-related risks, implications for financial sta-bility in Sweden, Staff Memo, May 2021. Sveriges Riksbank.
Eurepean Central Bank (2020), Public loan guarantees and bank lending in the COVID-19 period. ECB Economic Bulletin, Issue 6, 2020. https://www.ecb.eu-ropa.eu/pub/economic-bulletin/focus/2020/html/ecb.eb-box202006_07~5a3b3d1f8f.en.html Accessed September 2020.
European Systemic Risk Board (2020), Policy measures in response to the COVID-19 pandemic. https://www.esrb.europa.eu/home/search/coronavirus/html/in-dex.en.html Accessed September 2020.
Extra bi-weekly economic tendency survey run by Swedish National Institute of Eco-nomic Research, May 2020-June 2021: https://www.konj.se/statistik-och-data/covid-19-relaterat/extramatningar/2021-05-18-oforandrat-omsattningstapp-i-nar-ingslivet.html.
Frohm, Erik, Johan Grip, Daniel Hansson and Stephan Wollert, Two-tier credit devel-opments during the coronavirus pandemic, Economic Commentary, July 2020.
References
32
Harmon, Mike (2020), A Primer on Restructuring Your Company’s Finances, Harvard Business Review. https://hbr.org/2020/06/a-primer-on-restructuring-your-companys-finances
Helmersson, Tobias, Luca Mingarelli, Benjamin Mosk, Allegra Pietsch, Beatrice Rav-anetti, Tamarah Shakir, and Jonas Wendelborn (2021), Corporate zombification: post-pandemic risks in the euro area. ECB Financial Stability Review, May 2021. https://www.ecb.europa.eu/pub/financial-stabil-ity/fsr/html/ecb.fsr202105~757f727fe4.en.html
International Monetary Fund (2019), Monetary and Capital Markets Department, Global corporate vulnerabilities. In Global Financial Stability Report: lower for longer. October 2019.
McGowan, Müge Adalet, Dan Andrews, and Valentine Millot (2017a), The walking dead?: Zombie firms and productivity performance in OECD countries. OECD Econom-ics Department Working Papers no. 1372. OECD.
McGowan, Müge Adalet, Dan Andrews, and Valentine Millot (2017b), Insolvency re-gimes, Zombie firms and capital reallocation." OECD Economics Department Working Papers no. 1399. OECD.
McGowan, Müge Adalet, Dan Andrews, and Valentine Millot (2018), The walking dead? Zombie firms and productivity performance in OECD countries. Economic Pol-icy 33 (96): 685-736.
Platt, Harlan D. and Marjorie B. Platt (2006), Understanding differences between fi-nancial distress and bankruptcy. Review of Applied Economics 2(2):1-17.
Regulation (EU) No 575/2013 of the European Parliament and of the Council of 26 June 2013 on prudential requirements for credit institutions and investment firms and amending Regulation (EU) No 648/2012 Text with EEA relevance. https://eur-lex.europa.eu/legal-content/en/ALL/?uri=celex%3A32013R0575
Sveriges Riksbank (May 2020), The Riksbank’s measures during the coronavirus pan-demic. In Financial Stability Report 2020:1. May 2020. https://www.riksbank.se/glob-alassets/media/rapporter/fsr/fordjupningar/engelska/2020/200520/the-riksbanks-measures-during-the-coronavirus-pandemic-article-in-the-financial-stability-report-2020_1.pdf
Sveriges Riksbank (May 2021), Financial Stability Report 2021:1. May 2020. https://www.riksbank.se/en-gb/financial-stability/financial-stability-report/2021/fi-nancial-stability-report-20211/
Swedish Companies Act (2005:551)/Aktiebolagslag (2005:551). https://www.riks-dagen.se/sv/dokument-lagar/dokument/svensk-forfattningssamling/aktiebolagslag-2005551_sfs-2005-551
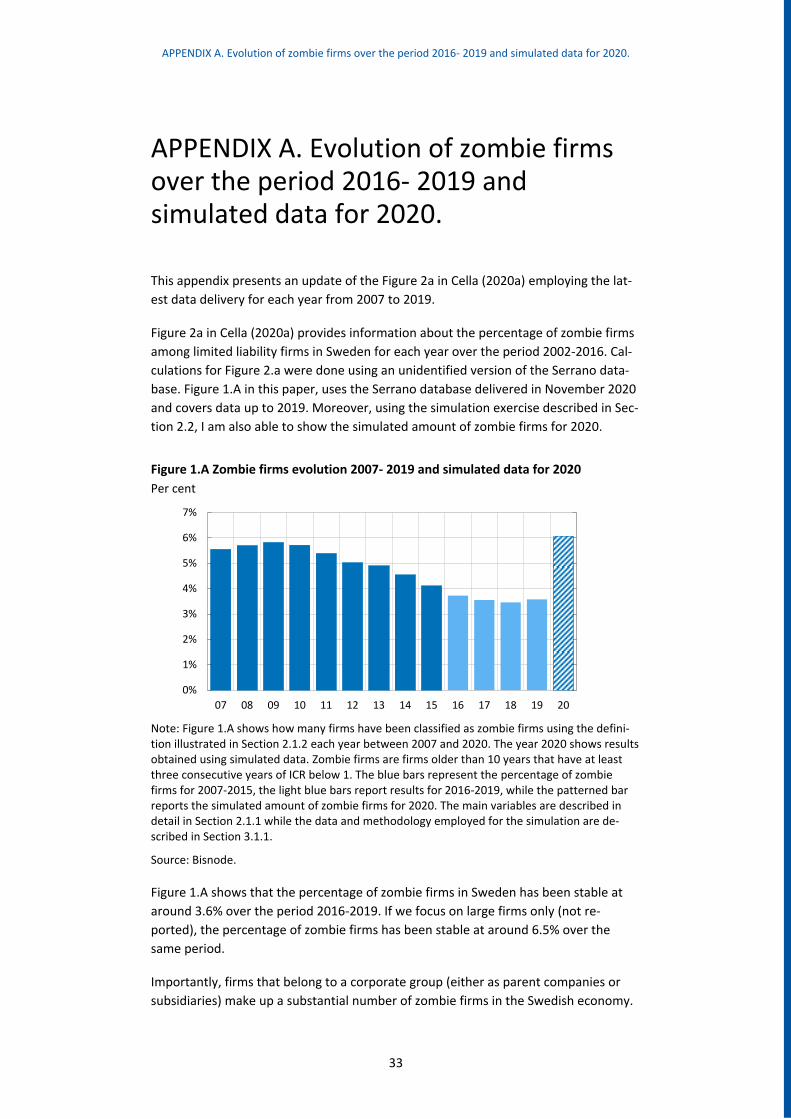
APPENDIX A. Evolution of zombie firms over the period 2016- 2019 and simulated data for 2020.
33
APPENDIX A. Evolution of zombie firms over the period 2016- 2019 and simulated data for 2020.
This appendix presents an update of the Figure 2a in Cella (2020a) employing the lat-
est data delivery for each year from 2007 to 2019.
Figure 2a in Cella (2020a) provides information about the percentage of zombie firms
among limited liability firms in Sweden for each year over the period 2002-2016. Cal-
culations for Figure 2.a were done using an unidentified version of the Serrano data-
base. Figure 1.A in this paper, uses the Serrano database delivered in November 2020
and covers data up to 2019. Moreover, using the simulation exercise described in Sec-
tion 2.2, I am also able to show the simulated amount of zombie firms for 2020.
Figure 1.A Zombie firms evolution 2007- 2019 and simulated data for 2020
Per cent
Note: Figure 1.A shows how many firms have been classified as zombie firms using the defini-tion illustrated in Section 2.1.2 each year between 2007 and 2020. The year 2020 shows results obtained using simulated data. Zombie firms are firms older than 10 years that have at least three consecutive years of ICR below 1. The blue bars represent the percentage of zombie firms for 2007-2015, the light blue bars report results for 2016-2019, while the patterned bar reports the simulated amount of zombie firms for 2020. The main variables are described in detail in Section 2.1.1 while the data and methodology employed for the simulation are de-scribed in Section 3.1.1.
Source: Bisnode.
Figure 1.A shows that the percentage of zombie firms in Sweden has been stable at
around 3.6% over the period 2016-2019. If we focus on large firms only (not re-
ported), the percentage of zombie firms has been stable at around 6.5% over the
same period.
Importantly, firms that belong to a corporate group (either as parent companies or
subsidiaries) make up a substantial number of zombie firms in the Swedish economy.
0%
1%
2%
3%
4%
5%
6%
7%
0%
1%
2%
3%
4%
5%
6%
7%
07 08 09 10 11 12 13 14 15 16 17 18 19 20
% of zombie firms
APPENDIX A. Evolution of zombie firms over the period 2016- 2019 and simulated data for 2020.
34
In 2019, 1.8% of all of the firms classified as zombie firms belonged to a corporate
group, this number reached almost 5% if I focus on large firms alone. For the simu-
lated results, I find that 2.75% of all of the firms in the universe of limited liability
firms are large zombie firms. This percentage goes up to 7.22% if one only focuses on
the sample of large firms.
Importantly, I know whether a firm belongs to a corporate group or not but I have no
access to consolidated data, therefore I may overestimate the amount of zombie
firms (and vulnerable firms) among firms belonging to corporate groups. Yet, even
though I am aware of potential biases (which I discuss in detail in Appendix B), I prefer
to include all firms in the study, even those that belong to corporate groups, since the
goal of this paper is to map as comprehensively as possible potential vulnerabilities
that may be harmful for Sweden’s financial stability. Nevertheless, whenever possible,
I describe results separately for firms belonging to a corporate group.
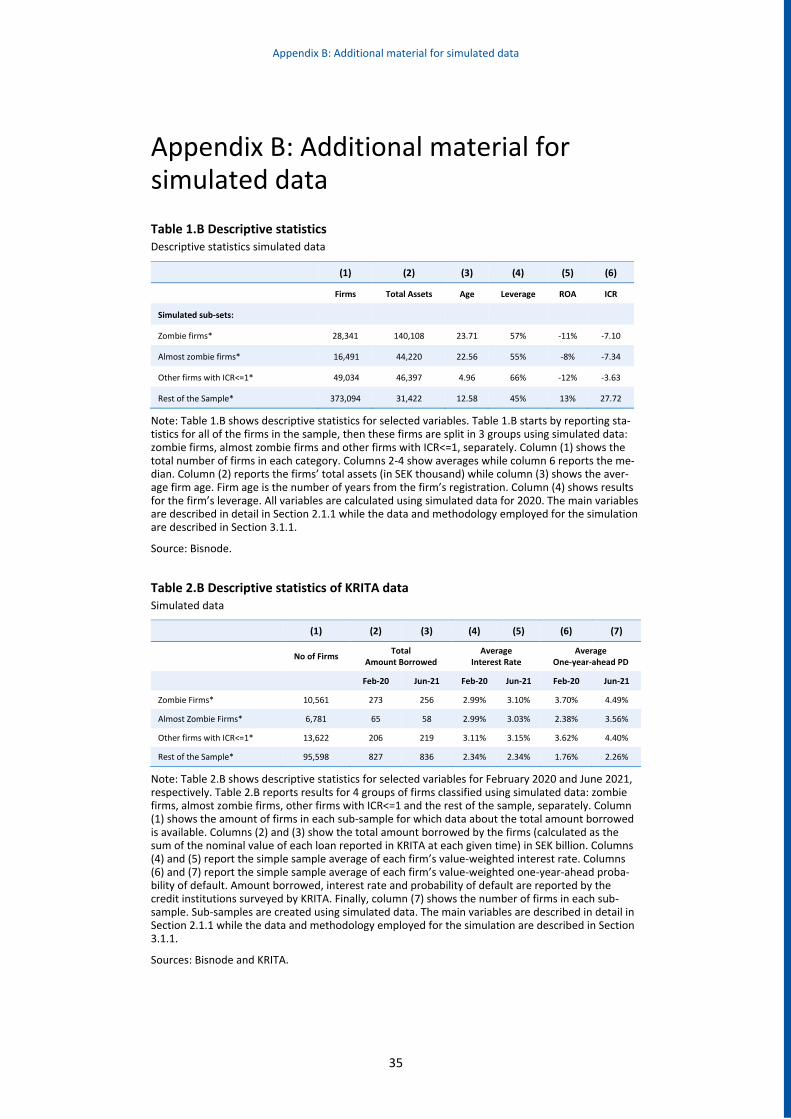
Appendix B: Additional material for simulated data
35
Appendix B: Additional material for simulated data
Table 1.B Descriptive statistics Descriptive statistics simulated data
(1) (2) (3) (4) (5) (6)
Firms Total Assets Age Leverage ROA ICR
Simulated sub-sets:
Zombie firms* 28,341 140,108 23.71 57% -11% -7.10
Almost zombie firms* 16,491 44,220 22.56 55% -8% -7.34
Other firms with ICR<=1* 49,034 46,397 4.96 66% -12% -3.63
Rest of the Sample* 373,094 31,422 12.58 45% 13% 27.72
Note: Table 1.B shows descriptive statistics for selected variables. Table 1.B starts by reporting sta-tistics for all of the firms in the sample, then these firms are split in 3 groups using simulated data: zombie firms, almost zombie firms and other firms with ICR<=1, separately. Column (1) shows the total number of firms in each category. Columns 2-4 show averages while column 6 reports the me-dian. Column (2) reports the firms’ total assets (in SEK thousand) while column (3) shows the aver-age firm age. Firm age is the number of years from the firm’s registration. Column (4) shows results for the firm’s leverage. All variables are calculated using simulated data for 2020. The main variables are described in detail in Section 2.1.1 while the data and methodology employed for the simulation are described in Section 3.1.1.
Source: Bisnode.
Table 2.B Descriptive statistics of KRITA data Simulated data
(1) (2) (3) (4) (5) (6) (7)
No of Firms
Total Amount Borrowed
Average Interest Rate
Average One-year-ahead PD
Feb-20 Jun-21 Feb-20 Jun-21 Feb-20 Jun-21
Zombie Firms* 10,561 273 256 2.99% 3.10% 3.70% 4.49%
Almost Zombie Firms* 6,781 65 58 2.99% 3.03% 2.38% 3.56%
Other firms with ICR<=1* 13,622 206 219 3.11% 3.15% 3.62% 4.40%
Rest of the Sample* 95,598 827 836 2.34% 2.34% 1.76% 2.26%
Note: Table 2.B shows descriptive statistics for selected variables for February 2020 and June 2021, respectively. Table 2.B reports results for 4 groups of firms classified using simulated data: zombie firms, almost zombie firms, other firms with ICR<=1 and the rest of the sample, separately. Column (1) shows the amount of firms in each sub-sample for which data about the total amount borrowed is available. Columns (2) and (3) show the total amount borrowed by the firms (calculated as the sum of the nominal value of each loan reported in KRITA at each given time) in SEK billion. Columns (4) and (5) report the simple sample average of each firm’s value-weighted interest rate. Columns (6) and (7) report the simple sample average of each firm’s value-weighted one-year-ahead proba-bility of default. Amount borrowed, interest rate and probability of default are reported by the credit institutions surveyed by KRITA. Finally, column (7) shows the number of firms in each sub-sample. Sub-samples are created using simulated data. The main variables are described in detail in Section 2.1.1 while the data and methodology employed for the simulation are described in Section 3.1.1.
Sources: Bisnode and KRITA.
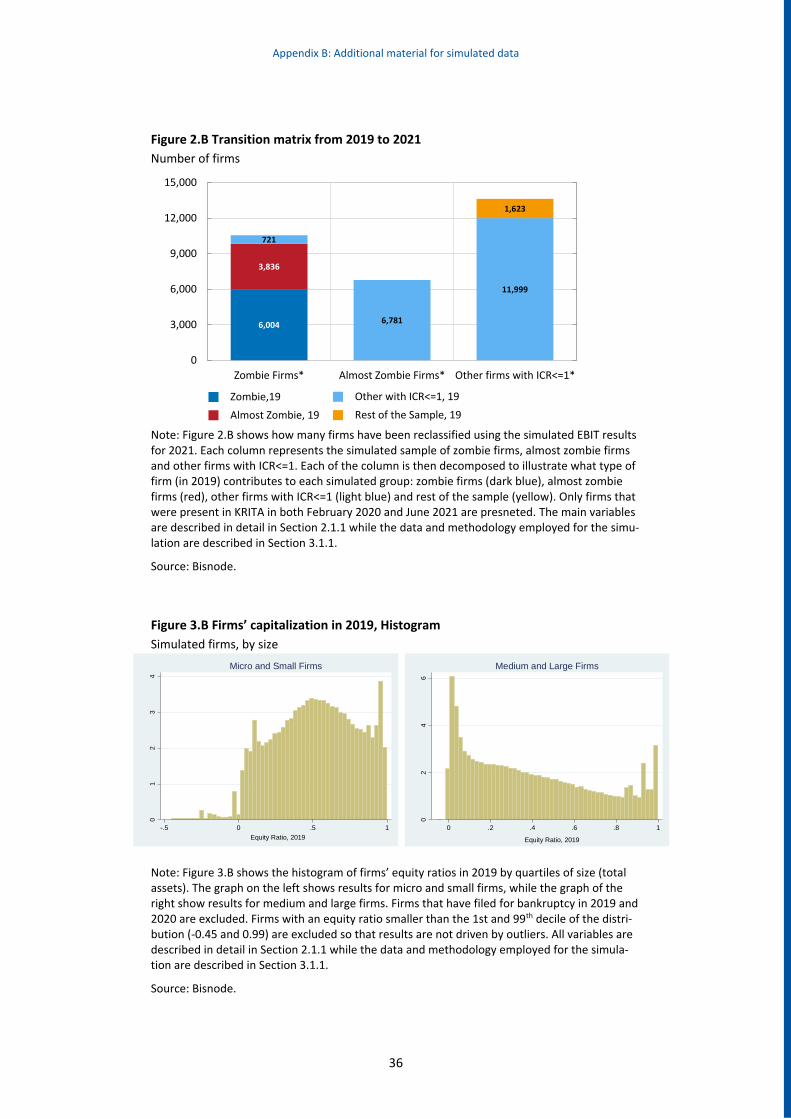
Appendix B: Additional material for simulated data
36
Figure 2.B Transition matrix from 2019 to 2021
Number of firms
Note: Figure 2.B shows how many firms have been reclassified using the simulated EBIT results for 2021. Each column represents the simulated sample of zombie firms, almost zombie firms and other firms with ICR<=1. Each of the column is then decomposed to illustrate what type of firm (in 2019) contributes to each simulated group: zombie firms (dark blue), almost zombie firms (red), other firms with ICR<=1 (light blue) and rest of the sample (yellow). Only firms that were present in KRITA in both February 2020 and June 2021 are presneted. The main variables are described in detail in Section 2.1.1 while the data and methodology employed for the simu-lation are described in Section 3.1.1.
Source: Bisnode.
Figure 3.B Firms’ capitalization in 2019, Histogram
Simulated firms, by size
Note: Figure 3.B shows the histogram of firms’ equity ratios in 2019 by quartiles of size (total assets). The graph on the left shows results for micro and small firms, while the graph of the right show results for medium and large firms. Firms that have filed for bankruptcy in 2019 and 2020 are excluded. Firms with an equity ratio smaller than the 1st and 99th decile of the distri-bution (-0.45 and 0.99) are excluded so that results are not driven by outliers. All variables are described in detail in Section 2.1.1 while the data and methodology employed for the simula-tion are described in Section 3.1.1.
Source: Bisnode.
6,004
3,836
721
6,781
11,999
1,623
0
3,000
6,000
9,000
12,000
15,000
Zombie Firms* Almost Zombie Firms* Other firms with ICR<=1*
Zombie,19
Almost Zombie, 19
Other with ICR<=1, 19
Rest of the Sample, 19
01
23
4
Perc
ent
-.5 0 .5 1
Equity Ratio, 2019
Micro and Small Firms
02
46
Perc
ent
0 .2 .4 .6 .8 1
Equity Ratio, 2019
Medium and Large Firms
Appendix C: Government support and vulnerable firms
37
Appendix C: Government support and vulnerable firms To counter the spread of the coronavirus, governments around the globe started im-
posing lock-downs, social distancing, and travel restrictions in early March 2020. In
Sweden, the Public Health Agency (Folkhälsomyndigheten) recommended people to
stay at home as much as possible: to work from home and avoid public transportation.
Limits on the number of people that could gather at close quarters were also imposed.
These measures had an immediate effect on the movement of people (and goods) and
caused a substantial slowdown in economic activity throughout the country. Moreover,
as a small, open economy, Sweden has also been affected by the demand and supply
shocks that resulted from restrictions imposed around the world.
To counterbalance the effects of the restrictions, the Swedish government, like many
other governments, has employed an array of programs to support non-financial
firms.27 Among those, Sweden (like most Euro area countries) employed public loan
guarantee programmes, tax deferrals and tax relief schemes, but has never adopted a
credit moratoria like the one introduced in Germany, for example.28
These programmes have provided important support to the non-financial sector (Sve-
riges Riksbank, FSR 2021:1). However, the large decrease in the number of bankruptcies
in Sweden, and in many countries around the world, also suggests that these pro-
grammes may have introduced some distortions in the economic system (see Cella
2020b). One worry is that part of the money provided to the non-financial system was
allocated to vulnerable firms, and zombie firms in particular (ECB Financial Stability Re-
port, May 2021).
Most of the programmes run in Sweden required firms to show that they had suffered
temporary, serious financial difficulties caused by circumstances beyond their control.29
This “condition” should imply that the firm’s financial difficulties had not already
started in 2019. Yet, given that I have no access to the information that was submitted
by the firms and I have no information about the approval process either, I cannot ex-
clude the possibility that vulnerable firms had in some way access to the support. Im-
portantly, this is true for any industry not only those that received the most support.
In fact, I find no direct link between the amount of vulnerable firms (zombie firms) pre-
sent in an industry in 2019 and the total amount of government support (short-term
permits and tax deferrals support) the industry has received from when the programme
27 Policymakers around the word acted quickly and employed a variety of measures such as tax cuts and de-ferrals and credit guarantees. Central banks lowered policy rates, expanded asset purchase programmes, and, in some cases, even started financing companies directly. Capital and liquidity buffers were relaxed. Debt service moratoriums and prohibitions on evictions were suggested or mandated. More details can be found here: Sveriges Riksbank (May 2020) and ESRB (2020) and ECB (2020). 28 Debt moratoria allowed firms affected (or expecting to be affected) by the COVID-19 shock to suspend the payment of their obligations for the duration of the moratorium period. Public loans guarantees schemes helped firms (with no financial difficulties at the end of 2019) to access financing by transferring some of the credit risk and potential credit losses from banks to governments. Tax deferrals and tax relief programmes vary between countries but they usually involve a deferral in the payment of VAT taxes or temporary reduc-tion or deferral of payroll tax obligations or employees’ social security contributions. 29 More information can be found on this link: (https://tillvaxtverket.se/english/short-time-work-allowance-2021/apply-for-financial-support-2021.html).
Appendix C: Government support and vulnerable firms
38
was initiated to the present day. For example, I find that some of the industries partic-
ularly affected by the economic crisis (the arts, hotels and restaurants, transportation
and wholesale and retail) entered 2020 with a substantial number of large firms with
ICR<=1 of which a significant number were zombies. These latter industries are also
among those that have received some of the largest support (Sveriges Riksbank, FSR
2021:1). It would then be easy to speculate that it is likely that vulnerable firms (and
zombie firms) may have had direct access to at least some of the money provided to
support the economy or have indirectly benefited from these programmes because of
the additional funds they may have freed up at the industry level.
Nevertheless, while it is not clear that this is the case and firm level data is not available
to me for further investigation, it is hard to conclude that this necessarily may have
been detrimental to the economy or the financial system, even if vulnerable firms (and
zombie firms) may have had access to the money provided to the economy by govern-
ment agencies. For instance, even though zombie firms may create entry barriers for
other competitors, in normal times, they tend to regain some efficiency and, at least in
Sweden, they do not seem to impact the productivity of other firms in the same indus-
try (see Cella 2020a).
Moreover, as discussed previously, it is difficult to gauge how weak so-called zombie
firms really are since their identification is mostly based on accounting variables. For
example, in Sweden many zombie firms belong to corporate groups and therefore have
access to the group internal financial market which makes it difficult to assess how vul-
nerable these firms really are. Therefore, even if vulnerable firms have had access to
some government programmes, it is not clear that they largely benefited from them
and that this was detrimental to either the real economy or financial stability.
Finally, Brunnermeier and Krishnamurthy (2020) argue that if there is a return to pre-
COVID-19 conditions soon, then the concern about providing credit support to zombie
firms during the recession should be less acute than during a normal recession because
in this case there will be less need to reallocate assets across sectors or firms than in a
typical recession. Now that the restrictions have been lifted and the economy is recov-
ering, we may find out if this is the case.

SVERIGES RIKSBANK Tel +46 8 - 787 00 00 [email protected] www.riksbank.se
PRODUCTION SVERIGES RIKSBANK