Embed Size (px)
Citation preview
The CREAM Calorimeter: Performance In Tests And Flights
M.H. Leea, H.S. Ahna, P. Allisonb, M.G. Bagliesic, L. Barbierd, J.J. Beattyb, G. Bigongiaric, P. Boylee, T.J. Brandtb, J.T. Childersf, N.B. Conkling, S. Coutug, M.A. DuVernoisf, O. Ganela, J.H. Hana,
J.A. Jeonh, K.C. Kima, L. Lutza, P. Maestroc, A. Malininea, P.S. Marrocchesic, S. Minnicki, S.I. Mognetg, S.W. Namh, S. Nutterj, I.H. Parkh, N.H. Parkh, E.S. Seoa,k, R. Sinaa, S. Swordye, S. Wakelye,
P. Walpolea, J. Wua, J. Yangh, Y.S. Yoonk, R. Zeic, S.Y. Zinna
(a) Inst. for Phys. Sci. and Tech., University of Maryland, College Park, MD 20742, USA (b) Dept. of Physics, Ohio State University, Columbus, Ohio 43210, USA
(c) Dept. of Physics, University of Siena and INFN, Via Roma 56, 53100 Siena, Italy (d) Goddard Space Flight Center, Greenbelt, MD 20771, USA
(e) Enrico Fermi Institute and Dept. of Physics, University of Chicago, Chicago, IL 60637, USA (f) School of Physics and Astronomy, University of Minnesota, Minneapolis, MN 55455, USA
(g) Dept. of Physics, Penn State University, University Park, PA 16802, USA (h) Dept. of Physics, Ewha Womans University, Seoul, 120-750, Republic of Korea
(i) Dept. of Physics, Kent State University Tuscarawas, New Philadelphia, OH 44663, USA (j) Dept. of Physics and Geology, Northern Kentucky University, Highland Heights, KY 41099, USA
(k) Dept. of Physics, University of Maryland, College Park, MD 20742, USA
Abstract. The Cosmic Ray Energetics And Mass (CREAM) balloon-borne experiment, designed to directly measure cosmic-ray particle energies from ~1011 to ~1015 eV, had two successful flights since December 2004, with a total duration of 70 days. The CREAM calorimeter is comprised of 20 layers of 1 radiation length (X0) tungsten interleaved with 20 active layers each made up of fifty 1 cm wide scintillating fiber ribbons. The scintillation signals are read out with multi pixel Hybrid Photo Diodes (HPDs), VA32-HDR2/TA32C ASICs and LTC1400 ADCs. During detector construction, various tests were carried out using radioactive sources, UV-LEDs, and particle beams. We will present results from these tests and show preliminary results from the two flights.
Keywords: Cosmic-ray calorimeter; High energy cosmic rays. PACS: 07.20.Fw, 07.87.+v, 95.55.Vj
1. INTRODUCTION
The CREAM experiment [1], a balloon borne instrument, is designed to study high energy cosmic rays by directly measuring nuclei from H to Fe, in the energy range from ~1011 to ~1015 eV. One of the scientific goals is to test a cosmic ray acceleration theory which predicts an acceleration limit of ~ Z x 1014 eV, where Z is the incident particle charge number. By measuring ratios of primary to secondary nuclei, the propagation of cosmic rays can also be studied. At its high end, CREAM’s energy
range overlaps the range of ground based experiments, providing directly measured data to anchor their model-based calibration.
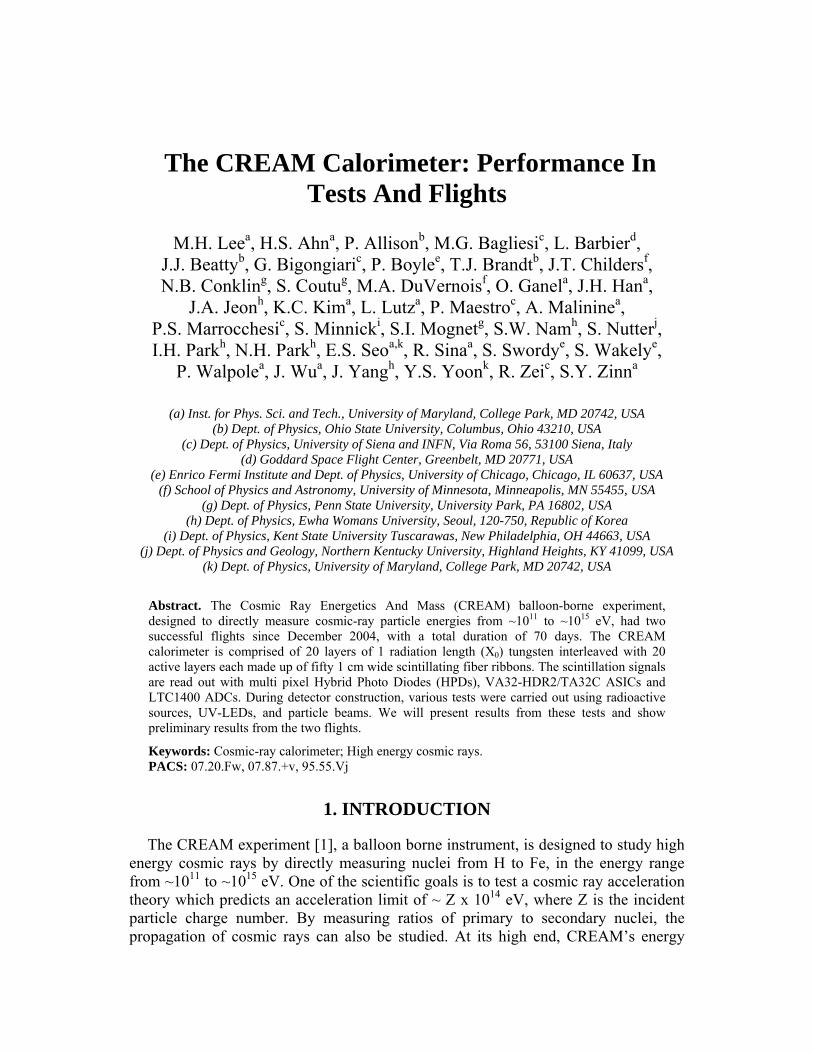
The CREAM instrument, described in detail elsewhere [1, 2], is comprised of several complementary detector systems to measure the charge and energy of cosmic rays, including a sampling tungsten/scintillating-fiber calorimeter. The CREAM calorimeter is comprised of 20 layers of 1 radiation length (X0) tungsten absorber interleaved with 20 active layers of fifty 1 cm wide scintillating fibers ribbons made of 0.5 mm diameter fibers as shown in Fig. 1. Alternate layers are oriented orthogonally to each other, providing 10 measurements in X-Z and 10 alternate measurements in Y-Z. Scintillation light is generated in the scintillating fibers when an incident particle generates a shower of charged particles inside the calorimeter. These signals are transmitted from the fiber ribbon through a light mixer and a bundle of clear fibers before reaching the window of a HPD (Hybrid Photo Diode). In the HPD, photo-
electrons are accelerated by a high voltage potential between photo-cathode and pixelated diode with a gain of about 2500 at 12 kV. The accelerated photo-electrons generate electron-hole pairs in the fully depleted region of the silicon diode of about 380 μm thickness by 100 V reverse bias. The charge signals are read out by a charge sensitive amplifier (VA32-HDR2) and digitized in 12-bit ADC chips (LTC1400) with a trigger circuit (TA32C) forming a trigger logic signal above a threshold value. A detailed explanation on the design of the calorimeter is provided elsewhere [3]. In this paper we present the performance of the calorimeter in various tests carried out during design, construction, and two successful flights.
FIGURE 1. CREAM calorimeter components.
2. OPTICS
The scintillation light generated by charged shower particles travels in the fibers to a ultra-violet transparent (UVT) acrylic light mixer and is transferred to a jacketed
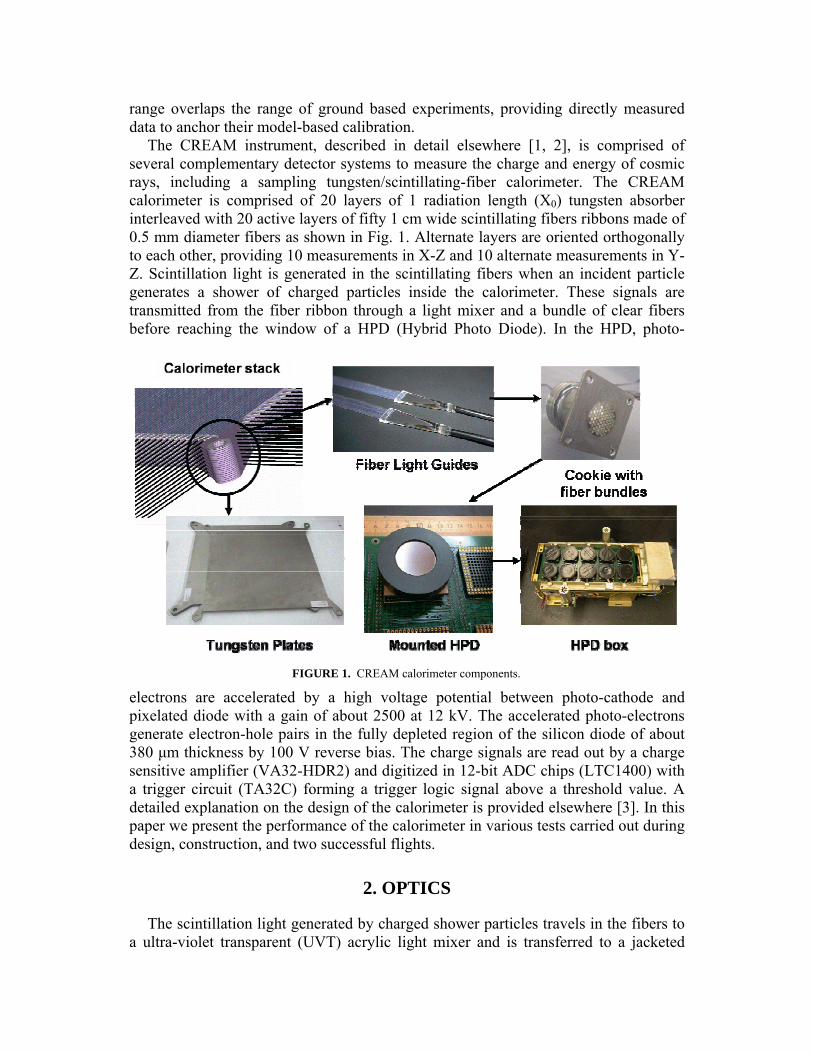
bundle of forty eight 256 μm diameter clear plastic fibers. The transmission efficiency of light mixer and clear fibers, including all glue-joints were measured using a blue LED (Light Emitting Diode) source and a PMT (Photo Multiplier Tube) read out with an oscilloscope as shown in Fig. 2 (a). The average light transfer efficiency for flight assembly is ~4.7%. Also shown are overall transmission efficiencies for a previous design, as well as the flight design with non-UVT acrylic. The clear fiber bundle carries the light to the face of the HPD, where the bundle is split into three groups each with a different number of thin fibers, and through a different neutral density (ND) filter. The transmission efficiency of those ND filters are measured and shown in Fig. 2 (b). This arrangement forms three readout ranges to match the dynamic range of
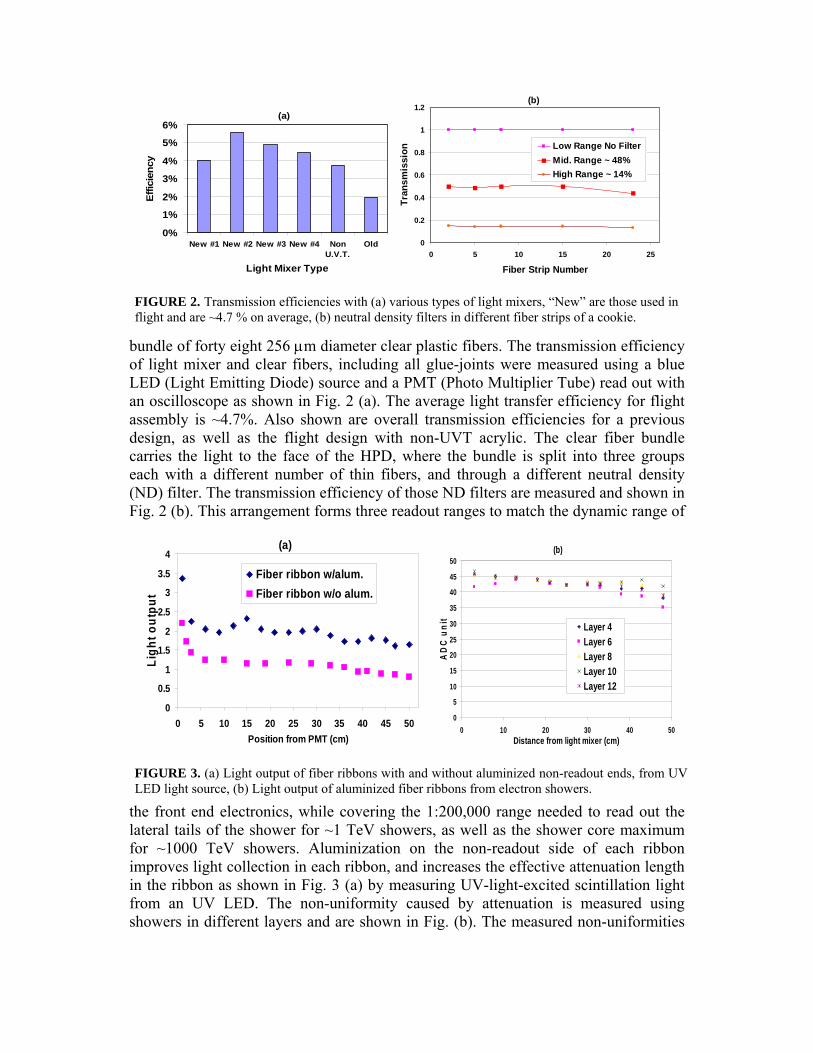
the front end electronics, while covering the 1:200,000 range needed to read out the lateral tails of the shower for ~1 TeV showers, as well as the shower core maximum for ~1000 TeV showers. Aluminization on the non-readout side of each ribbon improves light collection in each ribbon, and increases the effective attenuation length in the ribbon as shown in Fig. 3 (a) by measuring UV-light-excited scintillation light from an UV LED. The non-uniformity caused by attenuation is measured using showers in different layers and are shown in Fig. (b). The measured non-uniformities
(a)
0%
1%
2%
3%
4%
5%
6%
New #1 New #2 New #3 New #4 NonU.V.T.
Old
Light Mixer Type
Effic
ienc
y
(b)
0
0.2
0.4
0.6
0.8
1
1.2
0 5 10 15 20 25
Fiber Strip Number
Tran
smis
sion Low Range No Filter
Mid. Range ~ 48%High Range ~ 14%
FIGURE 2. Transmission efficiencies with (a) various types of light mixers, “New” are those used in flight and are ~4.7 % on average, (b) neutral density filters in different fiber strips of a cookie.
(a)
0
0.5
1
1.5
2
2.5
3
3.5
4
0 5 10 15 20 25 30 35 40 45 50Position from PMT (cm)
Ligh
t out
put
Fiber ribbon w/alum.Fiber ribbon w/o alum.
(b)
0
5
10
15
20
25
30
35
40
45
50
0 10 20 30 40 5Distance from light mixer (cm)
AD
C u
nit
0
Layer 4Layer 6Layer 8Layer 10Layer 12
FIGURE 3. (a) Light output of fiber ribbons with and without aluminized non-readout ends, from UV LED light source, (b) Light output of aluminized fiber ribbons from electron showers.
were less than 15 % and are compensated by reading alternate (even vs. odd numbered) ribbons of a layer on opposite ends by two different HPDs.
3. READOUT ELECTRONICS
The calorimeter front end electronics are housed in four HPD boxes as shown in Fig. 1. Each box is instrumented with 10 HPDs socket-mounted in a Front board at the top of the box. Each HPD reads out 55 channels, of which 25 are low-range, 25 mid-range, and 5 high-range, based on the calorimeter optical division scheme [4]. At the bottom of the box a pair of Motherboards holds the connectors to the data sparsification system, the trigger system, the command system, the calibration system, and the power system. The Motherboards also provide the HPDs with bias voltage. A set of 10 vertically mounted ASIC boards connects the Front board and the two Motherboards. On the outside of the box, a pair of High Voltage Power Supplies (HVPSs) provides filtered high voltage, up to 12 kV (adjustable) at up to 1 μA each. Details of the high voltage system are explained elsewhere [4]. Each calorimeter HPD is read out by a pair of VA32-HDR2/TA32C ASICs, for a total of 80 such ASICs. Each pair of VA/TAs is socket-mounted in an ASIC board, allowing convenient
replacement in case an ASIC is damaged before flight. Each VA/TA ASIC has 32 signal input channels, a 32-channel serial output and one trigger output channel. The VA receives the input signals from the HPD, and passes them through a Gaussian shaping circuit and, after an adjustable-delay peak hold circuit, into an ADC. The average VA peak delay time was set to ~1.5 μs. The digitized signals are sent through the Motherboard to a sparsification system that discards those signals that are below sparsification thresholds (adjustable on a channel-by-channel basis). This reduces the bandwidth required for data telemetry to the ground to manageable levels. In parallel to signal processing in the VA, the TA passes the input signals through a fast semi-Gaussian shaper, and compares the levels to an adjustable preset threshold. If any of the 32 shaped signals exceeds the threshold, the TA sends out a trigger signal. The low-range signals are used to form half-layer triggers, which are then combined with the other half-layer to form an overall OR of all ribbons in the layer. The overall
(a)(a)
(b)(b)
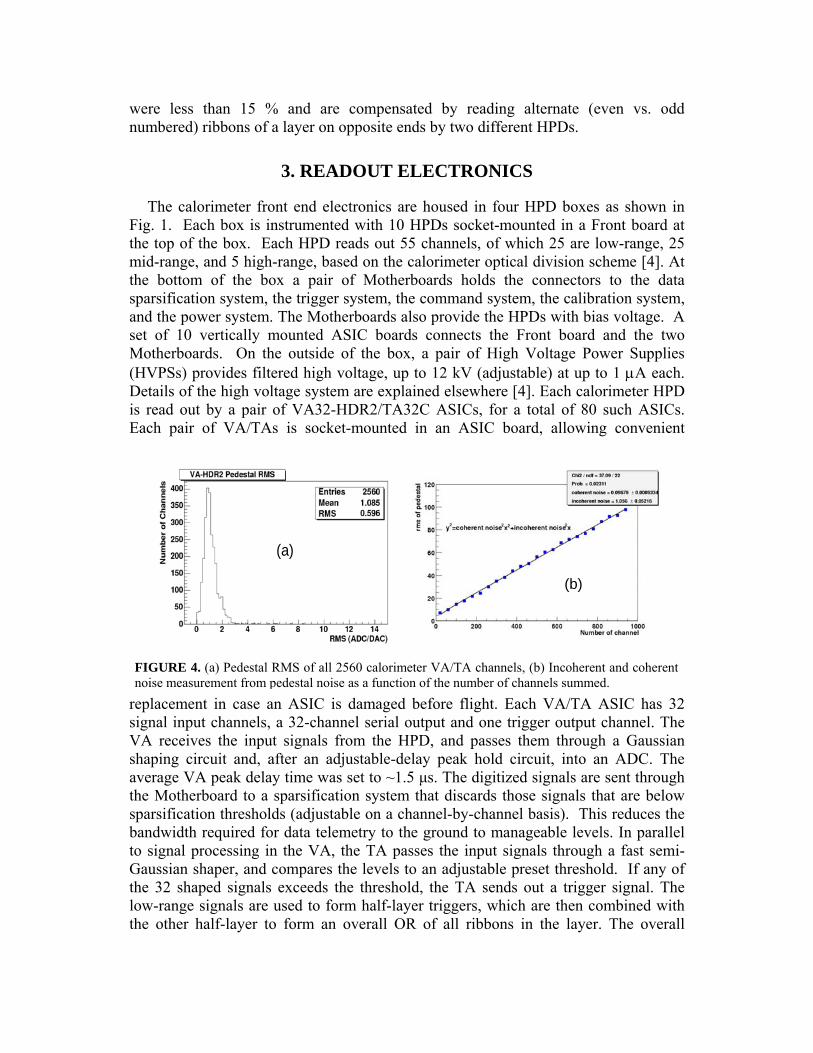
FIGURE 4. (a) Pedestal RMS of all 2560 calorimeter VA/TA channels, (b) Incoherent and coherent noise measurement from pedestal noise as a function of the number of channels summed.
calorimeter trigger is formed by requiring trigger signals from N consecutive layers, where N is adjustable in-flight by command from the ground to 4, 6, 8, or 10 layers.
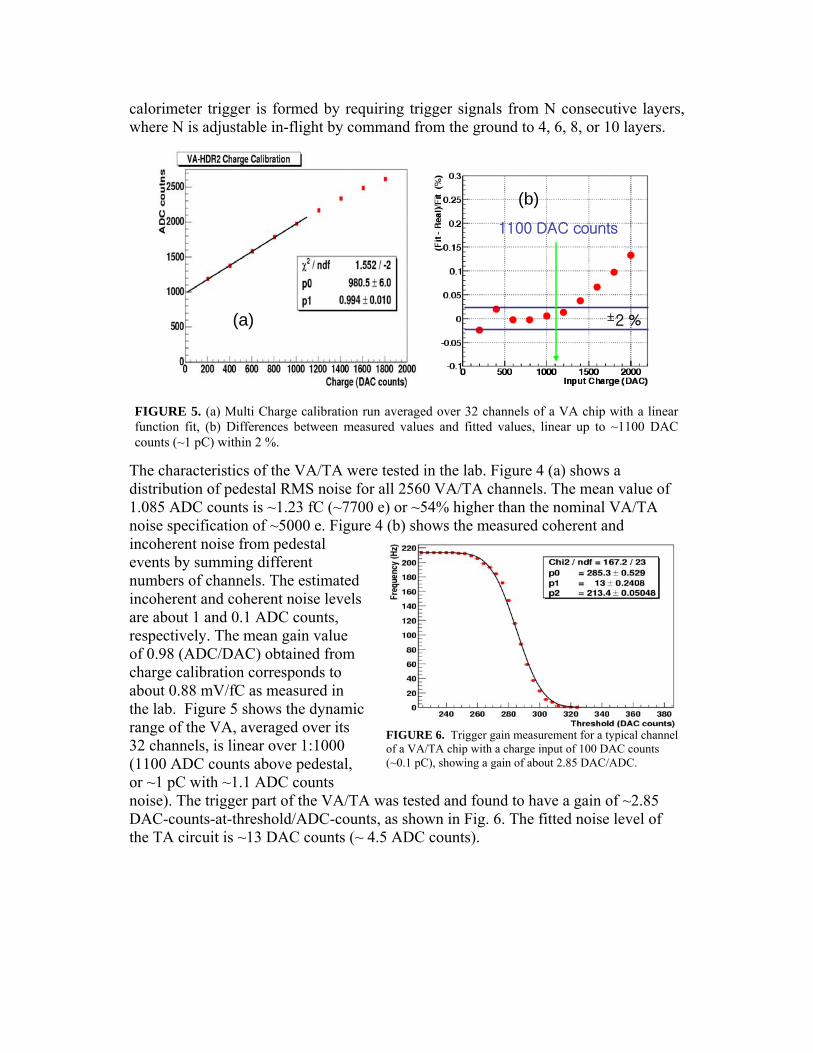
The characteristics of the VA/TA were tested in the lab. Figure 4 (a) shows a distribution of pedestal RMS noise for all 2560 VA/TA channels. The mean value of 1.085 ADC counts is ~1.23 fC (~7700 e) or ~54% higher than the nominal VA/TA noise specification of ~5000 e. Figure 4 (b) shows the measured coherent and incoherent noise from pedestal events by summing different numbers of channels. The estimated incoherent and coherent noise levels are about 1 and 0.1 ADC counts, respectively. The mean gain value of 0.98 (ADC/DAC) obtained from charge calibration corresponds to about 0.88 mV/fC as measured in the lab. Figure 5 shows the dynamic range of the VA, averaged over its 32 channels, is linear over 1:1000 (1100 ADC counts above pedestal, or ~1 pC with ~1.1 ADC counts noise). The trigger part of the VA/TA was tested and found to have a gain of ~2.85 DAC-counts-at-threshold/ADC-counts, as shown in Fig. 6. The fitted noise level of the TA circuit is ~13 DAC counts (~ 4.5 ADC counts).
(a)(a)
±2 %
1100 DAC counts
(b)
±2 %
1100 DAC counts
(b)
FIGURE 5. (a) Multi Charge calibration run averaged over 32 channels of a VA chip with a linear function fit, (b) Differences between measured values and fitted values, linear up to ~1100 DAC counts (~1 pC) within 2 %.
FIGURE 6. Trigger gain measurement for a typical channel of a VA/TA chip with a charge input of 100 DAC counts (~0.1 pC), showing a gain of about 2.85 DAC/ADC.
4. BEAM TESTS
With a total of 1000 fiber ribbons in 20 layers, each with three readout ranges,
calibration is of critical importance in correctly reconstructing shower energy [5]. There are two steps to this calibration. First, one must equalize the low ranges of the different ribbons. Then, one must inter-calibrate the mid- to low-range and the high- to mid-range signals in each ribbon separately. The equalization process required scanning the surface of the calorimeter with beams of 150 GeV electrons, and for each ribbon, comparing the measured signal in ADC counts for those events where that ribbon was in the middle of the beam profile, with the energy deposit expected from
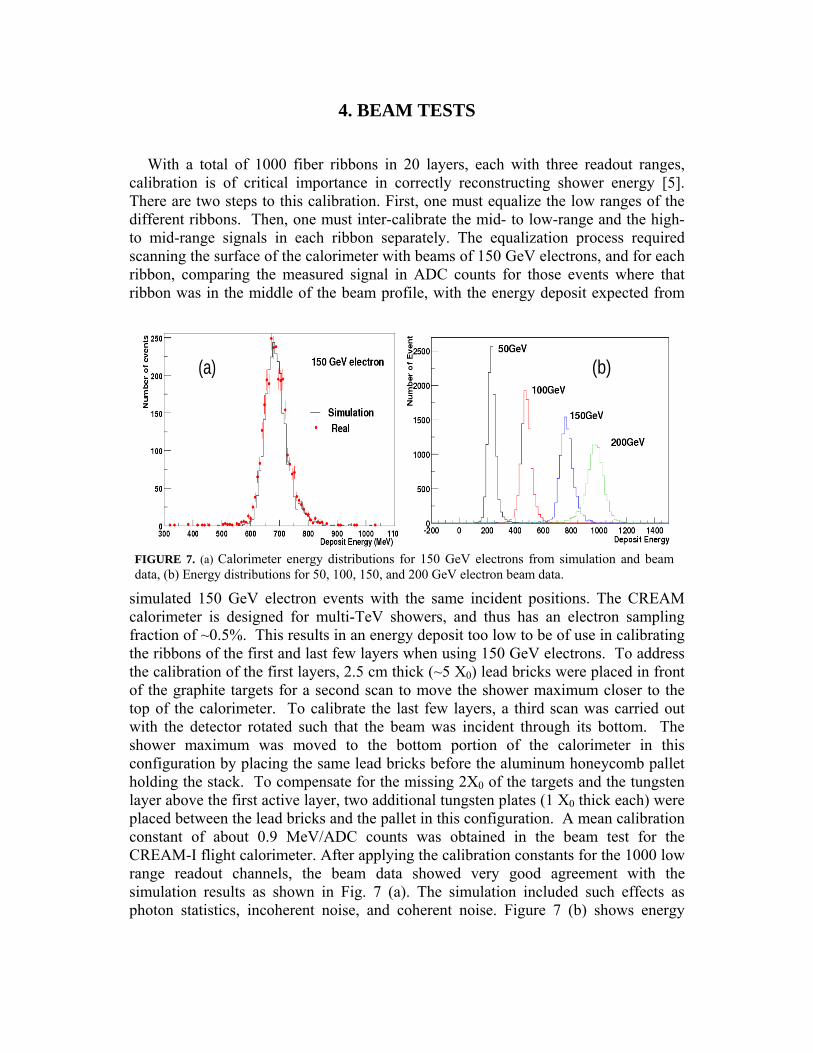
simulated 150 GeV electron events with the same incident positions. The CREAM calorimeter is designed for multi-TeV showers, and thus has an electron sampling fraction of ~0.5%. This results in an energy deposit too low to be of use in calibrating the ribbons of the first and last few layers when using 150 GeV electrons. To address the calibration of the first layers, 2.5 cm thick (~5 X0) lead bricks were placed in front of the graphite targets for a second scan to move the shower maximum closer to the top of the calorimeter. To calibrate the last few layers, a third scan was carried out with the detector rotated such that the beam was incident through its bottom. The shower maximum was moved to the bottom portion of the calorimeter in this configuration by placing the same lead bricks before the aluminum honeycomb pallet holding the stack. To compensate for the missing 2X0 of the targets and the tungsten layer above the first active layer, two additional tungsten plates (1 X0 thick each) were placed between the lead bricks and the pallet in this configuration. A mean calibration constant of about 0.9 MeV/ADC counts was obtained in the beam test for the CREAM-I flight calorimeter. After applying the calibration constants for the 1000 low range readout channels, the beam data showed very good agreement with the simulation results as shown in Fig. 7 (a). The simulation included such effects as photon statistics, incoherent noise, and coherent noise. Figure 7 (b) shows energy
(a)(a)
(b)(b)
FIGURE 7. (a) Calorimeter energy distributions for 150 GeV electrons from simulation and beam data, (b) Energy distributions for 50, 100, 150, and 200 GeV electron beam data.
distributions for 50, 100, 150, and 200 GeV electron beam data, exhibiting a good linear response.
5. FLIGHTS
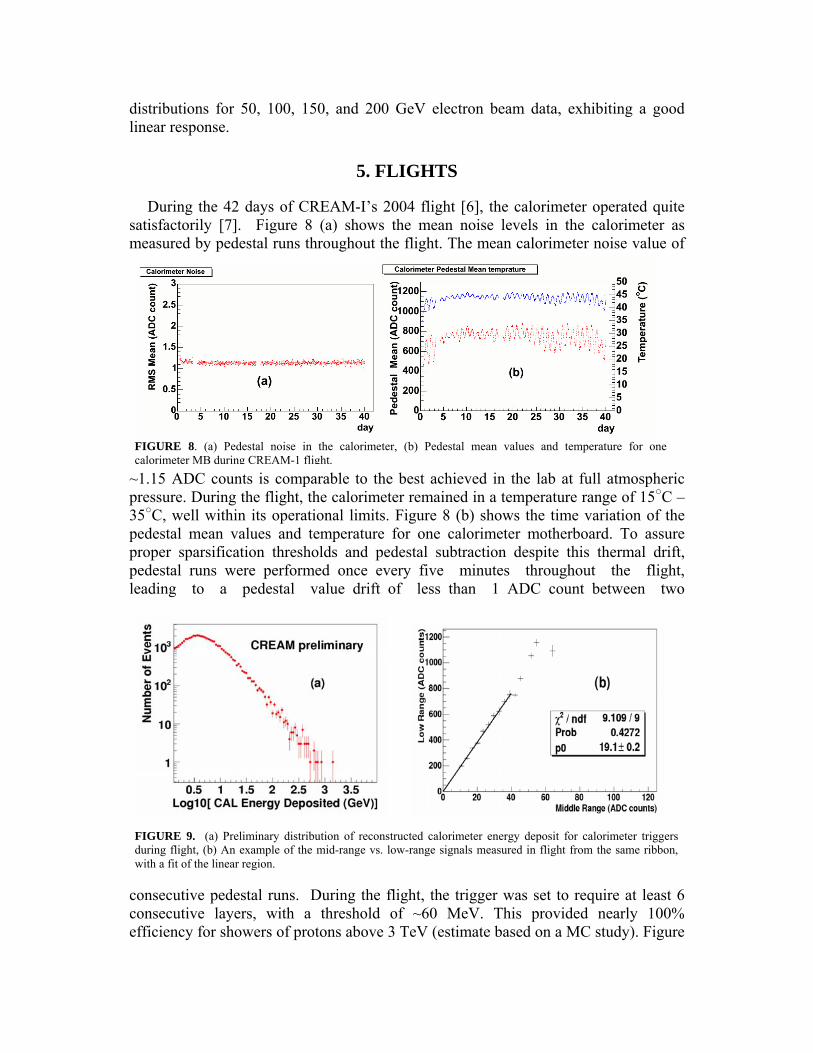
During the 42 days of CREAM-I’s 2004 flight [6], the calorimeter operated quite satisfactorily [7]. Figure 8 (a) shows the mean noise levels in the calorimeter as measured by pedestal runs throughout the flight. The mean calorimeter noise value of
~1.15 ADC counts is comparable to the best achieved in the lab at full atmospheric pressure. During the flight, the calorimeter remained in a temperature range of 15○C – 35○C, well within its operational limits. Figure 8 (b) shows the time variation of the pedestal mean values and temperature for one calorimeter motherboard. To assure proper sparsification thresholds and pedestal subtraction despite this thermal drift, pedestal runs were performed once every five minutes throughout the flight, leading to a pedestal value drift of less than 1 ADC count between two
consecutive pedestal runs. During the flight, the trigger was set to require at least 6 consecutive layers, with a threshold of ~60 MeV. This provided nearly 100% efficiency for showers of protons above 3 TeV (estimate based on a MC study). Figure
FIGURE 8. (a) Pedestal noise in the calorimeter, (b) Pedestal mean values and temperature for one calorimeter MB during CREAM-1 flight.
FIGURE 9. (a) Preliminary distribution of reconstructed calorimeter energy deposit for calorimeter triggers during flight, (b) An example of the mid-range vs. low-range signals measured in flight from the same ribbon, with a fit of the linear region.

9 (a) shows a preliminary result of the calorimeter energy deposit distribution for events recorded with a calorimeter trigger. The energy deposit was reconstructed using a preliminary set of calibration constants from beam calibration, LED-based HV gain corrections, and flight measurements of the ratios between different readout ranges. Figure 9 (b) shows an example of such a ratio of mid- and low-range signals for one ribbon. Such plots were used to inter-calibrate the different ranges for each ribbon separately, providing measurements from the mid-range wherever the low-range was saturated.
The CREAM-II instrument, incorporating a calorimeter with the same design as
that of CREAM-I was flown for ~29 days from December 2005 to January 2006, completing 2 circumnavigations of the Antarctic continent, exhibiting very stable operation. About 57 GB of data were collected during this flight. About 117 GB of data has been collected to date from the combined 70 days flights of CREAM-I and CREAM-II. Analysis of flight data is now in progress. At the same time, the CREAM-I calorimeter is being refurbished for flight in December 2007, and its calibration at a CERN test beam is planned for October of this year.
ACKNOWLEDGMENTS
This work was supported by NASA. The authors thank NASA/WFF, the Columbia Scientific Balloon Facility, the NSF Office of Polar Programs, and Raytheon Polar Services Company for the successful balloon launches, flight operations, and payload recovery. The authors also thank CERN for the use of their excellent beam test facilities and operations.
REFERENCES
1. E. S. Seo et al., Advances in Space Research, 33/10, 1777-1785 (2004). 2. S. Coutu et al., “Performance of the transition radiation detector and the timing charge detector in the first flight
of the CREAM instrument”, Proc. 29th Int. Cosmic Ray Conf., Pune, 2005, 3, pp. 393-396. 3. M. H. Lee et al., “Design and tests of the CREAM calorimeter”, Proc. 29th Int. Cosmic Ray Conf., Pune, 2005,
3, pp. 413-416. 4. M. H. Lee et al., “Electronics for the CREAM calorimeter and hodoscopes”, Proc. 29th Int. Cosmic Ray Conf.,
Pune, 2005, 3, pp. 409-412. 5. Y. S. Yoon et al., “Performance of the CREAM calorimeter in accelerator beam test”, Proc. 29th Int. Cosmic
Ray Conf., Pune, 2005, 8, pp. 371-374. 6. E.S. Seo et al., “New Observations with CREAM”, Proc. 29th Int. Cosmic Ray Conf., Pune, 2005, 10, pp. 185-
198. 7. M. H. Lee et al., “Performance of the CREAM calorimeter module during its first flight of 42 days”, Proc. 29th
Int. Cosmic Ray Conf., Pune, 2005, 3, pp. 417-420.