Embed Size (px)
Citation preview
The “Crisis” in Medical Malpractice Insurance
Patricia M. Danzon Andrew J. Epstein
Scott Johnson
The Wharton School University of Pennsylvania
December 2003
Prepared for the Brookings-Wharton Conference on Public Policy Issues Confronting the Insurance Industry, January 8/9, 2004. We would like to thank the Wharton Financial Institutions Center for financial support, and the Huebner Foundation for providing access to the NAIC data.
I. Introduction
Since 1999, many states have experienced a “crisis” in medical malpractice insurance.
The median premium increase, after adjusting for inflation, for internists, general surgeons and
obstetricians/gynecologists increased from 0-2 percent in 1996 and 1997 to 17-18 percent in
2003, ranging up to 60 percent in some states in 2001-2002.1 In December 2001, the St. Paul
Companies, which had been the largest malpractice insurer operating in 45 states, announced its
decision to withdraw from the market, citing losses of millions of dollars on its medical liability
business. Two other major insurers, PHICO and Frontier Insurance Group, exited from the
market entirely. Faced with insolvency, the Medical Inter-Insurance Exchange (MIIX)
reorganized and restricted its operations to New Jersey. In some states, including Pennsylvania
and New Jersey, physicians have gone on strike, threatened to leave the state and discontinued
high risk services; however, a recent GAO study found no conclusive evidence of widespread,
measurable effects of the crisis on the availability of medical services.2
This most recent crisis followed an unusually long period of flat or modest premium
increases and widespread availability, which in turn followed severe crises of insurance
affordability in the 1980s and of affordability and availability in the mid-1970s. In response to
these earlier crises, many states adopted reforms of tort law that were intended to reduce the
level and unpredictability of claims, including caps on awards for non-economic damages,
collateral source offset, shorter statutes of limitations, etc. At the same time, some states adopted
measures to assure the availability of insurance and reduce its cost to physicians. Joint
underwriting associations (JUAs) serve as residual market mechanisms for physicians who are
unable to obtain coverage in the voluntary market. Patient compensation funds limit the
defendant physician’s liability at some threshold, for example $200,000 per claim, but provide
additional compensation to the patient up to a higher threshold, for example $1m. Such funds are
usually financed on a pay-as-you-go basis through assessments on all physicians practicing in the
state.
In addition to these statutory changes, malpractice insurance markets adopted voluntary
changes to reduce insurer risk and establish more robust sources of coverage. Most insurers
replaced the occurrence policy form with the claims-made policy form, thereby shifting from the
insurer to the policyholder the risk related to losses incurred but not reported during the policy
period.3 In addition, in many states physicians established their own physician-owned mutuals,
reciprocals and risk retention groups. These physician-directed companies replaced the
traditional commercial stock companies, many of which either withdrew or sharply curtailed
their malpractice exposure during the crises of the 1970s and 1980s. In theory, physician-owned
companies may have informational and/or risk sharing advantages over stock companies in
writing a line such as medical malpractice insurance.4
The most recent crisis raises the question of how far these tort and insurance market
reforms have mitigated if not prevented the recurrence of symptoms of crisis. A recent GAO
report5 on the current crisis concluded that, although physicians in most states have experienced
some increase in premium rates since 1999, the between-state variation has been significant.
From 1999 to 2000, general surgeons’ medical malpractice premiums increased 75 percent in
Dade County, Florida, but only 2 percent in Minnesota for a similar level of coverage. Moreover,
the report concluded that the rate of premium increase has been significantly lower in states that
enacted tort reforms, specifically, caps on awards for non-economic damages (see Figure 1).
Although this evidence suggests that non-economic damages caps have reduced premium growth,
such conclusions remain tentative because this analysis was based on only one year of premium
increases and does not control for other factors.
[Insert Figure 1: ]
Viewing the current crisis from a longer term perspective, the pattern of premium
increases over the last decade, with flat or falling rates for several years followed by sharp
increases, resembles the typical insurance cycle that has been experienced in other “long tailed”
lines of liability insurance, in particular, general (including product) liability insurance. Several
theories have been developed to explain these alternating periods of soft markets, with intense
competition and flat or falling premiums, followed by hard markets, with sharp premium
increases, insurer exits and restrictions on availability. The “capacity constraint” theory of hard
markets6 posits that hard markets are triggered by shocks to insurer capital that lead to sharp
contractions in the supply of insurance, given regulatory constraints on permissible premium-to-
capital ratios and costs of adding external capital. The capacity constraint theory presupposes
periodic exogenous shocks to insurer capital, often due to anticipated shifts in liability rules, that
apply retroactively and render inadequate prior insurer reserves, or declines in asset valuations
and investment yields that erode capital. The contraction of insurer capital in turn leads to a
reduction in supply of insurance and an increase in prices. Cummins and Danzon (1997) extend
this model to include insolvency risk of insurers and demand for insurance that depends on the
firm’s financial quality. In this model, a decline in insurer capital leads to a decline in the price
of insurance, as measured by the loading charge; premium rates may nevertheless increase, to the
extent that expected loss costs increase.
Less attention has been paid to soft markets. One exception is Harrington and Danzon
(1994), who develop and test alternative theories of excessive competition. They hypothesize
that if some insurers undercharge, due to either inexperience or excessive risk taking, then other
insurers would rationally cut price below short run marginal cost, in order to preserve quasi-rents
on their established business. Clearly, soft market periods of pricing below short run marginal
cost cannot continue indefinitely. Whether this excessive price cutting ultimately contributes to
more-than-corrective price increases (in excess of increases in prospective loss costs) and to
insurer exits, especially by insurers with the little investment and hence low quasi-rents, remains
an untested hypothesis
In this paper, we first document the extent of the recent crisis, in terms of premium
increases and insurer exits, and then examine the role of several possible contributing factors. In
particular, we examine the contribution to premium increases and insurer exits of shocks to
insurer capital, and inexperience and excessive risk taking during the soft market. These theories
of abnormal pricing are tested against the null hypothesis, that the premium increases simply
reflected increases in expected loss costs and declines in expected investment yields. We also
examine the extent to which tort and insurance market reforms have mitigated the crisis,
extending the analysis is GAO (2003a) to consider the effects of several reforms on premium
increases over the period 1994-2003. Specifically, we test for effects of caps on noneconomic
and total damages, collateral source offset and limits on joint and several liability. We examine
effects of insurance pooling arrangements, specifically, whether the state has a JUAs or a patient
compensation fund. We also test whether physician directed companies have behaved differently
from commercial companies.
Our data on medical malpractice premium levels and increases are from Medical Liability
Monitor, which reports premium rates by state for three major specialties – internists, general
surgeons and obstetricians/gynecologists. Our measures of insurer experience are from the
annual statement data reported by all insurers to state regulators, as compiled by the National
Association of Insurance Commissioners (NAIC).
Summarizing findings, we find no evidence that shocks to insurer capital have
contributed to premium increases; however, they have contributed to insurer exits. We do find
evidence of underreserving in the late 1990s and subsequent upward revisions in reserves 2000-
2002. These loss forecast revisions are positively associated with premium increases and with
insurer exits. Exit probabilities are much higher for small firms, for recent entrants and firms
with relatively small premium volume, all of which are indicators of inexperience and relatively
low tangible and intangible capital invested. Thus the evidence is broadly consistent with the
hypothesis that “excessive” competition during the soft market contributed to the problems of the
hard market. Exit probabilities are much lower for physician-directed firms than for commercial
firms, and this differential is greater for small firms. Of the statutory reforms enacted in response
to prior crises, states that enacted caps on non-economic damages at or below $500,000 and
limits on joint and several liability have had significantly lower premium increases than states
without such caps. By contrast, mandatory insurance pools, either JUAs or patient compensation
funds, have not reduced premium increases or insurer exits.
The structure of the paper is as follows. Section II describes our data. Section III outlines
the evidence on the extent of the crisis in terms of trends in premium, in insurer losses paid and
losses incurred, and number of exits. Section IV outlines a model of insurance pricing, extending
the standard actuarial model to incorporate the theories of hard and soft markets. Section V
reports results of multivariate analysis of premium rate increases and insurer exits. Section VI
concludes.
II. Data
Our data on medical malpractice premium levels and increases are from Medical Liability
Monitor (MLM), which reports premium rates by state or territory, for a standard policy
providing claims-made coverage up to $1m. per claim, $3m. aggregate for the policy year, for
three major specialties – internists, general surgeons and obstetricians/gynecologists. These data
are collected by survey from one or more leading insurers in each state. These premium rates
should be reasonably representative of rates for each state, although we do not know the number
of physicians written at each rate.7 These rates do not reflect discounts and dividends to
policyholders; to the extent that such discounts and dividends became less frequent in the hard
market, the nominal rates increases reported in our data may underestimate the real increase in
cost to physicians. In a few states, the MLM rates are for coverage other than $1m/$3m claims
made; possible effects of this on our analysis are noted below. We have these data for select
years 1994 -2003. All current dollar values are adjusted to constant dollars using the GDP
deflator.
Our data on malpractice insurers are from the National Association of Insurance
Commissioners (NAIC) database, for the period 1993-2002. This database includes the annual
financial reports that all licensed insurers are required to report for each state in which they are
licensed. For each firm, the NAIC reports state-level data on premiums written and losses
incurred for medical malpractice; countrywide data on medical malpractice loss forecast
revisions, from Schedule P; and countrywide, all-lines data on capital, investment yields, assets,
etc. We include all firms that reported at least $100,000 in net medical malpractice premiums
written (in 2002 dollars) in at least one state. We categorize a firm as exiting from a state in year
t if it writes less than $100,000 in direct premiums written in year t, having previously written at
least that amount, and does not reach that threshold in that state for the remainder of our
observation period.
Although the NAIC database includes many more firms than the MLM data, nevertheless
a significant fraction of malpractice insurance is not captured by the NAIC data. In particular, if
physicians obtain coverage through self-insurance arrangements of hospitals or HMOs, and these
arrangements are not subject to state regulation, they are not represented in our data. Also
excluded from the NAIC data are most state-run pools, including joint underwriting associations
(JUAs) and patient compensation funds. Since the NAIC data report each firm’s aggregate
premium and loss experience, it cannot be disaggregated into changes in premium rates versus
number of policyholders or limits of coverage. Our analysis of premium increases therefore
focuses on the subsample of firms represented in the MLM data, for which we have matching
NAIC data on firm characteristics.
III. Trends in Premiums, Insurers Losses and Exits
Premium levels and increases
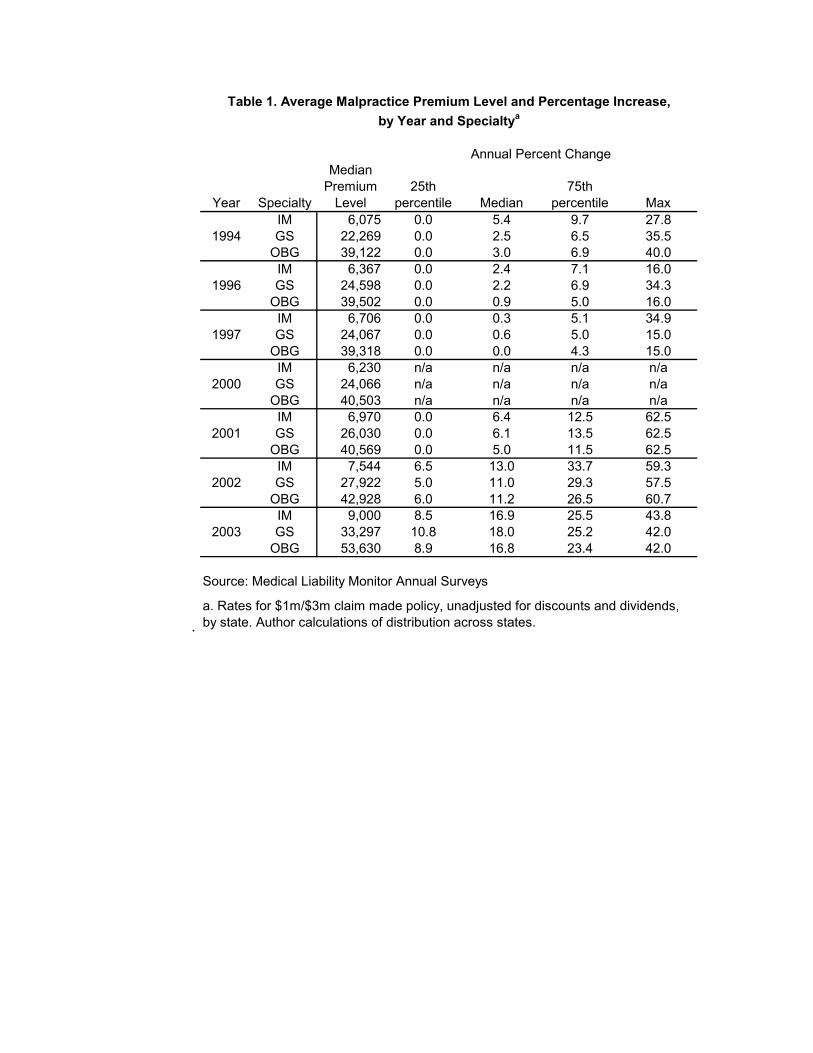
Table 1 shows, for each available year 1994-2003, the median premium rate across states
for $1m/3m claims-made coverage, for internal medicine (IM), general surgery (GS) and
obstetrics/gynecology (OBGYN). The table also shows the 25th, 50th and 75th percentiles and the
maximum percentage increase from the distribution of rate increases across states. In 1994, the
median premiums were $6,075 for IM, $22,269 for GS and $39,122 for OBGYN. By 2003, the
median premiums were $9,000 for IM, $33,297 for GS and $53,630 for OBGYN. Thus for the
median state, averaging the premium increases over the 9 year period, the cumulative increases
were 52 percent for IM, 47 percent for GS and 35 percent for OB.8 These are significant
increases in excess of general inflation. Moreover, the fact that the increases were concentrated
in the last four years rather than spread evenly over the period may have made them more
difficult to pass through to payers as higher fees for medical services. To the extent that premium
increases cannot be passed through as higher fees, the incidence is on physicians and this
contributes to the sense of crisis. Still, for the typical state the magnitude of these premium
increases does not appear to constitute a crisis.
However, states at or above the 75th percentile of annual increases experienced cumulate
rate increases over the nine year period of over 90 percent for IM and GS, and over 74 percent
for OB, with increases of over 10 percent in 2001 and over 20 percent in 2002 and 2003 alone.
The maximum annual increases exceeded 60 percent in 2002. Thus the distribution of premium
increases has been highly skewed: while most states have experienced significant increases, a
few states have had extreme increases, particularly in the last two years. Presumably, the sense of
crisis has been greatest in states that faced high percentage increases on top of high premium
levels. In general, however, the rate of premium increase has been greater for states that started
from relatively low levels: the Pearson correlation between 1994 premium level and 1994-2003
premium increase is -0.30 for IM, -0.25 for GS and -0.38 for OB.
The highest cumulative increases are 328 percent in Pennsylvania and 301 percent in
South Carolina. Both of these states have JUAs and Pennsylvania also a patient compensation
fund (formerly the “Catastrophic” or “Cat” fund, now MCare). The atypically high premium
increases in Pennsylvania in part reflect the increase in the required limits on physicians’ basic
coverage, from $200,000/$600,000 in '93 to $500,000/$1,500,000 in 2003; thus the increase
reported overstates the increase for constant limits of coverage. Nevertheless, the surcharge for
the Cat fund has also increased. Summing the base rate and the surcharge, and averaging across
the companies for which we have MLM rates, the increase in total premium between 1993 and
2003 ranges for 209 to 273 percent, depending on specialty and territory. The intra-specialty
range of rates across territories also increased.9 By contrast, SC has the second highest rate of
increase but absolute levels were only $18,000 for OBGYNs in 2003.
Aggregate Trends in Insurer Losses and Premium
[Insert Figure 2]
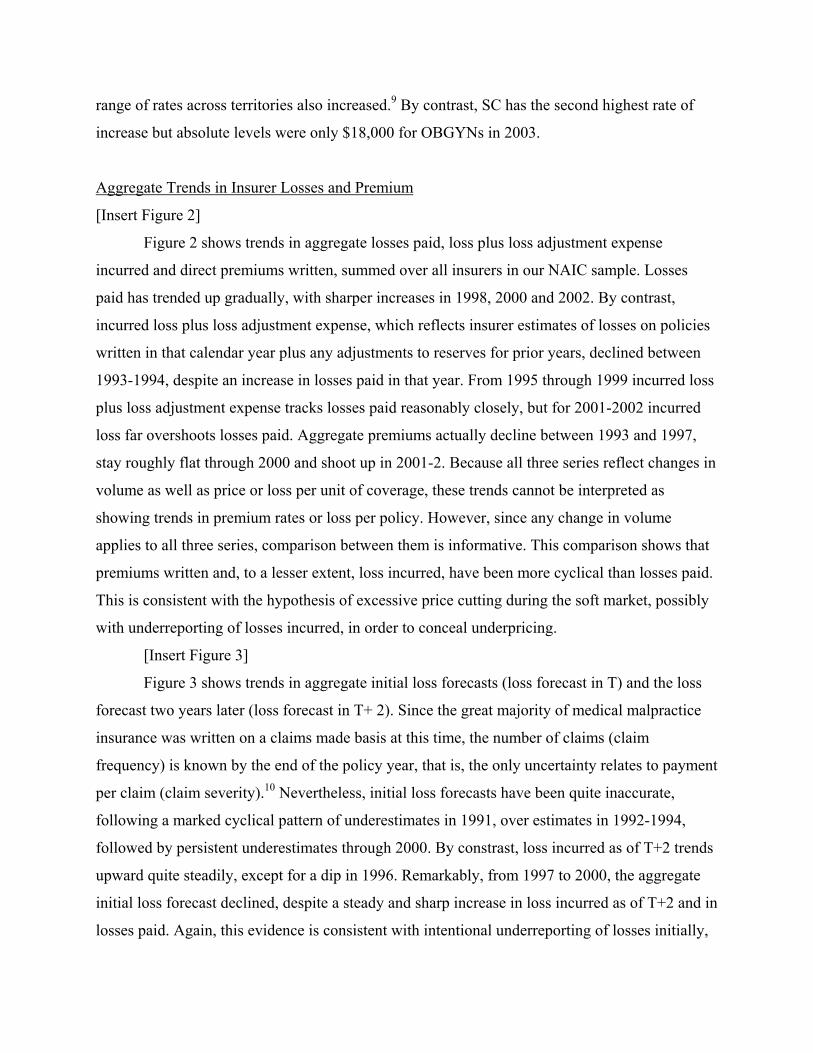
Figure 2 shows trends in aggregate losses paid, loss plus loss adjustment expense
incurred and direct premiums written, summed over all insurers in our NAIC sample. Losses
paid has trended up gradually, with sharper increases in 1998, 2000 and 2002. By contrast,
incurred loss plus loss adjustment expense, which reflects insurer estimates of losses on policies
written in that calendar year plus any adjustments to reserves for prior years, declined between
1993-1994, despite an increase in losses paid in that year. From 1995 through 1999 incurred loss
plus loss adjustment expense tracks losses paid reasonably closely, but for 2001-2002 incurred
loss far overshoots losses paid. Aggregate premiums actually decline between 1993 and 1997,
stay roughly flat through 2000 and shoot up in 2001-2. Because all three series reflect changes in
volume as well as price or loss per unit of coverage, these trends cannot be interpreted as
showing trends in premium rates or loss per policy. However, since any change in volume
applies to all three series, comparison between them is informative. This comparison shows that
premiums written and, to a lesser extent, loss incurred, have been more cyclical than losses paid.
This is consistent with the hypothesis of excessive price cutting during the soft market, possibly
with underreporting of losses incurred, in order to conceal underpricing.
[Insert Figure 3]
Figure 3 shows trends in aggregate initial loss forecasts (loss forecast in T) and the loss
forecast two years later (loss forecast in T+ 2). Since the great majority of medical malpractice
insurance was written on a claims made basis at this time, the number of claims (claim
frequency) is known by the end of the policy year, that is, the only uncertainty relates to payment
per claim (claim severity).10 Nevertheless, initial loss forecasts have been quite inaccurate,
following a marked cyclical pattern of underestimates in 1991, over estimates in 1992-1994,
followed by persistent underestimates through 2000. By constrast, loss incurred as of T+2 trends
upward quite steadily, except for a dip in 1996. Remarkably, from 1997 to 2000, the aggregate
initial loss forecast declined, despite a steady and sharp increase in loss incurred as of T+2 and in
losses paid. Again, this evidence is consistent with intentional underreporting of losses initially,
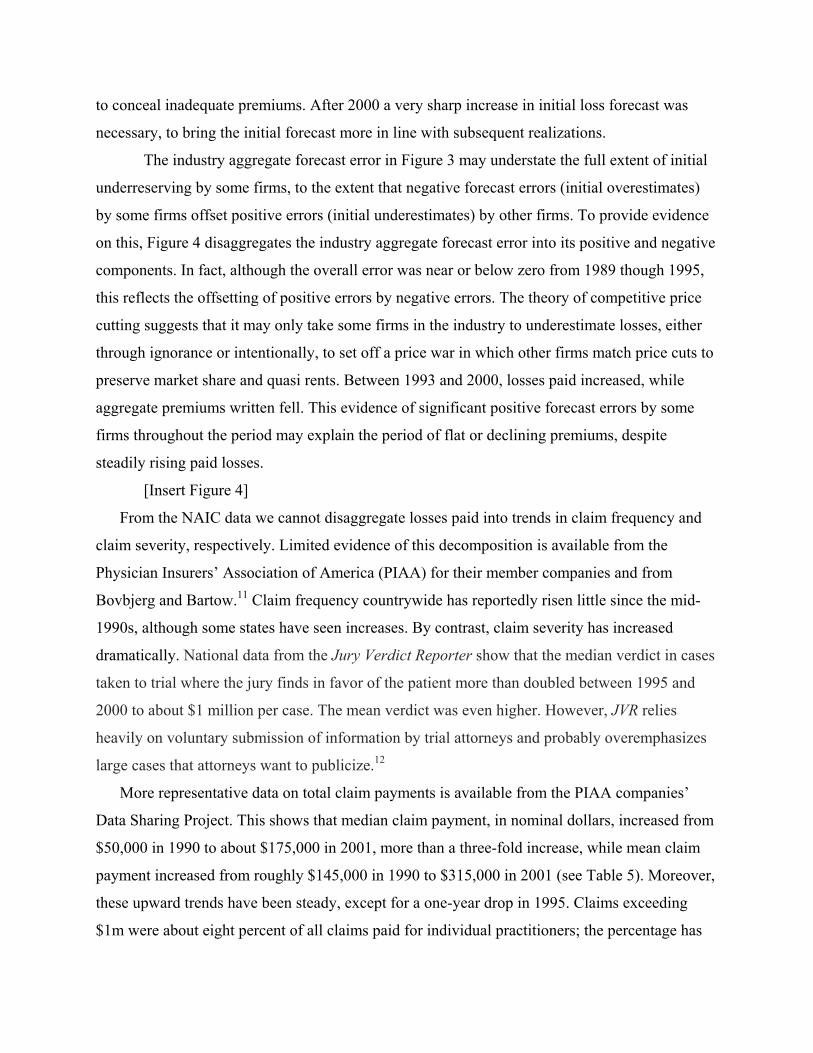
to conceal inadequate premiums. After 2000 a very sharp increase in initial loss forecast was
necessary, to bring the initial forecast more in line with subsequent realizations.
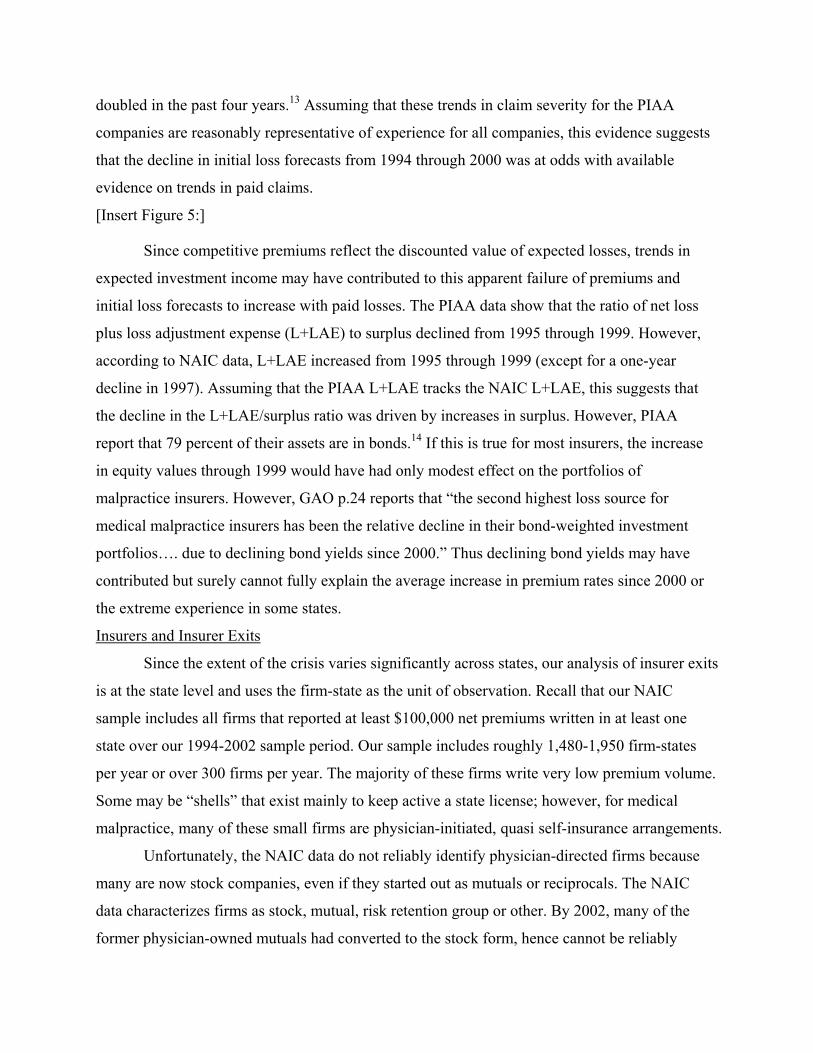
The industry aggregate forecast error in Figure 3 may understate the full extent of initial
underreserving by some firms, to the extent that negative forecast errors (initial overestimates)
by some firms offset positive errors (initial underestimates) by other firms. To provide evidence
on this, Figure 4 disaggregates the industry aggregate forecast error into its positive and negative
components. In fact, although the overall error was near or below zero from 1989 though 1995,
this reflects the offsetting of positive errors by negative errors. The theory of competitive price
cutting suggests that it may only take some firms in the industry to underestimate losses, either
through ignorance or intentionally, to set off a price war in which other firms match price cuts to
preserve market share and quasi rents. Between 1993 and 2000, losses paid increased, while
aggregate premiums written fell. This evidence of significant positive forecast errors by some
firms throughout the period may explain the period of flat or declining premiums, despite
steadily rising paid losses.
[Insert Figure 4]
From the NAIC data we cannot disaggregate losses paid into trends in claim frequency and
claim severity, respectively. Limited evidence of this decomposition is available from the
Physician Insurers’ Association of America (PIAA) for their member companies and from
Bovbjerg and Bartow.11 Claim frequency countrywide has reportedly risen little since the mid-
1990s, although some states have seen increases. By contrast, claim severity has increased
dramatically. National data from the Jury Verdict Reporter show that the median verdict in cases
taken to trial where the jury finds in favor of the patient more than doubled between 1995 and
2000 to about $1 million per case. The mean verdict was even higher. However, JVR relies
heavily on voluntary submission of information by trial attorneys and probably overemphasizes
large cases that attorneys want to publicize.12
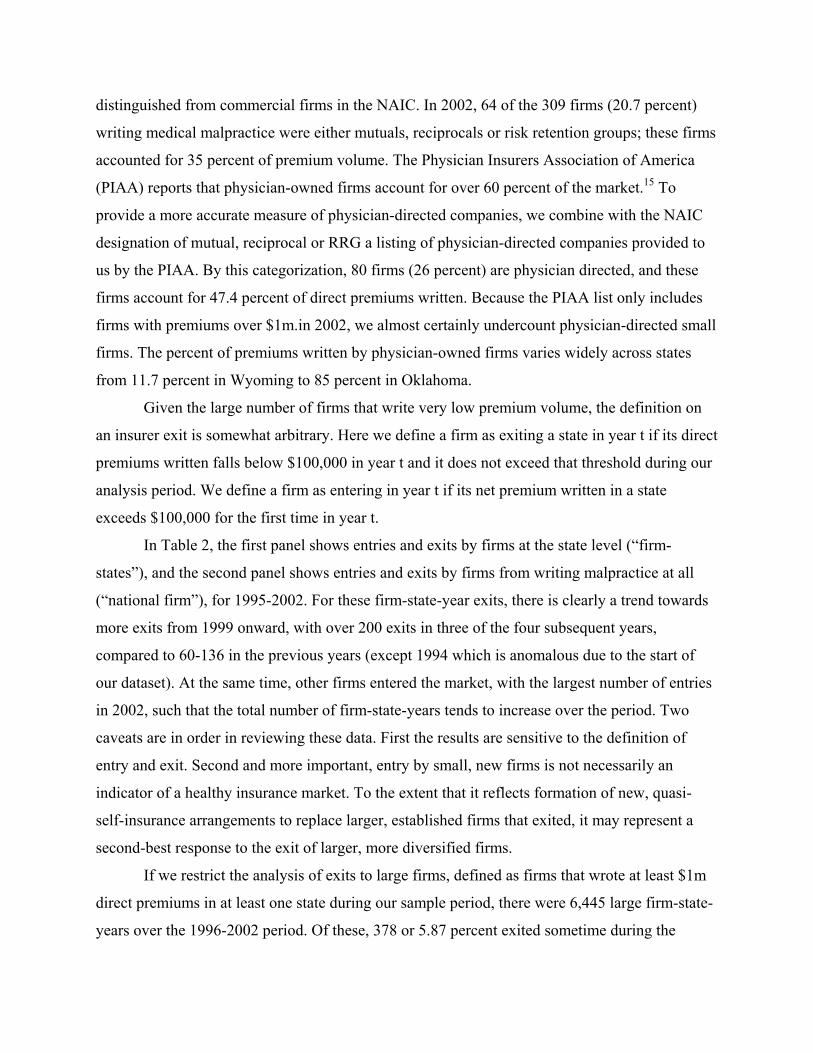
More representative data on total claim payments is available from the PIAA companies’
Data Sharing Project. This shows that median claim payment, in nominal dollars, increased from
$50,000 in 1990 to about $175,000 in 2001, more than a three-fold increase, while mean claim
payment increased from roughly $145,000 in 1990 to $315,000 in 2001 (see Table 5). Moreover,
these upward trends have been steady, except for a one-year drop in 1995. Claims exceeding
$1m were about eight percent of all claims paid for individual practitioners; the percentage has
doubled in the past four years.13 Assuming that these trends in claim severity for the PIAA
companies are reasonably representative of experience for all companies, this evidence suggests
that the decline in initial loss forecasts from 1994 through 2000 was at odds with available
evidence on trends in paid claims.
[Insert Figure 5:]
Since competitive premiums reflect the discounted value of expected losses, trends in
expected investment income may have contributed to this apparent failure of premiums and
initial loss forecasts to increase with paid losses. The PIAA data show that the ratio of net loss
plus loss adjustment expense (L+LAE) to surplus declined from 1995 through 1999. However,
according to NAIC data, L+LAE increased from 1995 through 1999 (except for a one-year
decline in 1997). Assuming that the PIAA L+LAE tracks the NAIC L+LAE, this suggests that
the decline in the L+LAE/surplus ratio was driven by increases in surplus. However, PIAA
report that 79 percent of their assets are in bonds.14 If this is true for most insurers, the increase
in equity values through 1999 would have had only modest effect on the portfolios of
malpractice insurers. However, GAO p.24 reports that “the second highest loss source for
medical malpractice insurers has been the relative decline in their bond-weighted investment
portfolios…. due to declining bond yields since 2000.” Thus declining bond yields may have
contributed but surely cannot fully explain the average increase in premium rates since 2000 or
the extreme experience in some states.
Insurers and Insurer Exits
Since the extent of the crisis varies significantly across states, our analysis of insurer exits
is at the state level and uses the firm-state as the unit of observation. Recall that our NAIC
sample includes all firms that reported at least $100,000 net premiums written in at least one
state over our 1994-2002 sample period. Our sample includes roughly 1,480-1,950 firm-states
per year or over 300 firms per year. The majority of these firms write very low premium volume.
Some may be “shells” that exist mainly to keep active a state license; however, for medical
malpractice, many of these small firms are physician-initiated, quasi self-insurance arrangements.
Unfortunately, the NAIC data do not reliably identify physician-directed firms because
many are now stock companies, even if they started out as mutuals or reciprocals. The NAIC
data characterizes firms as stock, mutual, risk retention group or other. By 2002, many of the
former physician-owned mutuals had converted to the stock form, hence cannot be reliably
distinguished from commercial firms in the NAIC. In 2002, 64 of the 309 firms (20.7 percent)
writing medical malpractice were either mutuals, reciprocals or risk retention groups; these firms
accounted for 35 percent of premium volume. The Physician Insurers Association of America
(PIAA) reports that physician-owned firms account for over 60 percent of the market.15 To
provide a more accurate measure of physician-directed companies, we combine with the NAIC
designation of mutual, reciprocal or RRG a listing of physician-directed companies provided to
us by the PIAA. By this categorization, 80 firms (26 percent) are physician directed, and these
firms account for 47.4 percent of direct premiums written. Because the PIAA list only includes
firms with premiums over $1m.in 2002, we almost certainly undercount physician-directed small
firms. The percent of premiums written by physician-owned firms varies widely across states
from 11.7 percent in Wyoming to 85 percent in Oklahoma.
Given the large number of firms that write very low premium volume, the definition on
an insurer exit is somewhat arbitrary. Here we define a firm as exiting a state in year t if its direct
premiums written falls below $100,000 in year t and it does not exceed that threshold during our
analysis period. We define a firm as entering in year t if its net premium written in a state
exceeds $100,000 for the first time in year t.
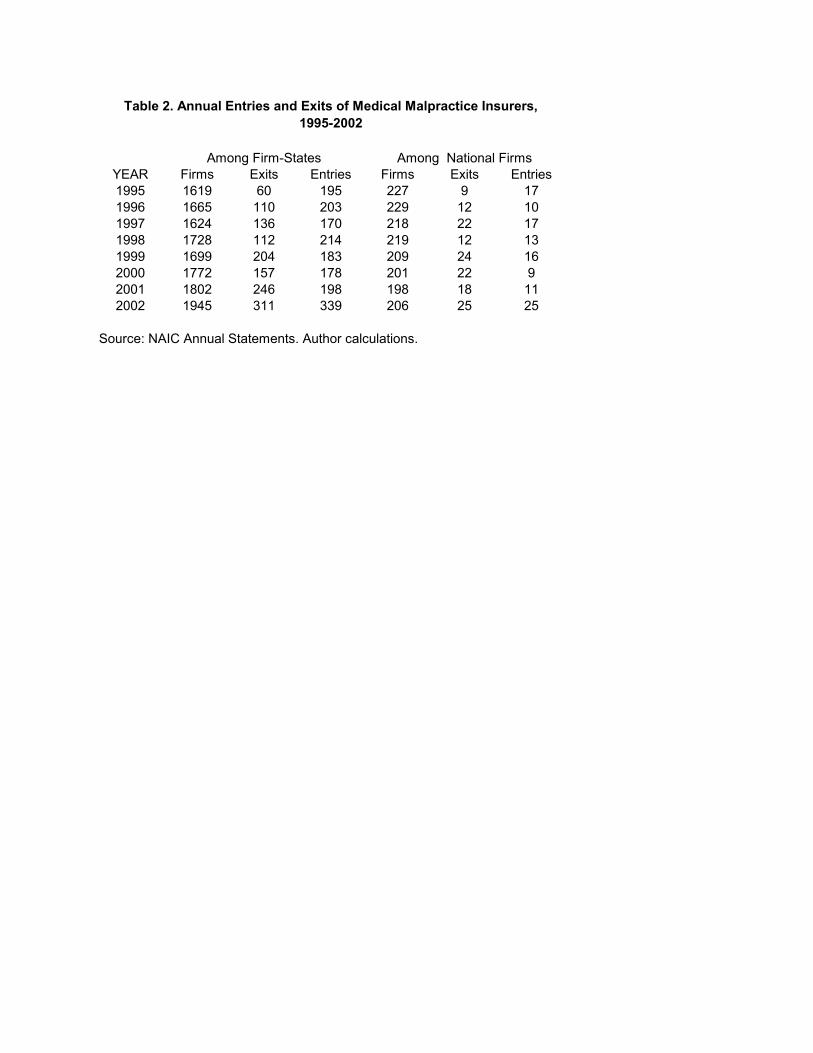
In Table 2, the first panel shows entries and exits by firms at the state level (“firm-
states”), and the second panel shows entries and exits by firms from writing malpractice at all
(“national firm”), for 1995-2002. For these firm-state-year exits, there is clearly a trend towards
more exits from 1999 onward, with over 200 exits in three of the four subsequent years,
compared to 60-136 in the previous years (except 1994 which is anomalous due to the start of
our dataset). At the same time, other firms entered the market, with the largest number of entries
in 2002, such that the total number of firm-state-years tends to increase over the period. Two
caveats are in order in reviewing these data. First the results are sensitive to the definition of
entry and exit. Second and more important, entry by small, new firms is not necessarily an
indicator of a healthy insurance market. To the extent that it reflects formation of new, quasi-
self-insurance arrangements to replace larger, established firms that exited, it may represent a
second-best response to the exit of larger, more diversified firms.
If we restrict the analysis of exits to large firms, defined as firms that wrote at least $1m
direct premiums in at least one state during our sample period, there were 6,445 large firm-state-
years over the 1996-2002 period. Of these, 378 or 5.87 percent exited sometime during the
period, and of these 207 or 55 percent exited in 2001-2002. The per year number of large firm-
state-years increased from 862 in 1996 to a maximum of 963 in 2001 and declined to 938 in
2002. Thus the exits of large firms were not fully replaced by new large firm entrants, with a
total reduction of 25 in 2002.
In order to distinguish an exit-from-states versus exit-from-the-malpractice-line (or
national exit) entirely, Table 2 also reports number of exits and entries by year with firms
aggregated to the national level, where an exit occurs when a firm exits all states. There is at
most weak evidence of an increasing trend towards exit at the end of the period; however
conclusions are tentative given the small sample size.
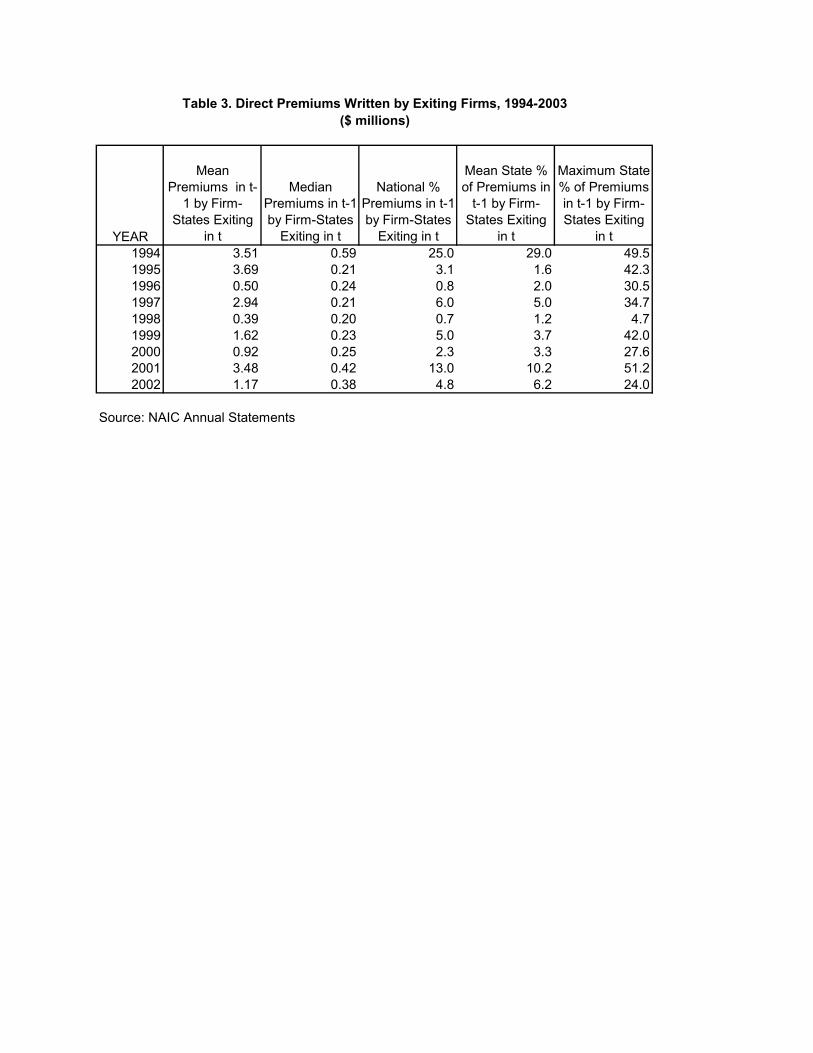
From the standpoint of physician customers, another measure of the disruption caused by
insurer exits is the share of direct premiums written by the exiting firms. Table 3 reports the
mean and median direct premiums written in year t-1 by firm-states exiting in year t, the
percentages of national and state premiums written by exiting firms, and the maximum market
share of exiting firms for any state. The mean premium share of exiting firms is clearly higher in
1999-2002 than in the preceding four year period, reaching 13 percent of national premiums in
2001, which was the year that the St. Paul withdrew. The maximum premium share of exiting
firms also reached a peak of 51.2 percent in 2001, and tends to be higher in the 1999-2002 period
than in the previous four years, but with significant year to year variation. Thus serious
disruption of availability due to firm exits has occurred but seems to have been limited to a small
number of states.
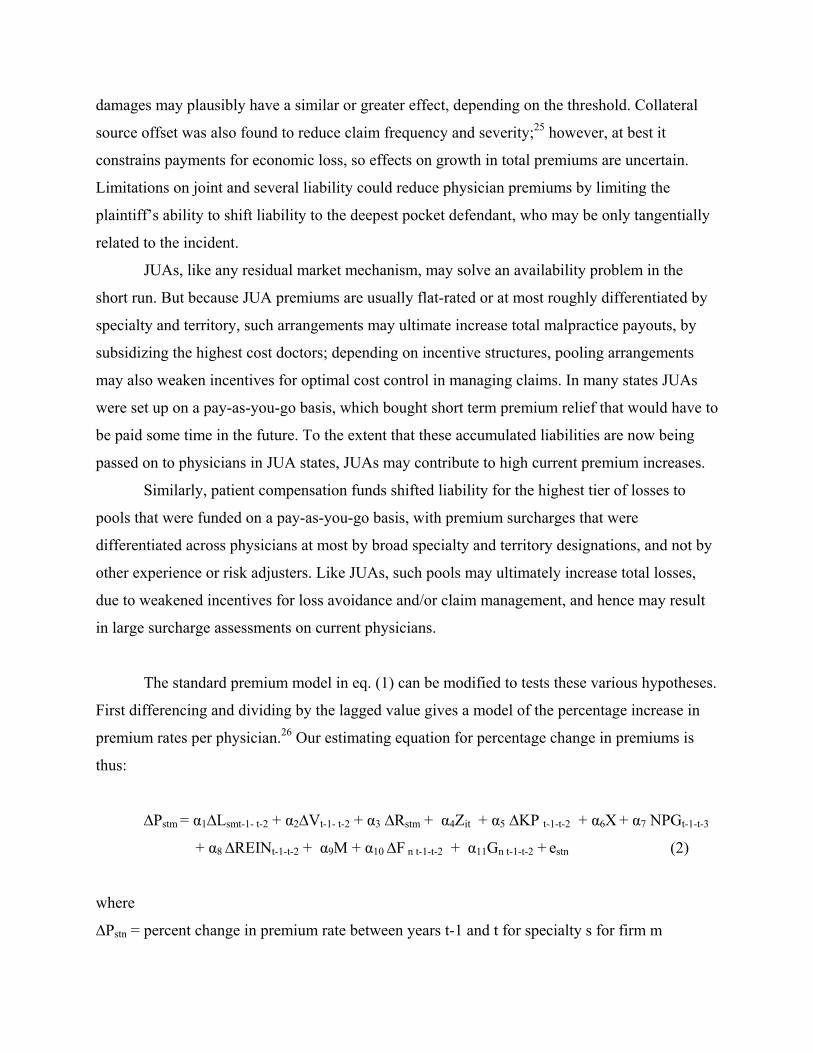
III. Theoretical Model of Malpractice Premium Setting
In the standard actuarial model of insurance rate setting16, the premium rate for specified
limits of coverage for a given specialty-state-year reflects the discounted expected losses plus
loss adjustment expense on the policy, which may depend on enacted state-level tort and
insurance market reforms, plus adjustments for taxes and overhead. Ignoring taxes and overhead,
this may be written:
Pstm = α1ELstm (Zit) + α2EVtm + ustm (1)
where
s = state
t = year
m = medical malpractice line
P = premium rate for given limits of coverage
EL = expected loss plus loss adjustment expense
Z = vector of tort and insurance market reforms that affect expected losses
EV = expected rate of return on invested assets
u = random error
This standard model predicts that premium increases should parallel increases in
expected losses and move inversely to expected investment income. It cannot explain the
observed cycles and crises in markets for liability insurance, including medical malpractice.
Several theories have been developed to explain, respectively, the hard phase of insurance cycles,
with overshooting on prices and insurer exits, and soft markets with undercharging relative to
discounted expected loss costs:
Capacity constraints The “capacity constraint” theory of hard markets17 starts off by
noting that insurance risk for liability lines is imperfectly diversifiable and that raising external
capital is more costly than internal capital. Insurers therefore hold capital reserves to ensure that
they can pay claims that exceed expected values. For reasons of both internal solvency concerns
and/or regulatory requirements, insurers have a target ratio of capital to premiums. In this model,
shocks to insurer capital, due to such factors as unexpected increases in claim liabilities for prior
policy years, lead to a contraction of capacity, reflected in a leftward shift of the short-run supply
of insurance. This can lead to premium increases in excess of increases in expected loss costs
and, in the extreme, to insurer exit. However, Winter’s empirical analysis of industry aggregate
data supports the prediction of an inverse relation between price of insurance and capitalization
for cycles prior to 1980 but not for the 1980s liability crisis.18 Gron’s analysis confirms the
theory for short tail lines but not for long tail lines.19
Cummins and Danzon extend this model to incorporate insolvency risk of insurers and a
demand for insurance that is positively related to financial quality.20 This model predicts a
positive relationship between a firm’s financial quality and the price of insurance. Their
empirical analysis of firm-level data for the period 1980-1988 is consistent with this model of
insurance as risky debt. Note that these studies measure the price of insurance by the loading
charge or ratio of premiums to discounted losses, whereas our focus here is on the absolute level
of premium rates. However, controlling for expected losses, the capacity constraint model
predicts a negative relationship between the (lagged) capital/premium ratio and the absolute
premium rate for given limits of coverage, whereas the risky debt model predicts a positive
relationship.
Underpricing due to Moral Hazard and/or Inexperience Harrington and Danzon test
and find some evidence to support the hypothesis that price cutting during the soft market may
reflect moral hazard and/or inexperienced forecasting that can cause some firms to price too low
and gain market share, leading to matching price cuts by other firms to protect their quasi rents in
the short run.21 Whether undercharging during soft markets contributes to hard markets, as these
risky firms either exit or raise premiums, was not tested. Here we test for effects on premium
increases and firm exits of loss forecast errors, inexperience and indicators of moral hazard or
risk taking.
Industry Structure and Corporate Control A question of considerable research and
policy interest is the extent to which physician-owned firms, which were formed in response to
prior crises, have behaved differently from commercial firms during the most recent crisis.
Theory suggests that mutuals may have informational advantages in selecting and disciplining
their members. They may also be better bearers of non-diversifiable risk,22 especially if they are
able to assess their members if prior reserves prove to be inadequate. However, physician-owned
companies take many forms and sizes and may have different strategies. Some are highly
selective whereas others are not. Moreover, many have converted to become stock firms. For
other lines of insurance and other types of financial institutions, such conversions have raised
questions of expropriation of policyholders. Thus, it is an open question whether physician-
directed companies now behave differently from stock companies.
Premium rate increases are sometimes blamed on insurer market power. We therefore test
for effects of insurer concentration, as measured by the Herfindahl index of premium volume, at
the state level.
Tort Reforms and Insurance Pooling Mechanisms Many states enacted tort
reforms in response to prior crises. Previous studies have found that caps on noneconomic
damages did reduce claim severity23 in the 1980s, and the bivariate analysis in GAO24 suggests
that states with caps under $300,000 experienced lower premium increases. Caps on total
damages may plausibly have a similar or greater effect, depending on the threshold. Collateral
source offset was also found to reduce claim frequency and severity;25 however, at best it
constrains payments for economic loss, so effects on growth in total premiums are uncertain.
Limitations on joint and several liability could reduce physician premiums by limiting the
plaintiff’s ability to shift liability to the deepest pocket defendant, who may be only tangentially
related to the incident.
JUAs, like any residual market mechanism, may solve an availability problem in the
short run. But because JUA premiums are usually flat-rated or at most roughly differentiated by
specialty and territory, such arrangements may ultimate increase total malpractice payouts, by
subsidizing the highest cost doctors; depending on incentive structures, pooling arrangements
may also weaken incentives for optimal cost control in managing claims. In many states JUAs
were set up on a pay-as-you-go basis, which bought short term premium relief that would have to
be paid some time in the future. To the extent that these accumulated liabilities are now being
passed on to physicians in JUA states, JUAs may contribute to high current premium increases.
Similarly, patient compensation funds shifted liability for the highest tier of losses to
pools that were funded on a pay-as-you-go basis, with premium surcharges that were
differentiated across physicians at most by broad specialty and territory designations, and not by
other experience or risk adjusters. Like JUAs, such pools may ultimately increase total losses,
due to weakened incentives for loss avoidance and/or claim management, and hence may result
in large surcharge assessments on current physicians.
The standard premium model in eq. (1) can be modified to tests these various hypotheses.
First differencing and dividing by the lagged value gives a model of the percentage increase in
premium rates per physician.26 Our estimating equation for percentage change in premiums is
thus:
∆Pstm = α1∆Lsmt-1- t-2 + α2∆Vt-1- t-2 + α3 ∆Rstm + α4Zit + α5 ∆KP t-1-t-2 + α6X + α7 NPGt-1-t-3
+ α8 ∆REINt-1-t-2 + α9M + α10 ∆F n t-1-t-2 + α11Gn t-1-t-2 + estn (2)
where
∆Pstn = percent change in premium rate between years t-1 and t for specialty s for firm m
∆Lstnt-1-t-2 = percent change in loss plus loss adjustment expense incurred between t-1 and t-2
∆Vn t-1-t-2 = percent change in rate of return on assets between t-1 and t-2
∆Rstn t-1-t-2 = percent change in loss paid between t-1 and t-2
Z s t-1 = vector of tort and insurance market reforms
∆KPn t-1-t-2 = percent change in the ratio of capital to net premiums written between t-1 and t-2
Xn t-1 = experience = quadratic of number of years since 1988 with premiums greater than $3m.
NPGn t-1-t-3 = percent growth in net premiums written countrywide between years t-1 and t-3
∆REINn t-1-t-2 = percent change in ratio of reinsurance recovered to net admitted assets between t-
1 and t-2.
M = dummy variable for mutual or other physician-sponsored company
∆Fn t-1-t-2 = change in average percent forecast error for policy years t-6 throught-4, between t-1
and t-2
Gn t-1-t-2 = average forcecast error
estn = random error
In eq. (2), we include loss plus loss adjustment expense incurred and loss paid in year t-1
as proxies for expected loss in year t. For the expected yield on invested assets we use the actual
investment gain (net investment income plus realized capital gains, net of tax) divided by total
assets in year t-1 to test for firm-specific effects. Economy-wide changes in yields on assets are
captured by year fixed effects.
As a measure of availability of capital, relative to exposure, we use the ratio of surplus to
total net premiums written. This ratio is used in the NAIC’s Financial Analysis Tracking System
(FAST) developed in the early 1990s for solvency screening and was also used in earlier
Insurance Regulatory Information System (IRIS). Since it measures total surplus and all-lines,
country-wide net premiums written, it reflects capital shocks from all lines, not just medical
malpractice and unrealized capital gains and losses.
We use two measures of loss forecast error. The average forecast error for policy years
t-6 to t-4 measures the absolute reserve shortfall for these three years. The average percent
forecast error for years t-6 to t-4, differenced, is the growth in this forecast error between years t-
2 and t-1. These forecast errors could reflect both unintended prediction error and/or intentional
understatement of initial losses. We included growth in net premiums written between t-3 and t-1
as a measure of riskiness (premium growth is one of the FAST measures of risk). As a measure
of experience in writing medical malpractice, we use the number of years since 1984 that this
firm has net premiums written for medical malpractice greater than $3m. The ratio of reinsurance
recovered to net admitted assets is included as a measure of risk taking, assuming that firms that
grow unduly rapidly may hide this growth from regulators by reinsurance, some of which may be
of dubious value.
We include indicator variables for four types of tort reforms: a cap on non-economic
damages at less than or equal to $500,000 and caps greater than $500,000; a cap on total
damages; collateral source offset; and modification of joint and several liability. These tort
reform variables indicate whether a particular reform had been enacted and not repealed in the
state in year t-1. We do not attempt to measure effects of changes in tort reforms because very
few states enacted changes during our sample period. Moreover, since caps and collateral source
offset should in theory limit the absolute level of awards, they should constrain the growth of
premiums. Indicator variables are also included for states with JUAs and patient compensation
funds.
We also use a Herfindahl measure of concentration at the state level. Standard models of
concentration imply that firms in more concentrated markets have greater market power, hence
may be able to raise premiums and should be less likely to exit. However, if forming self-
insurance arrangements is relatively low cost, potential entry should limit the ability of
established firms to exercise market power, in which case concentration measures based on
established firms provide an inaccurate measure of market power. Moreover, in states with JUAs,
concentration may be high due to regulation of rates to levels deemed inadequate by voluntary
insurers, in which case concentration would be an indicator of inadequate rather than excessive
rates.
We use the identical set of explanatory variables for the exit equation as for the premium
equation. This reflects and tests the underlying hypothesis, that the same factors that lead to
premium increases by financially solid firms may trigger exit by firms that are in greater
financial distress.
Estimation methods
The premium change equation is estimated using OLS with robust standard errors. We
also estimated results with clustering by firm-state-year. The exit equation is estimated using
maximum likelihood complementary log-log regression, with robust standard errors. The
coefficients from this procedure reflect the underlying proportional hazards of exit model and
taking the antilog of the coefficients yields hazard ratios. Results are also reported with standard
errors adjusted for clustering by firm.
We screened for outliers using two thresholds applied to the key explanatory variables
from NAIC: three standard deviations from the mean, and the highest and lowest percentile
values. Because of the large number of missing and outlier values for % Chg Losses Paid, we
included an indicator variable for outlier or missing values of this variable. Using both screens
reduced the number of state-year-firm-specialty observations for the premium change equation
from 1,320 to 1,170. Results were very similar using either the three-standard deviations screen
alone or both screens. Results were also generally robust to excluding the top and bottom fifth
percentile of observations. We report results here excluding outliers based on the two screens.
All dollar denominated variables are adjusted to 2002 using the GDP deflator.
IV Empirical Results
Premium Increases
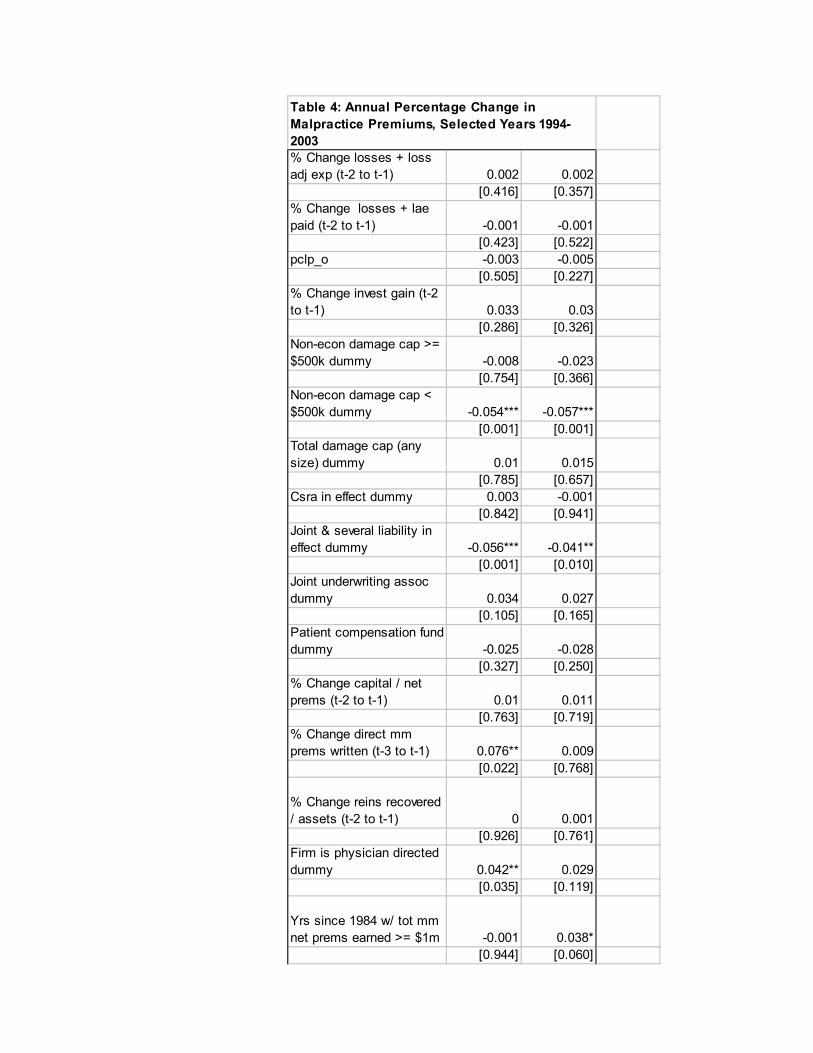
Table 4 reports the analysis of premium increases. The unit of observation is the percentage
increase in the premium rate for a specific firm-specialty-state-year. Both specifications exclude
outliers defined by the three standard deviation threshold and the top and bottom percentile of
the key financial variables; results are generally robust to excluding the lowest and highest fifth
percentile of observations, with exceptions noted below. All equations use robust standard errors
adjusted for firm, state and year. The first specification omits year fixed effects, which are added
in the second equation.
Actuarial model
The standard actuarial model, at least as proxied by our data, cannot explain the pattern of
premium increases for medical malpractice insurance. Premium increases are unrelated to state-
specific increases in (lagged) loss plus loss adjustment expense incurred or paid. Since the
equation controls roughly for revisions to reserves on prior policies countrywide, through the two
measures of change in forecast error, the change in state-specific loss incurred should measure
the growth in initial loss forecasts from t-2 to t-1 which, in theory, should reflect the firm’s
expectations of the growth in losses, assuming current loss forecasts are based on immediate
prior experience.
The change in investment yield is positive but insignificant, rather than negative as predicted,
assuming that prior firm-specific yields are a reasonable proxy for the firm’s expected future
yields and that these rates are passed on to policyholders through premiums. Finding no
significant effect of firm-specific yields on pricing is consistent with the alternative hypothesis,
that pricing is based on economy-wide investment yields, such as Treasury bill rates, and that
deviations of firm-specific yields from these economy-wide averages accrue to firms, not to
policyholders in competitive markets. In practice, the effects of time-varying but firm-invariant
variables, such as T-bill rates, cannot be distinguished from other year-specific effects.
The significant year fixed effects imply average premium rate increases of 12.1 percent, 21.6
percent and 26.8 percent, for 2001, 2002 and 2003, after controlling for increases in losses paid,
losses incurred and revisions to prior year reserves. This pattern is consistent with predicted
effects of a decline in expected asset yields, but the magnitude seems too large to reflect yield
effects alone.
Capacity constraint hypothesis
The change in the capital/premium ratio is also insignificant. Thus these data provide no
support for either the capacity constraint hypothesis, which posits a negative relationship
between prices and the capital/premium ratio, or to the insurance-as-risky-debt hypothesis, which
predicts that prices should be positively related to the capital/premium ratio.
Whether the finding of no significant effect on average conceals differential effects,
depending on the financial condition of the firm, will be tested in future work. For example, it is
possible that given some decline in a firm’s usual capital/premium ratio from its long run value,
a firm that is still in sound financial condition is able to raise prices somewhat, given costs to
policyholders of switching insurers. However, if the decline in the capital/premium ratio is
sufficient to threaten solvency, then the risky debt hypothesis may dominate, demand declines
and premiums cannot be increased, making exit rather than premium increases the likely
response for financially troubled firms. It is also possible that our failing to find any effect of the
premium/capital ratio reflects the fact that our dependent variable, the percentage increase in
premium levels, does not directly measure the price of insurance, which is more appropriately
measured by the loading charge or economic loss ratio. However, since our estimating equation
controls for percent change in loss plus loss adjustment expense incurred, the change in premium
rate controlling for change in L+LAE should measure the change in loading.
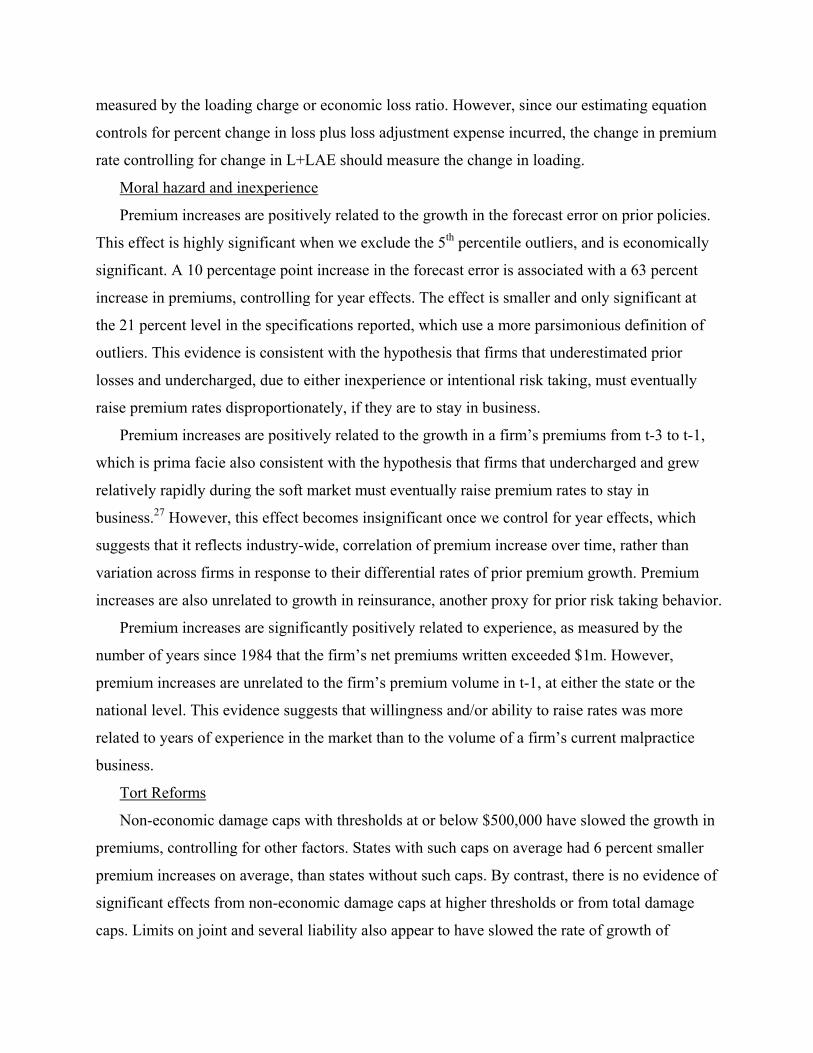
Moral hazard and inexperience
Premium increases are positively related to the growth in the forecast error on prior policies.
This effect is highly significant when we exclude the 5th percentile outliers, and is economically
significant. A 10 percentage point increase in the forecast error is associated with a 63 percent
increase in premiums, controlling for year effects. The effect is smaller and only significant at
the 21 percent level in the specifications reported, which use a more parsimonious definition of
outliers. This evidence is consistent with the hypothesis that firms that underestimated prior
losses and undercharged, due to either inexperience or intentional risk taking, must eventually
raise premium rates disproportionately, if they are to stay in business.
Premium increases are positively related to the growth in a firm’s premiums from t-3 to t-1,
which is prima facie also consistent with the hypothesis that firms that undercharged and grew
relatively rapidly during the soft market must eventually raise premium rates to stay in
business.27 However, this effect becomes insignificant once we control for year effects, which
suggests that it reflects industry-wide, correlation of premium increase over time, rather than
variation across firms in response to their differential rates of prior premium growth. Premium
increases are also unrelated to growth in reinsurance, another proxy for prior risk taking behavior.
Premium increases are significantly positively related to experience, as measured by the
number of years since 1984 that the firm’s net premiums written exceeded $1m. However,
premium increases are unrelated to the firm’s premium volume in t-1, at either the state or the
national level. This evidence suggests that willingness and/or ability to raise rates was more
related to years of experience in the market than to the volume of a firm’s current malpractice
business.
Tort Reforms
Non-economic damage caps with thresholds at or below $500,000 have slowed the growth in
premiums, controlling for other factors. States with such caps on average had 6 percent smaller
premium increases on average, than states without such caps. By contrast, there is no evidence of
significant effects from non-economic damage caps at higher thresholds or from total damage
caps. Limits on joint and several liability also appear to have slowed the rate of growth of
premiums: states with such limits on average had 4.1 percent lower annual premium increases
than states without such limits. Collateral source offset laws on average appear to have no effect.
It is possible that the more stringent of such laws do indeed have an effect, even though the
average effect is not significant.
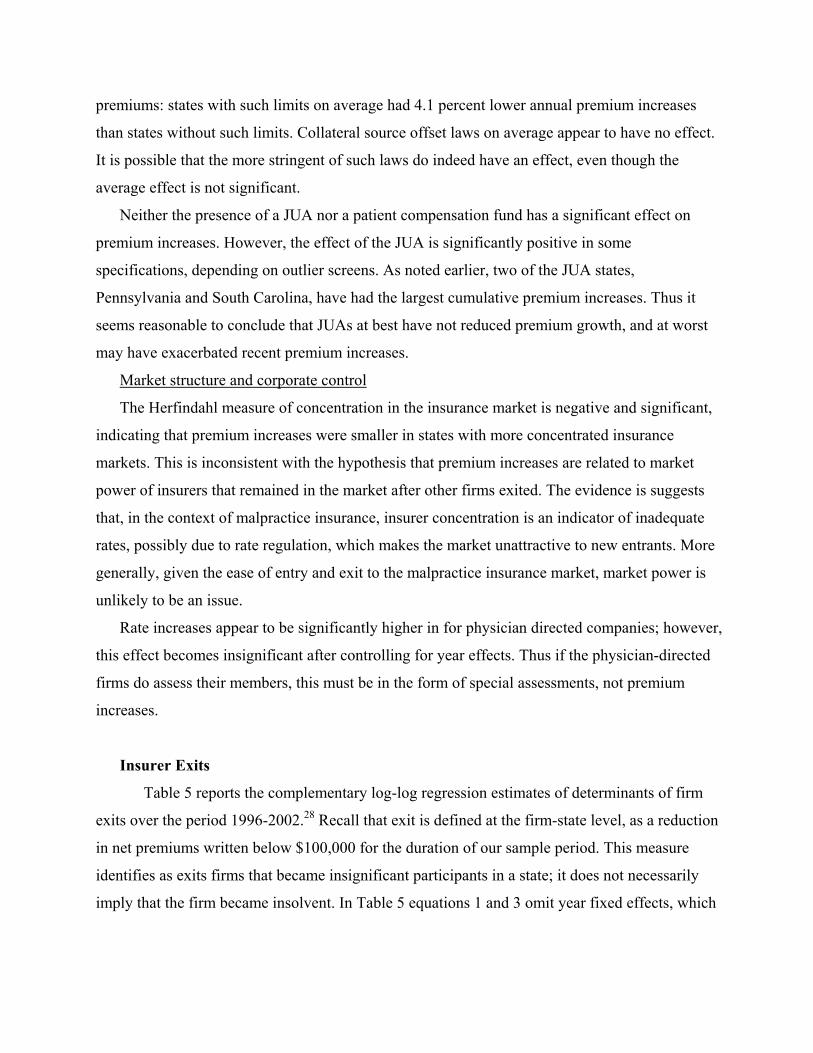
Neither the presence of a JUA nor a patient compensation fund has a significant effect on
premium increases. However, the effect of the JUA is significantly positive in some
specifications, depending on outlier screens. As noted earlier, two of the JUA states,
Pennsylvania and South Carolina, have had the largest cumulative premium increases. Thus it
seems reasonable to conclude that JUAs at best have not reduced premium growth, and at worst
may have exacerbated recent premium increases.
Market structure and corporate control
The Herfindahl measure of concentration in the insurance market is negative and significant,
indicating that premium increases were smaller in states with more concentrated insurance
markets. This is inconsistent with the hypothesis that premium increases are related to market
power of insurers that remained in the market after other firms exited. The evidence is suggests
that, in the context of malpractice insurance, insurer concentration is an indicator of inadequate
rates, possibly due to rate regulation, which makes the market unattractive to new entrants. More
generally, given the ease of entry and exit to the malpractice insurance market, market power is
unlikely to be an issue.
Rate increases appear to be significantly higher in for physician directed companies; however,
this effect becomes insignificant after controlling for year effects. Thus if the physician-directed
firms do assess their members, this must be in the form of special assessments, not premium
increases.
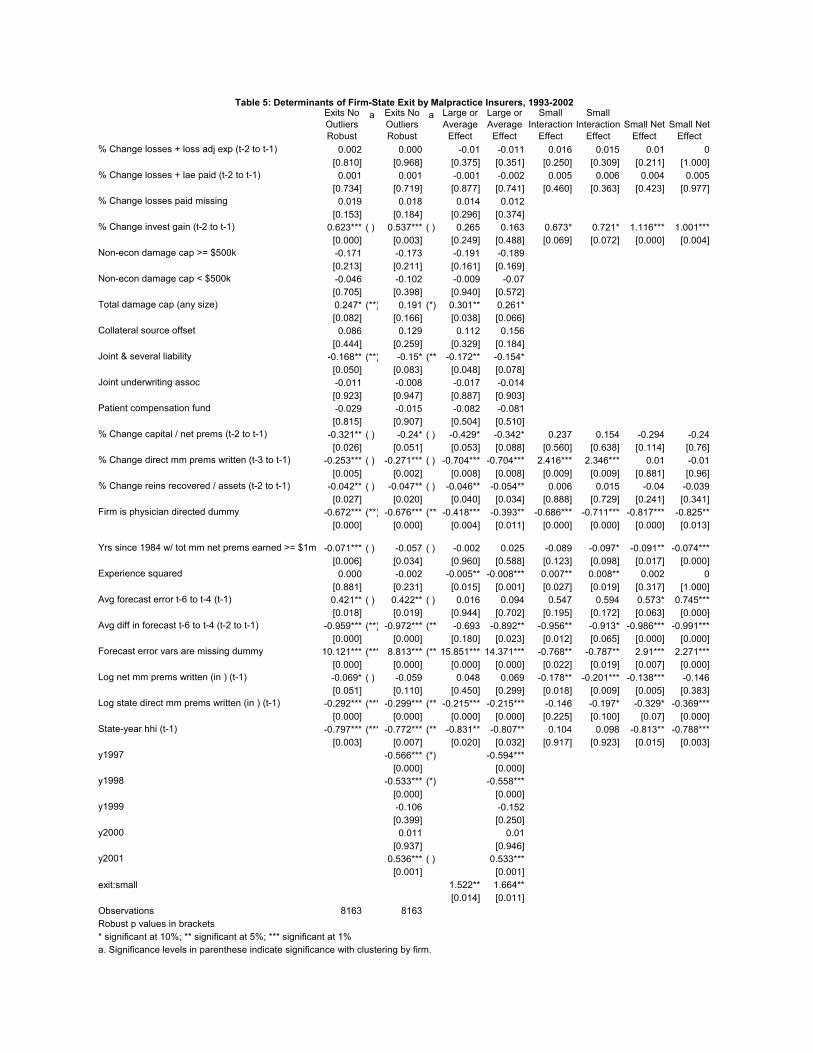
Insurer Exits
Table 5 reports the complementary log-log regression estimates of determinants of firm
exits over the period 1996-2002.28 Recall that exit is defined at the firm-state level, as a reduction
in net premiums written below $100,000 for the duration of our sample period. This measure
identifies as exits firms that became insignificant participants in a state; it does not necessarily
imply that the firm became insolvent. In Table 5 equations 1 and 3 omit year fixed effects, which

are included in equations 2 and 4. Adjusting for year fixed effects may overcontrol for some
variables that are highly correlated across firms over time, such as loss shocks or financial yields.
Equations 3 and 4 include interaction terms, to test for differential effects for small insurers,
defined as firms with under $1m. in direct premiums written in the state. Columns 3 and 4 report
the average or large firm effect, columns 5 and 6 report the small firm interaction effect, with p-
values on the tests for significant differences between small and large firms. Columns 7 and 8
report the net effect for small firms, with p-values on tests of whether these net effects for small
firms are significantly different from zero.
Reported p-values use robust standard errors for all equations. We also estimated
significance levels adjusting for within-firm clustering of standard errors; the columns labeled (a)
show significance levels with adjustment for within-firm clustering, if this adjustment changes
the significance level. The coefficients reported are e^beta - 1, which represents the percentage
change in hazard ratio for a one unit change in the independent variable.
Actuarial Model
Exits are unrelated to growth in lagged incurred or paid losses. Together with the similar
finding of no effect of incurred or paid losses on premium increases, this evidence suggests
either that recent state-specific loss experience is a poor proxy for expected future losses or that
state-specific loss experience is not a significant factor in a firm’s decision to increase premiums
or exit from a particular state.
Exits are significantly positively related to investment yield, which is inconsistent with
the hypothesis that declining investment yields precipitated exits, at least for realized returns.
However, this effect is concentrated on small firms. The effect becomes less significant when
year fixed effects are included and with clustering of standard errors within firms. Thus this may
simply reflect the occurrence of particular firm exits in years of positive investment gain.
Capacity Constraints
Exit is significantly negatively related to growth in the capital/premium ratio. The effect
is significant (before adjusting for firm clustering) and large: a one unit increase in the
capital/premium ratio is associated with a 32 percent (24 percent) reduction in the exit hazard,
without (with) controls for year fixed effects, and is not significantly different for small versus
large firms. Thus capacity constraints seem more likely to be associated with exits than with
premium increases. This is not surprising for malpractice insurance, since physician
policyholders are like to be aware of and concerned about an insurer’s financial quality and can
switch at relatively low cost to other firms or to self-insurance arrangements, rather than buy
from existing, impaired firms. This mobility of policyholders presumably constrains the ability
of impaired firms to raise premiums beyond prospectively fair levels to recoup prior losses and
restore their capital.
Several factors may have contributed to observed declines in capital/premium ratios.
Unrealized capital losses are included in the measure of capital. However, about 79 percent of
assets of PIAA insurers is in bonds29; if this is typical of other insurers, it seems unlikely that the
decline in equity values 2000-2002 would result in a significant shocks to insurer capital.
Unanticipated losses on lines of insurance other than medical malpractice may have played a role
for larger, multiline companies. However, the finding of no significant difference in the
capital/premium ratio coefficient for small vs. large companies suggests that losses on other lines
are not a major contributor, and that loss shock effect is more likely attributable to medical
malpractice.
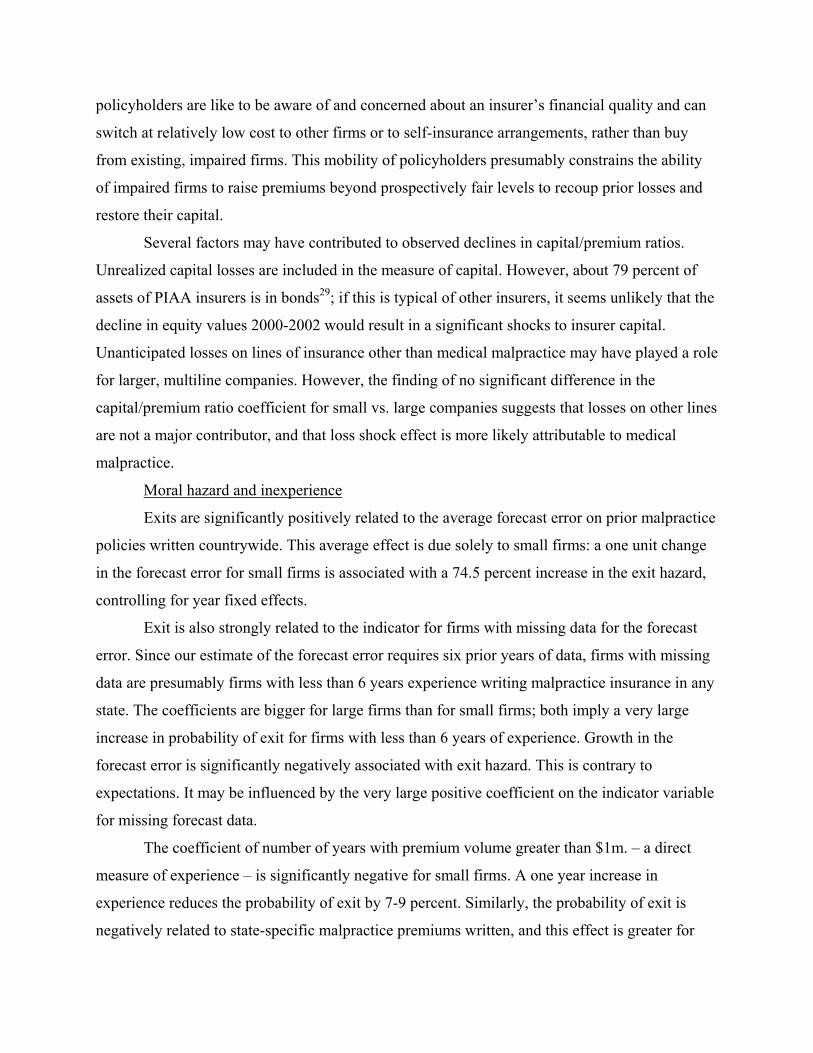
Moral hazard and inexperience
Exits are significantly positively related to the average forecast error on prior malpractice
policies written countrywide. This average effect is due solely to small firms: a one unit change
in the forecast error for small firms is associated with a 74.5 percent increase in the exit hazard,
controlling for year fixed effects.
Exit is also strongly related to the indicator for firms with missing data for the forecast
error. Since our estimate of the forecast error requires six prior years of data, firms with missing
data are presumably firms with less than 6 years experience writing malpractice insurance in any
state. The coefficients are bigger for large firms than for small firms; both imply a very large
increase in probability of exit for firms with less than 6 years of experience. Growth in the
forecast error is significantly negatively associated with exit hazard. This is contrary to
expectations. It may be influenced by the very large positive coefficient on the indicator variable
for missing forecast data.
The coefficient of number of years with premium volume greater than $1m. – a direct
measure of experience – is significantly negative for small firms. A one year increase in
experience reduces the probability of exit by 7-9 percent. Similarly, the probability of exit is
negatively related to state-specific malpractice premiums written, and this effect is greater for
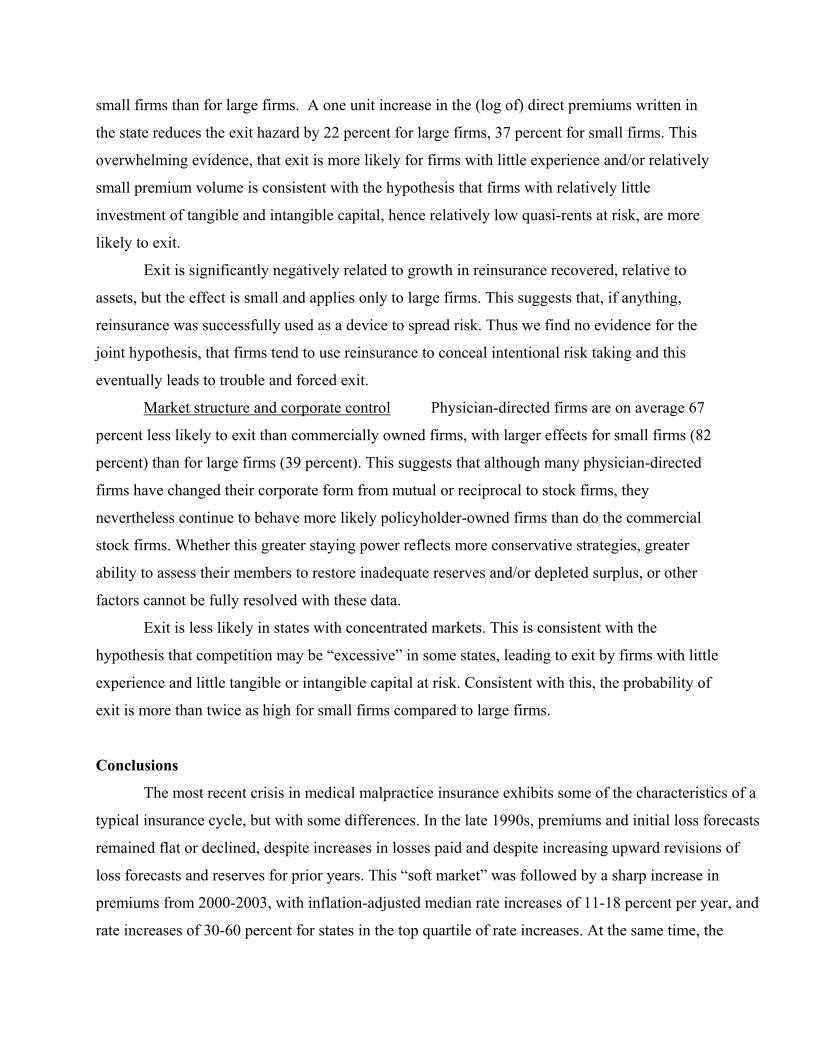
small firms than for large firms. A one unit increase in the (log of) direct premiums written in
the state reduces the exit hazard by 22 percent for large firms, 37 percent for small firms. This
overwhelming evidence, that exit is more likely for firms with little experience and/or relatively
small premium volume is consistent with the hypothesis that firms with relatively little
investment of tangible and intangible capital, hence relatively low quasi-rents at risk, are more
likely to exit.
Exit is significantly negatively related to growth in reinsurance recovered, relative to
assets, but the effect is small and applies only to large firms. This suggests that, if anything,
reinsurance was successfully used as a device to spread risk. Thus we find no evidence for the
joint hypothesis, that firms tend to use reinsurance to conceal intentional risk taking and this
eventually leads to trouble and forced exit.
Market structure and corporate control Physician-directed firms are on average 67
percent less likely to exit than commercially owned firms, with larger effects for small firms (82
percent) than for large firms (39 percent). This suggests that although many physician-directed
firms have changed their corporate form from mutual or reciprocal to stock firms, they
nevertheless continue to behave more likely policyholder-owned firms than do the commercial
stock firms. Whether this greater staying power reflects more conservative strategies, greater
ability to assess their members to restore inadequate reserves and/or depleted surplus, or other
factors cannot be fully resolved with these data.
Exit is less likely in states with concentrated markets. This is consistent with the
hypothesis that competition may be “excessive” in some states, leading to exit by firms with little
experience and little tangible or intangible capital at risk. Consistent with this, the probability of
exit is more than twice as high for small firms compared to large firms.
Conclusions
The most recent crisis in medical malpractice insurance exhibits some of the characteristics of a
typical insurance cycle, but with some differences. In the late 1990s, premiums and initial loss forecasts
remained flat or declined, despite increases in losses paid and despite increasing upward revisions of
loss forecasts and reserves for prior years. This “soft market” was followed by a sharp increase in
premiums from 2000-2003, with inflation-adjusted median rate increases of 11-18 percent per year, and
rate increases of 30-60 percent for states in the top quartile of rate increases. At the same time, the
number of firms exiting the market increased, including many small firms with relatively low premium
volume and little experience but also the exit of several very large firms, including the St. Paul that had
business in over 40 states.
This pattern is typical of insurance cycles and our analysis of premium increases and insurer
exits supports some of the hypotheses that have been developed to explain such cycles. Perhaps
surprisingly, state-specific premium rate increases are not significantly related to prior increases in state-
specific losses paid or incurred, contrary to standard models of insurance pricing.
The evidence also provides no support for the capacity constraint theory, that rate increases are
associated with shocks to an insurer’s capital/premium ratio. However, such loss shocks are associated
with insurer exits. Taken together, this evidence suggests that firms that experienced significant declines
in their premium/surplus ratio were unable to increase premiums to restore surplus and hence were more
likely to exit. Given the relative ease with which physician policyholders can switch to self-insurance
arrangements and, more generally, the apparent ease with which new firms enter the medical
malpractice insurance market, it is unsurprising that established firms that experience shocks to their
surplus are unable to recoup these losses by raising premiums.
There is considerable support for the hypothesis that some of the problems of the crisis or hard
market originated in the prior soft market period. We find that premium increases were positively related
to increases in reserve adjustments due to prior loss forecast errors and exit probabilities are
significantly positively related to the average loss forecast error. These findings are consistent with the
hypothesis that underreserving in the years of the soft market contributed to the premium increases and
insurer exits of the hard market. How far this underreserving reflects inexperience of new firms versus
intentional undercharging to gain market share is not fully resolved here. However, we do find that firms
with few years of experience and low premium volume, hence firms with relatively little experience and
relatively low tangible and intangible capital at risk were much more likely to exit. The theory of
competitive price cutting implies that undercharging by some firms in the market can lead to matching
price cuts by other firms, to preserve market share and quasi-rents, which may in turn lead to large
premium increases and to exit of the weakest firms. The evidence here is broadly consistent with this
model; however, conclusions are tentative, because our analysis so far does not directly incorporate
premium changes over the 1998-2000 period.
Although the malpractice crisis is broadly consistent with models of insurance crises more
generally, it has been mitigated by certain features specific to medical malpractice. In particular, two
types of tort reform – non-economic damage caps with thresholds at or below $500,000 and limits on
joint and several liability have significantly reduced premium increases in states that enacted such
reforms. By contrast, non-economic damage caps at higher levels and total damage caps appear to have
had no effect. Finding no effect of total damage caps may reflect the small number of states with such
caps. The policy case for these reforms depends on their effects on the incidence of malpractice, which
is discussed elsewhere, in addition to their effects on premium levels and increases demonstrated here.
Insurance market regulations, including JUAs and patient compensation funds, have clearly not
reduced premium increases overall or reduced exit probabilities. Whether these mechanisms have tended
to increase costs remains an open question. Two states with JUAs (Pennsylvania and South Carolina)
had among the largest cumulative premium increases over the period. This plausibly reflects the lagged
effects of these pay-as-you-go mechanisms, which tend to shift losses to future years and may increase
total loss payouts, if these pooling mechanisms undermine incentives for loss prevention and for claims
management. More detailed analysis of the effects of these mechanisms is warranted but is beyond the
scope of this paper.
In contrast to these mandatory pools, the voluntary insurance market changes have had an effect.
In particular, physician directed firms were much less likely to exit and this effect is greater for
physician-directed firms in the small firm subset than among larger firms. Thus to the extent that entry,
undercharging and subsequent exit of inexperienced small firms has contributed to the problems in this
market, the evidence suggests that this problem applies less to physician directed firms than to
commercial firms.
If these tentative conclusions are correct, that entry and subsequent exit of small, inexperienced
firms have contributed to the soft and hard market periods experienced in medical malpractice,
appropriate policy response would have to weigh the competitive benefits of easy entry and exit, against
the costs, if indeed inexperienced players with little to lose do exacerbate insurance cycles.
.
Year Specialty
Median Premium
Level25th
percentile Median75th
percentile MaxIM 6,075 0.0 5.4 9.7 27.8
1994 GS 22,269 0.0 2.5 6.5 35.5OBG 39,122 0.0 3.0 6.9 40.0IM 6,367 0.0 2.4 7.1 16.0
1996 GS 24,598 0.0 2.2 6.9 34.3OBG 39,502 0.0 0.9 5.0 16.0IM 6,706 0.0 0.3 5.1 34.9
1997 GS 24,067 0.0 0.6 5.0 15.0OBG 39,318 0.0 0.0 4.3 15.0IM 6,230 n/a n/a n/a n/a
2000 GS 24,066 n/a n/a n/a n/aOBG 40,503 n/a n/a n/a n/aIM 6,970 0.0 6.4 12.5 62.5
2001 GS 26,030 0.0 6.1 13.5 62.5OBG 40,569 0.0 5.0 11.5 62.5IM 7,544 6.5 13.0 33.7 59.3
2002 GS 27,922 5.0 11.0 29.3 57.5OBG 42,928 6.0 11.2 26.5 60.7IM 9,000 8.5 16.9 25.5 43.8
2003 GS 33,297 10.8 18.0 25.2 42.0OBG 53,630 8.9 16.8 23.4 42.0
Source: Medical Liability Monitor Annual Surveys
Annual Percent Change
a. Rates for $1m/$3m claim made policy, unadjusted for discounts and dividends, by state. Author calculations of distribution across states.
Table 1. Average Malpractice Premium Level and Percentage Increase, by Year and Specialtya
YEAR Firms Exits Entries Firms Exits Entries1995 1619 60 195 227 9 171996 1665 110 203 229 12 101997 1624 136 170 218 22 171998 1728 112 214 219 12 131999 1699 204 183 209 24 162000 1772 157 178 201 22 92001 1802 246 198 198 18 112002 1945 311 339 206 25 25
Source: NAIC Annual Statements. Author calculations.
Among Firm-States Among National Firms
Table 2. Annual Entries and Exits of Medical Malpractice Insurers, 1995-2002
YEAR
Mean Premiums in t-
1 by Firm-States Exiting
in t
Median Premiums in t-1 by Firm-States
Exiting in t
National % Premiums in t-1 by Firm-States
Exiting in t
Mean State % of Premiums in
t-1 by Firm-States Exiting
in t
Maximum State % of Premiums in t-1 by Firm-States Exiting
in t 1994 3.51 0.59 25.0 29.0 49.51995 3.69 0.21 3.1 1.6 42.31996 0.50 0.24 0.8 2.0 30.51997 2.94 0.21 6.0 5.0 34.71998 0.39 0.20 0.7 1.2 4.71999 1.62 0.23 5.0 3.7 42.02000 0.92 0.25 2.3 3.3 27.62001 3.48 0.42 13.0 10.2 51.22002 1.17 0.38 4.8 6.2 24.0
Source: NAIC Annual Statements
Table 3. Direct Premiums Written by Exiting Firms, 1994-2003 ($ millions)
% Change losses + loss adj exp (t-2 to t-1) 0.002 0.002
[0.416] [0.357]% Change losses + lae paid (t-2 to t-1) -0.001 -0.001
[0.423] [0.522]pclp_o -0.003 -0.005
[0.505] [0.227]% Change invest gain (t-2 to t-1) 0.033 0.03
[0.286] [0.326]Non-econ damage cap >= $500k dummy -0.008 -0.023
[0.754] [0.366]Non-econ damage cap < $500k dummy -0.054*** -0.057***
[0.001] [0.001]Total damage cap (any size) dummy 0.01 0.015
[0.785] [0.657]Csra in effect dummy 0.003 -0.001
[0.842] [0.941]Joint & several liability in effect dummy -0.056*** -0.041**
[0.001] [0.010]Joint underwriting assoc dummy 0.034 0.027
[0.105] [0.165]Patient compensation fund dummy -0.025 -0.028
[0.327] [0.250]% Change capital / net prems (t-2 to t-1) 0.01 0.011
[0.763] [0.719]% Change direct mm prems written (t-3 to t-1) 0.076** 0.009
[0.022] [0.768]
% Change reins recovered / assets (t-2 to t-1) 0 0.001
[0.926] [0.761]Firm is physician directed dummy 0.042** 0.029
[0.035] [0.119]
Yrs since 1984 w/ tot mm net prems earned >= $1m -0.001 0.038*
[0.944] [0.060]
Table 4: Annual Percentage Change in Malpractice Premiums, Selected Years 1994-2003
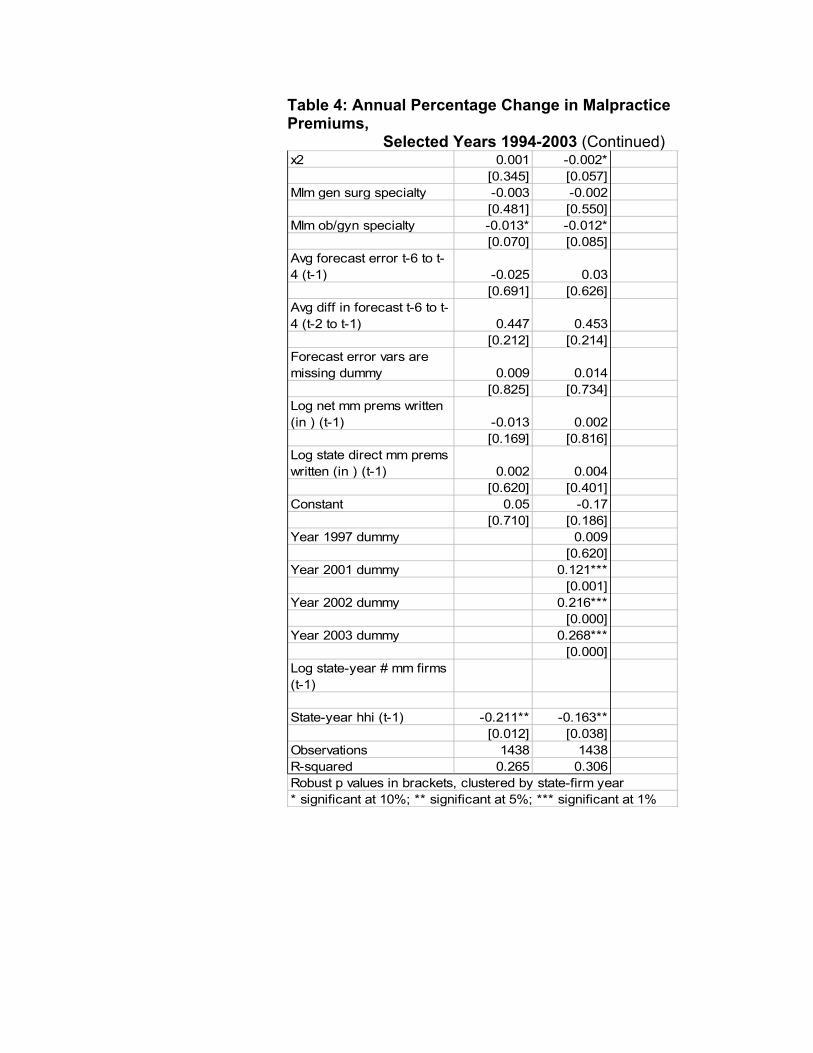
Table 4: Annual Percentage Change in Malpractice Premiums,
Selected Years 1994-2003 (Continued) x2 0.001 -0.002*
[0.345] [0.057]Mlm gen surg specialty -0.003 -0.002
[0.481] [0.550]Mlm ob/gyn specialty -0.013* -0.012*
[0.070] [0.085]Avg forecast error t-6 to t-4 (t-1) -0.025 0.03
[0.691] [0.626]Avg diff in forecast t-6 to t-4 (t-2 to t-1) 0.447 0.453
[0.212] [0.214]Forecast error vars are missing dummy 0.009 0.014
[0.825] [0.734]Log net mm prems written (in ) (t-1) -0.013 0.002
[0.169] [0.816]Log state direct mm prems written (in ) (t-1) 0.002 0.004
[0.620] [0.401]Constant 0.05 -0.17
[0.710] [0.186]Year 1997 dummy 0.009
[0.620]Year 2001 dummy 0.121***
[0.001]Year 2002 dummy 0.216***
[0.000]Year 2003 dummy 0.268***
[0.000]Log state-year # mm firms (t-1)
State-year hhi (t-1) -0.211** -0.163**[0.012] [0.038]
Observations 1438 1438R-squared 0.265 0.306Robust p values in brackets, clustered by state-firm year* significant at 10%; ** significant at 5%; *** significant at 1%

Exits No Outliers Robust
a Exits No Outliers Robust
a Large or Average
Effect
Large or Average
Effect
Small Interaction
Effect
Small Interaction
EffectSmall Net
EffectSmall Net
Effect% Change losses + loss adj exp (t-2 to t-1) 0.002 0.000 -0.01 -0.011 0.016 0.015 0.01 0
[0.810] [0.968] [0.375] [0.351] [0.250] [0.309] [0.211] [1.000]% Change losses + lae paid (t-2 to t-1) 0.001 0.001 -0.001 -0.002 0.005 0.006 0.004 0.005
[0.734] [0.719] [0.877] [0.741] [0.460] [0.363] [0.423] [0.977]% Change losses paid missing 0.019 0.018 0.014 0.012
[0.153] [0.184] [0.296] [0.374]% Change invest gain (t-2 to t-1) 0.623*** ( ) 0.537*** ( ) 0.265 0.163 0.673* 0.721* 1.116*** 1.001***
[0.000] [0.003] [0.249] [0.488] [0.069] [0.072] [0.000] [0.004]Non-econ damage cap >= $500k -0.171 -0.173 -0.191 -0.189
[0.213] [0.211] [0.161] [0.169]Non-econ damage cap < $500k -0.046 -0.102 -0.009 -0.07
[0.705] [0.398] [0.940] [0.572]Total damage cap (any size) 0.247* (**) 0.191 (*) 0.301** 0.261*
[0.082] [0.166] [0.038] [0.066]Collateral source offset 0.086 0.129 0.112 0.156
[0.444] [0.259] [0.329] [0.184]Joint & several liability -0.168** (**) -0.15* (**) -0.172** -0.154*
[0.050] [0.083] [0.048] [0.078]Joint underwriting assoc -0.011 -0.008 -0.017 -0.014
[0.923] [0.947] [0.887] [0.903]Patient compensation fund -0.029 -0.015 -0.082 -0.081
[0.815] [0.907] [0.504] [0.510]% Change capital / net prems (t-2 to t-1) -0.321** ( ) -0.24* ( ) -0.429* -0.342* 0.237 0.154 -0.294 -0.24
[0.026] [0.051] [0.053] [0.088] [0.560] [0.638] [0.114] [0.76]% Change direct mm prems written (t-3 to t-1) -0.253*** ( ) -0.271*** ( ) -0.704*** -0.704*** 2.416*** 2.346*** 0.01 -0.01
[0.005] [0.002] [0.008] [0.008] [0.009] [0.009] [0.881] [0.96]% Change reins recovered / assets (t-2 to t-1) -0.042** ( ) -0.047** ( ) -0.046** -0.054** 0.006 0.015 -0.04 -0.039
[0.027] [0.020] [0.040] [0.034] [0.888] [0.729] [0.241] [0.341]Firm is physician directed dummy -0.672*** (**) -0.676*** (**) -0.418*** -0.393** -0.686*** -0.711*** -0.817*** -0.825**
[0.000] [0.000] [0.004] [0.011] [0.000] [0.000] [0.000] [0.013]
Yrs since 1984 w/ tot mm net prems earned >= $1m -0.071*** ( ) -0.057 ( ) -0.002 0.025 -0.089 -0.097* -0.091** -0.074***[0.006] [0.034] [0.960] [0.588] [0.123] [0.098] [0.017] [0.000]
Experience squared 0.000 -0.002 -0.005** -0.008*** 0.007** 0.008** 0.002 0[0.881] [0.231] [0.015] [0.001] [0.027] [0.019] [0.317] [1.000]
Avg forecast error t-6 to t-4 (t-1) 0.421** ( ) 0.422** ( ) 0.016 0.094 0.547 0.594 0.573* 0.745***[0.018] [0.019] [0.944] [0.702] [0.195] [0.172] [0.063] [0.000]
Avg diff in forecast t-6 to t-4 (t-2 to t-1) -0.959*** (**) -0.972*** (**) -0.693 -0.892** -0.956** -0.913* -0.986*** -0.991***[0.000] [0.000] [0.180] [0.023] [0.012] [0.065] [0.000] [0.000]
Forecast error vars are missing dummy 10.121*** (*** 8.813*** (**)15.851*** 14.371*** -0.768** -0.787** 2.91*** 2.271***[0.000] [0.000] [0.000] [0.000] [0.022] [0.019] [0.007] [0.000]
Log net mm prems written (in ) (t-1) -0.069* ( ) -0.059 0.048 0.069 -0.178** -0.201*** -0.138*** -0.146[0.051] [0.110] [0.450] [0.299] [0.018] [0.009] [0.005] [0.383]
Log state direct mm prems written (in ) (t-1) -0.292*** (*** -0.299*** (*** -0.215*** -0.215*** -0.146 -0.197* -0.329* -0.369***[0.000] [0.000] [0.000] [0.000] [0.225] [0.100] [0.07] [0.000]
State-year hhi (t-1) -0.797*** (*** -0.772*** (*** -0.831** -0.807** 0.104 0.098 -0.813** -0.788***[0.003] [0.007] [0.020] [0.032] [0.917] [0.923] [0.015] [0.003]
y1997 -0.566*** (*) -0.594***[0.000] [0.000]
y1998 -0.533*** (*) -0.558***[0.000] [0.000]
y1999 -0.106 -0.152[0.399] [0.250]
y2000 0.011 0.01[0.937] [0.946]
y2001 0.536*** ( ) 0.533***[0.001] [0.001]
exit:small 1.522** 1.664**[0.014] [0.011]
Observations 8163 8163Robust p values in brackets* significant at 10%; ** significant at 5%; *** significant at 1%a. Significance levels in parenthese indicate significance with clustering by firm.
Table 5: Determinants of Firm-State Exit by Malpractice Insurers, 1993-2002
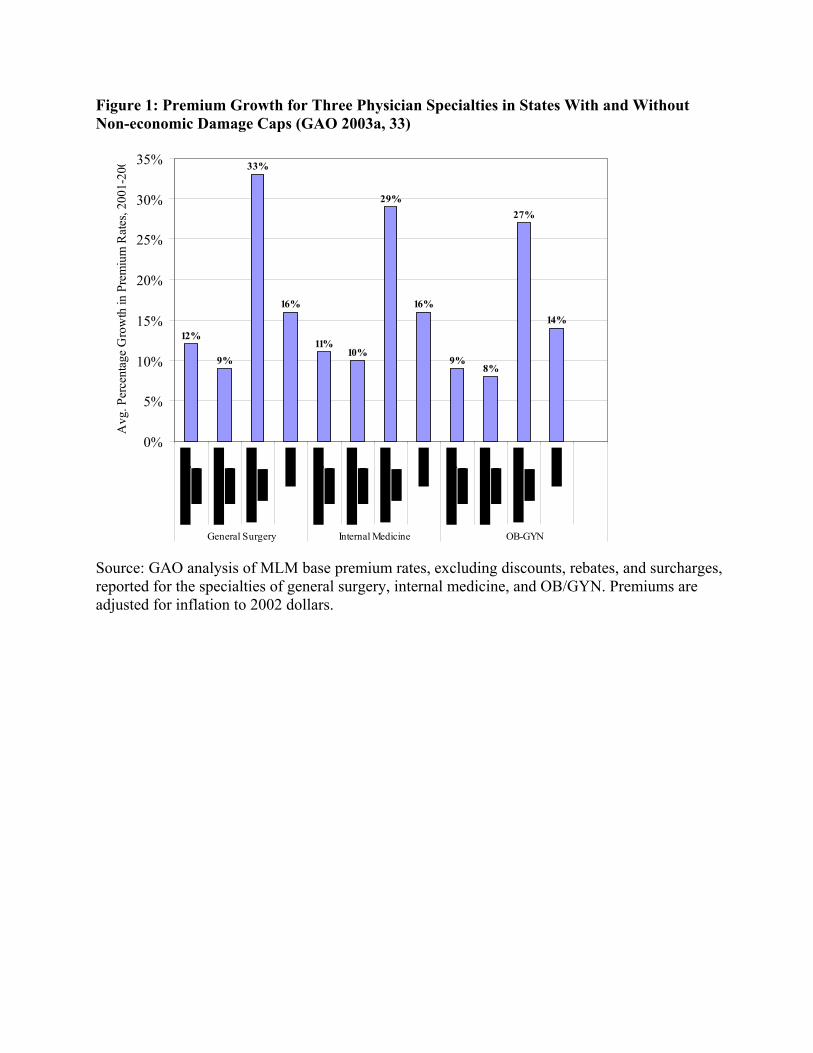
Figure 1: Premium Growth for Three Physician Specialties in States With and Without Non-economic Damage Caps (GAO 2003a, 33)
12%
9%
33%
16%
11%10%
29%
16%
9%8%
27%
14%
0%
5%
10%
15%
20%
25%
30%
35%
General Surgery Internal Medicine OB-GYN
Avg
. Per
cent
age
Gro
wth
in P
rem
ium
Rat
es, 2
001-
200
Source: GAO analysis of MLM base premium rates, excluding discounts, rebates, and surcharges, reported for the specialties of general surgery, internal medicine, and OB/GYN. Premiums are adjusted for inflation to 2002 dollars.
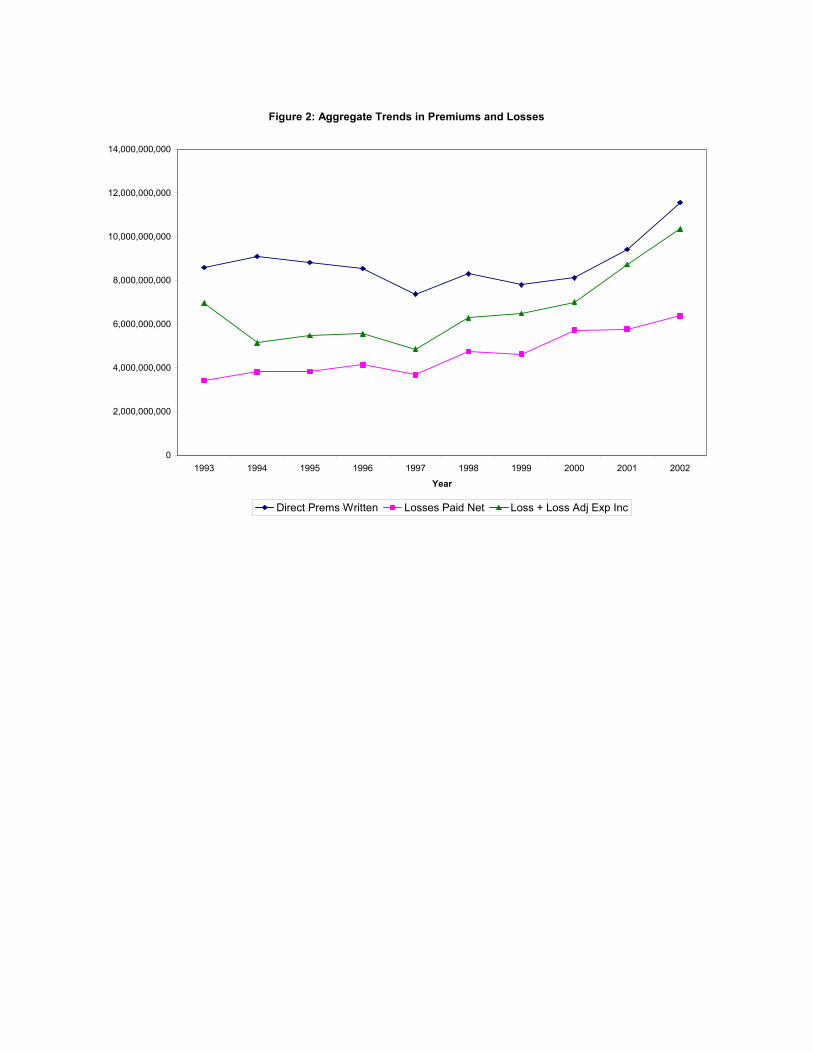
Figure 2: Aggregate Trends in Premiums and Losses
0
2,000,000,000
4,000,000,000
6,000,000,000
8,000,000,000
10,000,000,000
12,000,000,000
14,000,000,000
1993 1994 1995 1996 1997 1998 1999 2000 2001 2002
Year
Direct Prems Written Losses Paid Net Loss + Loss Adj Exp Inc
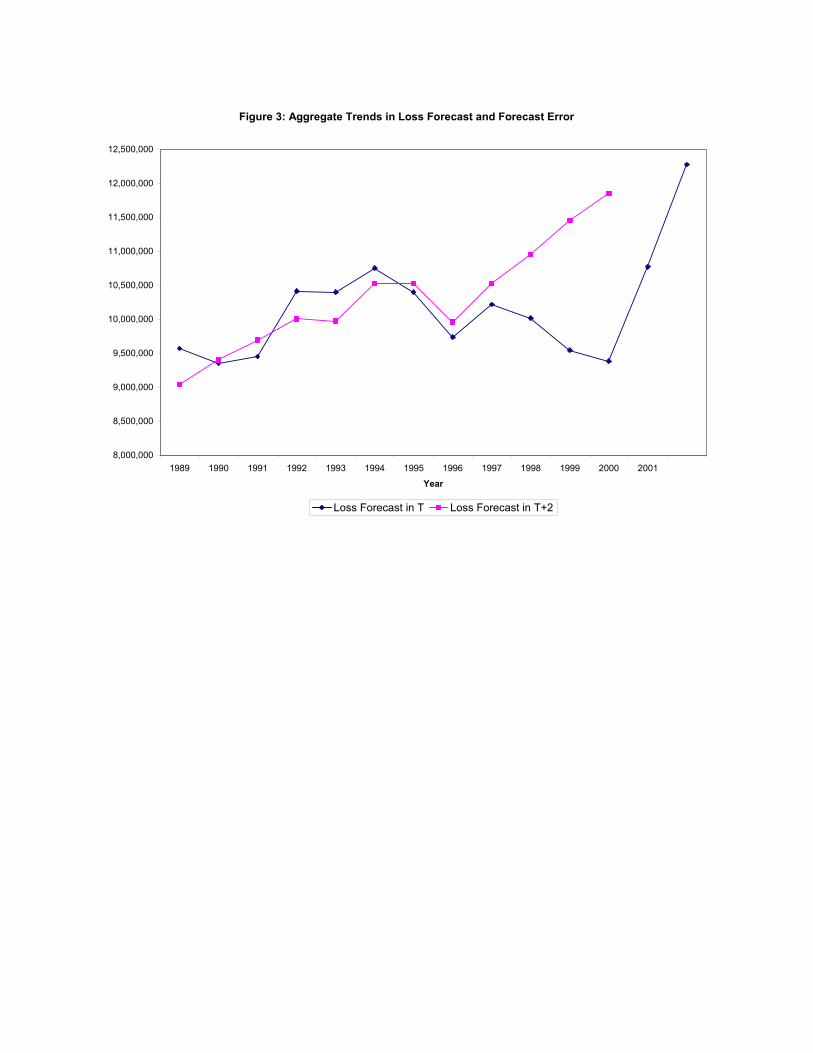
Figure 3: Aggregate Trends in Loss Forecast and Forecast Error
8,000,000
8,500,000
9,000,000
9,500,000
10,000,000
10,500,000
11,000,000
11,500,000
12,000,000
12,500,000
1989 1990 1991 1992 1993 1994 1995 1996 1997 1998 1999 2000 2001
Year
Loss Forecast in T Loss Forecast in T+2
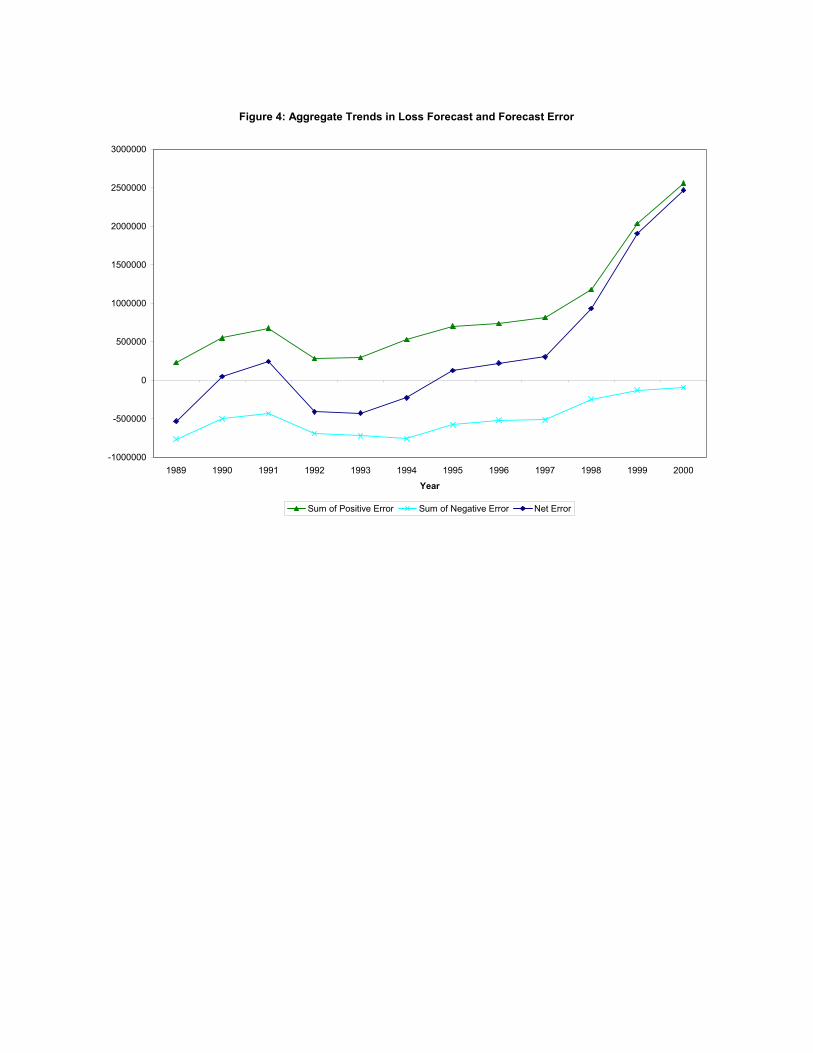
Figure 4: Aggregate Trends in Loss Forecast and Forecast Error
-1000000
-500000
0
500000
1000000
1500000
2000000
2500000
3000000
1989 1990 1991 1992 1993 1994 1995 1996 1997 1998 1999 2000
Year
Sum of Positive Error Sum of Negative Error Net Error
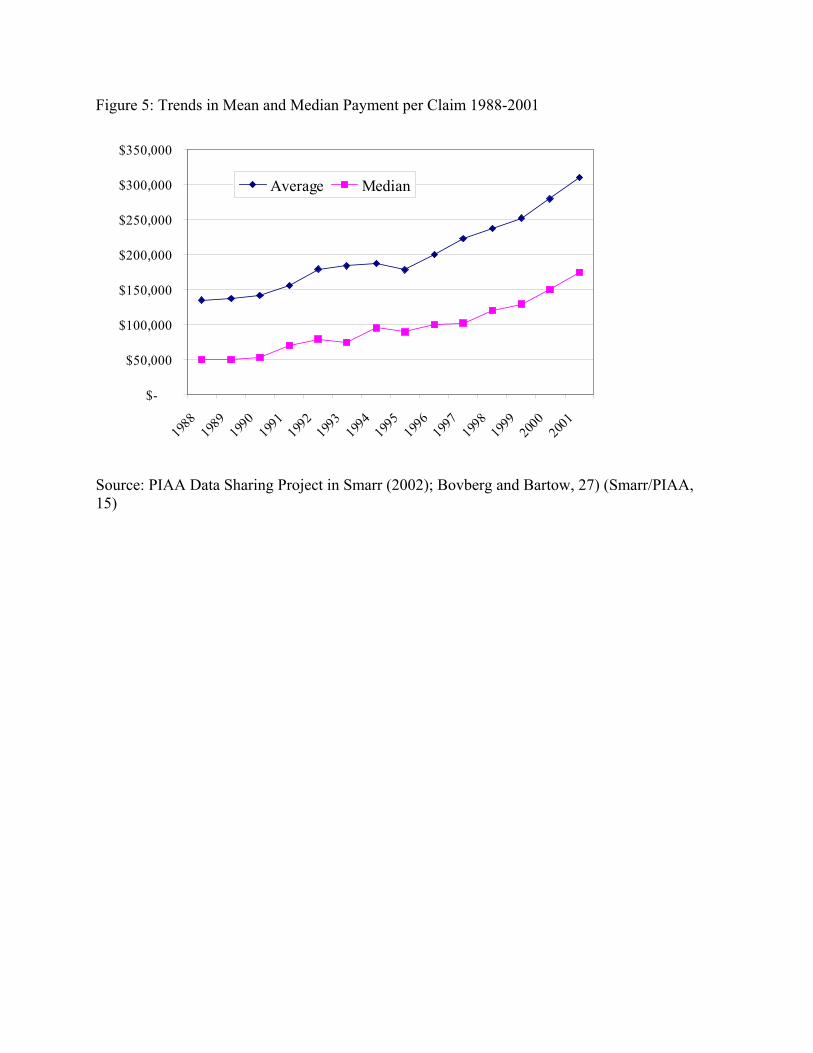
Figure 5: Trends in Mean and Median Payment per Claim 1988-2001
$-
$50,000
$100,000
$150,000
$200,000
$250,000
$300,000
$350,000
1988
1989
1990
1991
1992
1993
1994
1995
1996
1997
1998
1999
2000
2001
Average Median
Source: PIAA Data Sharing Project in Smarr (2002); Bovberg and Bartow, 27) (Smarr/PIAA, 15)

Endnotes
References Bovberg and Bartow (2003) Understanding Pennsylvania’s Medical Malpractice Crisis; Facts about Liability Insurance, the Legal System, and Health Care in Pennsylvania. Cummins, J. D. and P.M. Danzon. (1997). "Quality, Price and Capital Flows in Insurance Markets." Journal of Financial Intermediation. Danzon, P.M. (1984). “Tort Reform and the Role of Government in Private Insurance Markets,” J. Legal Studies 13(3): 517-549. Doherty, N.A. and G. Dionne. (1993.) “Insurance and Undiversifiable Risk: Contract Structure and Organizational Form of Insurance Firms.” J. of Risk and Uncertainty 6:187-203. Cornell, Emily V. (2002). Addressing the Medical Malpractice Insurance Crisis. NGA Center for Best Practices, National Conference of State Legislatures. December 5, 2002. Gron, A. (1989). ‘‘Property-Casualty Insurance Cycles, Capacity Constraints, and Empirical Results,’’ Ph.D. dissertation, Department of Economics, Massachusetts Institute of Technology, Cambridge, MA. Gron, A. (1994). Capacity constraints and cycles in property-casualty insurance markets, Rand J. Econ. 25, 110–127. Harrington, S. and P. Danzon (1994) "Price Cutting in Liability Insurance Markets," Journal of Business, 67(4). HHS Report. (2002) Confronting the New Health Care Crisis: Improving Health Care Quality and Lowering Costs by Fixing Our Medical Liability System. July 24, 2002. Klick and Stratman. (2003) Does Medical Malpractice Reform Help States Retain Physicians and Does It Matter? Working paper. July 2003. L. Smarr. (2003) Statement of the Physician Insurers Association of America; Patient Access Crisis: The role of Medical Litigation. February 2003. U.S. General Accounting Office (GAO). 2003a. Malpractice Insurance: Multiple Factors Have Contributed to Increased Premium Rates. 03-702. June 2003. U.S. General Accounting Office (GAO). 2003b. l Malpractice: Implications of Rising Premiums on Access to Health Care. 03-836. August 2003. Winter, R. (1994). The dynamics of competitive insurance markets, J. Finan. Intermed. 3, 379–415.
Zuckerman, S. R. Bovbjerg et al. (1990). “Effects of Tort Reforms and Other Factors on Medical Malpractice Premiums.” Inquiry 27(2):167-182.
Endnotes 1 See Table 1. 2 GAO, 2003b 5,12,13. 3 A claims made policy covers all claims filed in the year that the policy is written, provided that the policyholder had coverage with this insurer during the year in which the incident occurred. An occurrence policy covers all claims related to incidents in the year in which the policy is written. Thus if a physician with claims made coverage switches insurers or retires, he or she generally buys “tail coverage” to cover any future claims that may be filed related to his prior practice. 4 Danzon, 1984; Doherty and Dionne, 1993; Doherty, . 5 GAO, 2003a, 9, 33. 6 Winter, 1994; Gron, 1989, 1994. 7 In states with multiple rating territories, we included the highest and lowest rates. For analyses that required a single rate per specialty per state, in cases where we had rates from multiple insurers or multiple rating territories, we calculated a simple average of the rates reported for that specialty and state, since we lack information on the number of physicians by insurer and territory which is necessary to calculate a weighted average 8 Our estimates of cumulative percentage increases, by specialty and state, are approximate because the MLM insurers surveyed are not necessarily the same in each year. Thus the cumulative percentages may reflect differences in territories or insurer selection policies, as well as underlying rate increases. 9 According to the MLM data, the intra-specialty range of premiums charged by the Pennsylvania Medical Society’s medical malpractice insurer (PMSLIC) for base coverage and the mandatory Cat fund surcharge grew from 194 to 250 percent for IM, 184 to 239 percent for GS, and 217 to 279 percent for OB, from 1994 to 2003. 10 Uncertainty related to claims incurred but not reported during the policy year was eliminated by switching from occurrence to claims made coverage. 11 Bovbjerg and Bartow (2003, pp. 25-27). 12 Bovbjerg and Bartow (2003, p. 26). 13 Smarr (2003, p. 19). 14 GAO, 2003a; Smarr testimony (2003, p.8). 15 GAO (2003a, p. 2, p. 5). 16 e.g. Myers and Cohn (1987). 17 Winter (1994); Gron (1989, 1994). 18 Winter (1994). 19 Gron (1994). 20 Cummins and Danzon (1997). 21 Harrington and Danzon (1994). 22 Danzon, 1984; Doherty and Dionne, 1993; Doherty, 23 Danzon (1984); Zuckerman et al. (1990). 24 GAO (2003a). 25 Danzon (1984). 26 The percent change in any variable V is calculated as [(Vt - Vt-1) / abs(Vt-1)]. 27 Growth in premiums written is positively correlated with growth in volume if demand is elastic. 28 The need for lagged explanatory variables eliminates from the regression sample exits that occurred in 1993-1995. 29 Smarr (2003, p.?).