Embed Size (px)
Citation preview
The Critical Period for Ocular Dominance Plasticity in the Ferret’sVisual Cortex
Naoum P. Issa, Joshua T. Trachtenberg, Barbara Chapman, Kathleen R. Zahs, and Michael P. Stryker
Keck Center for Integrative Neuroscience, Department of Physiology, University of California, San Francisco,California 94143-0444
Microelectrode recordings and optical imaging of intrinsic sig-nals were used to define the critical period for susceptibility tomonocular deprivation (MD) in the primary visual cortex of theferret. Ferrets were monocularly deprived for 2, 7 or .14 d,beginning between postnatal day 19 (P19) and P110. The re-sponses of visual cortical neurons to stimulation of the two eyeswere used to gauge the onset, peak, and decline of the criticalperiod. MDs ending before P32 produced little or no loss ofresponse to the deprived eye. MDs of 7 d or more beginningaround P42 produced the greatest effects. A rapid decline incortical susceptibility to MD was observed after the seventhweek of life, such that MDs beginning between P50 and P65were approximately half as effective as those beginning on P42;MDs beginning after P100 did not reduce the response to the
deprived eye below that to the nondeprived eye. At all ages, 2 ddeprivations were 55–85% as effective as 7 d of MD. Maps ofintrinsic optical responses from the deprived eye were weakerand less well tuned for orientation than those from the nonde-prived eye, with the weakest maps seen in the hemisphereipsilateral to the deprived eye. Analysis of the effects of 7 d andlonger deprivations revealed a second period of plasticity incortical responses in which MD induced an effect like that ofstrabismus. After P70, MD caused a marked loss of binocularresponses with little or no overall loss of response to thedeprived eye. The critical period measured here is compared toother features of development in ferret and cat.
Key words: monocular deprivation; area 17; orientation; pin-wheel; cortical columns; intrinsic signal imaging; strabismus
The pathways that convey visual input to the primary visualcortex are precisely organized in normal adult mammals and havebeen extensively investigated in cats, monkeys, and ferrets. In thecat, precision in retinal and subcortical organization is attainedbefore the end of the first week of postnatal life (Shatz, 1983), atwhich time much of the specificity of cortical cell responses hasyet to emerge. The development of precision in visual corticalresponses and connections takes place in the context of functionalinputs, allowing activity-dependent mechanisms to participate inthis process. The influence of neural activity in the developmentof the visual cortex is most powerfully evident in the phenome-non of the “critical period”, in which an alteration in the normalpattern of activity during a period in early life dramatically alterscortical inputs and responses, whereas a similar alteration later inlife has no detectable effect (Wiesel and Hubel, 1963).
The critical period for ocular dominance plasticity has beendefined as the period of susceptibility to the effects of unilateraleye closure. Temporary monocular deprivation (MD) by unilat-eral eye closure during the critical period decreases the respon-
siveness of cells in primary visual cortex (V1) to the deprived eye(Wiesel and Hubel, 1963; Hubel and Wiesel, 1970). The peak ofthe critical period (postnatal weeks 4–6 in the cat) corresponds tothe time in normal development during which geniculocorticalaxons attain their mature organization in the form of oculardominance columns (LeVay et al., 1978; Antonini and Stryker,1993a,b). In addition, events that occur during the critical periodare essential for the normal maturation of neuronal responseproperties: in cats continuously deprived of patterned visualexperience from birth, organized orientation-selective responsesdevelop normally until the beginning of the critical period atpostnatal week 4, but are then lost over the next 3 weeks (Crair etal., 1998). All of these findings are consistent with the notion thatthe maturation of cortical response properties relies in part onactivity-dependent mechanisms that are driven by the patterns ofneural activity present during normal development.
The ferret, because of the relative immaturity of its visualsystem at birth (Jackson and Hickey, 1985), its large litter size,and its complex visual system, has become a model preparationfor studies of early visual development. In primary visual cortex,studies have described the development of orientation preferenceat the single unit level (Chapman and Stryker, 1993), the estab-lishment of orientation maps (Chapman et al., 1996a; Weliky andKatz, 1997), the development and refinement of horizontal con-nections in the supragranular layers (Dalva and Katz, 1994; We-liky and Katz, 1994; Nelson and Katz, 1995; Durack and Katz,1996; Ruthazer and Stryker, 1996), and the formation of inter-laminar connections (McAllister et al., 1995, 1996, 1997; Calla-way and Lieber, 1996; Dantzker and Callaway, 1998). Thesestudies, together with those characterizing the organization ofmature ferret V1 (Law et al., 1988; Zahs and Stryker, 1988;Chapman et al., 1991; Hirsch, 1995; Weliky et al., 1996; Rao et al.,
Received April 6, 1999; revised May 20, 1999; accepted May 21, 1999.This work was supported by National Institutes of Health Grant EY02874
(M.P.S.) and National Research Service Award postdoctoral fellowships (N.P.I. andJ.T.T.). Michael Crair provided software for both stimulus generation and imageanalysis. Members of the Stryker lab provided helpful discussion and comments onthis manuscript.
N.P.I. and J.T.T. contributed equally to this work.Correspondence should be addressed to Prof. Michael P. Stryker, Department of
Physiology, Room S-762, 513 Parnassus Avenue, University of California, SanFrancisco, CA 94143-0444.
Dr. Chapman’s present address: Center for Neuroscience, University of Califor-nia, Davis, CA 95616.
Dr. Zah’s present address: Department of Physiology, University of Minnesota,Minneapolis, MN 55455.Copyright © 1999 Society for Neuroscience 0270-6474/99/196965-14$05.00/0
The Journal of Neuroscience, August 15, 1999, 19(16):6965–6978
1997), provide one of the most complete descriptions of the roleof intrinsic and extrinsic factors in patterning the visual system.
The experiments presented here investigate the effects of mon-ocular deprivation on the organization of the ferret primaryvisual cortex. First, the temporal extent of the critical period forocular dominance column plasticity is determined. The criticalperiod in ferret visual cortex begins well after the time at whichvisual responses may be elicited, and, as in other species, spansonly a few weeks in neonatal life. Next, we describe a novel typeof cortical plasticity in the adult ferret. Unlike monocular depri-vation during the critical period, deprivations in the adult ferretproduce a strabismus-like segregation of eye-specific responseswithout producing an overall shift in ocular dominance. Finally,the effects of monocular deprivation on the relationship betweenorientation columns and ocular dominance columns are studied.In the normal cat, peaks of ocular dominance columns are closelyassociated with centers of orientation pinwheels (Crair et al.,1997a; Hubener et al., 1997). As a result of monocular depriva-tion in the cat, strong responses to the deprived eye lose orien-tation selectivity and are confined to patches at the peaks ofdeprived-eye columns, which are even more closely associatedwith pinwheel centers (Crair et al., 1997b). This relationshipbetween ocular dominance peaks and pinwheel centers has beenput forward as an organizing principal for the development of V1.In the ferret, MD produces a similar concentration of strongdeprived-eye responses in patches in which neurons lack orienta-tion selectivity, but there is no clear association between pinwheelcenters and ocular dominance columns, suggesting that such adevelopmental rule is not common to all species.
Some of this work has been presented in preliminary form(Chapman et al., 1996b; Trachtenberg et al., 1998).
MATERIALS AND METHODSFifty-three black point sable ferrets were used for these experiments (9normals, 44 monocularly deprived). All procedures were approved by theUniversity of California at San Francisco Committee on AnimalResearch.
Monocular deprivation. Ferrets were anesthetized with 2% halothanein a 2:1 mixture of nitrous oxide–oxygen or 2.5% isoflurane in oxygenadministered by face mask. After disinfecting skin around the eye to bedeprived, eyelid margins were trimmed, chloramphenicol ophthalmicointment (Parke-Davis, Morris Plains, NJ) was instilled in the eye, andthe eyelids were sutured shut using two or three horizontal mattressstitches.
Surg ical preparation. In preparation for electrophysiological recordingor imaging, ferrets were anesthetized, and the primary visual cortex wasexposed. Anesthesia was induced using a volatile agent (2% halothane in2:1 nitrous oxide–oxygen or 2.5% isoflurane in oxygen). An intravenouscatheter was inserted. Animals were placed on a regulated heating padand maintained at core temperature of 37.7°C. Atropine (0.1 mg) anddexamethasone (0.4 mg) were administered subcutaneously to minimizetracheal secretions and stress responses. A tracheotomy was performed.Thereafter, animals were either maintained on 1–2% isoflurane in oxy-gen or infused intravenously with sodium thiopental and ventilated with2:1 nitrous oxide–oxygen after discontinuing the inhaled anesthetic.Animals were then paralyzed with gallamine triethiodide (10mg z kg 21 z hr 21) or pancuronium bromide (1 mg/kg) in 2.5% dextroselactated Ringer’s solution administered intravenously. Peak expiratoryCO2, expiratory pressure, rectal temperature, electrocardiogram, and,when ferrets were old enough to allow useful interpretation, electroen-cephalogram were monitored. Respiratory rate and volume were ad-justed to keep the peak CO2 between 3.5 and 4.5%. Level of anesthesiawas determined by monitoring the ratio of low and high frequencyactivity in the EEG or by monitoring the heart rate and peak CO2.
Once the level of anesthesia had reached surgical plane, animals wereplaced in a stereotaxic apparatus. Atropine sulfate (1% solution) andphenylephrine hydrocholoride drops (10% solution) were instilled intothe eyes, and the eyes were fitted with contact lenses to prevent desicca-
tion. Visual cortex was exposed through a craniotomy, and the duramater was reflected using a dura hook. The exposed cortex was coveredwith a layer of low-melting point agarose (3% in standard saline).
Electrophysiology. Extracellular recordings of single and multiple unitswere made using resin-coated tungsten electrodes with tip resistancesbetween 1 and 5 MV. Areas 17 and 18 meet near the midline of thelateral gyrus, area 17 running along the caudal surface of the gyrus, andarea 18 along the rostral surface. To ensure that recordings were madefrom area 17, electrode penetrations were made in the caudal portion ofthe gyrus. For the majority of penetrations, differences in receptive fieldproperties between areas 17 and 18, including size of receptive field andprogression of visual fields, were used to verify that penetrations were inarea 17. Oriented stimuli were generated with a hand lamp and presentedfirst binocularly, then to each eye individually. Ocular dominance wasclassified based on the seven-point scale of Hubel and Wiesel (1962), inwhich a unit with ocular dominance rating of 1 is entirely dominated bythe contralateral eye, 4 is driven equally by the eyes, and 7 is entirelydominated by the ipsilateral eye.
Whereas ocular dominance ranking classifies the ratio of contralateralto ipsilateral eye input to a single unit, the contralateral bias index (CBI)measures the degree to which the entire population of units is dominatedby the contralateral eye. CBI is calculated as in Reiter et al. (1986; butpresented here as a ratio, not a percentage):
CBI 5
~N1 2 N7! 123 z ~N2 2 N6! 1
13 z ~N3 2 N5! 1 NT
2 z NT; (1)
in which NT is the total number of visually responsive units and Nx is thenumber of units with ocular dominance rating x. A CBI of 0 indicates thatthe ipsilateral eye dominates the population of measured units, whereasa CBI of 1 indicates that the contralateral eye dominates the population.This index is designed so that a one-category error in the assessment ofocular dominance would cause the same change in the value of the CBIno matter in which ocular dominance category it occurs.
Because monocular deprivation produces reciprocal shifts in CBI forthe hemisphere ipsilateral and contralateral to the deprived eye, we usedthe difference in CBIs as a measure of the degree of shift. The shift indexis defined as:
SI 5 CBIipsi 2 CBIcontra; (2)
in which CBIipsi is the CBI of the hemisphere ipsilateral to the deprivedeye and CBIcontra is the CBI of the hemisphere contralateral to thedeprived eye. A shift index of 11 suggests that both hemispheres areentirely dominated by the nondeprived eye, whereas a shift index of 21would mean that both hemispheres were entirely dominated by thedeprived eye. This index has the advantage that a normal brain would beexpected to have a shift index of 0, regardless of the normal CBI of theanimal.
The CBI and shift index used here and in our earlier reports are similarin spirit to those used by other authors. For example, our CBI is equal to12, the “weighted ocular dominance” index of Daw et al. (1992), and ourshift index is equal to the sum of the shift indices calculated separately forthe two hemispheres by these authors.
The monocularity index (MI) reflects the degree to which corticalresponses are dominated by one eye or the other but not by both (Strykerand Harris, 1986). The MI is defined as:
MI 5
~N1 1 N7! 123 ~N2 1 N6! 1
13 ~N3 1 N5!
NT. (3)
An MI of 0 suggests that all individual cells are driven equally by botheyes, whereas an MI of 1 suggests that all cells are driven exclusively byone eye or the other.
Throughout the text, all indices are expressed as a mean value 6 theSE. Unless otherwise noted, the Mann–Whitney U test was used to testfor statistical significance.
Histology. To determine the laminar position of recorded units, elec-trolytic lesions were made at defined locations along the electrodepenetration. At the end of the recording session, a lethal bolus ofthiopental was administered, and animals were perfused transcardiallyfirst with phosphate buffer, then with 4% paraformaldehyde. Brains werepost-fixed in 4% paraformaldehyde for several days, then blocked and cut
6966 J. Neurosci., August 15, 1999, 19(16):6965–6978 Issa et al. • Ferret Critical Period for Visual Plasticity
on a vibratome into coronal sections 50- to 70-mm-thick. Sections weremounted on glass slides and stained with cresyl violet. Laminar assign-ments were made from camera lucida drawings of the cortical laminaeand lesions.
Imaging intrinsic signals. We imaged intrinsic signals from V1 and V2in response to visual stimuli using the ORA 2001 Optical RecordingAcquisition and Analysis System (Optical Imaging, Germantown, NY).Before imaging, a new layer of agarose and a cleaned coverslip wereplaced over visual cortex. The cortical surface was illuminated using atungsten–halogen light source. I llumination wavelength was set usingeither a green (546 6 10 nm) or red (610 6 10 nm) interference filter.Initially, a green image of the surface vascular pattern was taken. Thecamera was then focused 400 mm below the pial surface, at approximatelythe depth of layer III. Images of intrinsic signals were acquired using thered filter for illumination, and an identical red filter was positionedbetween the brain and CCD camera. Full-field grating stimuli wereproduced by a VSG 2/3 board (Cambridge Research Systems, Rochester,UK) controlled by custom software. Gratings had a spatial frequency of0.15 cycles/° and moved with a temporal frequency of 2 cycles/sec. Fourto six cycles were visible on a 21 inch monitor (Nokia 445X) placed 40 cmfrom the animal. Stimuli moved in a direction perpendicular to the longaxis of the grating, and reversed direction of motion every 2 sec. Stimulusorientation was selected pseudorandomly from four or eight evenlyspaced templates spanning 180°; reversal of direction of motion gave thefull 360° range of orientations. Four blank-screen stimuli (both eyeshutters closed) were interleaved with the monocularly presented ori-ented stimuli; the average of the images collected during these blank-screen stimuli is the blank image. During a single stimulus presentation,20 frames of 300 msec duration [CCD binning set to 2; 1 pixel 5 (16.7mm) 2] or 10 frames of 600 msec duration [CCD binning set to 1; 1 pixel 5(22.5 mm) 2] were acquired. The twelve or twenty conditions (4 orienta-tions 3 2 eyes 1 4 blanks 5 12 conditions, or 8 orientations 3 2 eyes 14 blanks 5 20 conditions) were repeated 16 times to constitute a singlerun. Two to five runs were analyzed for each experiment. The illumina-tion shutter, a Uniblitz VS35 shutter (Vincent Associates, Rochester,NY), and custom-built eye shutters were controlled by the stimulus andacquisition computers.
Images were analyzed using commercial (ORA 2000) and customsoftware written in the Interactive Data Language (Research Systems,Boulder, CO). Because the dominant component of the stimulus-inducedintrinsic signal develops over 1–2 sec, the first 1.2 sec acquired undereach condition were disregarded. The signal-to-noise ratio in images wasimproved by averaging the same condition over all remaining frames,repetitions, and runs. Images were then normalized either to the averageof the four blank images (blank normalized) or to the average of allconditions except the blanks (cocktail-blank normalized). Ferret V1 ishighly vascularized; areas of the image with vascular artifacts wereremoved by overlaying functional images with a template of the vascularpattern derived by digitally thresholding the average blank image (inwhich the surface vasculature is present but out of focus). Ocular dom-inance ratio maps showed the ratio between the average responses overall conditions for the two eyes. Angle and hue lightness saturation (HLS)maps were constructed as outlined in Bonhoeffer and Grinvald (1996).Hues in the angle map represent the stimulus orientation to which thepixel responds most strongly. In the HLS maps, all of which wereconstructed from blank-normalized images, hue represents the best stim-ulus orientation, lightness represents the activity of the pixel (regardlessof orientation-selectivity), and saturation represents the degree of ori-entation selectivity.
An optical CBI was calculated from blank normalized images using aprotocol slightly different from that of Crair et al. (1998). The oculardominance rating of each pixel (OD) was calculated as follows:
OD 5PixelMax 2 PixelEye2
PixelMax 2 1 (4)
in which PixelMax is the strongest response at a given pixel, and PixelEye2is the pixel intensity for the same stimulus orientation as for PixelMax, butfor the other eye. Because the images are blank-normalized, imageintensities fluctuate around 1.0; the denominator therefore represent thedifference between the response at the best orientation and the responseto a blank screen. In some pixels in each image, the best response wassmaller than or equal to the response to a blank screen; these pixels(always ,10% of the total) were not included in the calculation of theCBI. The distribution of OD ratings for all pixels in the image was
binned, and a weighted average was calculated to produce the OpticalCBI ranging between 0 (for complete dominance of the ipsilateral eye)and 1 (representing complete dominance of the contralateral eye).
For Monte Carlo simulations of the distance between ocular domi-nance column peaks and pinwheel centers (Crair et al., 1997a,b), oculardominance peaks were selected from cocktail-blank normalized oculardominance ratio maps by calculating the centroid position of regionswithin a digitally thresholded image. Threshold values were adjustedmanually to identify regions around ocular dominance column peaks.Pinwheel centers were selected either using a curl function algorithm ormanually from angle maps. The distance between each ocular dominancepeak and its nearest pinwheel center was calculated. Individual MonteCarlo simulations were produced by randomly placing pinwheel centerson the image while keeping ocular dominance peaks fixed; 5000 simula-tions were made for each map. Combining the simulations from allhemispheres produced the cumulative Monte Carlo distribution.
RESULTSElectrophysiological characterization of the ferret’socular dominance critical periodTo define the critical period for ocular dominance plasticity in theferret’s primary visual cortex, we assessed ocular dominance fromextracellular responses in both normal and monocularly deprivedferrets. Ferrets ranging in age from postnatal day 19 (P19)through adult were monocularly deprived by lid suture for periodsof 2, 7, or .14 d. A total of 2772 units were recorded in 51animals: 1294 from the hemisphere ipsilateral to the deprived eye(or the right eye in normal animals) and 1478 from the contralat-eral (or left) hemisphere. Cells were classified based on theirresponses to each eye using the seven-point ocular dominancescale developed by Hubel and Wiesel (1962). For each corticalhemisphere, we calculated the contralateral bias index (CBI), ameasure of the dominance of input from the contralateral eye,and the monocularity index (MI), a measure of how skewed thedistribution of ocular dominance is toward the extremes of theclassification scale (1 and 7). The magnitude of the cortical shiftafter monocular deprivation was determined using the shift index(SI), defined as the difference in CBIs between the hemispheresipsilateral and contralateral to the deprived eye (see Materialsand Methods).
To ensure that the neurons sampled during electrophysiologicalrecordings were in area 17, electrode penetrations were made inthe caudal portion of the lateral gyrus, avoiding the more rostralarea 18. The medial aspect of the dorsal portion of the lateralgyrus in most ferrets has a different arrangement of ocular dom-inance columns from the rest of area 17 (Rockland, 1985; Law etal., 1988; Redies et al., 1990; Ruthazer et al., 1999). In this area,ocular dominance columns can extend for several millimetersparallel to the border between areas 17 and 18 (Fig. 4E andbelow). Nearly all of the ocular dominance data were collectedfrom tangential penetrations extending several millimetersthrough the more lateral and caudal region of the dorsal surfaceof area 17, which typically has the normal periodic arrangementof ocular dominance columns. The idiosyncratic nature of theunusual ocular dominance columns, however, makes it impossibleto be certain in every case that the electrode was recording fromthe region of conventional ocular dominance columns (with aperiod of ;1 mm).
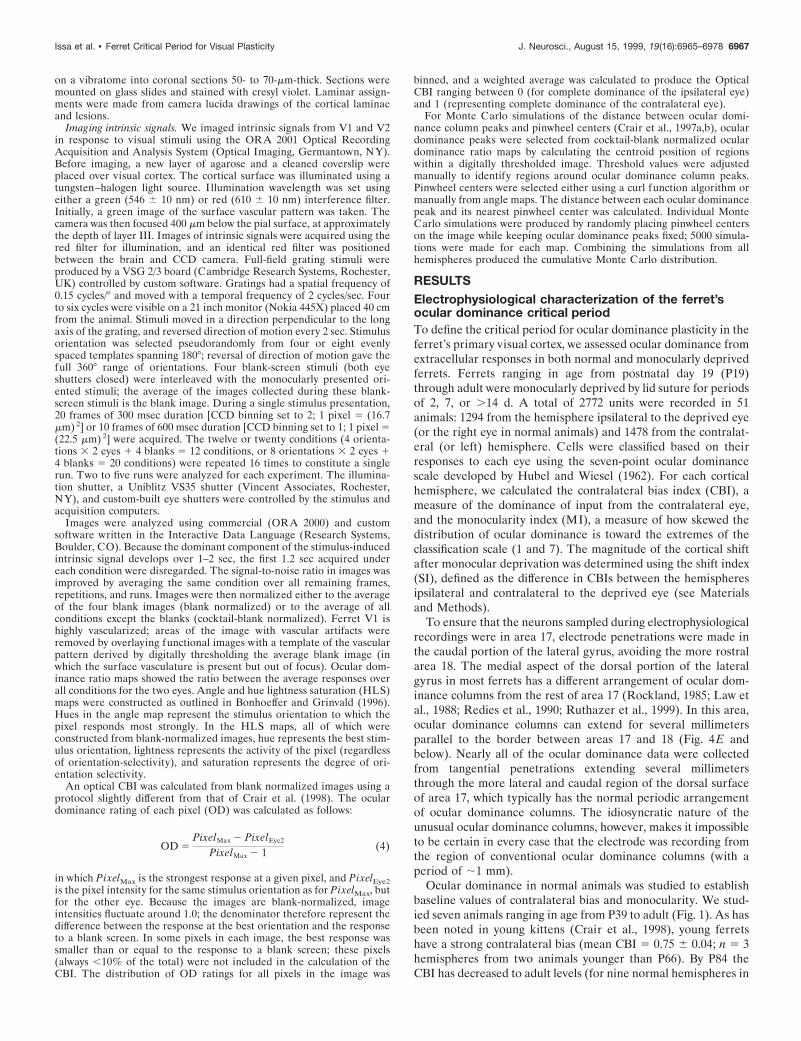
Ocular dominance in normal animals was studied to establishbaseline values of contralateral bias and monocularity. We stud-ied seven animals ranging in age from P39 to adult (Fig. 1). As hasbeen noted in young kittens (Crair et al., 1998), young ferretshave a strong contralateral bias (mean CBI 5 0.75 6 0.04; n 5 3hemispheres from two animals younger than P66). By P84 theCBI has decreased to adult levels (for nine normal hemispheres in
Issa et al. • Ferret Critical Period for Visual Plasticity J. Neurosci., August 15, 1999, 19(16):6965–6978 6967
five animals P84 and older, mean CBI 5 0.50 6 0.05). The adultCBI reported here is smaller than has been previously docu-mented (adult CBI 5 0.59 for the central 10° degrees of the visualfield; Law et al., 1988). Although young ferrets have a largercontralateral bias than adult ferrets, they are, on average, simi-larly binocular. The two normal ferrets younger than P66 had anaverage MI of 0.56 6 0.04 (n 5 3 hemispheres), whereas theaverage MI for the five animals P84 or older was 0.63 6 0.06 (n 59 hemispheres).
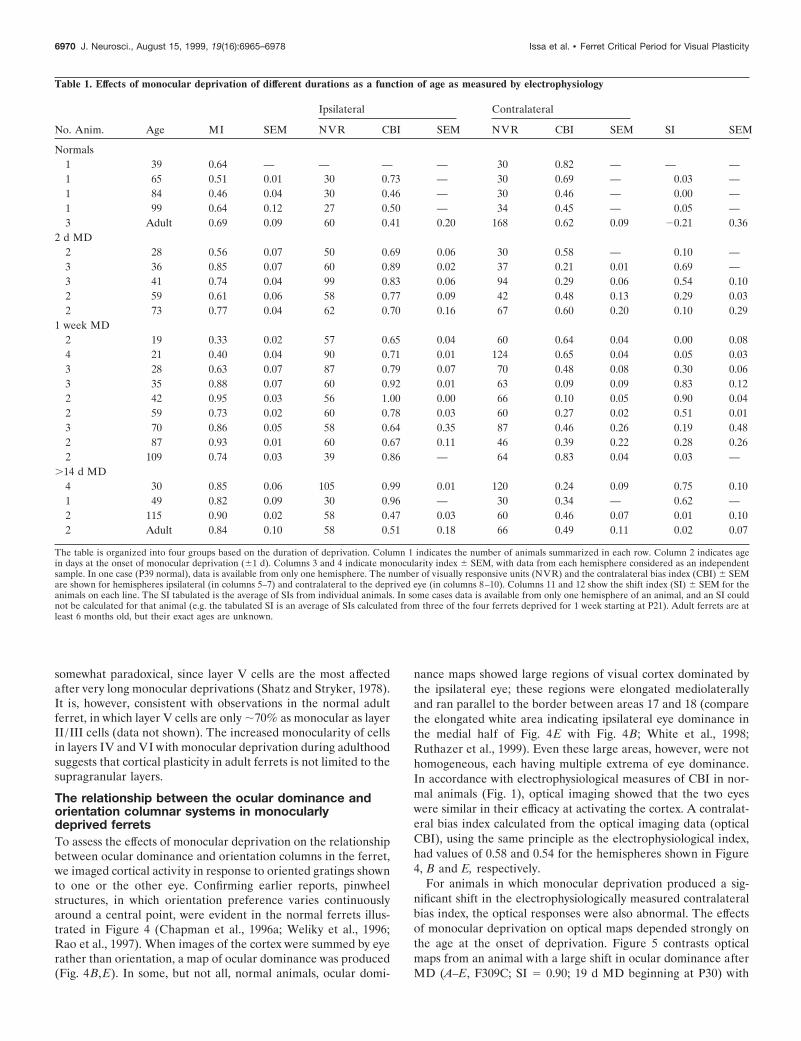
To determine whether monocular deprivation during early lifewould have an effect on cortical responsiveness to the two eyes,nine animals were monocularly deprived for periods of 2 weeks orlonger. Cortical responses in animals whose deprivation began atP30 were consistently shifted in favor of the nondeprived eye (n 54; SI 5 0.75 6 0.10; Fig. 2B, dashed line; Table 1). In general, thehemisphere ipsilateral to the deprivation became almost entirelydominated by the nondeprived eye (CBI ipsilateral 5 0.99 6 0.01;Table 1), whereas the contralateral hemisphere retained a smallamount of input from the deprived eye (CBI contralateral 50.24 6 0.09). Later deprivation was less effective in shiftingcortical responses toward the open eye. Monocular deprivationsbegun on P114–116 (n 5 2) or as adults (n 5 2) appearedineffective, yielding shift indices (SI 5 0.01 6 0.05) similar tothose expected for normal ferrets.
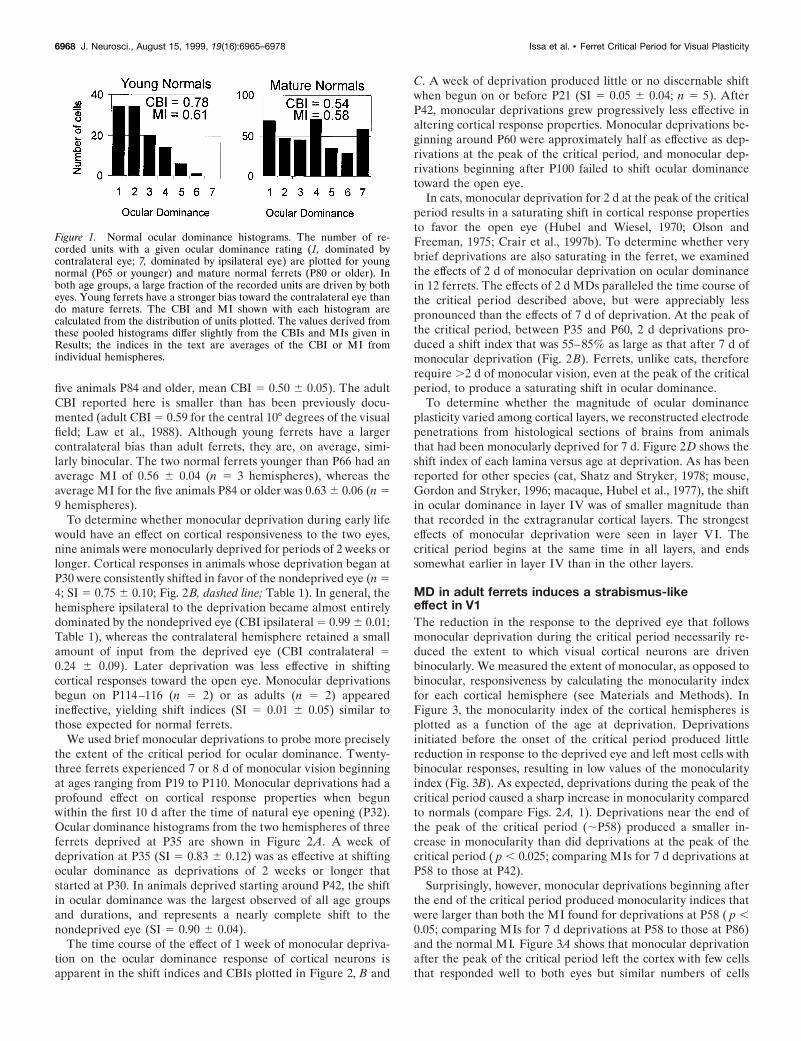
We used brief monocular deprivations to probe more preciselythe extent of the critical period for ocular dominance. Twenty-three ferrets experienced 7 or 8 d of monocular vision beginningat ages ranging from P19 to P110. Monocular deprivations had aprofound effect on cortical response properties when begunwithin the first 10 d after the time of natural eye opening (P32).Ocular dominance histograms from the two hemispheres of threeferrets deprived at P35 are shown in Figure 2A. A week ofdeprivation at P35 (SI 5 0.83 6 0.12) was as effective at shiftingocular dominance as deprivations of 2 weeks or longer thatstarted at P30. In animals deprived starting around P42, the shiftin ocular dominance was the largest observed of all age groupsand durations, and represents a nearly complete shift to thenondeprived eye (SI 5 0.90 6 0.04).
The time course of the effect of 1 week of monocular depriva-tion on the ocular dominance response of cortical neurons isapparent in the shift indices and CBIs plotted in Figure 2, B and
C. A week of deprivation produced little or no discernable shiftwhen begun on or before P21 (SI 5 0.05 6 0.04; n 5 5). AfterP42, monocular deprivations grew progressively less effective inaltering cortical response properties. Monocular deprivations be-ginning around P60 were approximately half as effective as dep-rivations at the peak of the critical period, and monocular dep-rivations beginning after P100 failed to shift ocular dominancetoward the open eye.
In cats, monocular deprivation for 2 d at the peak of the criticalperiod results in a saturating shift in cortical response propertiesto favor the open eye (Hubel and Wiesel, 1970; Olson andFreeman, 1975; Crair et al., 1997b). To determine whether verybrief deprivations are also saturating in the ferret, we examinedthe effects of 2 d of monocular deprivation on ocular dominancein 12 ferrets. The effects of 2 d MDs paralleled the time course ofthe critical period described above, but were appreciably lesspronounced than the effects of 7 d of deprivation. At the peak ofthe critical period, between P35 and P60, 2 d deprivations pro-duced a shift index that was 55–85% as large as that after 7 d ofmonocular deprivation (Fig. 2B). Ferrets, unlike cats, thereforerequire .2 d of monocular vision, even at the peak of the criticalperiod, to produce a saturating shift in ocular dominance.
To determine whether the magnitude of ocular dominanceplasticity varied among cortical layers, we reconstructed electrodepenetrations from histological sections of brains from animalsthat had been monocularly deprived for 7 d. Figure 2D shows theshift index of each lamina versus age at deprivation. As has beenreported for other species (cat, Shatz and Stryker, 1978; mouse,Gordon and Stryker, 1996; macaque, Hubel et al., 1977), the shiftin ocular dominance in layer IV was of smaller magnitude thanthat recorded in the extragranular cortical layers. The strongesteffects of monocular deprivation were seen in layer VI. Thecritical period begins at the same time in all layers, and endssomewhat earlier in layer IV than in the other layers.
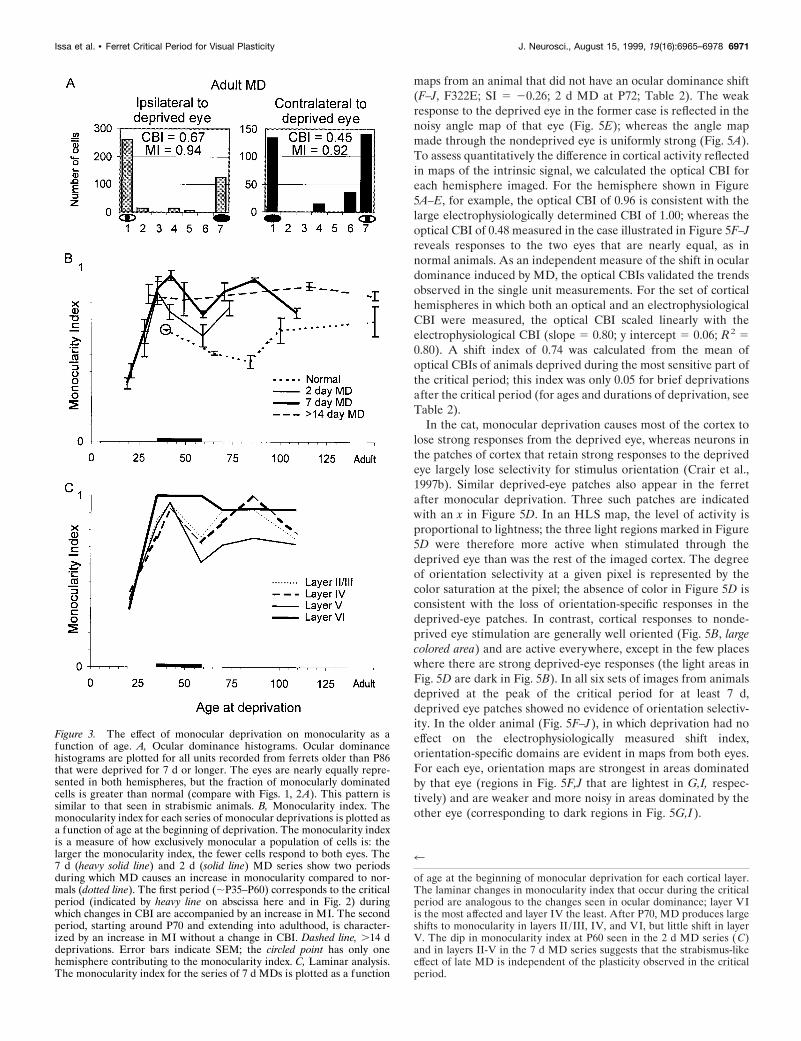
MD in adult ferrets induces a strabismus-likeeffect in V1The reduction in the response to the deprived eye that followsmonocular deprivation during the critical period necessarily re-duced the extent to which visual cortical neurons are drivenbinocularly. We measured the extent of monocular, as opposed tobinocular, responsiveness by calculating the monocularity indexfor each cortical hemisphere (see Materials and Methods). InFigure 3, the monocularity index of the cortical hemispheres isplotted as a function of the age at deprivation. Deprivationsinitiated before the onset of the critical period produced littlereduction in response to the deprived eye and left most cells withbinocular responses, resulting in low values of the monocularityindex (Fig. 3B). As expected, deprivations during the peak of thecritical period caused a sharp increase in monocularity comparedto normals (compare Figs. 2A, 1). Deprivations near the end ofthe peak of the critical period (;P58) produced a smaller in-crease in monocularity than did deprivations at the peak of thecritical period ( p , 0.025; comparing MIs for 7 d deprivations atP58 to those at P42).
Surprisingly, however, monocular deprivations beginning afterthe end of the critical period produced monocularity indices thatwere larger than both the MI found for deprivations at P58 ( p ,0.05; comparing MIs for 7 d deprivations at P58 to those at P86)and the normal MI. Figure 3A shows that monocular deprivationafter the peak of the critical period left the cortex with few cellsthat responded well to both eyes but similar numbers of cells
Figure 1. Normal ocular dominance histograms. The number of re-corded units with a given ocular dominance rating (1, dominated bycontralateral eye; 7, dominated by ipsilateral eye) are plotted for youngnormal (P65 or younger) and mature normal ferrets (P80 or older). Inboth age groups, a large fraction of the recorded units are driven by botheyes. Young ferrets have a stronger bias toward the contralateral eye thando mature ferrets. The CBI and MI shown with each histogram arecalculated from the distribution of units plotted. The values derived fromthese pooled histograms differ slightly from the CBIs and MIs given inResults; the indices in the text are averages of the CBI or MI fromindividual hemispheres.
6968 J. Neurosci., August 15, 1999, 19(16):6965–6978 Issa et al. • Ferret Critical Period for Visual Plasticity
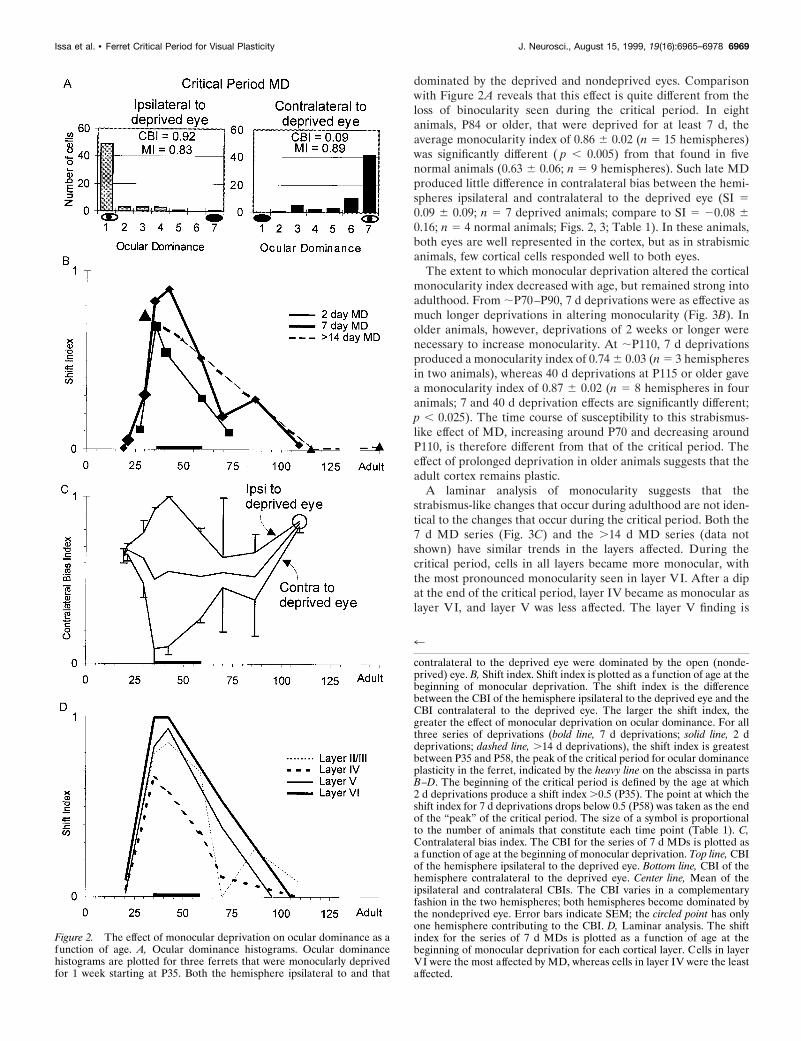
dominated by the deprived and nondeprived eyes. Comparisonwith Figure 2A reveals that this effect is quite different from theloss of binocularity seen during the critical period. In eightanimals, P84 or older, that were deprived for at least 7 d, theaverage monocularity index of 0.86 6 0.02 (n 5 15 hemispheres)was significantly different ( p , 0.005) from that found in fivenormal animals (0.63 6 0.06; n 5 9 hemispheres). Such late MDproduced little difference in contralateral bias between the hemi-spheres ipsilateral and contralateral to the deprived eye (SI 50.09 6 0.09; n 5 7 deprived animals; compare to SI 5 20.08 60.16; n 5 4 normal animals; Figs. 2, 3; Table 1). In these animals,both eyes are well represented in the cortex, but as in strabismicanimals, few cortical cells responded well to both eyes.
The extent to which monocular deprivation altered the corticalmonocularity index decreased with age, but remained strong intoadulthood. From ;P70–P90, 7 d deprivations were as effective asmuch longer deprivations in altering monocularity (Fig. 3B). Inolder animals, however, deprivations of 2 weeks or longer werenecessary to increase monocularity. At ;P110, 7 d deprivationsproduced a monocularity index of 0.74 6 0.03 (n 5 3 hemispheresin two animals), whereas 40 d deprivations at P115 or older gavea monocularity index of 0.87 6 0.02 (n 5 8 hemispheres in fouranimals; 7 and 40 d deprivation effects are significantly different;p , 0.025). The time course of susceptibility to this strabismus-like effect of MD, increasing around P70 and decreasing aroundP110, is therefore different from that of the critical period. Theeffect of prolonged deprivation in older animals suggests that theadult cortex remains plastic.
A laminar analysis of monocularity suggests that thestrabismus-like changes that occur during adulthood are not iden-tical to the changes that occur during the critical period. Both the7 d MD series (Fig. 3C) and the .14 d MD series (data notshown) have similar trends in the layers affected. During thecritical period, cells in all layers became more monocular, withthe most pronounced monocularity seen in layer VI. After a dipat the end of the critical period, layer IV became as monocular aslayer VI, and layer V was less affected. The layer V finding is
Figure 2. The effect of monocular deprivation on ocular dominance as afunction of age. A, Ocular dominance histograms. Ocular dominancehistograms are plotted for three ferrets that were monocularly deprivedfor 1 week starting at P35. Both the hemisphere ipsilateral to and that
4
contralateral to the deprived eye were dominated by the open (nonde-prived) eye. B, Shift index. Shift index is plotted as a function of age at thebeginning of monocular deprivation. The shift index is the differencebetween the CBI of the hemisphere ipsilateral to the deprived eye and theCBI contralateral to the deprived eye. The larger the shift index, thegreater the effect of monocular deprivation on ocular dominance. For allthree series of deprivations (bold line, 7 d deprivations; solid line, 2 ddeprivations; dashed line, .14 d deprivations), the shift index is greatestbetween P35 and P58, the peak of the critical period for ocular dominanceplasticity in the ferret, indicated by the heavy line on the abscissa in partsB–D. The beginning of the critical period is defined by the age at which2 d deprivations produce a shift index .0.5 (P35). The point at which theshift index for 7 d deprivations drops below 0.5 (P58) was taken as the endof the “peak” of the critical period. The size of a symbol is proportionalto the number of animals that constitute each time point (Table 1). C,Contralateral bias index. The CBI for the series of 7 d MDs is plotted asa function of age at the beginning of monocular deprivation. Top line, CBIof the hemisphere ipsilateral to the deprived eye. Bottom line, CBI of thehemisphere contralateral to the deprived eye. Center line, Mean of theipsilateral and contralateral CBIs. The CBI varies in a complementaryfashion in the two hemispheres; both hemispheres become dominated bythe nondeprived eye. Error bars indicate SEM; the circled point has onlyone hemisphere contributing to the CBI. D, Laminar analysis. The shiftindex for the series of 7 d MDs is plotted as a function of age at thebeginning of monocular deprivation for each cortical layer. Cells in layerVI were the most affected by MD, whereas cells in layer IV were the leastaffected.
Issa et al. • Ferret Critical Period for Visual Plasticity J. Neurosci., August 15, 1999, 19(16):6965–6978 6969
somewhat paradoxical, since layer V cells are the most affectedafter very long monocular deprivations (Shatz and Stryker, 1978).It is, however, consistent with observations in the normal adultferret, in which layer V cells are only ;70% as monocular as layerII /III cells (data not shown). The increased monocularity of cellsin layers IV and VI with monocular deprivation during adulthoodsuggests that cortical plasticity in adult ferrets is not limited to thesupragranular layers.
The relationship between the ocular dominance andorientation columnar systems in monocularlydeprived ferretsTo assess the effects of monocular deprivation on the relationshipbetween ocular dominance and orientation columns in the ferret,we imaged cortical activity in response to oriented gratings shownto one or the other eye. Confirming earlier reports, pinwheelstructures, in which orientation preference varies continuouslyaround a central point, were evident in the normal ferrets illus-trated in Figure 4 (Chapman et al., 1996a; Weliky et al., 1996;Rao et al., 1997). When images of the cortex were summed by eyerather than orientation, a map of ocular dominance was produced(Fig. 4B,E). In some, but not all, normal animals, ocular domi-
nance maps showed large regions of visual cortex dominated bythe ipsilateral eye; these regions were elongated mediolaterallyand ran parallel to the border between areas 17 and 18 (comparethe elongated white area indicating ipsilateral eye dominance inthe medial half of Fig. 4E with Fig. 4B; White et al., 1998;Ruthazer et al., 1999). Even these large areas, however, were nothomogeneous, each having multiple extrema of eye dominance.In accordance with electrophysiological measures of CBI in nor-mal animals (Fig. 1), optical imaging showed that the two eyeswere similar in their efficacy at activating the cortex. A contralat-eral bias index calculated from the optical imaging data (opticalCBI), using the same principle as the electrophysiological index,had values of 0.58 and 0.54 for the hemispheres shown in Figure4, B and E, respectively.
For animals in which monocular deprivation produced a sig-nificant shift in the electrophysiologically measured contralateralbias index, the optical responses were also abnormal. The effectsof monocular deprivation on optical maps depended strongly onthe age at the onset of deprivation. Figure 5 contrasts opticalmaps from an animal with a large shift in ocular dominance afterMD (A–E, F309C; SI 5 0.90; 19 d MD beginning at P30) with
Table 1. Effects of monocular deprivation of different durations as a function of age as measured by electrophysiology
No. Anim. Age MI SEM
Ipsilateral Contralateral
SI SEMNVR CBI SEM NVR CBI SEM
Normals1 39 0.64 — — — — 30 0.82 — — —1 65 0.51 0.01 30 0.73 — 30 0.69 — 0.03 —1 84 0.46 0.04 30 0.46 — 30 0.46 — 0.00 —1 99 0.64 0.12 27 0.50 — 34 0.45 — 0.05 —3 Adult 0.69 0.09 60 0.41 0.20 168 0.62 0.09 20.21 0.36
2 d MD2 28 0.56 0.07 50 0.69 0.06 30 0.58 — 0.10 —3 36 0.85 0.07 60 0.89 0.02 37 0.21 0.01 0.69 —3 41 0.74 0.04 99 0.83 0.06 94 0.29 0.06 0.54 0.102 59 0.61 0.06 58 0.77 0.09 42 0.48 0.13 0.29 0.032 73 0.77 0.04 62 0.70 0.16 67 0.60 0.20 0.10 0.29
1 week MD2 19 0.33 0.02 57 0.65 0.04 60 0.64 0.04 0.00 0.084 21 0.40 0.04 90 0.71 0.01 124 0.65 0.04 0.05 0.033 28 0.63 0.07 87 0.79 0.07 70 0.48 0.08 0.30 0.063 35 0.88 0.07 60 0.92 0.01 63 0.09 0.09 0.83 0.122 42 0.95 0.03 56 1.00 0.00 66 0.10 0.05 0.90 0.042 59 0.73 0.02 60 0.78 0.03 60 0.27 0.02 0.51 0.013 70 0.86 0.05 58 0.64 0.35 87 0.46 0.26 0.19 0.482 87 0.93 0.01 60 0.67 0.11 46 0.39 0.22 0.28 0.262 109 0.74 0.03 39 0.86 — 64 0.83 0.04 0.03 —
.14 d MD4 30 0.85 0.06 105 0.99 0.01 120 0.24 0.09 0.75 0.101 49 0.82 0.09 30 0.96 — 30 0.34 — 0.62 —2 115 0.90 0.02 58 0.47 0.03 60 0.46 0.07 0.01 0.102 Adult 0.84 0.10 58 0.51 0.18 66 0.49 0.11 0.02 0.07
The table is organized into four groups based on the duration of deprivation. Column 1 indicates the number of animals summarized in each row. Column 2 indicates agein days at the onset of monocular deprivation (61 d). Columns 3 and 4 indicate monocularity index 6 SEM, with data from each hemisphere considered as an independentsample. In one case (P39 normal), data is available from only one hemisphere. The number of visually responsive units (NVR) and the contralateral bias index (CBI) 6 SEMare shown for hemispheres ipsilateral (in columns 5–7) and contralateral to the deprived eye (in columns 8–10). Columns 11 and 12 show the shift index (SI) 6 SEM for theanimals on each line. The SI tabulated is the average of SIs from individual animals. In some cases data is available from only one hemisphere of an animal, and an SI couldnot be calculated for that animal (e.g. the tabulated SI is an average of SIs calculated from three of the four ferrets deprived for 1 week starting at P21). Adult ferrets are atleast 6 months old, but their exact ages are unknown.
6970 J. Neurosci., August 15, 1999, 19(16):6965–6978 Issa et al. • Ferret Critical Period for Visual Plasticity
maps from an animal that did not have an ocular dominance shift(F–J, F322E; SI 5 20.26; 2 d MD at P72; Table 2). The weakresponse to the deprived eye in the former case is reflected in thenoisy angle map of that eye (Fig. 5E); whereas the angle mapmade through the nondeprived eye is uniformly strong (Fig. 5A).To assess quantitatively the difference in cortical activity reflectedin maps of the intrinsic signal, we calculated the optical CBI foreach hemisphere imaged. For the hemisphere shown in Figure5A–E, for example, the optical CBI of 0.96 is consistent with thelarge electrophysiologically determined CBI of 1.00; whereas theoptical CBI of 0.48 measured in the case illustrated in Figure 5F–Jreveals responses to the two eyes that are nearly equal, as innormal animals. As an independent measure of the shift in oculardominance induced by MD, the optical CBIs validated the trendsobserved in the single unit measurements. For the set of corticalhemispheres in which both an optical and an electrophysiologicalCBI were measured, the optical CBI scaled linearly with theelectrophysiological CBI (slope 5 0.80; y intercept 5 0.06; R2 50.80). A shift index of 0.74 was calculated from the mean ofoptical CBIs of animals deprived during the most sensitive part ofthe critical period; this index was only 0.05 for brief deprivationsafter the critical period (for ages and durations of deprivation, seeTable 2).
In the cat, monocular deprivation causes most of the cortex tolose strong responses from the deprived eye, whereas neurons inthe patches of cortex that retain strong responses to the deprivedeye largely lose selectivity for stimulus orientation (Crair et al.,1997b). Similar deprived-eye patches also appear in the ferretafter monocular deprivation. Three such patches are indicatedwith an x in Figure 5D. In an HLS map, the level of activity isproportional to lightness; the three light regions marked in Figure5D were therefore more active when stimulated through thedeprived eye than was the rest of the imaged cortex. The degreeof orientation selectivity at a given pixel is represented by thecolor saturation at the pixel; the absence of color in Figure 5D isconsistent with the loss of orientation-specific responses in thedeprived-eye patches. In contrast, cortical responses to nonde-prived eye stimulation are generally well oriented (Fig. 5B, largecolored area) and are active everywhere, except in the few placeswhere there are strong deprived-eye responses (the light areas inFig. 5D are dark in Fig. 5B). In all six sets of images from animalsdeprived at the peak of the critical period for at least 7 d,deprived eye patches showed no evidence of orientation selectiv-ity. In the older animal (Fig. 5F–J), in which deprivation had noeffect on the electrophysiologically measured shift index,orientation-specific domains are evident in maps from both eyes.For each eye, orientation maps are strongest in areas dominatedby that eye (regions in Fig. 5F,J that are lightest in G,I, respec-tively) and are weaker and more noisy in areas dominated by theother eye (corresponding to dark regions in Fig. 5G,I).
4
of age at the beginning of monocular deprivation for each cortical layer.The laminar changes in monocularity index that occur during the criticalperiod are analogous to the changes seen in ocular dominance; layer VIis the most affected and layer IV the least. After P70, MD produces largeshifts to monocularity in layers II /III, IV, and VI, but little shift in layerV. The dip in monocularity index at P60 seen in the 2 d MD series (C)and in layers II-V in the 7 d MD series suggests that the strabismus-likeeffect of late MD is independent of the plasticity observed in the criticalperiod.
Figure 3. The effect of monocular deprivation on monocularity as afunction of age. A, Ocular dominance histograms. Ocular dominancehistograms are plotted for all units recorded from ferrets older than P86that were deprived for 7 d or longer. The eyes are nearly equally repre-sented in both hemispheres, but the fraction of monocularly dominatedcells is greater than normal (compare with Figs. 1, 2A). This pattern issimilar to that seen in strabismic animals. B, Monocularity index. Themonocularity index for each series of monocular deprivations is plotted asa function of age at the beginning of deprivation. The monocularity indexis a measure of how exclusively monocular a population of cells is: thelarger the monocularity index, the fewer cells respond to both eyes. The7 d (heavy solid line) and 2 d (solid line) MD series show two periodsduring which MD causes an increase in monocularity compared to nor-mals (dotted line). The first period (;P35–P60) corresponds to the criticalperiod (indicated by heavy line on abscissa here and in Fig. 2) duringwhich changes in CBI are accompanied by an increase in MI. The secondperiod, starting around P70 and extending into adulthood, is character-ized by an increase in MI without a change in CBI. Dashed line, .14 ddeprivations. Error bars indicate SEM; the circled point has only onehemisphere contributing to the monocularity index. C, Laminar analysis.The monocularity index for the series of 7 d MDs is plotted as a function
Issa et al. • Ferret Critical Period for Visual Plasticity J. Neurosci., August 15, 1999, 19(16):6965–6978 6971
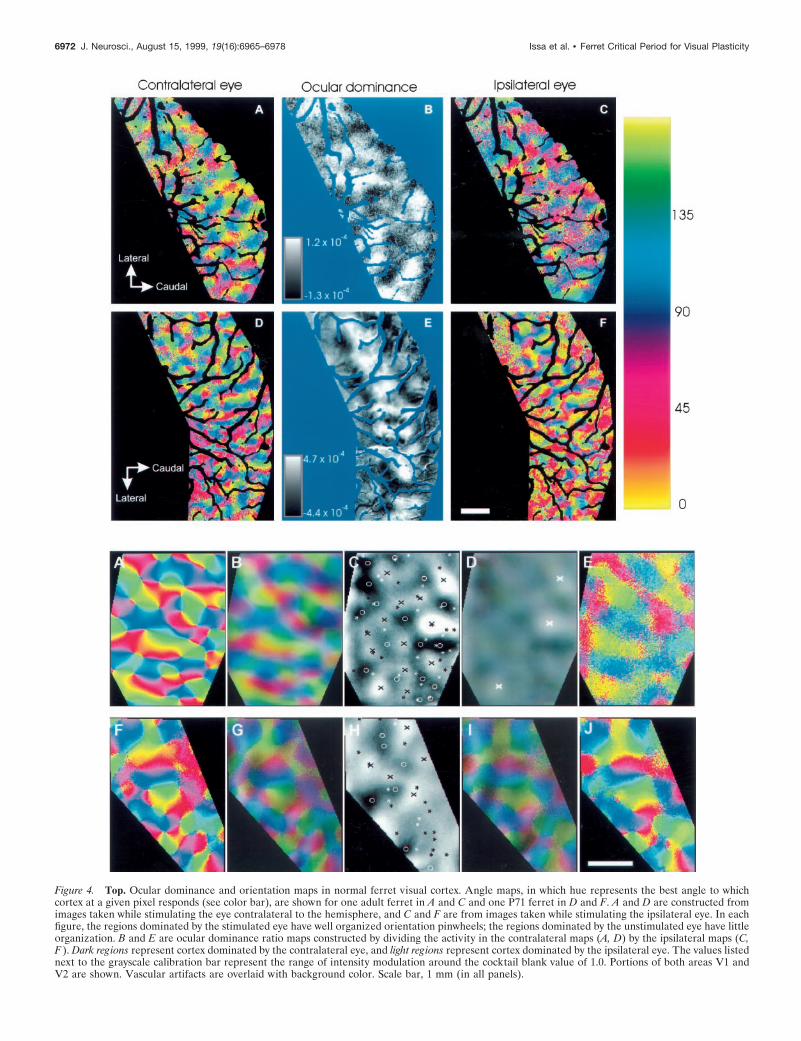
Figure 4. Top. Ocular dominance and orientation maps in normal ferret visual cortex. Angle maps, in which hue represents the best angle to whichcortex at a given pixel responds (see color bar), are shown for one adult ferret in A and C and one P71 ferret in D and F. A and D are constructed fromimages taken while stimulating the eye contralateral to the hemisphere, and C and F are from images taken while stimulating the ipsilateral eye. In eachfigure, the regions dominated by the stimulated eye have well organized orientation pinwheels; the regions dominated by the unstimulated eye have littleorganization. B and E are ocular dominance ratio maps constructed by dividing the activity in the contralateral maps (A, D) by the ipsilateral maps (C,F ). Dark regions represent cortex dominated by the contralateral eye, and light regions represent cortex dominated by the ipsilateral eye. The values listednext to the grayscale calibration bar represent the range of intensity modulation around the cocktail blank value of 1.0. Portions of both areas V1 andV2 are shown. Vascular artifacts are overlaid with background color. Scale bar, 1 mm (in all panels).
6972 J. Neurosci., August 15, 1999, 19(16):6965–6978 Issa et al. • Ferret Critical Period for Visual Plasticity
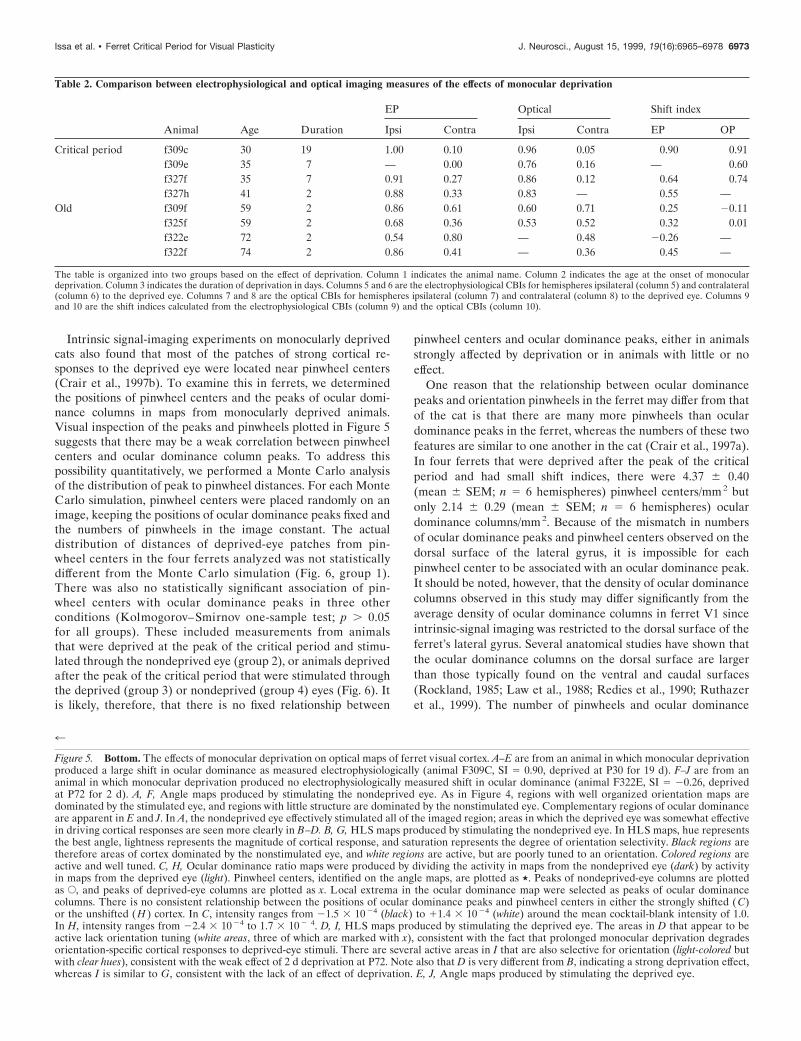
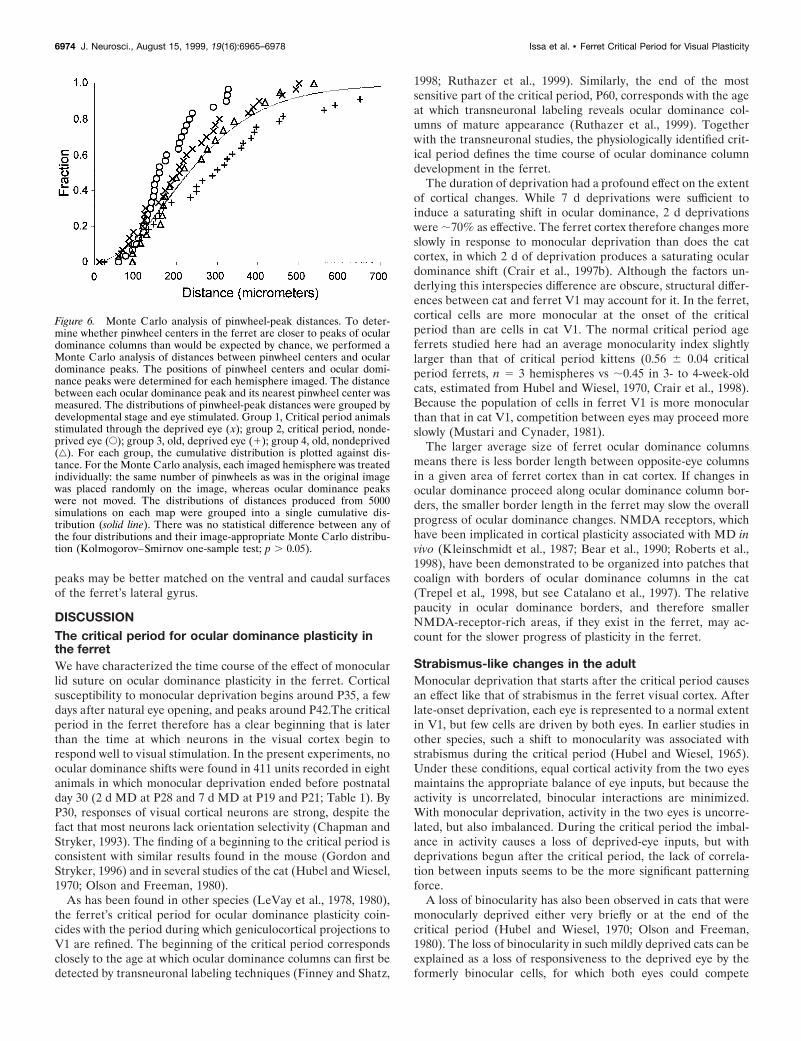
Intrinsic signal-imaging experiments on monocularly deprivedcats also found that most of the patches of strong cortical re-sponses to the deprived eye were located near pinwheel centers(Crair et al., 1997b). To examine this in ferrets, we determinedthe positions of pinwheel centers and the peaks of ocular domi-nance columns in maps from monocularly deprived animals.Visual inspection of the peaks and pinwheels plotted in Figure 5suggests that there may be a weak correlation between pinwheelcenters and ocular dominance column peaks. To address thispossibility quantitatively, we performed a Monte Carlo analysisof the distribution of peak to pinwheel distances. For each MonteCarlo simulation, pinwheel centers were placed randomly on animage, keeping the positions of ocular dominance peaks fixed andthe numbers of pinwheels in the image constant. The actualdistribution of distances of deprived-eye patches from pin-wheel centers in the four ferrets analyzed was not statisticallydifferent from the Monte Carlo simulation (Fig. 6, group 1).There was also no statistically significant association of pin-wheel centers with ocular dominance peaks in three otherconditions (Kolmogorov–Smirnov one-sample test; p . 0.05for all groups). These included measurements from animalsthat were deprived at the peak of the critical period and stimu-lated through the nondeprived eye (group 2), or animals deprivedafter the peak of the critical period that were stimulated throughthe deprived (group 3) or nondeprived (group 4) eyes (Fig. 6). Itis likely, therefore, that there is no fixed relationship between
pinwheel centers and ocular dominance peaks, either in animalsstrongly affected by deprivation or in animals with little or noeffect.
One reason that the relationship between ocular dominancepeaks and orientation pinwheels in the ferret may differ from thatof the cat is that there are many more pinwheels than oculardominance peaks in the ferret, whereas the numbers of these twofeatures are similar to one another in the cat (Crair et al., 1997a).In four ferrets that were deprived after the peak of the criticalperiod and had small shift indices, there were 4.37 6 0.40(mean 6 SEM; n 5 6 hemispheres) pinwheel centers/mm2 butonly 2.14 6 0.29 (mean 6 SEM; n 5 6 hemispheres) oculardominance columns/mm2. Because of the mismatch in numbersof ocular dominance peaks and pinwheel centers observed on thedorsal surface of the lateral gyrus, it is impossible for eachpinwheel center to be associated with an ocular dominance peak.It should be noted, however, that the density of ocular dominancecolumns observed in this study may differ significantly from theaverage density of ocular dominance columns in ferret V1 sinceintrinsic-signal imaging was restricted to the dorsal surface of theferret’s lateral gyrus. Several anatomical studies have shown thatthe ocular dominance columns on the dorsal surface are largerthan those typically found on the ventral and caudal surfaces(Rockland, 1985; Law et al., 1988; Redies et al., 1990; Ruthazeret al., 1999). The number of pinwheels and ocular dominance
4
Figure 5. Bottom. The effects of monocular deprivation on optical maps of ferret visual cortex. A–E are from an animal in which monocular deprivationproduced a large shift in ocular dominance as measured electrophysiologically (animal F309C, SI 5 0.90, deprived at P30 for 19 d). F–J are from ananimal in which monocular deprivation produced no electrophysiologically measured shift in ocular dominance (animal F322E, SI 5 20.26, deprivedat P72 for 2 d). A, F, Angle maps produced by stimulating the nondeprived eye. As in Figure 4, regions with well organized orientation maps aredominated by the stimulated eye, and regions with little structure are dominated by the nonstimulated eye. Complementary regions of ocular dominanceare apparent in E and J. In A, the nondeprived eye effectively stimulated all of the imaged region; areas in which the deprived eye was somewhat effectivein driving cortical responses are seen more clearly in B–D. B, G, HLS maps produced by stimulating the nondeprived eye. In HLS maps, hue representsthe best angle, lightness represents the magnitude of cortical response, and saturation represents the degree of orientation selectivity. Black regions aretherefore areas of cortex dominated by the nonstimulated eye, and white regions are active, but are poorly tuned to an orientation. Colored regions areactive and well tuned. C, H, Ocular dominance ratio maps were produced by dividing the activity in maps from the nondeprived eye (dark) by activityin maps from the deprived eye (light). Pinwheel centers, identified on the angle maps, are plotted as ,. Peaks of nondeprived-eye columns are plottedas E, and peaks of deprived-eye columns are plotted as x. Local extrema in the ocular dominance map were selected as peaks of ocular dominancecolumns. There is no consistent relationship between the positions of ocular dominance peaks and pinwheel centers in either the strongly shifted (C)or the unshifted ( H ) cortex. In C, intensity ranges from 21.5 3 10 24 (black) to 11.4 3 10 24 (white) around the mean cocktail-blank intensity of 1.0.In H, intensity ranges from 22.4 3 10 24 to 1.7 3 10 2 4. D, I, HLS maps produced by stimulating the deprived eye. The areas in D that appear to beactive lack orientation tuning (white areas, three of which are marked with x), consistent with the fact that prolonged monocular deprivation degradesorientation-specific cortical responses to deprived-eye stimuli. There are several active areas in I that are also selective for orientation (light-colored butwith clear hues), consistent with the weak effect of 2 d deprivation at P72. Note also that D is very different from B, indicating a strong deprivation effect,whereas I is similar to G, consistent with the lack of an effect of deprivation. E, J, Angle maps produced by stimulating the deprived eye.
Table 2. Comparison between electrophysiological and optical imaging measures of the effects of monocular deprivation
Animal Age Duration
EP Optical Shift index
Ipsi Contra Ipsi Contra EP OP
Critical period f309c 30 19 1.00 0.10 0.96 0.05 0.90 0.91f309e 35 7 — 0.00 0.76 0.16 — 0.60f327f 35 7 0.91 0.27 0.86 0.12 0.64 0.74f327h 41 2 0.88 0.33 0.83 — 0.55 —
Old f309f 59 2 0.86 0.61 0.60 0.71 0.25 20.11f325f 59 2 0.68 0.36 0.53 0.52 0.32 0.01f322e 72 2 0.54 0.80 — 0.48 20.26 —f322f 74 2 0.86 0.41 — 0.36 0.45 —
The table is organized into two groups based on the effect of deprivation. Column 1 indicates the animal name. Column 2 indicates the age at the onset of monoculardeprivation. Column 3 indicates the duration of deprivation in days. Columns 5 and 6 are the electrophysiological CBIs for hemispheres ipsilateral (column 5) and contralateral(column 6) to the deprived eye. Columns 7 and 8 are the optical CBIs for hemispheres ipsilateral (column 7) and contralateral (column 8) to the deprived eye. Columns 9and 10 are the shift indices calculated from the electrophysiological CBIs (column 9) and the optical CBIs (column 10).
Issa et al. • Ferret Critical Period for Visual Plasticity J. Neurosci., August 15, 1999, 19(16):6965–6978 6973
peaks may be better matched on the ventral and caudal surfacesof the ferret’s lateral gyrus.
DISCUSSIONThe critical period for ocular dominance plasticity inthe ferretWe have characterized the time course of the effect of monocularlid suture on ocular dominance plasticity in the ferret. Corticalsusceptibility to monocular deprivation begins around P35, a fewdays after natural eye opening, and peaks around P42.The criticalperiod in the ferret therefore has a clear beginning that is laterthan the time at which neurons in the visual cortex begin torespond well to visual stimulation. In the present experiments, noocular dominance shifts were found in 411 units recorded in eightanimals in which monocular deprivation ended before postnatalday 30 (2 d MD at P28 and 7 d MD at P19 and P21; Table 1). ByP30, responses of visual cortical neurons are strong, despite thefact that most neurons lack orientation selectivity (Chapman andStryker, 1993). The finding of a beginning to the critical period isconsistent with similar results found in the mouse (Gordon andStryker, 1996) and in several studies of the cat (Hubel and Wiesel,1970; Olson and Freeman, 1980).
As has been found in other species (LeVay et al., 1978, 1980),the ferret’s critical period for ocular dominance plasticity coin-cides with the period during which geniculocortical projections toV1 are refined. The beginning of the critical period correspondsclosely to the age at which ocular dominance columns can first bedetected by transneuronal labeling techniques (Finney and Shatz,
1998; Ruthazer et al., 1999). Similarly, the end of the mostsensitive part of the critical period, P60, corresponds with the ageat which transneuronal labeling reveals ocular dominance col-umns of mature appearance (Ruthazer et al., 1999). Togetherwith the transneuronal studies, the physiologically identified crit-ical period defines the time course of ocular dominance columndevelopment in the ferret.
The duration of deprivation had a profound effect on the extentof cortical changes. While 7 d deprivations were sufficient toinduce a saturating shift in ocular dominance, 2 d deprivationswere ;70% as effective. The ferret cortex therefore changes moreslowly in response to monocular deprivation than does the catcortex, in which 2 d of deprivation produces a saturating oculardominance shift (Crair et al., 1997b). Although the factors un-derlying this interspecies difference are obscure, structural differ-ences between cat and ferret V1 may account for it. In the ferret,cortical cells are more monocular at the onset of the criticalperiod than are cells in cat V1. The normal critical period ageferrets studied here had an average monocularity index slightlylarger than that of critical period kittens (0.56 6 0.04 criticalperiod ferrets, n 5 3 hemispheres vs ;0.45 in 3- to 4-week-oldcats, estimated from Hubel and Wiesel, 1970, Crair et al., 1998).Because the population of cells in ferret V1 is more monocularthan that in cat V1, competition between eyes may proceed moreslowly (Mustari and Cynader, 1981).
The larger average size of ferret ocular dominance columnsmeans there is less border length between opposite-eye columnsin a given area of ferret cortex than in cat cortex. If changes inocular dominance proceed along ocular dominance column bor-ders, the smaller border length in the ferret may slow the overallprogress of ocular dominance changes. NMDA receptors, whichhave been implicated in cortical plasticity associated with MD invivo (Kleinschmidt et al., 1987; Bear et al., 1990; Roberts et al.,1998), have been demonstrated to be organized into patches thatcoalign with borders of ocular dominance columns in the cat(Trepel et al., 1998, but see Catalano et al., 1997). The relativepaucity in ocular dominance borders, and therefore smallerNMDA-receptor-rich areas, if they exist in the ferret, may ac-count for the slower progress of plasticity in the ferret.
Strabismus-like changes in the adultMonocular deprivation that starts after the critical period causesan effect like that of strabismus in the ferret visual cortex. Afterlate-onset deprivation, each eye is represented to a normal extentin V1, but few cells are driven by both eyes. In earlier studies inother species, such a shift to monocularity was associated withstrabismus during the critical period (Hubel and Wiesel, 1965).Under these conditions, equal cortical activity from the two eyesmaintains the appropriate balance of eye inputs, but because theactivity is uncorrelated, binocular interactions are minimized.With monocular deprivation, activity in the two eyes is uncorre-lated, but also imbalanced. During the critical period the imbal-ance in activity causes a loss of deprived-eye inputs, but withdeprivations begun after the critical period, the lack of correla-tion between inputs seems to be the more significant patterningforce.
A loss of binocularity has also been observed in cats that weremonocularly deprived either very briefly or at the end of thecritical period (Hubel and Wiesel, 1970; Olson and Freeman,1980). The loss of binocularity in such mildly deprived cats can beexplained as a loss of responsiveness to the deprived eye by theformerly binocular cells, for which both eyes could compete
Figure 6. Monte Carlo analysis of pinwheel-peak distances. To deter-mine whether pinwheel centers in the ferret are closer to peaks of oculardominance columns than would be expected by chance, we performed aMonte Carlo analysis of distances between pinwheel centers and oculardominance peaks. The positions of pinwheel centers and ocular domi-nance peaks were determined for each hemisphere imaged. The distancebetween each ocular dominance peak and its nearest pinwheel center wasmeasured. The distributions of pinwheel-peak distances were grouped bydevelopmental stage and eye stimulated. Group 1, Critical period animalsstimulated through the deprived eye ( x); group 2, critical period, nonde-prived eye (E); group 3, old, deprived eye (1); group 4, old, nondeprived(‚). For each group, the cumulative distribution is plotted against dis-tance. For the Monte Carlo analysis, each imaged hemisphere was treatedindividually: the same number of pinwheels as was in the original imagewas placed randomly on the image, whereas ocular dominance peakswere not moved. The distributions of distances produced from 5000simulations on each map were grouped into a single cumulative dis-tribution (solid line). There was no statistical difference between any ofthe four distributions and their image-appropriate Monte Carlo distribu-tion (Kolmogorov–Smirnov one-sample test; p . 0.05).
6974 J. Neurosci., August 15, 1999, 19(16):6965–6978 Issa et al. • Ferret Critical Period for Visual Plasticity
(Shatz and Stryker, 1978; Olson and Freeman, 1980). Cells ini-tially driven exclusively by the deprived eye remain responsive tothat eye because of the reduced opportunity for competition. Inthis case, few cells remain binocular (equivalent to a large mo-nocularity index), but the majority of the cortex is dominated by
the nondeprived eye (equivalent to a large shift index). In theferret, however, there is not a loss of cells dominated by thedeprived eye; the shift index in deprived adult ferrets, as innormal ferrets, is near zero. Thus, a major difference between theloss of binocularity observed in mildly deprived cats and that
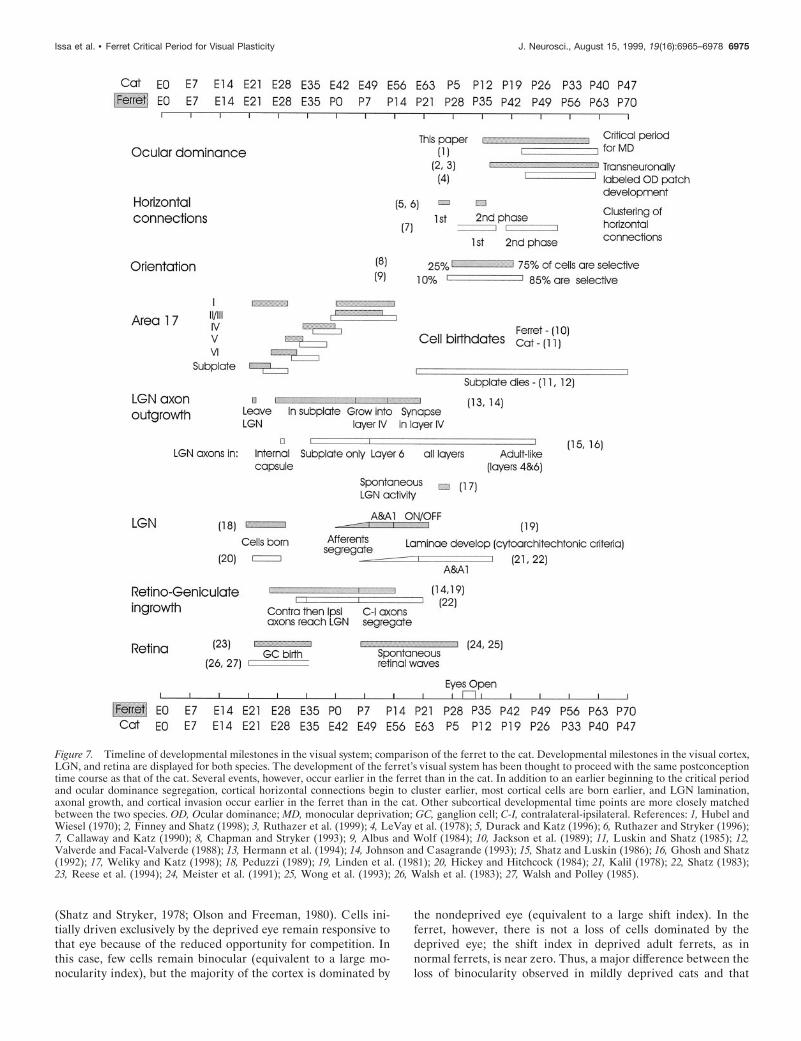
Figure 7. Timeline of developmental milestones in the visual system; comparison of the ferret to the cat. Developmental milestones in the visual cortex,LGN, and retina are displayed for both species. The development of the ferret’s visual system has been thought to proceed with the same postconceptiontime course as that of the cat. Several events, however, occur earlier in the ferret than in the cat. In addition to an earlier beginning to the critical periodand ocular dominance segregation, cortical horizontal connections begin to cluster earlier, most cortical cells are born earlier, and LGN lamination,axonal growth, and cortical invasion occur earlier in the ferret than in the cat. Other subcortical developmental time points are more closely matchedbetween the two species. OD, Ocular dominance; MD, monocular deprivation; GC, ganglion cell; C-I, contralateral-ipsilateral. References: 1, Hubel andWiesel (1970); 2, Finney and Shatz (1998); 3, Ruthazer et al. (1999); 4, LeVay et al. (1978); 5, Durack and Katz (1996); 6, Ruthazer and Stryker (1996);7, Callaway and Katz (1990); 8, Chapman and Stryker (1993); 9, Albus and Wolf (1984); 10, Jackson et al. (1989); 11, Luskin and Shatz (1985); 12,Valverde and Facal-Valverde (1988); 13, Hermann et al. (1994); 14, Johnson and Casagrande (1993); 15, Shatz and Luskin (1986); 16, Ghosh and Shatz(1992); 17, Weliky and Katz (1998); 18, Peduzzi (1989); 19, Linden et al. (1981); 20, Hickey and Hitchcock (1984); 21, Kalil (1978); 22, Shatz (1983);23, Reese et al. (1994); 24, Meister et al. (1991); 25, Wong et al. (1993); 26, Walsh et al. (1983); 27, Walsh and Polley (1985).
Issa et al. • Ferret Critical Period for Visual Plasticity J. Neurosci., August 15, 1999, 19(16):6965–6978 6975
observed in deprived adult ferrets is the lack of a concomitantshift in overall ocular dominance (CBI) in the ferret.
A pattern of age-dependent deprivation effects similar to thatobserved in the ferret was seen by Kasamatsu et al. (1979) in catsthat received norepinephrine infusions into visual cortex. Theseworkers suggested that a first stage of the response to monoculardeprivation was a loss of binocular responsiveness rather than aloss of responses to the deprived eye and that this process wasenhanced by norepinephrine in older animals. If the strabismus-like changes in the adult ferret are analogous to those in thenorepinephrine-treated cat, then one may speculate that the levelof tonic input to visual cortex from the central noradrenergicsystem is comparatively high in the adult ferret.
The finding that monocular deprivation can produce astrabismus-like pattern of cortical activity may be relevant to atype of secondary strabismus found in humans after prolongedmonocular deprivation by cataract. Studies in nonhuman pri-mates suggest that visual deprivation can cause strabismus. Var-ious protocols of monocular deprivation begun near the time ofbirth of a monkey can produce interocular misalignment (Quicket al., 1989), whereas binocular deprivation at young ages cancause a loss of binocularly responsive cortical neurons (Wieseland Hubel, 1974). Similar to findings in visually deprived mon-keys, children with corrected congenital cataract can develop asecondary strabismus with attendant amblyopia and poor stere-opsis (for review, see Maurer and Lewis, 1993). In a smallfraction of adults, furthermore, a secondary strabismus with cen-tral fusion disruption can develop when a monocular cataract ispresent for .2 years (Pratt-Johnson and Tillson, 1989). Becausevisual acuity is not significantly degraded after the removal ofsuch a cataract, the development of secondary strabismus likelyreflects a loss of cortical binocularity similar to that seen in themonocularly deprived adult ferret. Although strabismus has beenseen with monocular deprivation in young animals (Sherman,1972; Quick et al., 1989), it has not been possible to separate thephysiological effects of MD-induced strabismus from the conse-quences of the degradation of cortical responses to the deprivedeye. Because strabismus-like changes in the adult ferret developin the absence of an overall shift in ocular dominance, study of themonocularly deprived adult ferret may give insight into the pa-thology and prevention of secondary strabismus. It should benoted, however, that available findings do not establish whetherthe changes in cortical binocularity produced by MD in the adultferret are reversible or whether they would give rise tostrabismus.
Intrinsic signal imagingWe assessed the effects of monocular deprivation on orientationand ocular dominance maps by imaging intrinsic cortical signals.Maps of V1 and V2 from monocularly deprived ferrets wereconsistent with the findings of monocular deprivation studies incat (Crair et al., 1997b) in demonstrating well-oriented responsesto nondeprived-eye stimulation and weak or absent responses todeprived-eye stimulation, except in patches, within which strongresponses were poorly selective for orientation. The results fromthe ferret differed from those of the cat in that no clear relation-ship between pinwheel centers and ocular dominance peaks wasfound. The cat may represent a special case in this regard. Crairet al. (1997b) proposed that pinwheel centers and ocular domi-nance peaks colocalize because they develop under a sharedlearning rule. The similarity of the number of pinwheels (;2.2pinwheels/mm2; Bonhoeffer et al., 1995, Rao et al., 1997) to the
number of ocular dominance peaks (;2.7 peaks/mm 2; Crair etal., 1997a) in cat V1 may allow their alignment through a weakcorrelation-based rule that is ineffective when orientation pin-wheels vastly outnumber ocular dominance peaks, as is the case inthe ferret (see Results).
Given the lack of coincidence of ocular dominance peaks andpinwheel centers in the normal ferret, it is not surprising thatthere is no clear relationship after monocular deprivation. In bothcats and ferrets, deprived-eye patches lose their orientation se-lectivity. In the deprived cats, however, the deprived-eye patchesare even closer to the pinwheel centers than in normal animals.Crair et al. (1997b) proposed that this was attributable to anadvantage that cells at pinwheel centers, which may be poorlyoriented (in kittens, Ruthazer et al., 1996; but see Maldonado etal., 1997 on adult cats), have over neighboring orientation-selective regions when competition is based on response to non-oriented activity, as would be the case for cells driven through thedeprived eye. In the ferret, the same simple learning rule canexplain the loss of orientation selectivity in deprived-eye patches:deprived-eye inputs, stimulated only by unpatterned retinal ac-tivity, maintain or strengthen only unoriented connections.
Comparison with the development of the catFigure 7 summarizes several milestones in the development of theferret and cat visual systems (with references given in the figure)in relation to the critical period defined in this report. The ratesof development of the cat’s and the ferret’s visual systems aregenerally similar starting from the day of conception rather thanthe time of birth (Linden et al., 1981). The cat’s gestational periodis 21 d longer than the ferret’s, and its eyes open ;21 postnataldays before the eyes of the ferret. Taking into account additionalparameters of visual development, it becomes apparent that sev-eral features of the ferret’s visual system develop earlier than inthe cat. The ferret’s LGN becomes laminated and extends axonsinto visual cortex ;1 week before the cat’s LGN does. Most cellsin the ferret visual cortex, with the exception of layer II /III cells,are born 2–5 d earlier than their cat counterparts. In addition,ocular dominance column formation occurs somewhat earlier inthe ferret. The cat’s critical period begins 82–87 d after concep-tion (;P21; Hubel and Wiesel, 1970), whereas the ferret’s begins;75 d after conception (;P35). This is consistent with transneu-ronal studies in which ferret ocular dominance columns firstappear around P37, postconception day 79, and cat ocular dom-inance columns appear by P22, cat postconception day 87. Over-all, although the same events in the two species occur in nearlythe same order, the pace of development appears to be slightlymore rapid in the ferret.
REFERENCESAlbus K, Wolf W (1984) Early post-natal development of neuronal func-
tion in the kitten’s visual cortex: a laminar analysis. J Physiol (Lond)348:153–185.
Antonini A, Stryker MP (1993a) Development of individual geniculo-cortical arbors in cat striate cortex and effects of binocular impulseblockade. J Neurosci 13:3549–3573.
Antonini A, Stryker MP (1993b) Rapid remodeling of axonal arbors inthe visual cortex. Science 260:1819–1821.
Bear MF, Kleinschmidt A, Gu Q, Singer W (1990) Disruption ofexperience-dependent synaptic modifications in striate cortex by infu-sion of an NMDA receptor antagonist. J Neurosci 10:909–925.
Bonhoeffer T, Grinvald A (1996) Optical imaging based on intrinsicsignals; the methodology. In: Brain mapping: the methodology, pp75–97. New York: Academic.
Bonhoeffer T, Kim D-S, Malonek D, Shohem D, Grinvald A (1995)Optical imaging of the layout of functional domains in area 17 and
6976 J. Neurosci., August 15, 1999, 19(16):6965–6978 Issa et al. • Ferret Critical Period for Visual Plasticity
across the area 17/18 border in cat visual cortex. Eur J Neurosci7:1973–1988.
Callaway EM, Katz LC (1990) Emergence and refinement of clusteredhorizontal connections in cat striate cortex. J Neurosci 10:1134–1153.
Callaway EM, Lieber JL (1996) Development of axonal arbors of layer 6pyramidal neurons in ferret primary visual cortex. J Comp Neurol376:295–305.
Catalano SM, Chang CK, Shatz CJ (1997) Activity dependent regula-tion of NMDAR1 immunoreactivity in the developing visual cortex.J Neurosci 17:8376–8390.
Chapman B, Stryker MP (1993) Development of orientation selectivityin ferret visual cortex and effects of deprivation. J Neurosci13:5251–5262.
Chapman B, Zahs KR, Stryker MP (1991) Relation of cortical cellorientation selectivity to alignment of receptive fields of the geniculo-cortical afferents that arborize within a single orientation column inferret visual cortex. J Neurosci 11:1347–1358.
Chapman B, Stryker MP, Bonhoeffer T (1996a) Development of orien-tation preference maps in ferret primary visual cortex. J Neurosci16:6443–6453.
Chapman B, Zahs KR, Harris SL, Stryker MP (1996b) Plasticity follow-ing monocular deprivation in ferret primary visual cortex. Soc NeurosciAbstr 22:1727.
Crair MC, Ruthazer ES, Gillespie DC, Stryker MP (1997a) Ocular dom-inance peaks at pinwheel center singularities of the orientation map incat visual cortex. J Neurophysiol 77:3381–3385.
Crair MC, Ruthazer ES, Gillespie DC, Stryker MP (1997b) Relationshipbetween the ocular dominance and orientation maps in visual cortex ofmonocularly deprived cats. Neuron 19:307–318.
Crair MC, Gillespie DC, Stryker MP (1998) The role of visual experi-ence in the development of columns in cat visual cortex. Science279:566–570.
Dalva MB, Katz LC (1994) Rearrangements of synaptic connections invisual cortex revealed by laser photostimulation. Science 265:255–258.
Dantzker JL, Callaway EM (1998) The development of local, layer-specific visual cortical axons in the absence of extrinsic influences andintrinsic activity. J Neurosci 18:4145–4154.
Daw NW, Fox K, Sato H, Czepita D (1992) Critical period for monoc-ular deprivation in the cat visual cortex. J Neurophysiol 67:197–202.
Durack JC, Katz LC (1996) Development of horizontal projections inlayer 2/3 of ferret visual cortex. Cereb Cortex 6:178–183.
Finney EM, Shatz CJ (1998) Establishment of patterned thalamocorticalconnections does not require nitric oxide synthase. J Neurosci18:8826–8838.
Ghosh A, Shatz CJ (1992) Pathfinding and target selection by develop-ing geniculocortical axons. J Neurosci 12:39–55.
Gordon JA, Stryker MP (1996) Experience-dependent plasticity of bin-ocular responses in the primary visual cortex of the mouse. J Neurosci16:3274–3286.
Hermann K, Antonini A, Shatz CJ (1994) Ultrastructural evidence forsynaptic interactions between thalamocortical axons and subplate neu-rons. Eur J Neurosci 6:1729–1742.
Hickey TL, Hitchcock PF (1984) Genesis of neurons in the dorsal lateralgeniculate nucleus of the cat. J Comp Neurol 228:186–199.
Hirsch JA (1995) Synaptic integration in layer IV of the ferret striatecortex. J Physiol (Lond) 483:183–199.
Hubel DH, Wiesel TN (1962) Receptive fields, binocular interaction andfunctional architecture in the cat’s visual cortex. J Physiol (Lond)160:106–154.
Hubel DH, Wiesel TN (1965) Binocular interaction in striate cortex ofkittens reared with artificial squint. J Neurophysiol 28:1041–1051.
Hubel DH, Wiesel TN (1970) The period of susceptibility to the physi-ological effects of unilateral eye closure in kittens. J Physiol (Lond)206:419–436.
Hubel DH, Wiesel TN, LeVay S (1977) Plasticity of ocular dominancecolumns in monkey striate cortex. Philos Trans R Soc B Biol Sci278:131–163.
Hubener M, Shoham D, Grinvald A, Bonhoeffer T (1997) Spatial rela-tionships among three columnar systems in cat area 17. J Neurosci17:9270–9284.
Jackson CA, Hickey TL (1985) Use of ferrets in studies of the visualsystem. Lab Anim Sci 35:211–215.
Jackson CA, Peduzzi JD, Hickey TL (1989) Visual cortex developmentin the ferret. I. Genesis and migration of visual cortical neurons.J Neurosci 9:1242–1253.
Johnson JK, Casagrande VA (1993) Prenatal development of axon out-growth and connectivity in the ferret visual system. Vis Neurosci10:117–130.
Kalil R (1978) Development of the dorsal lateral geniculate nucleus inthe cat. J Comp Neurol 182:265–292.
Kasamatsu T, Pettigrew JD, Ary M (1979) Restoration of visual corticalplasticity by local microperfusion of norepinephrine. J Comp Neurol185:163–181.
Kleinschmidt A, Bear MF, Singer W (1987) Blockade of “NMDA”receptors disrupts experience-dependent plasticity of kitten striate cor-tex. Science 238:355–358.
Law MI, Zahs KR, Stryker MP (1988) Organization of primary visualcortex (area17) in the ferret. J Comp Neurol 278:157–180.
LeVay S, Stryker MP, Shatz CJ (1978) Ocular dominance columns andtheir development in layer IV of the cat’s visual cortex: a quantitativestudy. J Comp Neurol 179:223–244.
LeVay S, Wiesel TN, Hubel DH (1980) The development of oculardominance columns in normal and visually deprived monkeys. J CompNeurol 191:1–51.
Linden DC, Guillery RW, Cucchiaro J (1981) The dorsal lateral genic-ulate nucleus of the normal ferret and its postnatal development.J Comp Neurol 203:189–211.
Luskin MB, Shatz CJ (1985) Neurogenesis of the cat’s primary visualcortex. J Comp Neurol 242:611–631.
Maldonado PE, Godecke I, Gray CM, Bonhoeffer T (1997) Orientationselectivity in pinwheel centers in cat striate cortex. Science276:1551–1555.
Maurer D, Lewis TL (1993) Visual outcomes after infantile cataract. In:Early visual development, normal and abnormal (Simons KW, ed), pp454–484. New York: Oxford UP.
McAllister AK, Lo DC, Katz LC (1995) Neurotrophins regulate den-dritic growth in developing visual cortex. Neuron 15:791–803.
McAllister AK, Katz LC, Lo DC (1996) Neurotrophin regulation ofcortical dendritic growth requires activity. Neuron 17:1057–1064.
McAllister AK, Katz LC, Lo DC (1997) Opposing roles for endogenousBDNF and NT-3 in regulating cortical dendritic growth. Neuron18:767–778.
Meister M, Wong ROL, Baylor DA, Shatz CJ (1991) Synchronousbursts of action potentials in ganglion cells of the developing mamma-lian retina. Science 252:939–943.
Mustari M, Cynader M (1981) Prior strabismus protects kitten corticalneurons from the effects of monocular deprivation. Brain Res211:165–70.
Nelson DA, Katz LC (1995) Emergence of functional circuits in ferretvisual cortex visualized by optical imaging. Neuron 15:23–34.
Olson CR, Freeman RD (1975) Progressive changes in kitten striatecortex during monocular vision. J Neurophysiol 38:26–32.
Olson CR, Freeman RD (1980) Profile of the sensitive period for mon-ocular deprivation in kittens. Exp Brain Res 39:17–21.
Peduzzi JD (1989) Neurogenesis of the geniculate nucleus in the ferret.Soc Neurosci Abstr 15:1210.
Pratt-Johnson J, Tillson G (1989) Intractable diplopia after vision resto-ration in unilateral cataract. Am J Ophthalmol 107:23–26.
Quick MW, Tigges M, Gammon JA, Boothe RG (1989) Early abnormalvisual experience induces strabismus in infant monkeys. Invest Oph-thalmol Vis Sci 30:1012–1017.
Rao SC, Toth LJ, Sur M (1997) Optically imaged maps of orientationpreference in primary visual cortex of cats and ferrets. J Comp Neurol387:358–370.
Redies C, Diksic M, Riml H (1990) Functional organization in the ferretvisual cortex: a double-label 2-deoxyglucose study. J Neurosci10:2791–2803.
Reese BE, Thompson WF, Peduzzi JD (1994) Birthdates of neurons inthe retinal ganglion cell layer of the ferret. J Comp Neurol341:464–475.
Reiter HO, Waitzman DM, Stryker MP (1986) Cortical activity block-ade prevents ocular dominance plasticity in the kitten visual cortex.Exp Brain Res 65:182–188.
Roberts EB, Meredith MA, Ramoa AS (1998) Suppression of NMDAreceptor function using antisense DNA blocks ocular dominance plas-ticity while preserving visual responses. J Neurophysiol 80:1021–1032.
Rockland KS (1985) Anatomical organization of primary visual cortex(area 17) in the ferret. J Comp Neurol 241:225–236.
Issa et al. • Ferret Critical Period for Visual Plasticity J. Neurosci., August 15, 1999, 19(16):6965–6978 6977
Ruthazer ES, Stryker MP (1996) The role of activity in the developmentof long-range horizontal connections in area 17 of the ferret. J Neurosci16:7253–7269.
Ruthazer ES, Crair MC, Gillespie DC, Stryker MP (1996) Orientationtuning of single cells at “pinwheel” orientation singularities in kittenvisual cortex. Soc Neurosci Abstr 22:277.
Ruthazer ES, Baker GE, Stryker MP (1999) Development and organi-zation of ocular dominance bands in primary visual cortex of the sableferret. J Comp Neurol 407:151–165.
Shatz CJ (1983) The prenatal development of the cat’s retinogeniculatepathway. J Neurosci 3:482–499.
Shatz CJ, Luskin MB (1986) The relationship between the geniculocor-tical afferents and their cortical target cells during development of thecat’s primary visual cortex. J Neurosci 6:3655–3668.
Shatz CJ, Stryker MP (1978) Ocular dominance in layer IV of the cat’svisual cortex and the effects of monocular deprivation. J Physiol (Lond)281:267–283.
Sherman SM (1972) Development of interocular alignment in cats. BrainRes 37:187–203.
Stryker MP, Harris WA (1986) Binocular impulse blockade prevents theformation of ocular dominance columns in cat visual cortex. J Neurosci6:2117–2133.
Trachtenberg JT, Issa NP, Stryker MP (1998) Critical period in ferretvisual cortex defined by brief monocular deprivation. Soc NeurosciAbstr 24:646.
Trepel C, Duffy KR, Pegado VD, Murphy KM (1998) Patchy distribu-tion of NMDAR1 subunit immunoreactivity in developing visual cor-tex. J Neurosci 18:3404–3415.
Valverde F, Facal-Valverde MV (1988) Postnatal development of inter-stitial (subplate) cells in the white matter of the temporal cortex of
kittens: a correlated Golgi and electron microscopic study. J CompNeurol 269:168–192.
Walsh C, Polley EH (1985) The topography of ganglion cell productionin the cat’s retina. J Neurosci 5:741–750.
Walsh C, Polley EH, Hickey TL, Guillery RW (1983) Generation of catretinal ganglion cells in relation to central pathways. Nature302:611–614.
Weliky M, Katz LC (1994) Functional mapping of horizontal connec-tions in developing ferret visual cortex: experiments and modeling.J Neurosci 14:7291–7305.
Weliky M, Katz LC (1997) Disruption of orientation tuning in visualcortex by artificially correlated neuronal activity. Nature 386:680–685.
Weliky M, Katz LC (1998) Spontaneous activity in the developing LGNin vivo: differential regulation of correlational structure by retinal andcortical inputs. Soc Neurosci Abstr 24:1517.
Weliky M, Bosking WH, Fitzpatrick D (1996) A systematic map ofdirection preference in primary visual cortex. Nature 379:725–728.
White LE, Bosking WH, Fitzpatrick D (1998) Functional architecture offerret visual cortex: thalamic inputs to identified ocular dominanceterritories. Soc Neurosci Abstr 24:1755.
Wiesel TN, Hubel DH (1963) Single-cell responses in striate cortex ofkittens deprived of vision in one eye. J Neurophysiol 26:1003–1017.
Wiesel TN, Hubel DH (1974) Ordered arrangement of orientation col-umns in monkeys lacking visual experience. J Comp Neurol158:307–318.
Wong ROL, Meister M, Shatz CJ (1993) Transient period of correlatedbursting activity during development of the mammalian retina. Neuron11:923–938.
Zahs KR, Stryker MP (1988) Segregation of ON and OFF afferents toferret visual cortex. J Neurophysiol 59:1410–1429.
6978 J. Neurosci., August 15, 1999, 19(16):6965–6978 Issa et al. • Ferret Critical Period for Visual Plasticity