Embed Size (px)
Citation preview
1
The Cross-Section of European IPO Returns
Josef Anton Schuster*
ABSTRACT
We apply a sector-based approach to companies going public in the six largest Continental European markets and Sweden during a period characterized by dramatic change. For a sample of 973 IPOs during 1988 and 1998, there is considerable underpricing which is time-varying and related to company characteristics. Much of the large �amounts of money left on the table� is due to privatization issues. For the sample as a whole, IPOs did not underperform in the long-run. Over shorter measurement horizons, we find overperformance. IPO performance is sensitive to market condition at the time of going public and IPO issuing characteristic. The favourable performance for the sample as a whole is driven by New Economy IPOs accounting for 28 percent of the sample. The pervasiveness of the outperformance of New Economy IPOs sheds light on the drivers behind the dramatic shift in industry composition of European IPOs in favor of New Economy IPOs during the �Internet Bubble�.
THE ACADEMIC LITERATURE on Initial Public Offerings (IPOs) has grown rapidly over the past decade. Much of this literature has focused on documenting and explaining empirical patterns associated with the phenomena surrounding IPOs: underpricing, �hot issue� markets, and long-run underperformance. The patterns and models that try to explain them are mostly from an American perspective whereas the European marketplace has received considerably less attention.
In this study, we seek to close this gap by extending the international evidence on IPOs to include 973 companies which went public on the six largest Continental European markets and Sweden between 1988 and 1998. The extension of empirical IPO work to a pan-European scale responds to a number of fundamental developments during the past decade which have shaped European stock markets.
First, throughout the 1990s, the European IPO market has developed as one of the cornerstones of the worldwide IPO market. This has been fostered either by privatization programs introducing �equity culture� to the Continental European marketplace, by initially highly successful stock exchange segments catering to companies in high-growth industries, or by the convergence of listing requirements, reporting rules and pricing mechanisms across Europe. Within this setting, European
* Josef Anton Schuster is an Associated Member of the Financial Markets Group and completed this research as part of his 2003 PhD in the department of Accounting and Finance at the London School of Economics and Research Assistant at the Financial Markets Group. Any opinions expressed here are those of the author and not necessarily those of the Financial Markets Group. I have greatly benefited from comments by Dan Bradley, Margaret Bray, Do-soung Choi, Gregory Connor, Darrell Duffie, Bob Nobay, Jean-Charles Rochet, Hyong Song Shin, David Webb and seminar participants at the European Financial Management Association Meeting London (2002), German Finance Association Meeting (2002), Goldman Sachs International, London School of Economics, Seoul National University and Stanford University. Special thanks to Jinhui Luo for many useful discussions. Corresponding address. E-mail: [email protected]. This version: August 2003.
2
IPO activity has overtaken US IPO activity. During the late 1990s, more companies went public and more funds were raised by companies on the European market segments than in the US.1 Second, European integration has been at work for some time now, and the changes brought about by the introduction of the European single currency and the adoption of a common monetary policy have resulted in a dramatic change in portfolio allocation decisions. As the barriers to cross-border investing have declined, it has become increasingly important for issuers and investors alike to evaluate the European market from the perspective of a full set of available opportunities across countries. One of those consequences has been the rise of pan-European sector analysis at the expense of individual country analysis. Third, by taking a pan-European perspective, we are able to investigate the performance patterns of a large enough sample of IPOs over a period that stretches beyond the rising markets of the late 1990s. This allows us to shed more light on the generality of the empirical patterns and theoretical foundations associated with IPOs. Finally, to the degree that a broad industry mix characterizes our sample of European IPOs, this analysis may also provide an interesting perspective of the performance of US IPOs in the post-bubble period.2
Some issues are of particular interest. Our first objective is to study the underpricing phenomenon for European IPOs. Here, we are interested in whether initial returns are time-varying and related to company characteristics. We are also interested in studying the relation between short-run and long-run IPO returns because institutional arrangements in the IPO aftermarket that are unrelated to fundamentals seem to affect the IPO price dynamics. These institutional arrangements include short-selling restrictions (Geczy, Musto and Reed (2002)), the �quiet period� (Bradley, Jordan and Ritter (2002)), aftermarket stabilization through price support (Aggarwal (2002)) and the expiration of the �lock-up� period (Bradley, Jordan, Roten, and Yi, (2001)). Recent studies show that IPO underperformance is a time-varying phenomenon (Gompers and Lerner (2001)) or disappears in sub-sample analysis (Brav and Gompers (1997)). We study how European IPO returns relate to this evidence. Finally, the sample period has also been characterized by unprecedented changes in global economies caused by the increasing role of technology, the effects of which are still subject to intense debate (Gordon (2001)). This has had a dramatic impact on the composition of equity indices in general, and the nature of companies seeking an IPO in particular. We are interested in finding out whether the performance patterns of European IPOs mirror this change.
In this respect we make a number of interesting observations that appear robust across various methodological choices:
(1) For the sample of 973 European IPOs offered between 1988 and 1998, we find considerable underpricing which is time-varying and related to proxies of uncertainty, such as age or sector. There is a large discrepancy between the mean and median amount of �money left on the table� which is due to the impact of large privatizations.
(2) For the sample as a whole we do not find long-run underperformance. This is consistent with Gompers and Lerner�s (2001) conjecture that long-run IPO underperformance is a time-varying phenomenon. Over the short-run, there is significant absolute and relative overperformance. This result supports the
1 Jenkinson and Ljungqvist (2001) provide a comprehensive coverage of the theory, empirical evidence, international patterns and institutional practices. 2 Ritter (2002) reports a median age of 14 years for US IPOs in 2002, the oldest for any year between 1980 and 2002, much higher than the median age of seven years reported over the whole 23-year period. This is similar to the median age of 17 years for our sample of European IPOs between 1988 and 1998.
3
growing literature that addresses the effect of institutional practices on the IPO return dynamics (Duffie, Gârleanu and Pedersen (2002)).
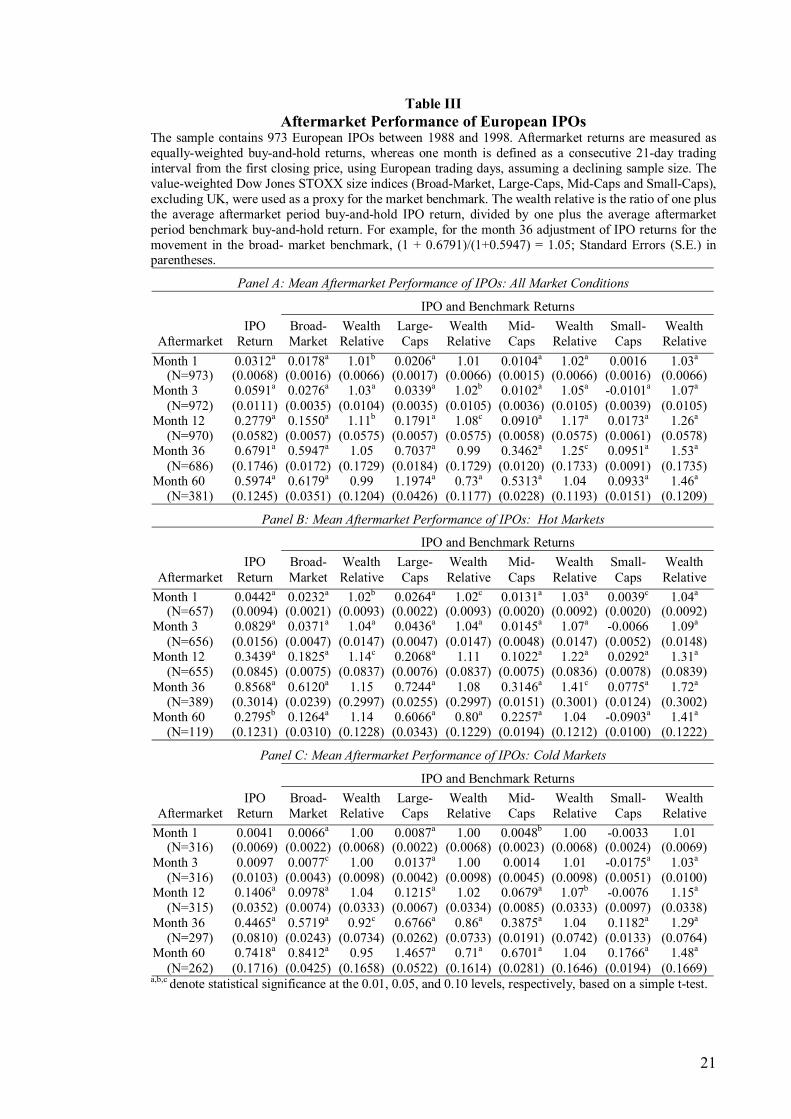
(3) IPOs offered in �hot� markets, during which the general market is generally rising and which have the highest initial return, are associated with the best absolute and relative IPO performance. IPOs offered in �cold� markets, where underpricing is lower and stock markets are either stable or falling, experience poorer absolute and relative aftermarket performance. For the sample as a whole, this does not necessarily indicate that European IPOs issued in �hot� markets were aggressively priced in order to take advantage of �windows of opportunity�.
(4) The study emphasizes the significant difference in IPO performance of sub-groups of IPOs (Brav and Gompers (1997)). There is strong evidence to support the fact that aftermarket performance is positively related to underpricing and negatively related to the size of the public float. Moreover, the relatively favourable aftermarket performance throughout the sample period is driven by New Economy IPOs, which account for 28 percent of the sample on average. This can help to explain the dramatic shift in industry composition of IPOs towards New Economy IPOs during the �Internet Bubble� of 1999 and 2000.
The rest of this paper is organized as follows: Section I discusses the empirical anomalies associated with IPOs and surveys some of the main theories that try to explain them. The data, sample and methodology are described in Section II. In Section III, we turn to the examination of initial and aftermarket performance. Here, we also study aftermarket performance when categorized according to issuing characteristics and present regression results. Section IV concludes the chapter and discusses the significance of our findings in order to help to explain recent events.
I. Patterns in IPOs A. Initial Pricing
One observed pattern in IPOs concerns the existence of abnormal initial returns, whereby the first market price is on average significantly higher than the offering price. This adjustment is usually interpreted as evidence of IPO underpricing. Over the years, a large body of literature has documented the underpricing phenomenon (Logue (1973), Ibbotson (1975), Ritter (1984), Ibbotson, Sindelar and Ritter (1988)). In a recent study, Ritter and Welch (2002) find an average first-day return of 18.8 percent when looking at 6,240 US IPOs issued between 1980 and 2001. The underpricing phenomenon has also been documented internationally (Loughran and Ritter (1995)).
A number of papers reviewing the theoretical literature classify the theories of underpricing based on whether the information between issuer, underwriter and different groups of investors is assumed to be symmetric or not. The underwriter plays a particularly crucial role. It performs three main functions: underwriting, advising and distribution. Owing to the potentially conflicting incentives offered by these functions, underwriters may face a trade-off between the costs and benefits of underpricing. On the one hand, for instance, underpricing may lower both the risk that the issue fails as well as the efforts in marketing. On the other hand, since underwriting fees are typically proportional to gross floatation proceeds, and thus negatively related to the degree of underpricing, investment banks should have an incentive to minimize underpricing.
4
Because of the important role of an investment bank in practice, we divide the theories related to underpricing into two sections on the premise that explanations related to the underpricing phenomenon assume a more passive or active role of the underwriter.3 It must be noted that many of the underpricing theories are not mutually exclusive.
A.1. Theories assuming a passive role of the underwriter Winner�s Curse
One model, in which underwriters act primarily as passive agents for the issuing firm, has been developed by Rock (1986). His winner�s curse hypothesis explains the underpricing phenomenon in terms of information asymmetry among the different groups of investors, the issuing firm and the underwriter. The information asymmetry arises because an issuer faces an unknown demand for its shares from two types of investors. The first group consists of outside or informed investors who have better knowledge about the prospective cash flow than does the issuing firm and its underwriter for which it incurred a cost. These informed investors will only submit purchase orders if the offering price is less than the true value of the IPO. The second type, uninformed investors, lack special knowledge about firm value. They may participate in the market even though they did not purchase information. Consequently, informed investors will bid for more shares of the more successful firms, which will leave the uninformed investors with a disproportionate amount of the less successful IPOs. In addition, since the allocation is not made on a pro rata basis and over subscription and rationing can occur, the bias against uninformed investors can be even larger if the underwriters favor the informed investors. This information asymmetry may lead to Akerlof�s (1970) �lemons problem�, where the uninformed investor ends up primarily with the less successful issues. Underpricing the issue results in compensating uninformed investors for the bias in the allocation mechanism. The model generates a number of empirical predictions. For example, underpricing will be directly proportionate to the ex-ante uncertainty surrounding the issue.
The empirical literature is supportive of the model�s predictions in countries where underwriters play a relatively passive role in bringing new issues to market. Koh and Walter (1989), using information on rationing, find that an uninformed strategy in Singapore just about broke even. Keloharju (1993) also finds evidence of a winner�s curse in Finland. Ritter (1984) verifies some predictions and finds a monotonous link between underpricing and empirical proxies for uncertainty, such as sales and the daily aftermarket standard deviation of stock returns for the first month in aftermarket trading.
Information Cascades
In the information cascades or �herding� hypothesis, developed by Welch (1992), it is assumed that, in aggregate, investors hold perfectly accurate information about the issuing firm. However, information concerning the value of the shares is highly uncertain for investors. Furthermore, it is assumed that it takes investment bankers time to approach interested investors because of their limited distribution channels. The hypothesis draws from the notion that potential investors base their investment decisions not only on their own information about the issue, but also on whether or not other investors, who were approached earlier, are purchasing. Thus, subsequent 3 The recent literature on IPO underpricing focuses on the institutional aspects of underpricing and the role of the underwriter. In particular, the theory and evidence concerning the allocation of shares has stimulated a large number of papers. See Ritter and Welch (2002) for a literature survey.
5
investors will view the actions of previous investors as an indication of what information they hold privately. Thus, they will imitate the purchasing decisions of their predecessors. Consequently, an issuer may want to underprice an offering to induce the first few potential investors to buy and induce a cascade in which all subsequent investors want to buy irrespective of their own information. When combining the cascades hypothesis within a setting of a pricing process in which the underwriter dynamically adjusts the IPO price, positively sloped demand curves can result.4
Empirical support for the cascades hypothesis is mixed. Barry and Jennings (1992) reject the cascades model in favor of the dynamic information acquisition argument, while in a recent work, Amihud, Hauser and Kirsh (2002) test the theory on a sample of 284 IPOs in the Tel Aviv Stock Exchange between 1989 and 1993 and find evidence consistent with herding. More specifically, they found that investors either subscribed overwhelmingly to new issues, which resulted in very small allocations, or largely abstained from subscribing so that the issue was undersubscribed and subscribers received full allocations, with very few cases in-between. Signaling
Another line of theoretical literature reverses Rock�s assumption regarding informational asymmetry and assumes that the issuer is better informed than investors. Here, underpricing is a means for high quality firms to distinguish themselves from low quality issuers. These studies are motivated by Ibbotson�s (1975) conjecture that the issuer may want to �leave a good taste in investors� mouths.� In the signaling models, banks are simply assumed to be passive distributors of shares to the general public.
In Allen and Faulhaber (1989), bad managers, who are more likely to run bad firms, are deterred from mimicking good managers who underprice, because subsequent cash flows partially reveal the firm�s type. Consequently, their model implies that firms that underprice more are likelier to have higher dividends, and that the market reacts more favourably to dividend announcements by firms that underprice more. In Welch�s (1989) model, risk-neutral entrepreneurs sell a fraction of their firm in an unseasoned offering and the remainder in a subsequent seasoned offering. Low-quality firms that mimic high quality firms must pay an exogenously specified operation cost, which the high-quality firms do not incur. In some cases, this cost may be insufficient to deter mimicking, and underpricing becomes the additional wedge that deters low-quality firms in the separating equilibrium. In Grinblatt and Hwang (1989), a firm employs two signals to convey the mean and variance of its future cash flow: the degree of underpricing and the fraction of shares held by insiders. To overcome the asymmetric information problem, the issuer signals the true value of the firm by offering shares at a discount and by retaining some of the shares. In the model�s separating equilibrium, a firm�s intrinsic value is positively related to underpricing. This model is a generalization of Leland and Pyle�s (1977) signaling hypothesis which suggests that, by retaining a significant ownership stake in the firm, entrepreneurs can signal project quality as false representation can be costly. The hypothesis therefore predicts relatively superior performance of IPO firms with high entrepreneurial ownership.
4 Similar dynamics can be applied when a cut in the offer price may actually scare away potential investors. See Financial Times (June 26, 2002) for the dynamics leading to the postponement and eventual cancellation of the IPO of Prada SpA, and CBS Marketwatch.com (July 2, 2002), describing the circumstances surrounding the IPO of CIT Group Inc., an insurance company and Tyco International Inc. spin-off, which offered shares at $23 against an expected range of $25 to $29 and closed at $22 after the first day of trading in an adverse company and market environment.
6
The empirical support for the signaling models of underpricing is mixed. Michaely and Shaw (1994) find no support for signaling. They find no evidence of either a higher propensity to pay dividends for IPOs that were more underpriced or of a higher propensity to return to the market for a seasoned equity offering. The insider holding variable has no significant power to explain initial returns and there is no evidence to suggest that insider holdings provide a credible signal of firm quality that reduces uncertainty and, therefore, initial underpricing. Neither the initial-day return nor the fraction held by insiders seems to explain the value of the firm two years after going public. Jegadeesh, Weinstein and Welch (1993) find that returns after the first day are just as effective in inducing future issuing activity as the first-day returns are. While providing evidence suggesting a positive relation between managerial ownership retention and post-IPO operating performance, Jain and Kini (1994) find no support that firms that underprice more produce superior operating performance after the IPO. Legal Liability
A further line of research does not rely on asymmetric information that is resolved on the first day of trading. Ibbotson (1975) and Tinic (1988) have suggested that the issuing firm may underprice to reduce the legal liability arising from any false or inadequate information in the prospectuses.
Drake and Vetsuypens (1992), however, call such a conclusion into question. By examining a sample of 93 US firms from 1969 to 1990 that are sued after their IPO, they find that the average initial return for the sample firms is approximately the same as that for a control group of IPOs of similar size. They also present evidence that litigation typically results from some unfavourable company-specific news in the aftermarket and not from IPO overpricing on the first trading day. Keloharju (1993) argues that, given the paucity of legal liabilities associated with the process of going public in Finland, it is unlikely that potential legal liability has much to do with the observed initial returns.5
A.2. Theories assuming an active role of the underwriter Underwriter Reputation
While their focus was on signaling firm quality through underpricing, Allen and Faulhaber (1989) and Welch (1989) had already noted that signaling could also be accomplished through the choice of underwriter.
Carter and Manaster (1990) uncovered that high-quality underwriters are typically associated with less underpricing. Findings in Beatty and Welch (1996) and Cooney, Singh, Carter and Dark (2001) document, however, that the relationship between underwriter reputation and underpricing has changed over time, casting doubt on the theory. Loughran and Ritter (2001) report that unlike the 1980s, IPOs that are managed by high-prestige underwriters during the internet boom in the late 1990s are associated with more underpricing than IPOs managed by less prestigious underwriters.
Underwriter Price support
Ruud (1993) challenges the conventional view that positive average initial IPO returns result from deliberate underpricing. By investigating the distribution of initial 5 Chalmers, Dann and Harford (2002) analyze a sample of 72 US IPOs between 1992 and 1996 and investigate the amount and cost of D&O liability insurance. They find a significant negative relation between the three-year post-IPO stock price performance and the insurance coverage purchased in conjunction with the IPO.
7
returns of 469 IPOs in 1982 and 1983, she shows that positive mean initial returns result from a partially censored left (negative) tail. She argues that underwriter price support or stabilization can account for this censoring of the distribution of initial returns because in the US regulatory framework, the practice is not considered manipulative as long as it is disclosed in the offering prospectus. The theory predicts that a large percentage of stocks should experience positive initial and short-run abnormal aftermarket returns. More specifically, because underwriters remove price support over time, prices of fully priced or just-underpriced IPOs are more likely to fall than to rise over the short-term.6
Miller and Reilly (1987) examine the returns and spread behaviour of IPOs over the first five days of trading and find that the relation of the spread and its determinants differs between overpriced and underpriced issues only on the first trading day. For a sample of 1,523 NASDAQ IPOs issued between 1982 and 1987, Hanley, Kumar and Seguin (1993) find evidence suggesting that stabilization significantly affects quoted spreads. Moreover, significant negative returns are documented after the termination of stabilization. Dynamic Information Acquisition
The dynamic information acquisition argument - also referred to as bookbuilding theory or information-gathering theory (Beneviste and Spindt (1989), Beneviste and Wilhelm (1990) and Spatt and Srivastava (1991)) - studies the process whereby the offer price is set and its effect on underpricing. The assumed pricing mechanism is the bookbuilding process, whereby, after setting a preliminary offer price range, the underwriter and issuer solicit �indications of interest� from prospective investors during the �road show�, where the company is marketed to selected, typically institutional investors. Through bookbuilding, investment banks extract information about the true value from investors.7 The investors natural inclination to bid lower during the marketing phase entails a trade-off: while it increases the potential profit from selling the IPO in the immediate aftermarket, assuming shares have been allocated at the offering price, it also jeopardizes the probability and size of their allocations. In order to induce investors to reveal that they want to purchase shares at a high price, the investment banker must offer them a combination of underpricing and share allocations in return.
There is strong empirical support for the bookbuilding theory of underpricing. Hanley (1993) documents that the relation of the final offer price to the range of anticipated offer prices disclosed in the preliminary prospectus, is a good predictor of initial returns. Having documented evidence for the partial adjustment phenomenon for a sample of 1,430 US IPOs from January through September 1987, she finds that issuers that have final offer prices exceeding the limits of the offer range have greater underpricing than all other IPOs, and are also more likely to increase the number of shares issued. The final offer price only �partially adjusts� to new information. Using a unique dataset from 39 international equity issues that used bookbuilding between 1995 and 1997, Cornelli and Goldreich (2001) find that the investment banker awards more shares to bidders who provide information in their bids or to those who bid regularly. 6 Aggarwal (2000) provides a detailed account of the mechanics of stabilization in the aftermarket. 7 In a more general context, Jenkinson, Ljungqvist, and Wilhelm (2000) use a dataset of 2,051 IPOs in 61 non-US markets during the period 1992-1999 and find that bookbuilding � while costing around twice as much as the fixed costs offering - leads to substantially less underpricing.
8
Investment Banker�s Monopsony Power Baron (1982) offers an agency-based explanation for underpricing. His theory
assumes that the value of a new issue is affected by market demand and by the investment banker�s selling effort. In the model, the investment banker is better informed about market demand than the issuer, but his distribution effort is unobservable. To address this moral hazard, the optimal contract sets the issue�s offering price below its �true value�, defined as the equilibrium offering price when the investment banker expends his best effort.
Some empirical evidence of self-underwritten IPOs refutes this theory. Muscarella and Vetsuypens (1989) find that when underwriters themselves go public, their shares are just as underpriced, even though there is no monitoring problem.
Loughran and Ritter (2002) argue that agency problems between underwriters and issuing firms, largely latent in the 1980s, have become increasingly important and are partly responsible for the high initial returns of Internet stocks during the late 1990s. They postulate that higher valuations have resulted in issuers being more complacent about �leaving money on the table�. In this context, they apply Prospect Theory, developed by Kahneman and Tversky (1979), to the IPO market. Here, individuals often violate Bayes� Rule and rational choice theories when making decisions under uncertainty in experimental settings. Loughran and Ritter (2002) predict that in most situations issuers will sum the wealth loss from underpricing with the larger wealth gain on the retained shares from a price jump, producing a net increase in wealth for pre-issue shareholders. They empirically show that most of the money left on the table comes from a minority of IPOs. In the cross-section, the IPOs that were underpriced most were those where the offer price was revised upwards from what had been anticipated at the time of filing the initial price range. This observation is consistent with the dynamic information acquisition theory of Beneviste and Spindt (1989) and the empirical documentation of the partial adjustment phenomenon by Hanley (1993). It is also in line with Habib and Ljungqvist (2001) who argue that the opportunity cost of underpricing is less if the relative float is small. The complacency about underpricing, combined with the desire of underwriters to leave money on the table so as to receive indirect compensation from buy-side clients that were favoured in IPO allocations, resulted in even greater underpricing during the boom in Internet stocks during the late 1990s.8
This conjecture is similar to Shiller�s (1990) �Impresario� hypothesis of underpricing, whereby underwriters choose a lower offering price because they know that the cumulative profit of underpricing (through less transparent forms of revenue streams such as brokerage commissions) will be higher than maximizing revenue for the single event (compensation in the form of the gross underwriter spread).9
8 For a related article see, Wall Street Journal Europe (Mai 05, 2002): eToys Sues Goldman Sachs Over Management of Its IPO. ��The relatively low price set for the IPO, the suit alleges, robbed eToys of hundreds of millions of dollars of cash that could have helped the company to stave off bankruptcy. The shares nearly quadrupled in the price on their first day of trading. The suit charged Goldman induced some investors to agree to give the firm a portion of the profits they later made on eToys shares in exchange for getting IPO stock allocation �� 9 On January 22, 2002, Credit Suisse First Boston (CSFB), an investment bank, agreed to settle a $100 million with the Securities and Exchange Commission (SEC), the US regulatory agency, based on the following allegations: �� From at least April 1999 through June 2000, CSFB employees allocated shares of IPOs to over 100 customers who were willing to funnel between 33 and 65 percent of their IPO profits to CSFB. The profits were channeled to CSFB in the form of excessive brokerage commissions generated by the customers in unrelated securities trades that the customers effected solely to satisfy CSFB�s demands for a share of the IPO profits�� (Source: SEC Litigation Release No. 17327). Ritter and Welch
9
B. Cycles in IPO activity Another anomaly associated with IPOs is the �hot issue� phenomenon, whereby the
observed issuing activity exhibits significant, recurrent, and to some extent predictable variations over time. Ibbotson and Jaffe (1975) were among the first to identify significant autocorrelation in both the monthly number of IPOs and the monthly average underpricing of IPOs. Ritter (1984) studies initial returns for US IPOs between 1960 and 1982 and finds highly significant autocorrelation in monthly average initial returns and in monthly IPO volume. He also observes that periods of high volume tend to follow periods of high average initial returns. In the cross-section of the data, he identifies a 15-month period during which the average initial return was 48.4 percent, as contrasted with an average initial return of 16.3 percent for the rest of the period. This �hot� IPO market is also concentrated in a certain class of industries and a certain group of underwriters. In a recent study, Lowry and Schwert (2002) find an autocorrelation coefficient of monthly average first-day returns of 0.60 between 1960 and 1997, which increased during the Internet boom in the late 1990s. They confirm a significant positive relation between initial returns and future IPO volume and note that, �increased numbers of companies go public after observing that IPOs are being underpriced by the greatest amount.� They associate the cycles in initial returns with the investment bankers� learning process. Because the registration periods of many IPOs overlap, the information that underwriters learn during one firm�s registration period will contribute to the first-day returns of many IPOs.
The prospect theory explanation of the partial adjustment phenomenon addresses the phenomenon of �hot issue� markets in a similar fashion (Loughran and Ritter (2001)). It predicts that all IPOs that are in the �road show� stage of going public when there is an overall market rally, will have higher expected underpricing because offer prices are not raised as much as they could be. Because of the length of the bookbuilding period, which can take from four weeks to four months, the first day returns of these IPOs will be correlated.
Shiller�s (1990) �Impresario� hypothesis can also explain the positive autocorrelation in IPO activity and initial returns reported in the literature. �Hot� markets appear when underwriters exploit a segment sought to be ripe for a �fad�. Even though many investors may be unwilling to follow a �fad�, they may find it profitable to follow positive feedback investment strategies (Rajan and Servaes (1993)). Acting this way, they may actually have caused the positive autocorrelation themselves. In the more general setting of �fads� described by Aggarwal and Rivoli (1990), �fads� occur in �hot issue� periods when investors are especially overoptimistic about the growth potential of the firms that go public, induced by the �Impresario�, the investment bank taking the company public. Firms time their IPOs in precisely these periods in order to take advantage of �windows of opportunity�. It follows that �hot� markets for IPOs should be concentrated in certain industry classes, dominated by specific underwriters and that IPO activity should come from those companies for which issuing equity is always the least favoured choice of financing. Moreover, companies with the largest initial returns should have the lowest subsequent aftermarket returns.
(2002) calculate that the practice of funneling back IPO profits through excessive trading may have accounted for up to 250 million shares per trading day during 1999 to 2000.
10
C. Return Dynamics in Aftermarket Trading Most of the literature on aftermarket performance concentrates on how IPO shares
perform over three- to five years. Over those time horizons, IPO shares seem, on average, to perform poorly when measured against various benchmarks. Ritter (1991) finds that every dollar invested in a portfolio of IPOs purchased at the closing market price on the end of the first day of trading results in a terminal wealth of $1.3447 over three years, while every dollar in the matching firm results in $1.6168, a ratio of only 0.841 during the same period. He performs the study for a total sample of 1,526 US IPOs of common stock in 1975-84. The international evidence also supports the notion of poor long-run performance. Álvarez and Gonzáles (2001), Espenlaub, Gregory and Tonks (1998), Giudici and Paleari (1999), Leleux and Muzyka (1998) or Schuster (1996) all highlight low market-adjusted long-run returns for various European IPO markets. Jain and Kini (1994) extend this evidence to show that long-run performance is also accompanied by poor financial accounting performance post-IPO relative to pre-IPO performance. However, because there has been a sustained effort to extend empirical evidence on IPO performance beyond the past two decades, it has become apparent that the results on long-run performance are sensitive to the time-period chosen. In a large out-of-sample test, Gompers and Lerner (2001) study the five-year aftermarket performance of a sample of 3,661 US IPOs from 1935 to 1972 and find that the long-run performance of IPOs depends considerably on the method used for calculating returns and performance. The authors conclude, ��While the results do not rule out the possibility of more broad-based sentiment-driven mispricing, they provide little support of a distinct IPO effect.�
Another facet that has attracted much academic interest addresses the relation between short- and long-run IPO returns. One of the first to document the dynamics in aftermarket trading was Stoll and Curley (1970). They found that investors in new small issues floated under Regulation A in 1957, 1959, and 1963, experienced lower long-run rates of return than if they had invested in a portfolio of large stocks represented by the Standard & Poor�s 425 Industrial Average. However, short-run price appreciation of the 643 companies in the sample was considerably greater than the appreciation of large-cap stocks. Considerable short-run overperformance is also reported in Ritter (1991) and Schuster (1996).
It is difficult to explain these price dynamics in the IPO aftermarket within a semi-rational setting. Miller (1977) proposes a theory that is consistent with the empirical findings. Assuming the presence of short-selling constraints and heterogeneous investors� expectations, he argues that the prices of new issues are set not by the appraisal of the typical investor, but by the small minority who think highly enough of the investment merits of the new issue to include it in their portfolio. This �divergence of opinion� about a new issue is greatest when the stock is issued, either because the company has not yet started operations, or because there is uncertainty about the success of new products or the profitability of a major business expansion.
As a result, short-sale constraints lead to upward biases in stock prices, as pessimistic investors are restricted from short-selling. Over time, as the variance of opinion decreases and the company acquires a history of earnings, the marginal investor�s valuation will converge towards the mean valuation and IPOs will start to underperform. Duffie, Gârleanu and Pedersen (2002) present a dynamic model of the determination of prices, lending fees and short interest that is consistent with this theory. They show that, if lendable securities are difficult to locate, then the price of the security is initially elevated and expected to decline over time. This decline increases in
11
the degree of heterogeneity of beliefs of investors about the future value of the security. Harrison and Kreps (1978), Morris (1996) and Scheinkman and Xiong (2002) show that short-selling constraints can lead to prices higher than the valuations of all investors. Empirically, Gecy, Musto and Reed (2001) find an extra cost to shorting hotter IPOs.
A number of other institutional arrangements in the short-run aftermarket, unrelated to fundamentals, have an effect on prices. For example, some recent studies examine the expiration of IPO lockup agreements. Lockup agreements are a feature of US and IPOs in international markets and prohibit insider sales before a pre-specified date, usually 180 calendar days after the IPO. Since insiders often own a majority of the firm, the potential for an increase in the supply of tradable shares following lockup expiration could have a significant effect on the value of the stock. Bradley, Jordan, Roten, and Yi (2001), Brav and Gompers (2002) and Field and Hanka (2001) document significant negative abnormal returns of approximately two percent around lockup expiration. Moreover, Bradley, Jordan and Ritter (2002) investigate the performance of IPOs around the expiration of the �quiet period� � typically the first 25 calendar days in aftermarket trading when a company is still �in registration� and subject to a number of regulatory restrictions that prohibit certain activities, such as analyst coverage.
Using a sample of 1,611 firms going public over the period 1996 to 2000, they find that firms, for which coverage is initiated, experience a significantly positive abnormal return of 4.1 percent in a five-day period surrounding the end of the �quiet period�. This compares to an insignificant 0.1 percent for firms that do not have coverage initiated. Most of these abnormal returns experienced by firms with coverage occur in the days before the quiet period expires.
Furthermore, Aggarwal (2000) pays attention to the stabilization activities of underwriters in the aftermarket and their influence on prices by studying a sample of 137 US IPOs going public during May and July 1997. She finds that direct intervention or �pure� stabilization, in which an identified stabilizing bid is posted, is never done, and that aftermarket short-covering, which has the same result as pure stabilization, but has no disclosure requirements, is the principal form of stabilization. Stabilization by short-covering can occur because the underwriter initially sells shares in excess of the original amount offered, which is then covered by exercising the overalottment option and/or by short covering in the aftermarket during 30 calendar days after the offering. She also finds that stabilization seems to have a permanent rather than a temporary effect on prices, a similar observation made by Schultz and Zaman (1994).
Several behavioural explanations have also been advanced for the empirical findings. Teoh, Welch and Wong (1998) relate the analysis of IPO performance to earnings management and find that investors do not fully take into consideration that financial accounts of companies going public are managed before the IPO, and therefore base their valuation on a naïve extrapolation of the past. They use discretionary current accruals as a proxy for earnings management and show that companies, which boost their earnings most in the IPO year, also have the worst long- run performance. Ritter (1991), Lerner (1994), Loughran and Ritter (1995, 2001) or Baker and Wurgler (2000) discuss another set of behavioural explanations for poor long-run performance. They suggest that stock prices periodically diverge from fundamental values, and that managers and investment bankers take advantage of overpricing by selling stock to overly optimistic investors. This in line with De Bondt and Thaler�s (1985) conjecture that, at least for low-capitalization stocks, there is a negative relation between past and subsequent abnormal returns on individual securities using holding periods of one year or more which they interpret as evidence of market overreaction.
12
II. Data, Sample and Methodology
A. Data
In order to be included in the sample, the relevant companies pursuing an IPO had to meet the following criteria: (1) the company�s main headquarter is registered in Germany, France, Italy, The Netherlands, Spain, Sweden or Switzerland with the obligation to publish consolidated and/or parent company accounts, (2) the company is listed on one of the three tiers of the main stock exchange in the respective country: the Official Market, the Official Parallel Market or the New Market, and meets the relevant listing requirements, (3) each share is given an offer price of 5.00 units of national currency or more, (4) gross proceeds, measured in terms of end-1998 purchasing power, of the equivalent of Euro (�) 2.0 million or more, and (5) the offering being unseasoned and involved common and/or preferred stock.10 While the sample includes Privatizations (13), spin-offs and equity-carve outs (26), we have excluded foreign listings, Real Estate Investment Trusts (REITs), investment trust and certificates, demutualizations and companies that transferred from one market segment to another.11
The data was hand-collected individually from each of the respective country. It is unique in its entirety as it spans over a relatively long period of time covering at least one market cycle of IPO activity in the seven largest European countries ranked in terms of market capitalization, excluding the UK, and is not commercially available.12 The data collection process involved a two-stage process:
First, in order to insure a most complete sample, we identified the IPOs by collecting information from the individual stock exchanges, national publications in the respective country or other sources such as regulatory agencies, central banks, commercial providers and, if necessary, by directly contacting the issuing company. This step included the search for full name of the offering company, nationality, IPO date and place of the offering, total number of shares issued, public float adjusted for overalottment options exercised, issue price, sector and year of foundation. We did not collect data for issuing activity in the secondary market.13 For Germany, information provided by the Frankfurt Stock Exchange and the various yearly issues of the Saling Aktienführer were primary data sources of company data.14 Data on French issuers and issuing characteristics was obtained from the annual lists published by Euronext France and Sociétés cotées, 1996 and 1999 edition, Cofisem. Italian IPO data came from Indici e Dati, 1992 and 1999 edition, Mediobanca and from the Italian Stock Exchange. Euronext Netherlands and Effectengids, 2000 edition, Kluwer, were the primary source for data on Dutch IPOs. Spanish IPO company data was obtained from the Madrid Official Stock Exchange Bulletins and from CNMV, the Spanish regulating agency. Swedish data is from annual reports of the OM Stockholm Exchanges and from Six AB.
10 The large number of IPOs issuing dual-class shares is a relatively unique feature of the Swedish IPO market. For Germany, for example, only seven companies issued dual-class shares during the sample period 1988 to 1998. 11 For empirical evidence relating to privatizations or equity carve-outs, see D�Souza and Megginson (1999) or Vijh (1999). 12 Capitaldata, a division of Euromoney PLC, is a commercial provider of IPO information. For the period 1988 to 1998, their IPO database includes around 550 companies, almost half of our database. This commercially available data includes only limited cross-sectional IPO characteristics. 13 A large number of empirical studies link seasoned issuing activity with IPO performance. For European markets see, for example, Espenlaub and Tonks (1998) or Stehle, Erhardt and Przyborowsky (1998). 14 We want to thank Hoppenstedt Finanzinformationen GmbH, for allowing access to their archives.
13
The Swiss Stock Exchange and Swiss Central Bank were sources of the data for the sample of Swiss IPOs.15
Second, we collected daily closing stock prices from the national stock market operators, academic institutions and, if necessary, commercial services. Sources of the German stock price data included the University of Karlsruhe Stock Price Database, the Frankfurt Stock Exchange and daily issues of the Frankfurter Allgemeine Zeitung. French, Italian and Spanish Stock Price data was made available by Euronext Paris and the Italian and Madrid Stock Exchange, respectively. Data on Swedish stock returns was obtained from Six AB. Dutch and Swiss stock price data was collected from Datastream. We used Dow Jones for the time-series data for the four size-based benchmark indices. Macroeconomic data such as Exchange rates and GDP deflators was collected from Datastream. Stock prices are adjusted for dividends, stock splits or rights offerings and were calibrated to a European trading day calendar and converted into Euro (�). Share prices represent closing prices and care was taken that quotations represented actual trades. For our sector analysis, we use the Dow Jones STOXX global sector classification standard.16
The resulting IPO sample is comprised of 973 companies that conducted an IPO of common and/or preferred stock between 1988 and 1998 on one of the three main market segments of the main national stock exchange operators in Germany (219 companies), France (323), Italy (77), The Netherlands (75), Spain (88), Sweden (148) and Switzerland (43).17 Based on our original stock exchange records, this represents at least 90 percent of IPO activity in Continental Europe between 1988 and 1998, measured in terms of number of IPOs and aggregate gross proceeds. The sample does not suffer from survivorship bias. Only seven companies were delisted before their third-year anniversary. In this section, we look at IPOs issued over the period 1988 to 1998 using stock returns through February 23, 2001. This implies a declining sample size of 686 companies when measuring returns over three years and 381 companies when measuring returns over a five-year window.18 B. Sample
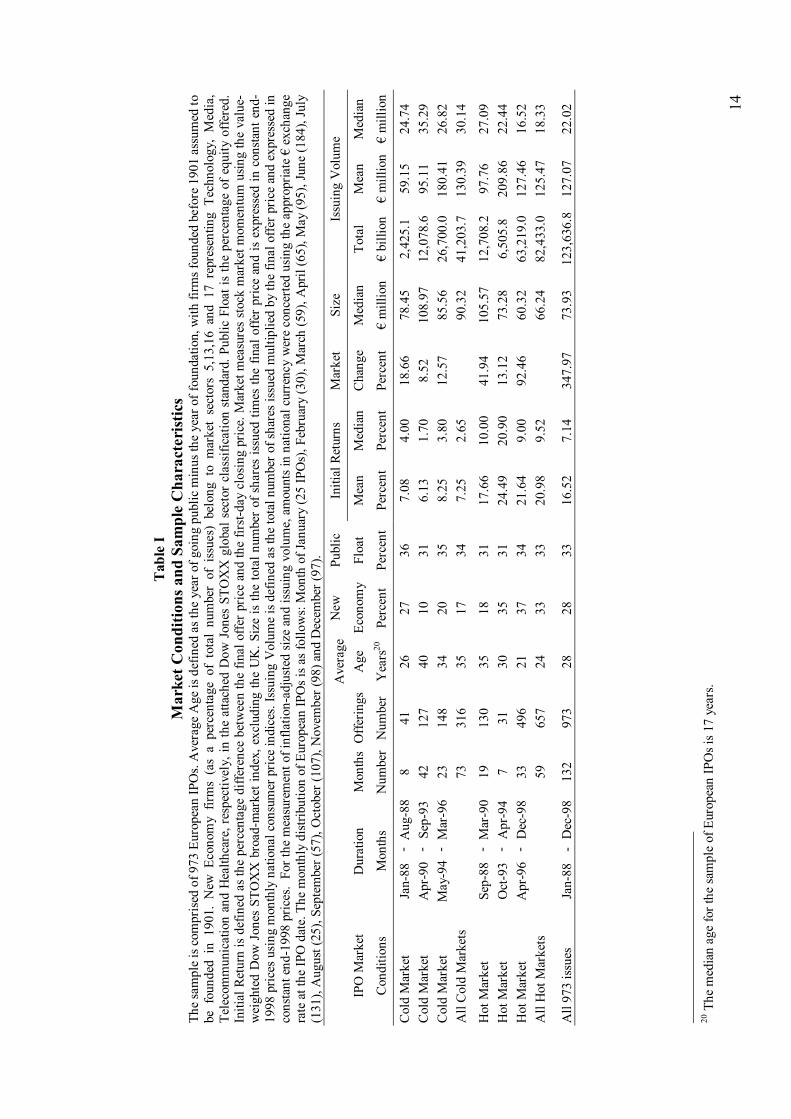
In Table I, we provide some summary statistics for our sample.19 While presenting evidence for the sample as a whole, we also divide IPOs based on whether they were
15 Prof. Alfred Mettler kindly supplied fundamental data on Swiss IPOs issued between 1988 and 1990. 16 The Dow Jones STOXX global industry classification standard is displayed in the Appendix, Table AI. 17 The market segments are (Number of IPOs in brackets): Germany (Deutsche Börse AG: Amtlicher Handel (80), Geregelter Markt (89), Neuer Markt (50)); France (SBF-Paris Bourse SA*: Premier Marché (21), Second Marché (231), Nouveau Marché (71)); Italy (Borsa Italiana SpA: Borsa Valori (70) Mercato Ristretto (7)); The Netherlands (Amsterdam Exchanges NV*: Officiële Markt, (56) Officiële Parallel Markt (8)); Spain (Bolsa de Madrid SA: Primer Mercado (56), Segundo Mercado (32)); Sweden (OM Stockholm Exchanges AB: A-list (15), OTC-list (52), O-list (81)); and Switzerland (SWX Swiss Exchange AG: SWX Hauptsegment, (35) SWX Nebensegment (8)). *Merged to Euronext SA. 18While not reported separately here, we also calculate results with constant sample sizes of 686 and 381 IPOs, respectively. The results confirm that changes in measurement periods and sample sizes do not change the qualitative nature of the findings presented here. 19 The sample differs from US studies in some important respects. Our sample period does not overlap with Ritter (1991) who looks at IPOs from 1971 to 1988. Neither does it completely overlap with Brav and Gompers (1997) who study 3,407 nonventure-backed and 934 venture-backed US IPOs between 1975 and 1992. Moreover, while Ritter (1991) and Brav and Gompers (1997) focus on reporting long-run returns over three and five years, we present evidence on the dynamics of short- and long-run performance over a variety of dimensions.
14
Tab
le I
Mar
ket C
ondi
tions
and
Sam
ple
Cha
ract
eris
tics
The
sam
ple
is c
ompr
ised
of 9
73 E
urop
ean
IPO
s. A
vera
ge A
ge is
def
ined
as t
he y
ear o
f goi
ng p
ublic
min
us th
e ye
ar o
f fou
ndat
ion,
with
firm
s fou
nded
bef
ore
1901
ass
umed
to
be f
ound
ed i
n 19
01.
New
Eco
nom
y fir
ms
(as
a pe
rcen
tage
of
tota
l nu
mbe
r of
iss
ues)
bel
ong
to m
arke
t se
ctor
s 5,
13,1
6 an
d 17
rep
rese
ntin
g Te
chno
logy
, M
edia
, Te
leco
mm
unic
atio
n an
d H
ealth
care
, res
pect
ivel
y, in
the
atta
ched
Dow
Jon
es S
TOX
X g
loba
l sec
tor
clas
sific
atio
n st
anda
rd. P
ublic
Flo
at is
the
perc
enta
ge o
f equ
ity o
ffere
d.
Initi
al R
etur
n is
def
ined
as t
he p
erce
ntag
e di
ffere
nce
betw
een
the
final
offe
r pric
e an
d th
e fir
st-da
y cl
osin
g pr
ice.
Mar
ket m
easu
res
stoc
k m
arke
t mom
entu
m u
sing
the
valu
e-w
eigh
ted
Dow
Jon
es S
TOX
X b
road
-mar
ket i
ndex
, exc
ludi
ng th
e U
K. S
ize
is th
e to
tal n
umbe
r of
sha
res
issu
ed ti
mes
the
final
offe
r pr
ice
and
is e
xpre
ssed
in c
onsta
nt e
nd-
1998
pric
es u
sing
mon
thly
nat
iona
l con
sum
er p
rice
indi
ces.
Issu
ing
Vol
ume
is d
efin
ed a
s the
tota
l num
ber o
f sha
res i
ssue
d m
ultip
lied
by th
e fin
al o
ffer p
rice
and
expr
esse
d in
co
nsta
nt e
nd-1
998
pric
es.
For t
he m
easu
rem
ent o
f inf
latio
n-ad
just
ed si
ze a
nd is
suin
g vo
lum
e, a
mou
nts i
n na
tiona
l cur
renc
y w
ere
conc
erte
d us
ing
the
appr
opria
te �
exc
hang
e ra
te a
t the
IPO
dat
e. T
he m
onth
ly d
istri
butio
n of
Eur
opea
n IP
Os i
s as f
ollo
ws:
Mon
th o
f Jan
uary
(25
IPO
s), F
ebru
ary
(30)
, Mar
ch (5
9), A
pril
(65)
, May
(95)
, Jun
e (1
84),
July
(1
31),
Aug
ust (
25),
Sept
embe
r (57
), O
ctob
er (1
07),
Nov
embe
r (98
) and
Dec
embe
r (97
).
Ave
rage
New
Pu
blic
In
itial
Ret
urns
M
arke
t Si
ze
Issu
ing
Vol
ume
IPO
Mar
ket
Dur
atio
n M
onth
sO
fferin
gsA
ge
Econ
omy
Floa
t M
ean
Med
ian
Cha
nge
Med
ian
Tota
l M
ean
Med
ian
Con
ditio
ns
Mon
ths
Num
ber
Num
ber
Yea
rs20
Perc
ent
Perc
ent
Perc
ent
Perc
ent
Perc
ent
� m
illio
n �
billi
on
� m
illio
n�
mill
ion
Col
d M
arke
t Ja
n-88
-
Aug
-88
8 41
26
27
36
7.
08
4.00
18
.66
78.4
5 2,
425.
1 59
.15
24.7
4 C
old
Mar
ket
Apr
-90
- Se
p-93
42
12
7 40
10
31
6.
13
1.70
8.
52
108.
97
12,0
78.6
95
.11
35.2
9 C
old
Mar
ket
May
-94
- M
ar-9
6 23
14
8 34
20
35
8.
25
3.80
12
.57
85.5
6 26
,700
.0
180.
41
26.8
2 A
ll C
old
Mar
kets
73
316
35
17
34
7.25
2.
65
90
.32
41,2
03.7
13
0.39
30
.14
Hot
Mar
ket
Sep-
88
- M
ar-9
0 19
13
0 35
18
31
17
.66
10.0
0 41
.94
105.
57
12,7
08.2
97
.76
27.0
9 H
ot M
arke
t O
ct-9
3 -
Apr
-94
7 31
30
35
31
24
.49
20.9
0 13
.12
73.2
8 6,
505.
8 20
9.86
22
.44
Hot
Mar
ket
Apr
-96
- D
ec-9
8 33
49
6 21
37
34
21
.64
9.00
92
.46
60.3
2 63
,219
.0
127.
46
16.5
2 A
ll H
ot M
arke
ts
59
65
7 24
33
33
20
.98
9.52
66.2
4 82
,433
.0
125.
47
18.3
3
All
973
issu
es
Jan-
88
- D
ec-9
8 13
2 97
3 28
28
33
16
.52
7.14
34
7.97
73
.93
123,
636.
812
7.07
22
.02
20 T
he m
edia
n ag
e fo
r the
sam
ple
of E
urop
ean
IPO
s is 1
7 ye
ars.
15
issued in �hot� or �cold� markets. Because of big fluctuations in the level of the stock market and IPO activity throughout the sample period, this potentially enables us to draw more inferences about the robustness of the patterns associated with IPOs.
The most frequently used definition of �hot� IPO markets is based on �volume�. Loughran and Ritter (1995), for example, describe the 1980s as �hot� because most of that decade had much higher issuance volume than the 1970s. Helwege and Liang (2001) define �hot� and �cold� months according to volume of issuance, based on a three-month centred moving average of the number of IPOs for each month in the sample. Similar to Ritter (1984) and Ibbotson and Jaffe (1975), we define �hot� IPO markets based on the level of underpricing.21 We also include a proxy for the general level of the stock market into the analysis. Initially, we define those months with higher average monthly underpricing compared to median underpricing for the total sample as �hot� IPO months; we consider those months during which the mean is lower than the median as �cold� IPO months. We apply the same procedure to our proxy for market returns. Months during which the market return exceeds the median for the monthly series of 132 months (January 1988 � December 1998), are defined as �hot� market months. Likewise, months during which the market return is less than the median are considered �cold� months. Finally, we match �hot� (�cold�) IPO months with �hot� (�cold�) market months to identify �hot� and �cold� IPO markets. During 118 months, (89 percent of the entire period), a �hot� (�cold�) IPO month corresponds to a �hot� (�cold�) market month. During 14 months, a �hot� (�cold�) IPO month does not correspond to a �hot� (�cold�) market months. We attribute part of this to seasonalities in the underwriting industry. The overall pattern confirms our earlier conjecture about the close link between the level of the stock market and underpricing.
Of the 132 months, we identify 73 months as �cold� markets and 59 months as �hot� markets and mark three individual �hot� and �cold� market periods. In more than half of the 132 issuing months, the general market was either stable or falling. For example, the longest �cold� market period occurred between April 1990 and September 1993. During this period, only 127 IPOs went public, averaging 6.13 percent initial return. This period was characterized by subdued economic conditions in Continental Europe following the German Unification. During the 42-month period, the Dow Jones STOXX broad-market index recorded a rise of 8.52 percent. Conversely, during the 33-month �hot� market period between April 1996 and December 1998, 496 IPOs went public with an average initial return of 21.64 percent. During this period, the general level of the market rose by 92.46 percent. Interestingly, the Asian and Russian Financial Crises in the autumn of 1998 did not have an impact on European IPO activity.
Between 1988 and 1998, 973 European companies raised a total of �123.6 billion on the stock market. Ritter (2001) reports that during the same period, 3,872 IPOs raised a total of $237.9 billion in the US. The average issuing volume of European IPOs of �127.1 million, however, is higher than the one reported for the US ($61.4 million). Some large offerings such as privatizations (13) and equity carveouts (26) account for part of the difference. For example, privatizations raised a total of �44.4 billion with a median issuing volume of �2.6 billion. On average, European companies going public have sold 33 percent of their company to the public (henceforth �public float�), which remained stable throughout the sample period. This observation is within the close range of 30 percent and 36 percent reported by Ritter (2001) for US IPOs issued between 1992 and 1998. Moreover, the average European IPO was 28 years old at the
21 Because of the presence of some very large IPOs, defining �hot� and �cold� markets by volume does potentially lead to misleading results.
16
time of going public. While the average age of European IPOs has declined throughout the sample period, it is still high compared to companies going public in the US. Ritter (1991), for example, finds an average age of six years. As shown in the Appendix, Table AI, European IPOs are clearly widespread among the various industries. This is different to Helwege and Liang (2001) who study 2,072 US IPOs between 1982 and 1993 and point out that US IPOs during this period are drawn largely from the same set of high-technology industries.
Table I shows that the sample composition is clustered in certain industries: in �cold� markets, the percentage of New Economy companies of total IPO activity is almost half of what is observed for IPOs issued under �hot� markets. Moreover, the average size of European IPOs in �cold� markets is �90.3 million compared to �66.2 million in �hot� markets. This reinforces the fact that IPO activity in �cold� markets, during which the stock market is generally more stable or declining, is associated with larger and more mature IPOs in Old Economy industries. Table I also demonstrates the changing composition of IPO issuers. It indicates that during the 1990s, New Economy sectors have gradually taken a bigger share of the total IPO market. During this time IPO age, size and median issuing volume has also declined considerably. This highlights the fact that money, previously flowing into mature industries with lower growth prospects, had started to flow into young, technology-oriented companies focusing on growth. C. Methodology
While the estimation of initial returns is less problematic, there are several factors
that must be taken into account when estimating abnormal returns over longer time horizons. Barber and Lyon (1997) and Kothari and Warner (1997) both highlight the problems associated with calculating long-run abnormal returns using either a reference portfolio or an asset pricing model.
Barber and Lyon (1997) demonstrate that many of the commonly used matching procedures are poorly specified and abnormal return estimates can be systematically nonzero. They also show that seemingly minor changes in experimental features can have a major impact on the results. These include the benchmark for measuring abnormal returns, cumulating procedures or the populations from which securities are drawn.22 In this context, they isolate one parametric procedure that may be well-specified, specifically to calculate abnormal returns as the buy-and-hold returns on a sample firm less the buy-and-hold return on a control firm with similar size and book-to-market characteristics.23 The authors also suggest a rebalancing bias that arises because the compounded returns of a reference portfolio, such as an equally weighted market index, are usually calculated assuming periodic rebalancing, whereas the returns of sample firms are compounded without rebalancing. Furthermore, they also point out that a new listing bias arises when an IPO firm, which is known to perform badly following an IPO, is added to an index which will cause the index to underperform.
22 In context of European Markets, Dimson and Marsh (1986), report the importance of controlling for the size effect in the United Kingdom. Moreover, Brav and Gompers (1997) find that most institutional investors will not be significantly hurt by investing in IPOs because they usually do not buy the small issues that underperform most. 23For the European market, this is difficult because of the relative infancy of many of the stock markets in the study, with few comparable quoted firms and benchmarks available over a long period of time. The use of the Eurostoxx value-weighted size indices as benchmarks may also induce biases that result from the fact that these market indices are value-weighted.
17
Kothari and Warner (1997) also show that long-horizon tests are misspecified. They find that parametric long-horizon tests will often indicate abnormal performance when none is present and suggest that bootstrap procedures might be a promising way to minimize test statistic misspecification. Moreover, they suggest a survivorship bias, which occurs when the de-listed firms are simply removed and the index is rebalanced. This bias tends to cause the index to outperform a portfolio that includes delisted firms.
It must be noted that the inferences drawn by these authors can themselves be sensitive to experimental design. Both Barber and Lyon (1997) and Kothari and Warner (1997), for example, focus on measuring portfolio long-horizon performance in event time, rather than calendar time. As Fama (1998) points out, event time results may be misleading about the pervasiveness of performance because any verification of an observed puzzle may only reflect investor sentiment. Moreover, as noted in Shleifer and Summers (1990), many trading strategies are based on pseudo-signals, noise, and popular models are correlated, leading to aggregate demand shifts. Consequently, to the degree that the design of the empirical experiment has an impact on the confidence of the reliability of inferences from long-horizon studies, the interpretation of the results on the performance of European IPOs requires caution.
For the evaluation of aftermarket IPO returns, our approach is similar to the empirical methodology in Ritter (1991). Consequently, we show results using BHARs, when reporting long-term abnormal performance of IPOs. This procedure assumes no monthly portfolio rebalancing.24
However, we extend the performance analysis across several dimensions for the European market. Because we are interested in the dynamics of aftermarket performance, we report aftermarket returns over various holding periods. Furthermore, we also determine how the aftermarket performance of European IPOs issued in �hot� and �cold� markets differs. Finally, we are also interested in whether issuing characteristics are related to these performance dynamics and time-varying market conditions. We calculate equally-weighted raw- and benchmark-adjusted returns over 1, 3, 12, 36 and 60 months, whereas one month is defined as a consecutive 21-day-trading interval after the close of the first day of trading. In order to eliminate the effect of national holidays, stock prices for the national countries were first calibrated to a European trading day calendar. Returns were then calculated whenever at least one of the seven markets covered in this study was trading. If the IPO was delisted before the end of the measurement period, we computed the return until the delisting date. Aftermarket returns are compared with four alternative size-based benchmarks, all of which are value-weighted: (1) The Dow Jones STOXX broad-market index, excluding UK, which captures the free-float adjusted market capitalization of around 95 percent of the market capitalization of the countries in our sample, includes 404 European companies and is similar in terms of industry composition to the IPO sample, (2) the Dow Jones STOXX large-cap index, excluding UK companies, (3) the Dow Jones STOXX mid-cap index, excluding UK companies, and (4) the Dow Jones STOXX
24 We have also calculated performance using Cumulative Average Returns (CARs). While not shown separately in this section, we report the results in the Appendix, Table AIII and Figure AI, respectively. The results on monthly portfolio rebalancing confirm that the use of BHRs biases the long-run performance upwards, a finding consistent with the literature (see, for example, Ritter (1991) or Teoh, Welch and Wong (1998)).
18
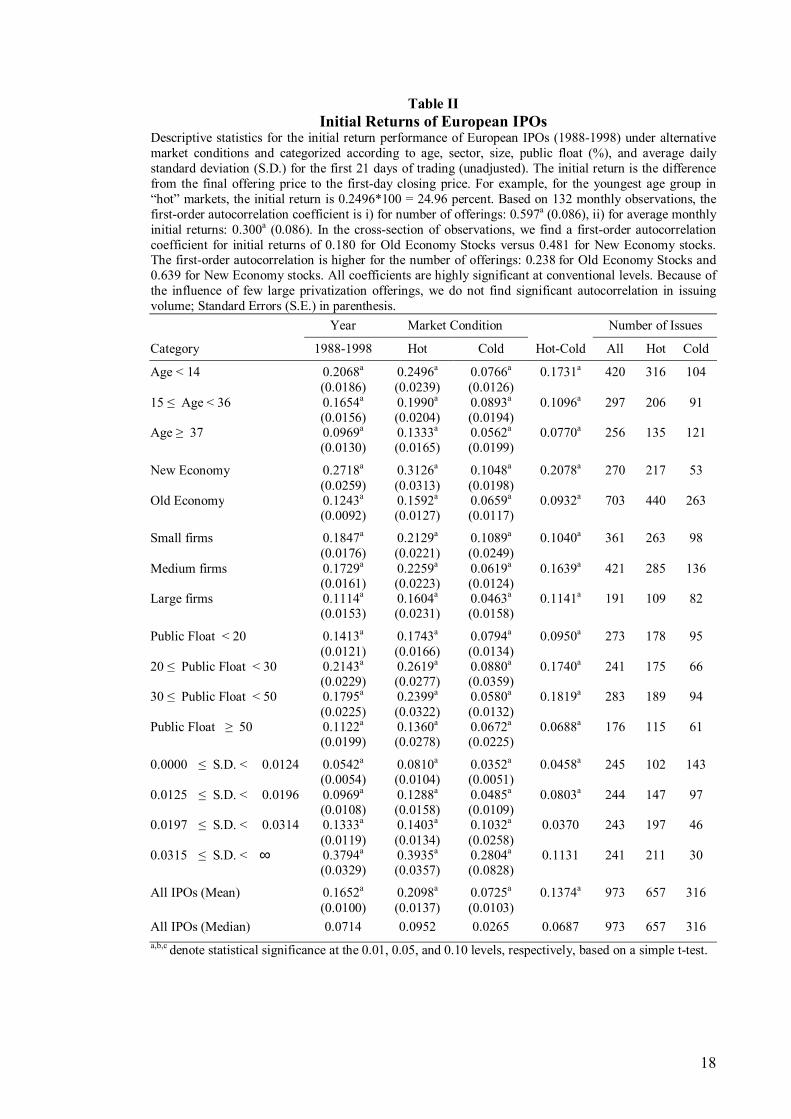
Table II Initial Returns of European IPOs
Descriptive statistics for the initial return performance of European IPOs (1988-1998) under alternative market conditions and categorized according to age, sector, size, public float (%), and average daily standard deviation (S.D.) for the first 21 days of trading (unadjusted). The initial return is the difference from the final offering price to the first-day closing price. For example, for the youngest age group in �hot� markets, the initial return is 0.2496*100 = 24.96 percent. Based on 132 monthly observations, the first-order autocorrelation coefficient is i) for number of offerings: 0.597a (0.086), ii) for average monthly initial returns: 0.300a (0.086). In the cross-section of observations, we find a first-order autocorrelation coefficient for initial returns of 0.180 for Old Economy Stocks versus 0.481 for New Economy stocks. The first-order autocorrelation is higher for the number of offerings: 0.238 for Old Economy Stocks and 0.639 for New Economy stocks. All coefficients are highly significant at conventional levels. Because of the influence of few large privatization offerings, we do not find significant autocorrelation in issuing volume; Standard Errors (S.E.) in parenthesis. Year Market Condition Number of Issues
Category 1988-1998 Hot Cold Hot-Cold All Hot Cold
Age < 14 0.2068a 0.2496a 0.0766a 0.1731a 420 316 104 (0.0186) (0.0239) (0.0126) 15 ≤ Age < 36 0.1654a 0.1990a 0.0893a 0.1096a 297 206 91 (0.0156) (0.0204) (0.0194) Age ≥ 37 0.0969a 0.1333a 0.0562a 0.0770a 256 135 121 (0.0130) (0.0165) (0.0199)
New Economy 0.2718a 0.3126a 0.1048a 0.2078a 270 217 53 (0.0259) (0.0313) (0.0198) Old Economy 0.1243a 0.1592a 0.0659a 0.0932a 703 440 263 (0.0092) (0.0127) (0.0117)
Small firms 0.1847a 0.2129a 0.1089a 0.1040a 361 263 98 (0.0176) (0.0221) (0.0249) Medium firms 0.1729a 0.2259a 0.0619a 0.1639a 421 285 136 (0.0161) (0.0223) (0.0124) Large firms 0.1114a 0.1604a 0.0463a 0.1141a 191 109 82 (0.0153) (0.0231) (0.0158)
Public Float < 20 0.1413a 0.1743a 0.0794a 0.0950a 273 178 95 (0.0121) (0.0166) (0.0134) 20 ≤ Public Float < 30 0.2143a 0.2619a 0.0880a 0.1740a 241 175 66 (0.0229) (0.0277) (0.0359) 30 ≤ Public Float < 50 0.1795a 0.2399a 0.0580a 0.1819a 283 189 94 (0.0225) (0.0322) (0.0132) Public Float ≥ 50 0.1122a 0.1360a 0.0672a 0.0688a 176 115 61 (0.0199) (0.0278) (0.0225)
0.0000 ≤ S.D. < 0.0124 0.0542a 0.0810a 0.0352a 0.0458a 245 102 143 (0.0054) (0.0104) (0.0051) 0.0125 ≤ S.D. < 0.0196 0.0969a 0.1288a 0.0485a 0.0803a 244 147 97 (0.0108) (0.0158) (0.0109) 0.0197 ≤ S.D. < 0.0314 0.1333a 0.1403a 0.1032a 0.0370 243 197 46 (0.0119) (0.0134) (0.0258) 0.0315 ≤ S.D. < ∞ 0.3794a 0.3935a 0.2804a 0.1131 241 211 30 (0.0329) (0.0357) (0.0828)
All IPOs (Mean) 0.1652a 0.2098a 0.0725a 0.1374a 973 657 316 (0.0100) (0.0137) (0.0103)
All IPOs (Median) 0.0714 0.0952 0.0265 0.0687 973 657 316 a,b,c denote statistical significance at the 0.01, 0.05, and 0.10 levels, respectively, based on a simple t-test.
19
small-cap index, excluding UK companies. These indices have a history dating back to the start of the sample period in January 1988.25
For this section, we also report wealth relatives (WR) by taking the ratio of one plus the IPO return divided by one plus the chosen benchmark return. A wealth relative less than one indicates that the IPO underperforms the chosen benchmark. Similarly, a wealth relative greater than one indicates that the IPO outperforms the chosen benchmark.26
III. Performance Analysis of European Initial Public Offerings
A. Initial Returns
In Table II, we present evidence concerning the underpricing phenomenon. The average initial return for the 973 European firms that went public between 1988 and 1998 is 16.52 percent. The median is positive 7.14 percent where only 86 of the 973 offerings (8.84 percent) had negative unadjusted initial returns. 129 IPOs (13.26 percent) did not change from the offering price, supporting the conjecture that positive mean initial returns result from a partially censored left tail, which itself stems from stabilization activities by underwriters (Ruud (1993) or Aggarwal (2000)). The findings are generally consistent with US evidence. For a sample of 6,249 US IPOs between 1980 and 2001, Ritter and Welch (2002) find average underpricing to be 18.8 percent, ranging from 5.4 percent to 22.3 percent during our sample period.
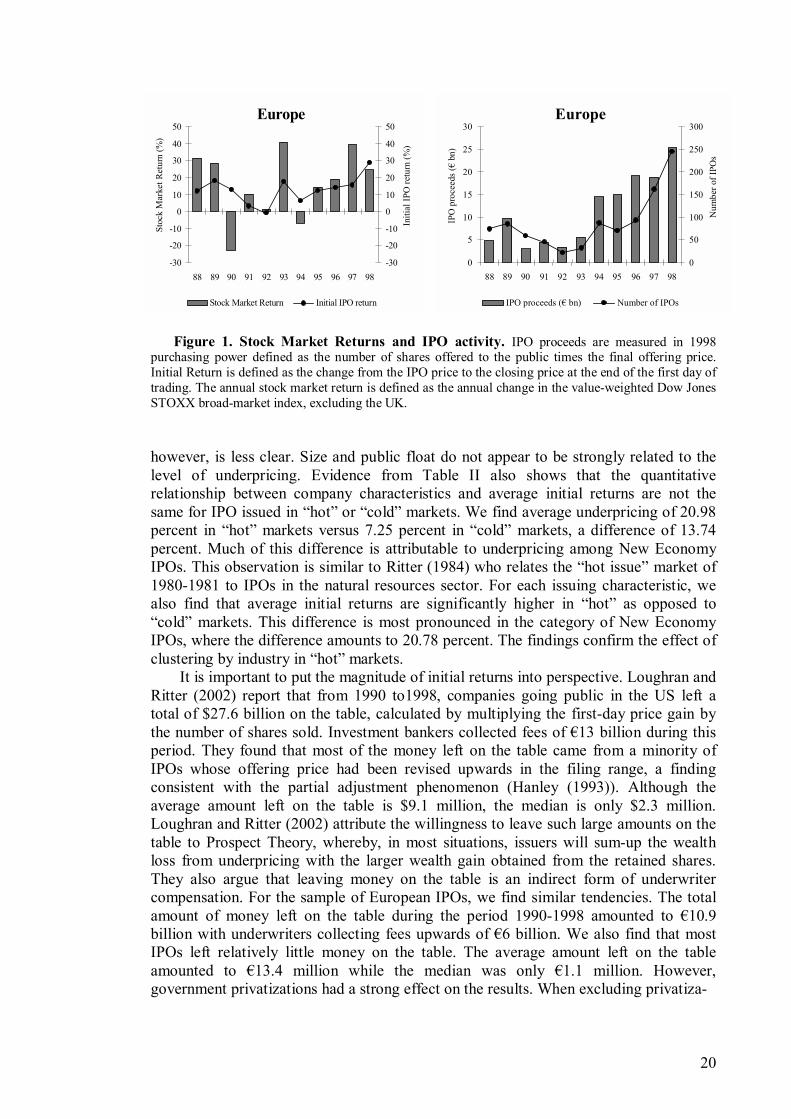
In Figure 1, we graph IPO activity and stock market returns for the sample of European IPOs. The first-order autocorrelation coefficient for the time series of 132 monthly observations of average initial returns between January 1988 and December 1998 is 0.300. The autocorrelation is higher when looking at the monthly number of offerings, with a first-order autocorrelation coefficient of 0.597 during the period between 1988 and 1998. Both coefficients are highly significant at conventional levels. Figure 1 also underlines that initial returns and issuing activity in Europe are sensitive to the general state of the stock market.
Table II shows the substantial variability in average underpricing when categorizing the sample according to the issuing characteristics. The model uses age, market sector and the standard deviation of aftermarket stock prices as measures of uncertainty, producing results that confirm the monotonic relationship between risk and initial returns, as postulated in the winner�s curse explanation of underpricing. For the period 1988-1998, high-risk companies (younger firms) average substantially higher initial returns than low-risk companies (older firms). Initial returns are 10.99 percent higher for the youngest age group as compared to the oldest age group in the sample. Differences increase to 14.75 percent when comparing underpricing of New versus Old Economy IPOs. Using the daily standard deviation of unadjusted aftermarket returns for the first month of trading, an ex-post measure of uncertainty, we confirm our observations. Moreover, not only do the higher-risk categories display higher initial returns, they also show greater variability in initial returns as indicated by the Standard Errors. The relationship between other issuing characteristics and initial returns, 25 The chosen benchmarks also form the basis of derivative products and exchange-traded funds (ETFs). 26 We do not adjust for betas. A broad literature argues that differences in betas are too small to have significant effects on the conclusions (Ibbotson (1975), Clarkson and Thomson (1990) or Chan and Lakonishok (1992) for the US market, and Keloharju (1993) or Leleux (1996) for European Markets).
20
Figure 1. Stock Market Returns and IPO activity. IPO proceeds are measured in 1998
purchasing power defined as the number of shares offered to the public times the final offering price. Initial Return is defined as the change from the IPO price to the closing price at the end of the first day of trading. The annual stock market return is defined as the annual change in the value-weighted Dow Jones STOXX broad-market index, excluding the UK.
however, is less clear. Size and public float do not appear to be strongly related to the level of underpricing. Evidence from Table II also shows that the quantitative relationship between company characteristics and average initial returns are not the same for IPO issued in �hot� or �cold� markets. We find average underpricing of 20.98 percent in �hot� markets versus 7.25 percent in �cold� markets, a difference of 13.74 percent. Much of this difference is attributable to underpricing among New Economy IPOs. This observation is similar to Ritter (1984) who relates the �hot issue� market of 1980-1981 to IPOs in the natural resources sector. For each issuing characteristic, we also find that average initial returns are significantly higher in �hot� as opposed to �cold� markets. This difference is most pronounced in the category of New Economy IPOs, where the difference amounts to 20.78 percent. The findings confirm the effect of clustering by industry in �hot� markets.
It is important to put the magnitude of initial returns into perspective. Loughran and Ritter (2002) report that from 1990 to1998, companies going public in the US left a total of $27.6 billion on the table, calculated by multiplying the first-day price gain by the number of shares sold. Investment bankers collected fees of �13 billion during this period. They found that most of the money left on the table came from a minority of IPOs whose offering price had been revised upwards in the filing range, a finding consistent with the partial adjustment phenomenon (Hanley (1993)). Although the average amount left on the table is $9.1 million, the median is only $2.3 million. Loughran and Ritter (2002) attribute the willingness to leave such large amounts on the table to Prospect Theory, whereby, in most situations, issuers will sum-up the wealth loss from underpricing with the larger wealth gain obtained from the retained shares. They also argue that leaving money on the table is an indirect form of underwriter compensation. For the sample of European IPOs, we find similar tendencies. The total amount of money left on the table during the period 1990-1998 amounted to �10.9 billion with underwriters collecting fees upwards of �6 billion. We also find that most IPOs left relatively little money on the table. The average amount left on the table amounted to �13.4 million while the median was only �1.1 million. However, government privatizations had a strong effect on the results. When excluding privatiza-
0
5
10
15
20
25
30
88 89 90 91 92 93 94 95 96 97 98
IPO
pro
ceed
s (�
bn)
0
50
100
150
200
250
300Europe
Num
ber o
f IPO
s
IPO proceeds (� bn) Number of IPOs
-30 -20 -10
0 10 20 30 40 50
88 89 90 91 92 93 94 95 96 97 98
Stoc
k M
arke
t Ret
urn
(%)
-30
-20
-10
0
10
20
30
40
50Europe
Initi
al IP
O re
turn
(%)
Stock Market Return Initial IPO return
21
Table III Aftermarket Performance of European IPOs
The sample contains 973 European IPOs between 1988 and 1998. Aftermarket returns are measured as equally-weighted buy-and-hold returns, whereas one month is defined as a consecutive 21-day trading interval from the first closing price, using European trading days, assuming a declining sample size. The value-weighted Dow Jones STOXX size indices (Broad-Market, Large-Caps, Mid-Caps and Small-Caps), excluding UK, were used as a proxy for the market benchmark. The wealth relative is the ratio of one plus the average aftermarket period buy-and-hold IPO return, divided by one plus the average aftermarket period benchmark buy-and-hold return. For example, for the month 36 adjustment of IPO returns for the movement in the broad- market benchmark, (1 + 0.6791)/(1+0.5947) = 1.05; Standard Errors (S.E.) in parentheses.
Panel A: Mean Aftermarket Performance of IPOs: All Market Conditions
IPO and Benchmark Returns IPO Broad- Wealth Large- Wealth Mid- Wealth Small- Wealth
Aftermarket Return Market Relative Caps Relative Caps Relative Caps Relative Month 1 0.0312a 0.0178a 1.01b 0.0206a 1.01 0.0104a 1.02a 0.0016 1.03a
(N=973) (0.0068) (0.0016) (0.0066) (0.0017) (0.0066) (0.0015) (0.0066) (0.0016) (0.0066)Month 3 0.0591a 0.0276a 1.03a 0.0339a 1.02b 0.0102a 1.05a -0.0101a 1.07a
(N=972) (0.0111) (0.0035) (0.0104) (0.0035) (0.0105) (0.0036) (0.0105) (0.0039) (0.0105)Month 12 0.2779a 0.1550a 1.11b 0.1791a 1.08c 0.0910a 1.17a 0.0173a 1.26a
(N=970) (0.0582) (0.0057) (0.0575) (0.0057) (0.0575) (0.0058) (0.0575) (0.0061) (0.0578)Month 36 0.6791a 0.5947a 1.05 0.7037a 0.99 0.3462a 1.25c 0.0951a 1.53a
(N=686) (0.1746) (0.0172) (0.1729) (0.0184) (0.1729) (0.0120) (0.1733) (0.0091) (0.1735)Month 60 0.5974a 0.6179a 0.99 1.1974a 0.73a 0.5313a 1.04 0.0933a 1.46a
(N=381) (0.1245) (0.0351) (0.1204) (0.0426) (0.1177) (0.0228) (0.1193) (0.0151) (0.1209)
Panel B: Mean Aftermarket Performance of IPOs: Hot Markets
IPO and Benchmark Returns IPO Broad- Wealth Large- Wealth Mid- Wealth Small- Wealth
Aftermarket Return Market Relative Caps Relative Caps Relative Caps Relative Month 1 0.0442a 0.0232a 1.02b 0.0264a 1.02c 0.0131a 1.03a 0.0039c 1.04a
(N=657) (0.0094) (0.0021) (0.0093) (0.0022) (0.0093) (0.0020) (0.0092) (0.0020) (0.0092)Month 3 0.0829a 0.0371a 1.04a 0.0436a 1.04a 0.0145a 1.07a -0.0066 1.09a
(N=656) (0.0156) (0.0047) (0.0147) (0.0047) (0.0147) (0.0048) (0.0147) (0.0052) (0.0148)Month 12 0.3439a 0.1825a 1.14c 0.2068a 1.11 0.1022a 1.22a 0.0292a 1.31a
(N=655) (0.0845) (0.0075) (0.0837) (0.0076) (0.0837) (0.0075) (0.0836) (0.0078) (0.0839)Month 36 0.8568a 0.6120a 1.15 0.7244a 1.08 0.3146a 1.41c 0.0775a 1.72a
(N=389) (0.3014) (0.0239) (0.2997) (0.0255) (0.2997) (0.0151) (0.3001) (0.0124) (0.3002)Month 60 0.2795b 0.1264a 1.14 0.6066a 0.80a 0.2257a 1.04 -0.0903a 1.41a
(N=119) (0.1231) (0.0310) (0.1228) (0.0343) (0.1229) (0.0194) (0.1212) (0.0100) (0.1222)
Panel C: Mean Aftermarket Performance of IPOs: Cold Markets
IPO and Benchmark Returns IPO Broad- Wealth Large- Wealth Mid- Wealth Small- Wealth
Aftermarket Return Market Relative Caps Relative Caps Relative Caps Relative Month 1 0.0041 0.0066a 1.00 0.0087a 1.00 0.0048b 1.00 -0.0033 1.01
(N=316) (0.0069) (0.0022) (0.0068) (0.0022) (0.0068) (0.0023) (0.0068) (0.0024) (0.0069)Month 3 0.0097 0.0077c 1.00 0.0137a 1.00 0.0014 1.01 -0.0175a 1.03a
(N=316) (0.0103) (0.0043) (0.0098) (0.0042) (0.0098) (0.0045) (0.0098) (0.0051) (0.0100)Month 12 0.1406a 0.0978a 1.04 0.1215a 1.02 0.0679a 1.07b -0.0076 1.15a
(N=315) (0.0352) (0.0074) (0.0333) (0.0067) (0.0334) (0.0085) (0.0333) (0.0097) (0.0338)Month 36 0.4465a 0.5719a 0.92c 0.6766a 0.86a 0.3875a 1.04 0.1182a 1.29a
(N=297) (0.0810) (0.0243) (0.0734) (0.0262) (0.0733) (0.0191) (0.0742) (0.0133) (0.0764)Month 60 0.7418a 0.8412a 0.95 1.4657a 0.71a 0.6701a 1.04 0.1766a 1.48a
(N=262) (0.1716) (0.0425) (0.1658) (0.0522) (0.1614) (0.0281) (0.1646) (0.0194) (0.1669)a,b,c denote statistical significance at the 0.01, 0.05, and 0.10 levels, respectively, based on a simple t-test.
22
tions, which accounted for �5.2 billion of money left on the table, the average amount of money left on the table fell to �7.2 million.27 As Perotti and Guney (1993), Perotti (1995), Shafik (1996), and Jones, Megginson, Nash, and Netter (1999) all point out, governments and their investment bankers have become extremely adept at manipulating the offer price and allocations terms of IPOs in order to achieve multiple, often competing, political and economic objectives. During the 1990s, European governments kick-started a European equity culture by allocating discounted shares from formerly state-owned monopolies to retail investors. B. Aftermarket Returns
In Table III, we report the buy-and-hold performance for European IPOs issued between 1988 and 1998 over different holding periods starting from the close of the first day of trading. In Panel A, we report the benchmark-adjusted equally-weighted aftermarket performance for different holding periods, independent of the market condition at the IPO date. The results indicate that the sample of European IPOs outperformed all the benchmarks up to the first year of aftermarket trading. Over 12 months, for example, the IPOs earned 27.79 percent, on average, while the broad market index earned 15.50 percent, a wealth relative of 1.11. However, the broad-market and large-cap market-adjusted wealth relatives fall substantially when measuring the aftermarket performance over longer periods. Over three years, for example, IPOs returned 67.91 percent on average while the broad market returned 59.47 percent, a ratio of 1.05. Panel A also shows that IPO performance is sensitive to the benchmark employed. Across all measurement horizons, IPOs perform better relative to small-caps than relative to large-caps. In Panels B and C of Table III, we present results calculated according to the market condition at the time of the IPO. We find that the favourable aftermarket IPO performance is mainly driven by outperformance of IPOs issued in �hot� markets. IPOs issued in �cold� markets underperform in the long-run. For example, investing in the average sample of IPOs in �cold� markets would have left the investor with only �0.92 relative to each Euro invested in the broad-market index after three years, while rendering �1.15 if invested during a �hot� market period.
While not reported separately, the long-run performance picture changes dramatically when looking at the median IPO. A strategy of investing in the median IPO at the end of the first day of trading and holding over a three-year period, would have left the investor with only �0.67 relative to each Euro invested in the broad-market index. This underlines the skewness of the return distribution with only 28 percent of the issuers reporting positive broad-market-adjusted returns, and some extreme winners dominating the mean return picture. In the Appendix, Table AII, we have also calculated value-weighted results for the aftermarket performance of European IPOs. Brav and Gompers (1997) find that value-weighting significantly reduces performance differences. For the sample of European IPOs, however, value-weighting does not significantly change the results from equally-weighting. Indeed, the three-year broad-market-adjusted wealth relative is 1.06 compared to 1.05 for the equally-weighted sample of European IPOs. The wealth relatives fall to 0.73 (equally-weighted) and 0.74 (value-weighted) when measured over five years, respectively. 27 While raising �27.5 billion, four privatizations (Deutsche Telecom AG, France Telecom SA, TNT Poest Group NV and Swisscom AG) accounted for �4.0 billion of money left on the table. From 1996 onwards, each of these companies were brought to the market by using the bookbuilding procedure and recorded significant average underpricing (14.02 percent).
23
C. Cross-Sectional Results
C.1. Performance Categorized by Initial Returns
In order to shed more light on the dynamics of European IPO performance, this section distinguishes firms by issuing characteristic and provides time-series evidence of performance. For each issuing characteristic, we divide the sample into sub-samples and use dummy variables to distinguish each subsample. The resulting regression coefficients measure the difference in average market-adjusted returns across subsamples, calculated for each measurement horizon and market condition. In the rest of this chapter, we will focus on reporting the results adjusted for movements in the value-weighted Dow Jones STOXX broad-market index, excluding the UK.
In Table IV, firms are segmented by the initial return of the IPO. The results are categorized according to four initial return categories and across three dimensions: IPOs issued in all market conditions, �hot� markets, and �cold� markets. Panel A reveals that there is a tendency for companies that have the highest initial returns to have the best aftermarket performance across all measurement horizons. Companies that have the lowest initial returns also exhibit the worst aftermarket performance. The result extends to all measurement horizons and is most significant in the short-run. Over 36 months, for example, the difference between the market-adjusted aftermarket performance between highest and lowest initial returns category is 65.52 percent.
In Panels B and C, we are able to disentangle this observation by looking at IPOs issued in �hot� and �cold� markets separately. For IPOs issued in �cold� markets, we find that the positive relationship between initial returns and broad-market-adjusted aftermarket performance is more consistent and more significant, albeit less in magnitude, compared to that for �hot� markets. The underperformance of IPOs is most pervasive in the category of IPOs with zero or negative initial returns. In this category, IPOs issued in �hot� markets underperformed the market by 51.21 percent, while IPOs in �cold� markets underperformed by 14.68 percent over three years.
The findings reveal a number of interesting patterns related to the literature. When considering the short-run dynamics, the result indicates a clearly significant relation between underpricing and performance under the three market conditions studied. Underpricing indeed seems to induce sentiment-driven short-run positive feedback strategies (Rajan and Servaes (1993)). The significantly negative returns of IPOs with least underpricing are also indicative of the effect of the cessation of stabilization activities of underwriters in the immediate aftermarket (Hanley, Kumar and Seguin (1992), Ruud (1993)). Moreover, the results for long-run performance contrast with Ritter�s (1991) findings which reveal a tendency for firms with high initial returns to have the worst aftermarket performance. This, according to the author, mildly supports DeBondt and Thalers (1985) �overreaction hypothesis� as an explanation for the poor long-run performance of US IPOs. The results are also not consistent with Shiller�s (1990) �Impresario� hypothesis, which predicts a negative relation between initial returns and aftermarket performance, in particular for IPOs issued in �hot� markets. As well, our findings do not correspond to the desire of issuers to avoid future lawsuits by underpricing (Tinic (1988)). The results, however, do support the various signaling theories of underpricing (Allen and Faulhaber (1989) or Grinblatt and Hwang (1989)). Here, underpricing separates low-quality firms from high-quality firms, since only high quality firms are expected to recoup the initial loss of underpricing once their true value is revealed.
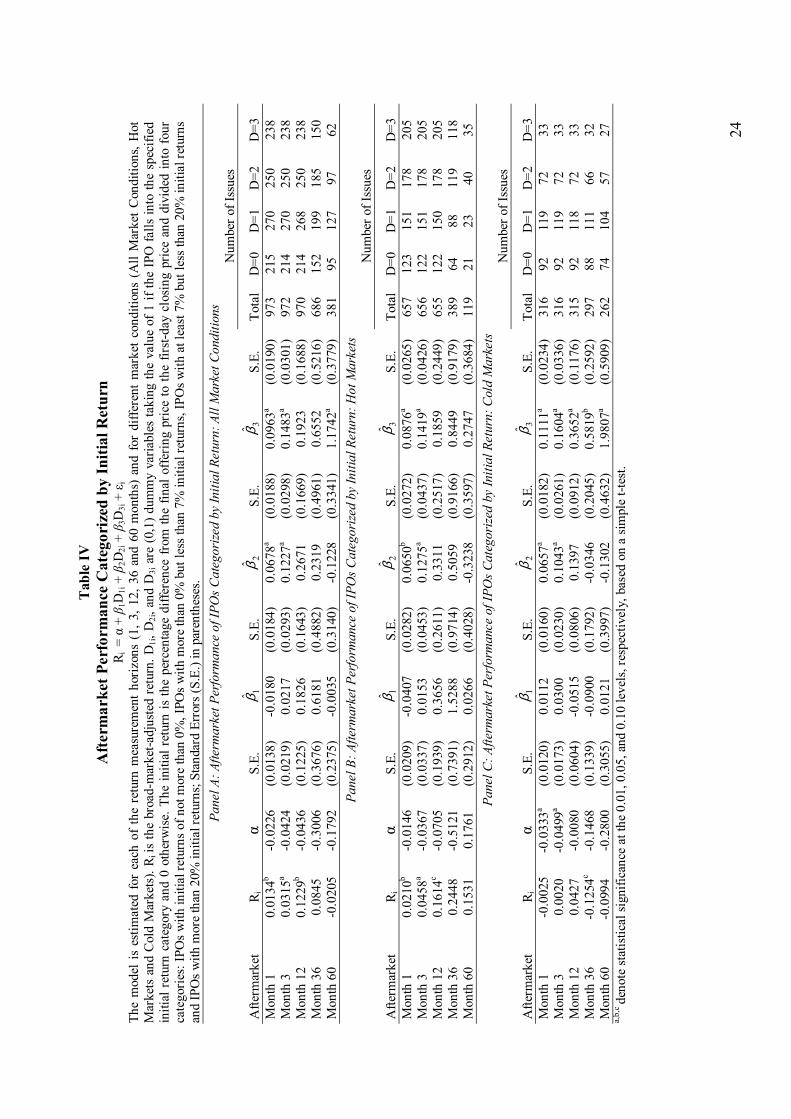
24
Tab
le IV
A
fter
mar
ket P
erfo
rman
ce C
ateg
oriz
ed b
y In
itial
Ret
urn
R i =
α +
β1D
1i +
β2D
2i +
β3D
3i +
εi
The
mod
el is
est
imat
ed f
or e
ach
of th
e re
turn
mea
sure
men
t hor
izon
s (1
, 3, 1
2, 3
6 an
d 60
mon
ths)
and
for
diff
eren
t mar
ket c
ondi
tions
(A
ll M
arke
t Con
ditio
ns, H
ot
Mar
kets
and
Col
d M
arke
ts).
R i is
the
broa
d-m
arke
t-adj
uste
d re
turn
. D1i
, D2i
, and
D3i
are
(0,1
) dum
my
varia
bles
taki
ng th
e va
lue
of 1
if th
e IP
O fa
lls in
to th
e sp
ecifi
ed
initi
al r
etur
n ca
tego
ry a
nd 0
oth
erw
ise.
The
initi
al r
etur
n is
the
perc
enta
ge d
iffer
ence
fro
m th
e fin
al o
fferin
g pr
ice
to th
e fir
st-da
y cl
osin
g pr
ice
and
divi
ded
into
fou
r ca
tego
ries:
IPO
s with
initi
al re
turn
s of n
ot m
ore
than
0%
, IPO
s with
mor
e th
an 0
% b
ut le
ss th
an 7
% in
itial
retu
rns,
IPO
s with
at l
east
7% b
ut le
ss th
an 2
0% in
itial
retu
rns
and
IPO
s with
mor
e th
an 2
0% in
itial
retu
rns;
Stan
dard
Err
ors (
S.E.
) in
pare
nthe
ses.
Pa
nel A
: Afte
rmar
ket P
erfo
rman
ce o
f IPO
s Cat
egor
ized
by In
itial
Ret
urn:
All
Mar
ket C
ondi
tions
N
umbe
r of I
ssue
s
Afte
rmar
ket
R i
α S.
E.
1� β
S.E.
2� β
S.
E.
3� β
S.E.
To
tal
D=0
D
=1
D=2
D
=3
Mon
th 1
0.
0134
b -0
.022
6 (0
.013
8)
-0.0
180
(0.0
184)
0.
0678
a (0
.018
8)
0.09
63a
(0.0
190)
97
3 21
5 27
0 25
0 23
8 M
onth
3
0.03
15a
-0.0
424
(0.0
219)
0.
0217
(0
.029
3)
0.12
27a
(0.0
298)
0.
1483
a (0
.030
1)
972
214
270
250
238
Mon
th 1
2 0.
1229
b -0
.043
6 (0
.122
5)
0.18
26
(0.1
643)
0.
2671
(0
.166
9)
0.19
23
(0.1
688)
97
0 21
4 26
8 25
0 23
8 M
onth
36
0.08
45
-0.3
006
(0.3
676)
0.
6181
(0
.488
2)
0.23
19
(0.4
961)
0.
6552
(0
.521
6)
686
152
199
185
150
Mon
th 6
0 -0
.020
5 -0
.179
2 (0
.237
5)
-0.0
035
(0.3
140)
-0
.122
8 (0
.334
1)
1.17
42a
(0.3
779)
38
1 95
12
7 97
62
Pa
nel B
: Afte
rmar
ket P
erfo
rman
ce o
f IPO
s Cat
egor
ized
by In
itial
Ret
urn:
Hot
Mar
kets
N
umbe
r of I
ssue
s
Afte
rmar
ket
R i
α S.
E.
1� β
S.E.
2� β
S.
E.
3� β
S.E.
To
tal
D=0
D
=1
D=2
D
=3
Mon
th 1
0.
0210
b -0
.014
6 (0
.020
9)
-0.0
407
(0.0
282)
0.
0650
b (0
.027
2)
0.08
76a
(0.0
265)
65
7 12
3 15
1 17
8 20
5 M
onth
3
0.04
58a
-0.0
367
(0.0
337)
0.
0153
(0
.045
3)
0.12
75a
(0.0
437)
0.
1419
a (0
.042
6)
656
122
151
178
205
Mon
th 1
2 0.
1614
c -0
.070
5 (0
.193
9)
0.36
56
(0.2
611)
0.
3311
(0
.251
7)
0.18
59
(0.2
449)
65
5 12
2 15
0 17
8 20
5 M
onth
36
0.24
48
-0.5
121
(0.7
391)
1.
5288
(0
.971
4)
0.50
59
(0.9
166)
0.
8449
(0
.917
9)
389
64
88
119
118
Mon
th 6
0 0.
1531
0.
1761
(0
.291
2)
0.02
66
(0.4
028)
-0
.323
8 (0
.359
7)
0.27
47
(0.3
684)
11
9 21
23
40
35
Pa
nel C
: Afte
rmar
ket P
erfo
rman
ce o
f IPO
s Cat
egor
ized
by
Initi
al R
etur
n: C
old
Mar
kets
N
umbe
r of I
ssue
s
Afte
rmar
ket
R i
α S.
E.
1� β
S.E.
2� β
S.
E.
3� β
S.E.
To
tal
D=0
D
=1
D=2
D
=3
Mon
th 1
-0
.002
5 -0
.033
3a (0
.012
0)
0.01
12
(0.0
160)
0.
0657
a (0
.018
2)
0.11
11a
(0.0
234)
31
6 92
11
9 72
33
M
onth
3
0.00
20
-0.0
499a
(0.0
173)
0.
0300
(0
.023
0)
0.10
43a
(0.0
261)
0.
1604
a (0
.033
6)
316
92
119
72
33
Mon
th 1
2 0.
0427
-0
.008
0 (0
.060
4)
-0.0
515
(0.0
806)
0.
1397
(0
.091
2)
0.36
52a
(0.1
176)
31
5 92
11
8 72
33
M
onth
36
-0.1
254c
-0.1
468
(0.1
339)
-0
.090
0 (0
.179
2)
-0.0
346
(0.2
045)
0.
5819
b (0
.259
2)
297
88
111
66
32
Mon
th 6
0 -
0.09
94
-0.2
800
(0.3
055)
0.
0121
(0
.399
7)
-0.1
302
(0.4
632)
1.
9807
a (0
.590
9)
262
74
104
57
27
a,b,
c de
note
stat
istic
al si
gnifi
canc
e at
the
0.01
, 0.0
5, a
nd 0
.10
leve
ls, r
espe
ctiv
ely,
bas
ed o
n a
simpl
e t-t
est.
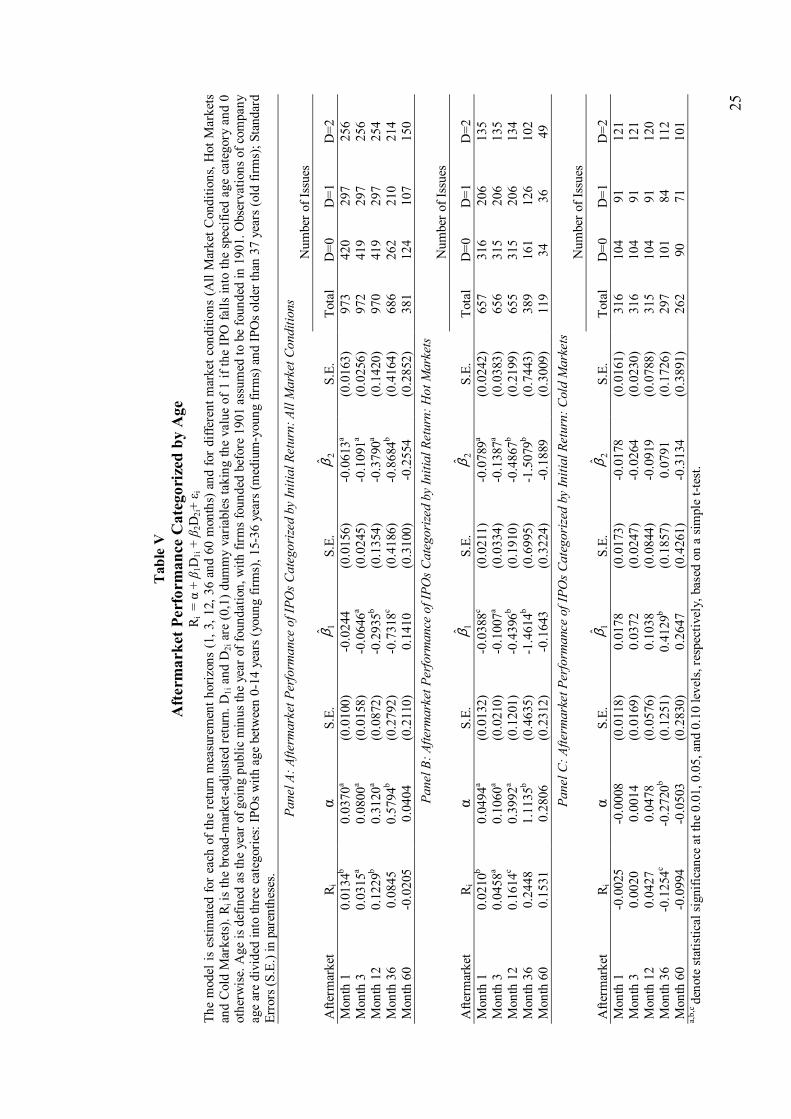
25
Tab
le V
A
fter
mar
ket P
erfo
rman
ce C
ateg
oriz
ed b
y A
ge
R i =
α +
β1D
1i +
β2D
2i+ ε i
The
mod
el is
est
imat
ed fo
r ea
ch o
f the
retu
rn m
easu
rem
ent h
oriz
ons
(1, 3
, 12,
36
and
60 m
onth
s) a
nd fo
r di
ffere
nt m
arke
t con
ditio
ns (A
ll M
arke
t Con
ditio
ns, H
ot M
arke
ts an
d C
old
Mar
kets
). R i
is th
e br
oad-
mar
ket-a
djus
ted
retu
rn. D
1i a
nd D
2i a
re (0
,1) d
umm
y va
riabl
es ta
king
the
valu
e of
1 if
the
IPO
falls
into
the
spec
ified
age
cat
egor
y an
d 0
othe
rwis
e. A
ge is
def
ined
as t
he y
ear o
f goi
ng p
ublic
min
us th
e ye
ar o
f fou
ndat
ion,
with
firm
s fou
nded
bef
ore
1901
ass
umed
to b
e fo
unde
d in
190
1. O
bser
vatio
ns o
f com
pany
ag
e ar
e di
vide
d in
to th
ree
cate
gorie
s: IP
Os w
ith a
ge b
etw
een
0-14
yea
rs (y
oung
firm
s), 1
5-36
yea
rs (m
ediu
m-y
oung
firm
s) a
nd IP
Os o
lder
than
37
year
s (ol
d fir
ms)
; Sta
ndar
d Er
rors
(S.E
.) in
par
enth
eses
. Pa
nel A
: Afte
rmar
ket P
erfo
rman
ce o
f IPO
s Cat
egor
ized
by In
itial
Ret
urn:
All
Mar
ket C
ondi
tions
N
umbe
r of I
ssue
s
Afte
rmar
ket
R i
α S.
E.
1� β
S.E.
2� β
S.
E.
Tota
l D
=0
D=1
D
=2
Mon
th 1
0.
0134
b 0.
0370
a (0
.010
0)
-0.0
244
(0.0
156)
-0
.061
3a (0
.016
3)
973
420
297
256
Mon
th 3
0.
0315
a 0.
0800
a (0
.015
8)
-0.0
646a
(0.0
245)
-0
.109
1a (0
.025
6)
972
419
297
256
Mon
th 1
2 0.
1229
b 0.
3120
a (0
.087
2)
-0.2
935b
(0.1
354)
-0
.379
0a (0
.142
0)
970
419
297
254
Mon
th 3
6 0.
0845
0.
5794
b (0
.279
2)
-0.7
318c
(0.4
186)
-0
.868
4b (0
.416
4)
686
262
210
214
Mon
th 6
0 -0
.020
5 0.
0404
(0
.211
0)
0.14
10
(0.3
100)
-0
.255
4 (0
.285
2)
381
124
107
150
Pane
l B: A
fterm
arke
t Per
form
ance
of I
POs C
ateg
orize
d by
Initi
al R
etur
n: H
ot M
arke
ts
Num
ber o
f Iss
ues
Afte
rmar
ket
R i
α S.
E.
1� β
S.E.
2� β
S.
E.
Tota
l D
=0
D=1
D
=2
Mon
th 1
0.
0210
b 0.
0494
a (0
.013
2)
-0.0
388c
(0.0
211)
-0
.078
9a (0
.024
2)
657
316
206
135
Mon
th 3
0.
0458
a 0.
1060
a (0
.021
0)
-0.1
007a
(0.0
334)
-0
.138
7a (0
.038
3)
656
315
206
135
Mon
th 1
2 0.
1614
c 0.
3992
a (0
.120
1)
-0.4
396b
(0.1
910)
-0
.486
7b (0
.219
9)
655
315
206
134
Mon
th 3
6 0.
2448
1.
1135
b (0
.463
5)
-1.4
614b
(0.6
995)
-1
.507
9b (0
.744
3)
389
161
126
102
Mon
th 6
0 0.
1531
0.
2806
(0
.231
2)
-0.1
643
(0.3
224)
-0
.188
9 (0
.300
9)
119
34
36
49
Pane
l C: A
fterm
arke
t Per
form
ance
of I
POs C
ateg
oriz
ed b
y In
itial
Ret
urn:
Col
d M
arke
ts
Num
ber o
f Iss
ues
Afte
rmar
ket
R i
α S.
E.
1� β
S.E.
2� β
S.
E.
Tota
l D
=0
D=1
D
=2
Mon
th 1
-0
.002
5 -0
.000
8 (0
.011
8)
0.01
78
(0.0
173)
-0
.017
8 (0
.016
1)
316
104
91
121
Mon
th 3
0.
0020
0.
0014
(0
.016
9)
0.03
72
(0.0
247)
-0
.026
4 (0
.023
0)
316
104
91
121
Mon
th 1
2 0.
0427
0.
0478
(0
.057
6)
0.10
38
(0.0
844)
-0
.091
9 (0
.078
8)
315
104
91
120
Mon
th 3
6 -0
.125
4c -0
.272
0b (0
.125
1)
0.41
29b
(0.1
857)
0.
0791
(0
.172
6)
297
101
84
112
Mon
th 6
0 -0
.099
4 -0
.050
3 (0
.283
0)
0.26
47
(0.4
261)
-0
.313
4 (0
.389
1)
262
90
71
101
a,b,
c de
note
stat
istic
al si
gnifi
canc
e at
the
0.01
, 0.0
5, a
nd 0
.10
leve
ls, r
espe
ctiv
ely,
bas
ed o
n a
simpl
e t-t
est.
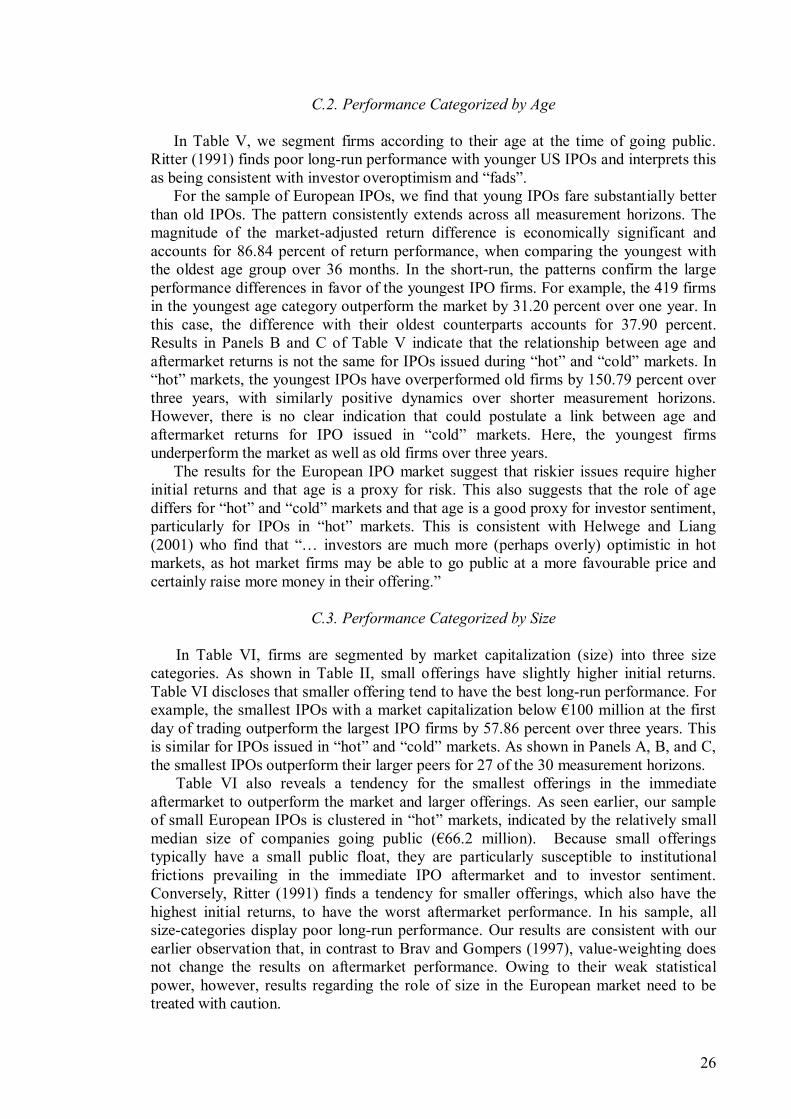
26
C.2. Performance Categorized by Age
In Table V, we segment firms according to their age at the time of going public. Ritter (1991) finds poor long-run performance with younger US IPOs and interprets this as being consistent with investor overoptimism and �fads�.
For the sample of European IPOs, we find that young IPOs fare substantially better than old IPOs. The pattern consistently extends across all measurement horizons. The magnitude of the market-adjusted return difference is economically significant and accounts for 86.84 percent of return performance, when comparing the youngest with the oldest age group over 36 months. In the short-run, the patterns confirm the large performance differences in favor of the youngest IPO firms. For example, the 419 firms in the youngest age category outperform the market by 31.20 percent over one year. In this case, the difference with their oldest counterparts accounts for 37.90 percent. Results in Panels B and C of Table V indicate that the relationship between age and aftermarket returns is not the same for IPOs issued during �hot� and �cold� markets. In �hot� markets, the youngest IPOs have overperformed old firms by 150.79 percent over three years, with similarly positive dynamics over shorter measurement horizons. However, there is no clear indication that could postulate a link between age and aftermarket returns for IPO issued in �cold� markets. Here, the youngest firms underperform the market as well as old firms over three years.
The results for the European IPO market suggest that riskier issues require higher initial returns and that age is a proxy for risk. This also suggests that the role of age differs for �hot� and �cold� markets and that age is a good proxy for investor sentiment, particularly for IPOs in �hot� markets. This is consistent with Helwege and Liang (2001) who find that �� investors are much more (perhaps overly) optimistic in hot markets, as hot market firms may be able to go public at a more favourable price and certainly raise more money in their offering.�
C.3. Performance Categorized by Size
In Table VI, firms are segmented by market capitalization (size) into three size
categories. As shown in Table II, small offerings have slightly higher initial returns. Table VI discloses that smaller offering tend to have the best long-run performance. For example, the smallest IPOs with a market capitalization below �100 million at the first day of trading outperform the largest IPO firms by 57.86 percent over three years. This is similar for IPOs issued in �hot� and �cold� markets. As shown in Panels A, B, and C, the smallest IPOs outperform their larger peers for 27 of the 30 measurement horizons.
Table VI also reveals a tendency for the smallest offerings in the immediate aftermarket to outperform the market and larger offerings. As seen earlier, our sample of small European IPOs is clustered in �hot� markets, indicated by the relatively small median size of companies going public (�66.2 million). Because small offerings typically have a small public float, they are particularly susceptible to institutional frictions prevailing in the immediate IPO aftermarket and to investor sentiment. Conversely, Ritter (1991) finds a tendency for smaller offerings, which also have the highest initial returns, to have the worst aftermarket performance. In his sample, all size-categories display poor long-run performance. Our results are consistent with our earlier observation that, in contrast to Brav and Gompers (1997), value-weighting does not change the results on aftermarket performance. Owing to their weak statistical power, however, results regarding the role of size in the European market need to be treated with caution.
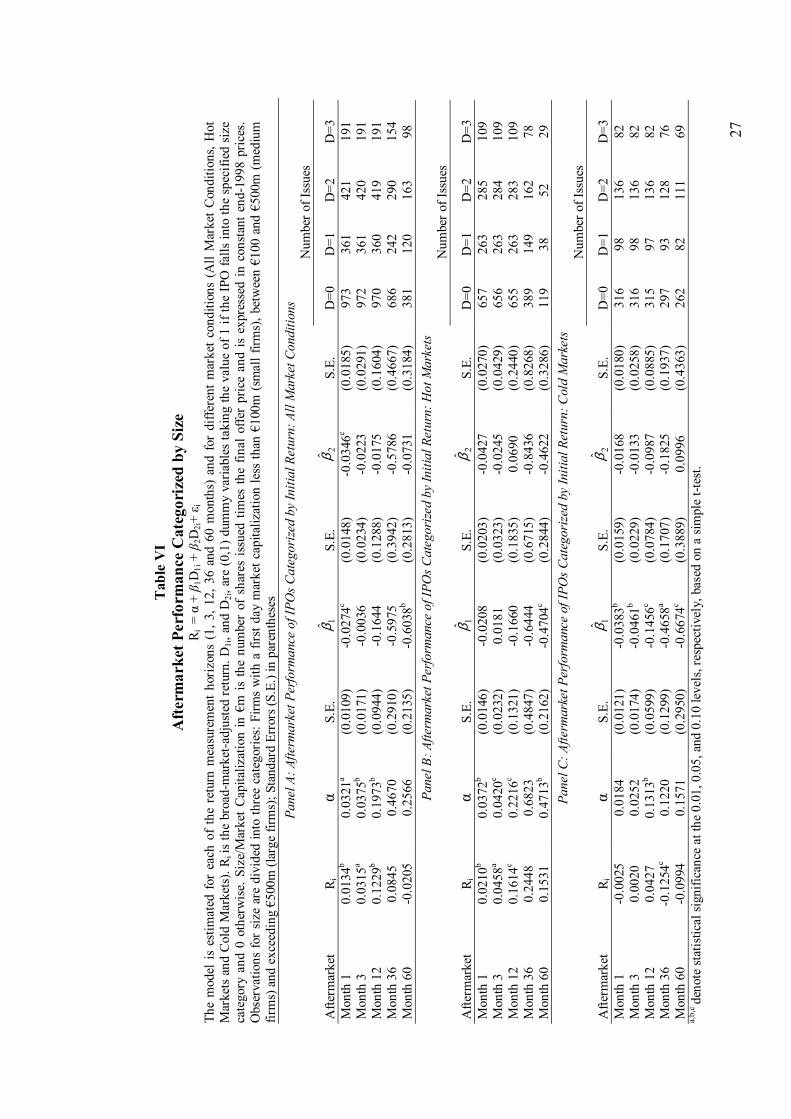
27
Tab
le V
I A
fter
mar
ket P
erfo
rman
ce C
ateg
oriz
ed b
y Si
ze
R i =
α +
β1D
1i +
β2D
2i+ ε i
The
mod
el is
est
imat
ed f
or e
ach
of th
e re
turn
mea
sure
men
t hor
izon
s (1
, 3, 1
2, 3
6 an
d 60
mon
ths)
and
for
diff
eren
t mar
ket c
ondi
tions
(A
ll M
arke
t Con
ditio
ns, H
ot
Mar
kets
and
Col
d M
arke
ts).
R i is
the
broa
d-m
arke
t-adj
uste
d re
turn
. D1i
, and
D2i
, are
(0,1
) dum
my
varia
bles
taki
ng th
e va
lue
of 1
if th
e IP
O fa
lls in
to th
e sp
ecifi
ed s
ize
cate
gory
and
0 o
ther
wis
e. S
ize/
Mar
ket C
apita
lizat
ion
in �
m is
the
num
ber
of s
hare
s is
sued
tim
es th
e fin
al o
ffer
pric
e an
d is
exp
ress
ed in
con
stan
t end
-199
8 pr
ices
. O
bser
vatio
ns fo
r si
ze a
re d
ivid
ed in
to th
ree
cate
gorie
s: F
irms
with
a fi
rst d
ay m
arke
t cap
italiz
atio
n le
ss th
an �
100m
(sm
all f
irms)
, bet
wee
n �1
00 a
nd �
500m
(med
ium
fir
ms)
and
exc
eedi
ng �
500m
(lar
ge fi
rms)
; Sta
ndar
d Er
rors
(S.E
.) in
par
enth
eses
Pa
nel A
: Afte
rmar
ket P
erfo
rman
ce o
f IPO
s Cat
egor
ized
by In
itial
Ret
urn:
All
Mar
ket C
ondi
tions
N
umbe
r of I
ssue
s
Afte
rmar
ket
R i
α S.
E.
1� β
S.E.
2� β
S.
E.
D=0
D
=1
D=2
D
=3
Mon
th 1
0.
0134
b 0.
0321
a (0
.010
9)
-0.0
274c
(0.0
148)
-0
.034
6c (0
.018
5)
973
361
421
191
Mon
th 3
0.
0315
a 0.
0375
b (0
.017
1)
-0.0
036
(0.0
234)
-0
.022
3 (0
.029
1)
972
361
420
191
Mon
th 1
2 0.
1229
b 0.
1973
b (0
.094
4)
-0.1
644
(0.1
288)
-0
.017
5 (0
.160
4)
970
360
419
191
Mon
th 3
6 0.
0845
0.
4670
(0
.291
0)
-0.5
975
(0.3
942)
-0
.578
6 (0
.466
7)
686
242
290
154
Mon
th 6
0 -0
.020
5 0.
2566
(0
.213
5)
-0.6
038b
(0.2
813)
-0
.073
1 (0
.318
4)
381
120
163
98
Pane
l B: A
fterm
arke
t Per
form
ance
of I
POs C
ateg
orize
d by
Initi
al R
etur
n: H
ot M
arke
ts
Num
ber o
f Iss
ues
Afte
rmar
ket
R i
α S.
E.
1� β
S.E.
2� β
S.
E.
D=0
D
=1
D=2
D
=3
Mon
th 1
0.
0210
b 0.
0372
b (0
.014
6)
-0.0
208
(0.0
203)
-0
.042
7 (0
.027
0)
657
263
285
109
Mon
th 3
0.
0458
a 0.
0420
c (0
.023
2)
0.01
81
(0.0
323)
-0
.024
5 (0
.042
9)
656
263
284
109
Mon
th 1
2 0.
1614
c 0.
2216
c (0
.132
1)
-0.1
660
(0.1
835)
0.
0690
(0
.244
0)
655
263
283
109
Mon
th 3
6 0.
2448
0.
6823
(0
.484
7)
-0.6
444
(0.6
715)
-0
.843
6 (0
.826
8)
389
149
162
78
Mon
th 6
0 0.
1531
0.
4713
b (0
.216
2)
-0.4
704c
(0.2
844)
-0
.462
2 (0
.328
6)
119
38
52
29
Pane
l C: A
fterm
arke
t Per
form
ance
of I
POs C
ateg
oriz
ed b
y In
itial
Ret
urn:
Col
d M
arke
ts
Num
ber o
f Iss
ues
Afte
rmar
ket
R i
α S.
E.
1� β
S.E.
2� β
S.
E.
D=0
D
=1
D=2
D
=3
Mon
th 1
-0
.002
5 0.
0184
(0
.012
1)
-0.0
383b
(0.0
159)
-0
.016
8 (0
.018
0)
316
98
136
82
Mon
th 3
0.
0020
0.
0252
(0
.017
4)
-0.0
461b
(0.0
229)
-0
.013
3 (0
.025
8)
316
98
136
82
Mon
th 1
2 0.
0427
0.
1313
b (0
.059
9)
-0.1
456c
(0.0
784)
-0
.098
7 (0
.088
5)
315
97
136
82
Mon
th 3
6 -0
.125
4c 0.
1220
(0
.129
9)
-0.4
658a
(0.1
707)
-0
.182
5 (0
.193
7)
297
93
128
76
Mon
th 6
0 -0
.099
4 0.
1571
(0
.295
0)
-0.6
674c
(0.3
889)
0.
0996
(0
.436
3)
262
82
111
69
a,b,
c de
note
stat
istic
al si
gnifi
canc
e at
the
0.01
, 0.0
5, a
nd 0
.10
leve
ls, r
espe
ctiv
ely,
bas
ed o
n a
simpl
e t-t
est.
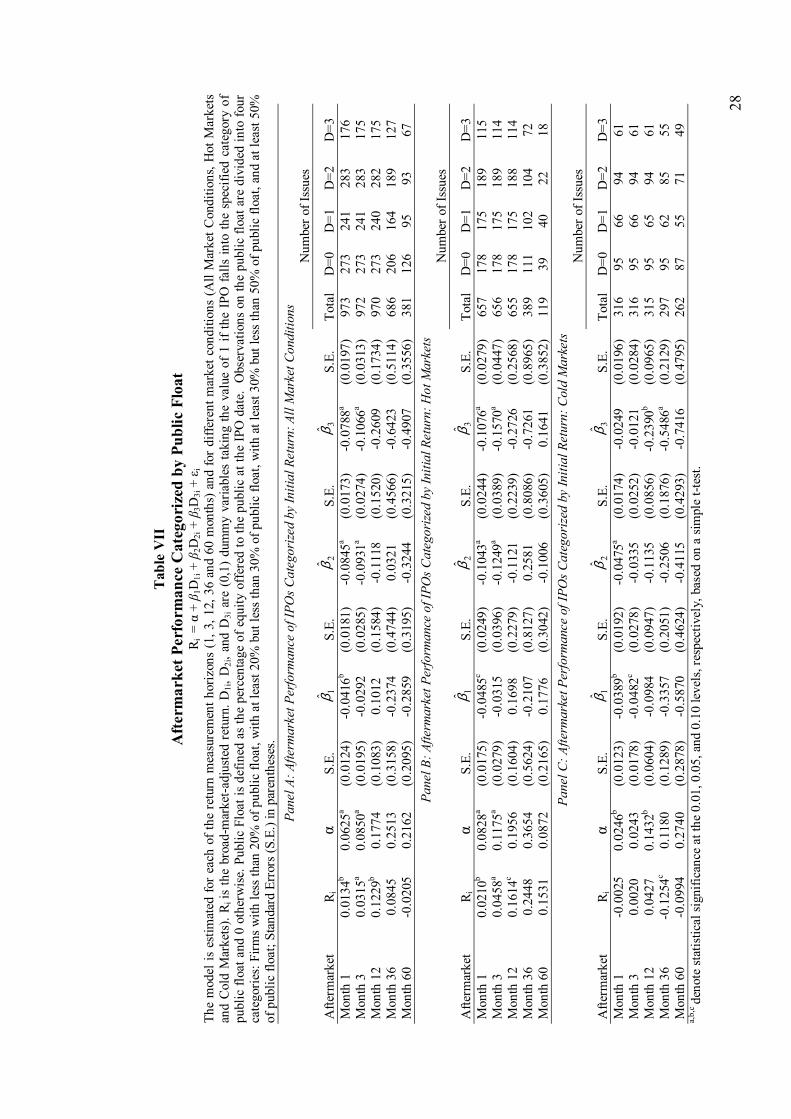
28
Tab
le V
II
Aft
erm
arke
t Per
form
ance
Cat
egor
ized
by
Publ
ic F
loat
R i
= α
+ β
1D1i +
β2D
2i +
β3D
3i +
εi
The
mod
el is
est
imat
ed fo
r ea
ch o
f the
retu
rn m
easu
rem
ent h
oriz
ons
(1, 3
, 12,
36
and
60 m
onth
s) a
nd fo
r di
ffere
nt m
arke
t con
ditio
ns (A
ll M
arke
t Con
ditio
ns, H
ot M
arke
ts an
d C
old
Mar
kets
). R i
is th
e br
oad-
mar
ket-a
djus
ted
retu
rn. D
1i, D
2i, a
nd D
3i a
re (
0,1)
dum
my
varia
bles
taki
ng th
e va
lue
of 1
if th
e IP
O fa
lls in
to th
e sp
ecifi
ed c
ateg
ory
of
publ
ic fl
oat a
nd 0
oth
erw
ise.
Pub
lic F
loat
is d
efin
ed a
s th
e pe
rcen
tage
of e
quity
off
ered
to th
e pu
blic
at t
he IP
O d
ate.
Obs
erva
tions
on
the
publ
ic fl
oat a
re d
ivid
ed in
to fo
ur
cate
gorie
s: F
irms w
ith le
ss th
an 2
0% o
f pub
lic fl
oat,
with
at l
east
20%
but
less
than
30%
of p
ublic
floa
t, w
ith a
t lea
st 3
0% b
ut le
ss th
an 5
0% o
f pub
lic fl
oat,
and
at le
ast 5
0%
of p
ublic
floa
t; St
anda
rd E
rror
s (S.
E.) i
n pa
rent
hese
s.
Pane
l A: A
fterm
arke
t Per
form
ance
of I
POs C
ateg
orize
d by
Initi
al R
etur
n: A
ll M
arke
t Con
ditio
ns
Num
ber o
f Iss
ues
Afte
rmar
ket
R i
α S.
E.
1� β
S.E.
2� β
S.
E.
3� β
S.E.
To
tal
D=0
D
=1
D=2
D
=3
Mon
th 1
0.
0134
b 0.
0625
a (0
.012
4)
-0.0
416b
(0.0
181)
-0
.084
5a (0
.017
3)
-0.0
788a
(0.0
197)
97
3 27
3 24
1 28
3 17
6 M
onth
3
0.03
15a
0.08
50a
(0.0
195)
-0
.029
2 (0
.028
5)
-0.0
931a
(0.0
274)
-0
.106
6a (0
.031
3)
972
273
241
283
175
Mon
th 1
2 0.
1229
b 0.
1774
(0
.108
3)
0.10
12
(0.1
584)
-0
.111
8 (0
.152
0)
-0.2
609
(0.1
734)
97
0 27
3 24
0 28
2 17
5 M
onth
36
0.08
45
0.25
13
(0.3
158)
-0
.237
4 (0
.474
4)
0.03
21
(0.4
566)
-0
.642
3 (0
.511
4)
686
206
164
189
127
Mon
th 6
0 -0
.020
5 0.
2162
(0
.209
5)
-0.2
859
(0.3
195)
-0
.324
4 (0
.321
5)
-0.4
907
(0.3
556)
38
1 12
6 95
93
67
Pa
nel B
: Afte
rmar
ket P
erfo
rman
ce o
f IPO
s Cat
egor
ized
by In
itial
Ret
urn:
Hot
Mar
kets
N
umbe
r of I
ssue
s
Afte
rmar
ket
R i
α S.
E.
1� β
S.E.
2� β
S.
E.
3� β
S.E.
To
tal
D=0
D
=1
D=2
D
=3
Mon
th 1
0.
0210
b 0.
0828
a (0
.017
5)
-0.0
485c
(0.0
249)
-0
.104
3a (0
.024
4)
-0.1
076a
(0.0
279)
65
7 17
8 17
5 18
9 11
5 M
onth
3
0.04
58a
0.11
75a
(0.0
279)
-0
.031
5 (0
.039
6)
-0.1
249a
(0.0
389)
-0
.157
0a (0
.044
7)
656
178
175
189
114
Mon
th 1
2 0.
1614
c 0.
1956
(0
.160
4)
0.16
98
(0.2
279)
-0
.112
1 (0
.223
9)
-0.2
726
(0.2
568)
65
5 17
8 17
5 18
8 11
4 M
onth
36
0.24
48
0.36
54
(0.5
624)
-0
.210
7 (0
.812
7)
0.25
81
(0.8
086)
-0
.726
1 (0
.896
5)
389
111
102
104
72
Mon
th 6
0 0.
1531
0.
0872
(0
.216
5)
0.17
76
(0.3
042)
-0
.100
6 (0
.360
5)
0.16
41
(0.3
852)
11
9 39
40
22
18
Pa
nel C
: Afte
rmar
ket P
erfo
rman
ce o
f IPO
s Cat
egor
ized
by
Initi
al R
etur
n: C
old
Mar
kets
N
umbe
r of I
ssue
s
Afte
rmar
ket
R i
α S.
E.
1� β
S.E.
2� β
S.
E.
3� β
S.E.
To
tal
D=0
D
=1
D=2
D
=3
Mon
th 1
-0
.002
5 0.
0246
b (0
.012
3)
-0.0
389b
(0.0
192)
-0
.047
5a (0
.017
4)
-0.0
249
(0.0
196)
31
6 95
66
94
61
M
onth
3
0.00
20
0.02
43
(0.0
178)
-0
.048
2c (0
.027
8)
-0.0
335
(0.0
252)
-0
.012
1 (0
.028
4)
316
95
66
94
61
Mon
th 1
2 0.
0427
0.
1432
b (0
.060
4)
-0.0
984
(0.0
947)
-0
.113
5 (0
.085
6)
-0.2
390b
(0.0
965)
31
5 95
65
94
61
M
onth
36
-0.1
254c
0.11
80
(0.1
289)
-0
.335
7 (0
.205
1)
-0.2
506
(0.1
876)
-0
.548
6a (0
.212
9)
297
95
62
85
55
Mon
th 6
0 -0
.099
4 0.
2740
(0
.287
8)
-0.5
870
(0.4
624)
-0
.411
5 (0
.429
3)
-0.7
416
(0.4
795)
26
2 87
55
71
49
a,
b,c de
note
stat
istic
al si
gnifi
canc
e at
the
0.01
, 0.0
5, a
nd 0
.10
leve
ls, r
espe
ctiv
ely,
bas
ed o
n a
simpl
e t-t
est.
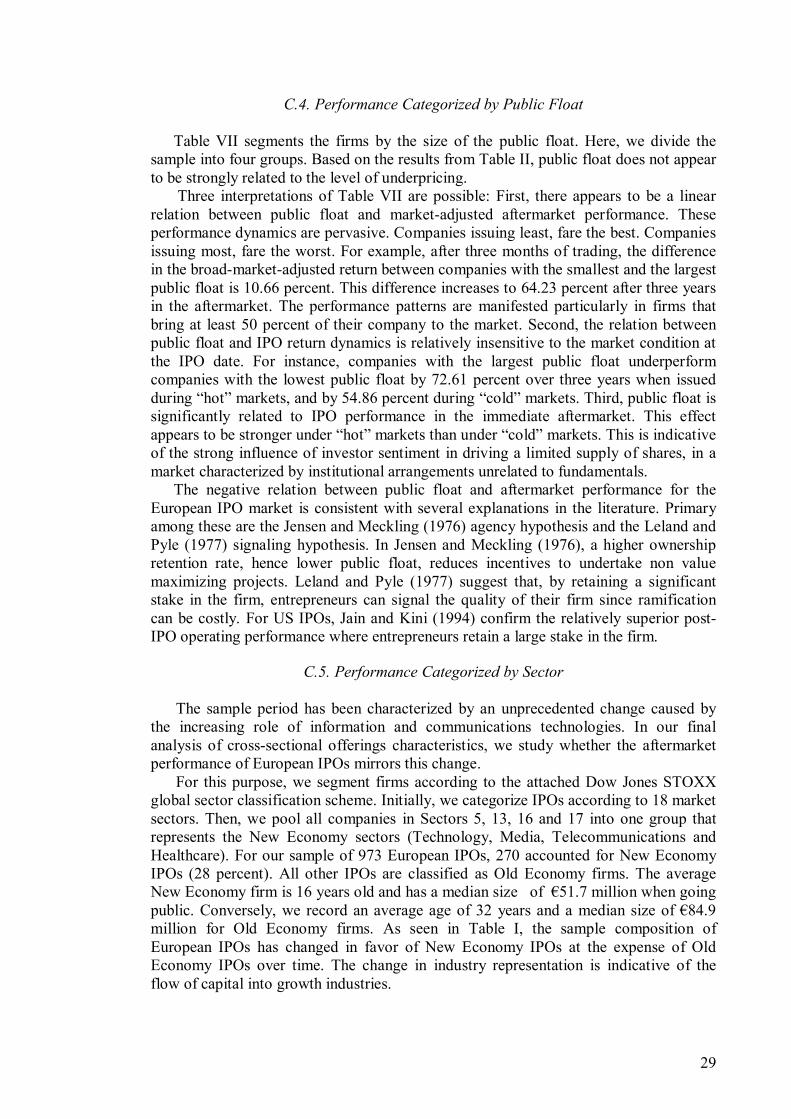
29
C.4. Performance Categorized by Public Float
Table VII segments the firms by the size of the public float. Here, we divide the sample into four groups. Based on the results from Table II, public float does not appear to be strongly related to the level of underpricing.
Three interpretations of Table VII are possible: First, there appears to be a linear relation between public float and market-adjusted aftermarket performance. These performance dynamics are pervasive. Companies issuing least, fare the best. Companies issuing most, fare the worst. For example, after three months of trading, the difference in the broad-market-adjusted return between companies with the smallest and the largest public float is 10.66 percent. This difference increases to 64.23 percent after three years in the aftermarket. The performance patterns are manifested particularly in firms that bring at least 50 percent of their company to the market. Second, the relation between public float and IPO return dynamics is relatively insensitive to the market condition at the IPO date. For instance, companies with the largest public float underperform companies with the lowest public float by 72.61 percent over three years when issued during �hot� markets, and by 54.86 percent during �cold� markets. Third, public float is significantly related to IPO performance in the immediate aftermarket. This effect appears to be stronger under �hot� markets than under �cold� markets. This is indicative of the strong influence of investor sentiment in driving a limited supply of shares, in a market characterized by institutional arrangements unrelated to fundamentals.
The negative relation between public float and aftermarket performance for the European IPO market is consistent with several explanations in the literature. Primary among these are the Jensen and Meckling (1976) agency hypothesis and the Leland and Pyle (1977) signaling hypothesis. In Jensen and Meckling (1976), a higher ownership retention rate, hence lower public float, reduces incentives to undertake non value maximizing projects. Leland and Pyle (1977) suggest that, by retaining a significant stake in the firm, entrepreneurs can signal the quality of their firm since ramification can be costly. For US IPOs, Jain and Kini (1994) confirm the relatively superior post-IPO operating performance where entrepreneurs retain a large stake in the firm.
C.5. Performance Categorized by Sector
The sample period has been characterized by an unprecedented change caused by
the increasing role of information and communications technologies. In our final analysis of cross-sectional offerings characteristics, we study whether the aftermarket performance of European IPOs mirrors this change.
For this purpose, we segment firms according to the attached Dow Jones STOXX global sector classification scheme. Initially, we categorize IPOs according to 18 market sectors. Then, we pool all companies in Sectors 5, 13, 16 and 17 into one group that represents the New Economy sectors (Technology, Media, Telecommunications and Healthcare). For our sample of 973 European IPOs, 270 accounted for New Economy IPOs (28 percent). All other IPOs are classified as Old Economy firms. The average New Economy firm is 16 years old and has a median size of �51.7 million when going public. Conversely, we record an average age of 32 years and a median size of �84.9 million for Old Economy firms. As seen in Table I, the sample composition of European IPOs has changed in favor of New Economy IPOs at the expense of Old Economy IPOs over time. The change in industry representation is indicative of the flow of capital into growth industries.
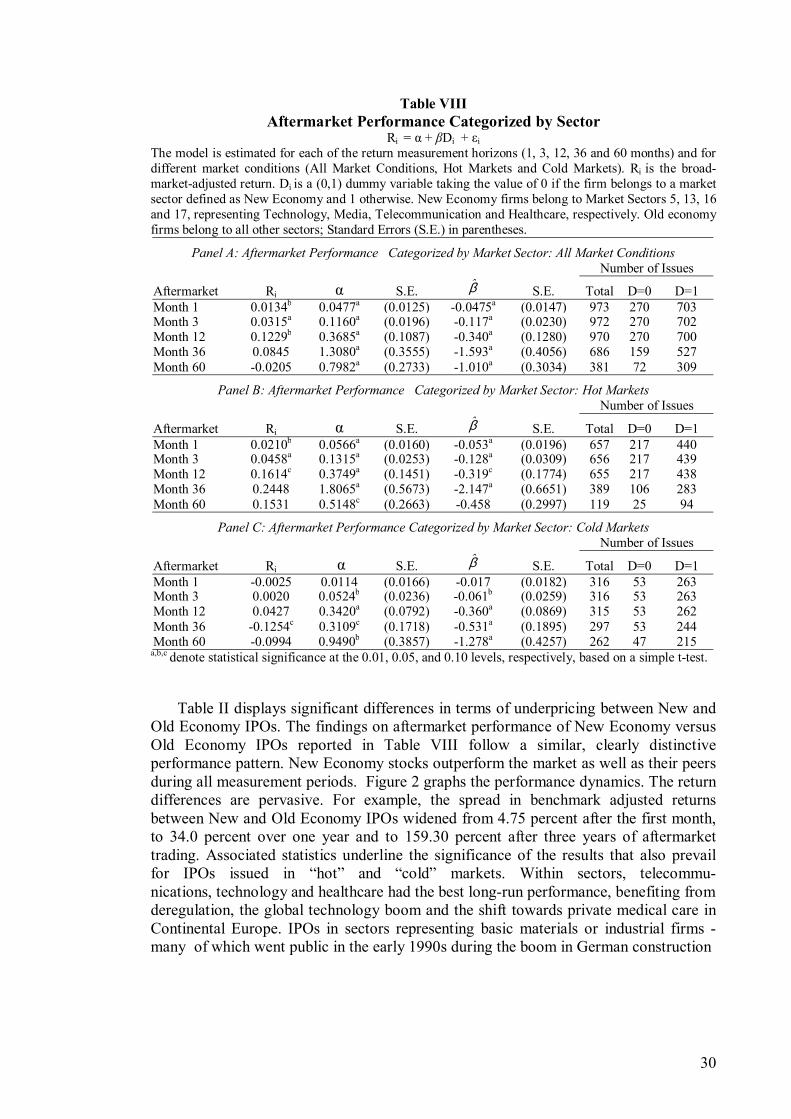
30
Table VIII Aftermarket Performance Categorized by Sector
Ri = α + βDi + εi The model is estimated for each of the return measurement horizons (1, 3, 12, 36 and 60 months) and for different market conditions (All Market Conditions, Hot Markets and Cold Markets). Ri is the broad-market-adjusted return. Di is a (0,1) dummy variable taking the value of 0 if the firm belongs to a market sector defined as New Economy and 1 otherwise. New Economy firms belong to Market Sectors 5, 13, 16 and 17, representing Technology, Media, Telecommunication and Healthcare, respectively. Old economy firms belong to all other sectors; Standard Errors (S.E.) in parentheses.
Panel A: Aftermarket Performance Categorized by Market Sector: All Market Conditions Number of Issues
Aftermarket Ri α S.E. β� S.E. Total D=0 D=1 Month 1 0.0134b 0.0477a (0.0125) -0.0475a (0.0147) 973 270 703Month 3 0.0315a 0.1160a (0.0196) -0.117a (0.0230) 972 270 702Month 12 0.1229b 0.3685a (0.1087) -0.340a (0.1280) 970 270 700Month 36 0.0845 1.3080a (0.3555) -1.593a (0.4056) 686 159 527Month 60 -0.0205 0.7982a (0.2733) -1.010a (0.3034) 381 72 309
Panel B: Aftermarket Performance Categorized by Market Sector: Hot Markets Number of Issues
Aftermarket Ri α S.E. β� S.E. Total D=0 D=1 Month 1 0.0210b 0.0566a (0.0160) -0.053a (0.0196) 657 217 440Month 3 0.0458a 0.1315a (0.0253) -0.128a (0.0309) 656 217 439Month 12 0.1614c 0.3749a (0.1451) -0.319c (0.1774) 655 217 438Month 36 0.2448 1.8065a (0.5673) -2.147a (0.6651) 389 106 283Month 60 0.1531 0.5148c (0.2663) -0.458 (0.2997) 119 25 94
Panel C: Aftermarket Performance Categorized by Market Sector: Cold Markets Number of Issues
Aftermarket Ri α S.E. β� S.E. Total D=0 D=1 Month 1 -0.0025 0.0114 (0.0166) -0.017 (0.0182) 316 53 263Month 3 0.0020 0.0524b (0.0236) -0.061b (0.0259) 316 53 263Month 12 0.0427 0.3420a (0.0792) -0.360a (0.0869) 315 53 262Month 36 -0.1254c 0.3109c (0.1718) -0.531a (0.1895) 297 53 244Month 60 -0.0994 0.9490b (0.3857) -1.278a (0.4257) 262 47 215
a,b,c denote statistical significance at the 0.01, 0.05, and 0.10 levels, respectively, based on a simple t-test.
Table II displays significant differences in terms of underpricing between New and
Old Economy IPOs. The findings on aftermarket performance of New Economy versus Old Economy IPOs reported in Table VIII follow a similar, clearly distinctive performance pattern. New Economy stocks outperform the market as well as their peers during all measurement periods. Figure 2 graphs the performance dynamics. The return differences are pervasive. For example, the spread in benchmark adjusted returns between New and Old Economy IPOs widened from 4.75 percent after the first month, to 34.0 percent over one year and to 159.30 percent after three years of aftermarket trading. Associated statistics underline the significance of the results that also prevail for IPOs issued in �hot� and �cold� markets. Within sectors, telecommu- nications, technology and healthcare had the best long-run performance, benefiting from deregulation, the global technology boom and the shift towards private medical care in Continental Europe. IPOs in sectors representing basic materials or industrial firms -many of which went public in the early 1990s during the boom in German construction
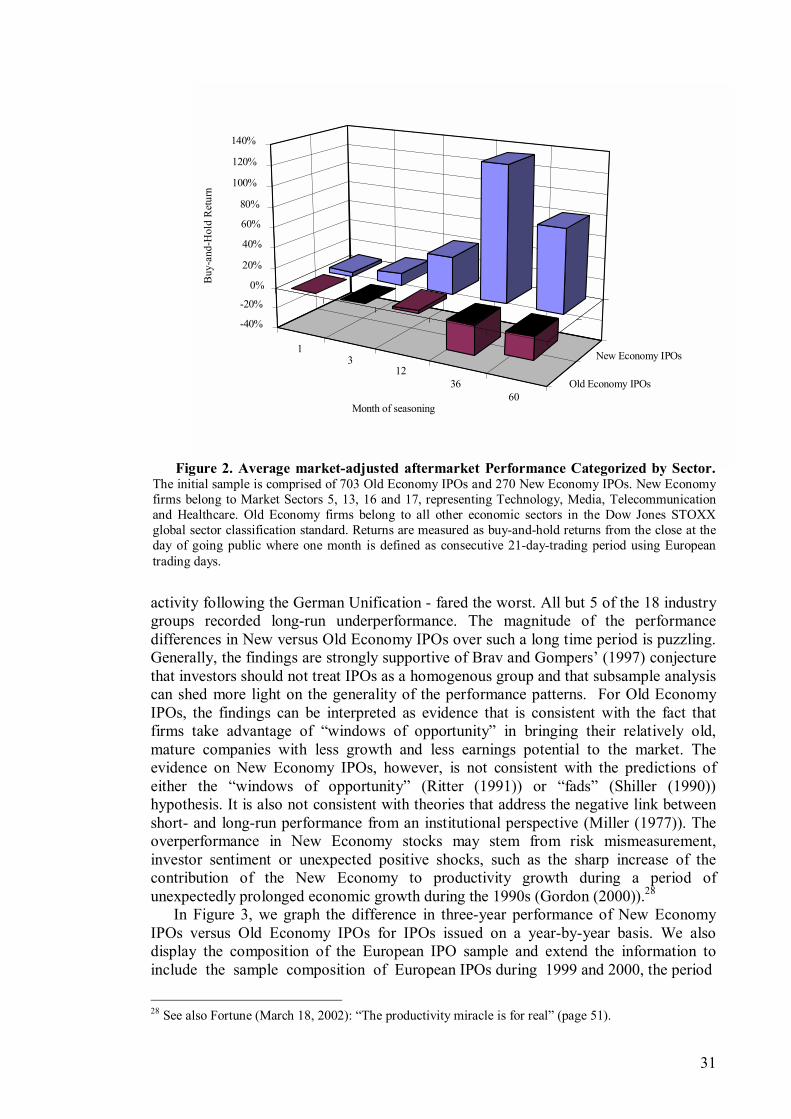
31
activity following the German Unification - fared the worst. All but 5 of the 18 industry groups recorded long-run underperformance. The magnitude of the performance differences in New versus Old Economy IPOs over such a long time period is puzzling. Generally, the findings are strongly supportive of Brav and Gompers� (1997) conjecture that investors should not treat IPOs as a homogenous group and that subsample analysis can shed more light on the generality of the performance patterns. For Old Economy IPOs, the findings can be interpreted as evidence that is consistent with the fact that firms take advantage of �windows of opportunity� in bringing their relatively old, mature companies with less growth and less earnings potential to the market. The evidence on New Economy IPOs, however, is not consistent with the predictions of either the �windows of opportunity� (Ritter (1991)) or �fads� (Shiller (1990)) hypothesis. It is also not consistent with theories that address the negative link between short- and long-run performance from an institutional perspective (Miller (1977)). The overperformance in New Economy stocks may stem from risk mismeasurement, investor sentiment or unexpected positive shocks, such as the sharp increase of the contribution of the New Economy to productivity growth during a period of unexpectedly prolonged economic growth during the 1990s (Gordon (2000)).28
In Figure 3, we graph the difference in three-year performance of New Economy IPOs versus Old Economy IPOs for IPOs issued on a year-by-year basis. We also display the composition of the European IPO sample and extend the information to include the sample composition of European IPOs during 1999 and 2000, the period
28 See also Fortune (March 18, 2002): �The productivity miracle is for real� (page 51).
1 3
1236
60Old Economy IPOs
New Economy IPOs
-40%
-20%
0%
20%
40%
60%
80%
100%
120%
140%
Buy
-and
-Hol
d R
etur
n
Month of seasoning
Figure 2. Average market-adjusted aftermarket Performance Categorized by Sector. The initial sample is comprised of 703 Old Economy IPOs and 270 New Economy IPOs. New Economyfirms belong to Market Sectors 5, 13, 16 and 17, representing Technology, Media, Telecommunicationand Healthcare. Old Economy firms belong to all other economic sectors in the Dow Jones STOXXglobal sector classification standard. Returns are measured as buy-and-hold returns from the close at the day of going public where one month is defined as consecutive 21-day-trading period using European trading days.
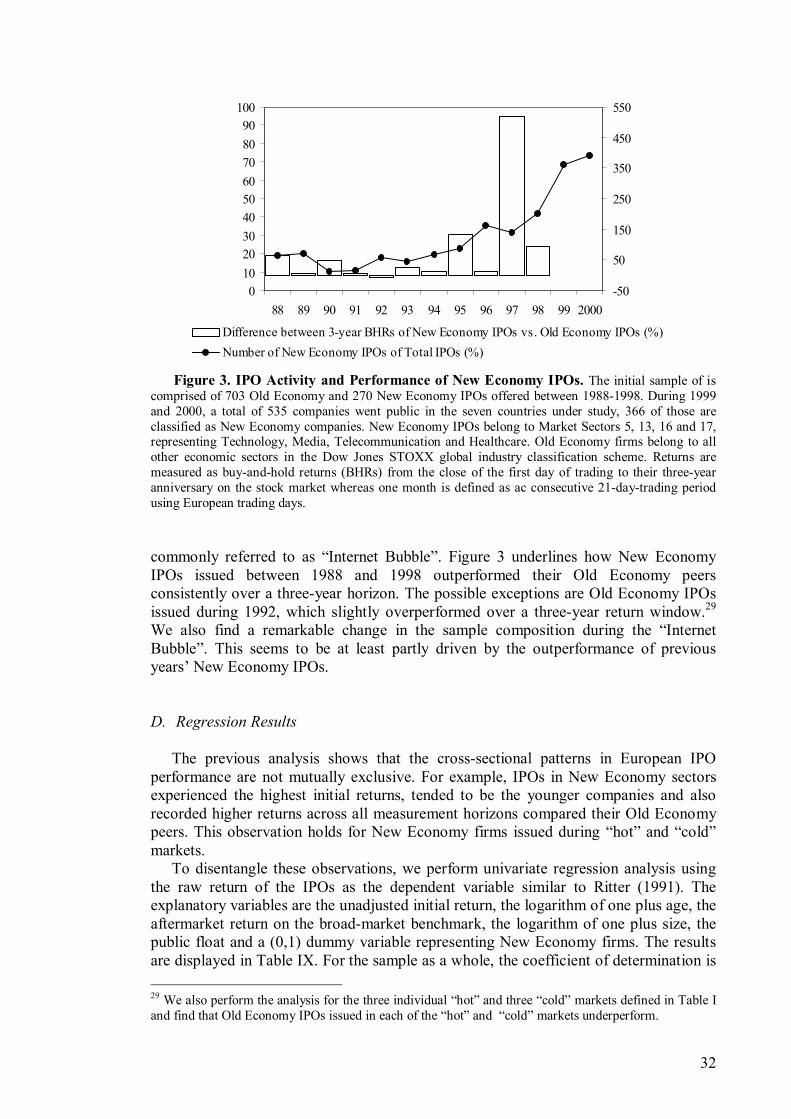
32
Figure 3. IPO Activity and Performance of New Economy IPOs. The initial sample of is comprised of 703 Old Economy and 270 New Economy IPOs offered between 1988-1998. During 1999 and 2000, a total of 535 companies went public in the seven countries under study, 366 of those are classified as New Economy companies. New Economy IPOs belong to Market Sectors 5, 13, 16 and 17, representing Technology, Media, Telecommunication and Healthcare. Old Economy firms belong to all other economic sectors in the Dow Jones STOXX global industry classification scheme. Returns are measured as buy-and-hold returns (BHRs) from the close of the first day of trading to their three-year anniversary on the stock market whereas one month is defined as ac consecutive 21-day-trading period using European trading days. commonly referred to as �Internet Bubble�. Figure 3 underlines how New Economy IPOs issued between 1988 and 1998 outperformed their Old Economy peers consistently over a three-year horizon. The possible exceptions are Old Economy IPOs issued during 1992, which slightly overperformed over a three-year return window.29 We also find a remarkable change in the sample composition during the �Internet Bubble�. This seems to be at least partly driven by the outperformance of previous years� New Economy IPOs. D. Regression Results
The previous analysis shows that the cross-sectional patterns in European IPO
performance are not mutually exclusive. For example, IPOs in New Economy sectors experienced the highest initial returns, tended to be the younger companies and also recorded higher returns across all measurement horizons compared their Old Economy peers. This observation holds for New Economy firms issued during �hot� and �cold� markets.
To disentangle these observations, we perform univariate regression analysis using the raw return of the IPOs as the dependent variable similar to Ritter (1991). The explanatory variables are the unadjusted initial return, the logarithm of one plus age, the aftermarket return on the broad-market benchmark, the logarithm of one plus size, the public float and a (0,1) dummy variable representing New Economy firms. The results are displayed in Table IX. For the sample as a whole, the coefficient of determination is 29 We also perform the analysis for the three individual �hot� and three �cold� markets defined in Table I and find that Old Economy IPOs issued in each of the �hot� and �cold� markets underperform.
0102030405060708090
100
88 89 90 91 92 93 94 95 96 97 98 99 2000-50
50
150
250
350
450
550
Difference between 3-year BHRs of New Economy IPOs vs. Old Economy IPOs (%)Number of New Economy IPOs of Total IPOs (%)
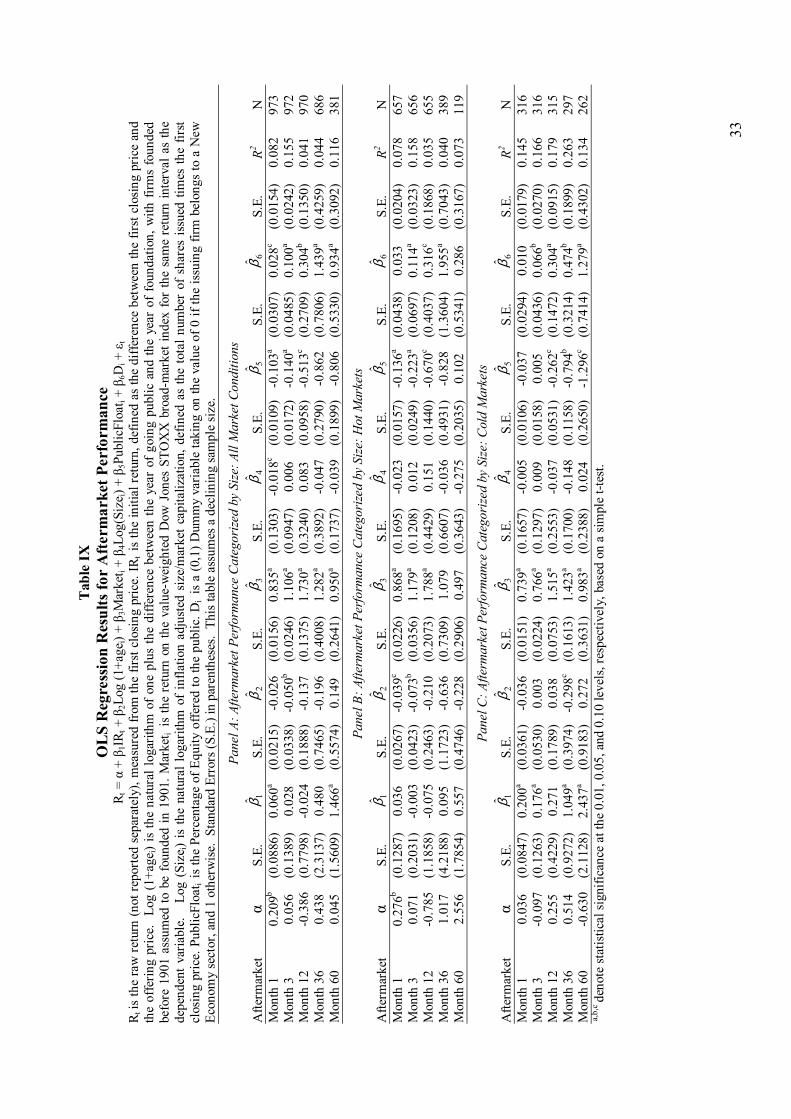
33
Tab
le IX
O
LS
Reg
ress
ion
Res
ults
for
Aft
erm
arke
t Per
form
ance
R t
= α
+ β
1IRt +
β2L
og (1
+age
i) + β 3
Mar
ket i
+ β 4
Log(
Size
i) + β 5
Publ
icFl
oat i
+ β 6
Di +
εt
R t is
the
raw
retu
rn (n
ot re
porte
d se
para
tely
), m
easu
red
from
the
first
clo
sing
pric
e. IR
t is
the
initi
al re
turn
, def
ined
as
the
diffe
renc
e be
twee
n th
e fir
st c
losin
g pr
ice
and
the
offe
ring
pric
e.
Log
(1+a
gei)
is th
e na
tura
l log
arith
m o
f one
plu
s th
e di
ffere
nce
betw
een
the
year
of g
oing
pub
lic a
nd th
e ye
ar o
f fo
unda
tion,
with
firm
s fo
unde
d be
fore
190
1 as
sum
ed to
be
foun
ded
in 1
901.
Mar
ket i
is th
e re
turn
on
the
valu
e-w
eigh
ted
Dow
Jon
es S
TOX
X b
road
-mar
ket i
ndex
for
the
sam
e re
turn
inte
rval
as
the
depe
nden
t var
iabl
e.
Log
(Si
zei)
is th
e na
tura
l log
arith
m o
f in
flatio
n ad
just
ed s
ize/
mar
ket c
apita
lizat
ion,
def
ined
as
the
tota
l num
ber
of s
hare
s is
sued
tim
es th
e fir
st cl
osin
g pr
ice.
Pub
licFl
oat i
is th
e Pe
rcen
tage
of E
quity
offe
red
to th
e pu
blic
. Di i
s a
(0,1
) Dum
my
varia
ble
taki
ng o
n th
e va
lue
of 0
if th
e is
suin
g fir
m b
elon
gs to
a N
ew
Econ
omy
sect
or, a
nd 1
oth
erw
ise.
Sta
ndar
d Er
rors
(S.E
.) in
par
enth
eses
. Th
is ta
ble
assu
mes
a d
eclin
ing
sam
ple
size
.
Pane
l A: A
fterm
arke
t Per
form
ance
Cat
egor
ized
by S
ize:
All
Mar
ket C
ondi
tions
Afte
rmar
ket
α S.
E.
1� β
S.E.
2� β
S.
E.
3� β
S.E.
4� β
S.
E.
5� β
S.E.
6� β
S.
E.
R2 N
M
onth
1
0.20
9b (0
.088
6)
0.06
0a (0
.021
5)-0
.026
(0
.015
6)0.
835a
(0.1
303)
-0.0
18c
(0.0
109)
-0.1
03a
(0.0
307)
0.02
8c (0
.015
4)0.
082
973
Mon
th 3
0.
056
(0.1
389)
0.
028
(0.0
338)
-0.0
50b
(0.0
246)
1.10
6a (0
.094
7)0.
006
(0.0
172)
-0.1
40a
(0.0
485)
0.10
0a (0
.024
2)0.
155
972
Mon
th 1
2 -0
.386
(0
.779
8)
-0.0
24
(0.1
888)
-0.1
37
(0.1
375)
1.73
0a (0
.324
0)0.
083
(0.0
958)
-0.5
13c
(0.2
709)
0.30
4b (0
.135
0)0.
041
970
Mon
th 3
6 0.
438
(2.3
137)
0.
480
(0.7
465)
-0.1
96
(0.4
008)
1.28
2a (0
.389
2)-0
.047
(0
.279
0)-0
.862
(0
.780
6)1.
439a
(0.4
259)
0.04
4 68
6 M
onth
60
0.04
5 (1
.560
9)
1.46
6a (0
.557
4)0.
149
(0.2
641)
0.95
0a (0
.173
7)-0
.039
(0
.189
9)-0
.806
(0
.533
0)0.
934a
(0.3
092)
0.11
6 38
1
Pane
l B: A
fterm
arke
t Per
form
ance
Cat
egor
ized
by S
ize:
Hot
Mar
kets
Afte
rmar
ket
α S.
E.
1� β
S.E.
2� β
S.
E.
3� β
S.E.
4� β
S.
E.
5� β
S.E.
6� β
S.
E.
R2 N
M
onth
1
0.27
6b (0
.128
7)
0.03
6 (0
.026
7)-0
.039
c (0
.022
6)0.
868a
(0.1
695)
-0.0
23
(0.0
157)
-0.1
36a
(0.0
438)
0.03
3 (0
.020
4)0.
078
657
Mon
th 3
0.
071
(0.2
031)
-0
.003
(0
.042
3)-0
.073
b (0
.035
6)1.
179a
(0.1
208)
0.01
2 (0
.024
9)-0
.223
a (0
.069
7)0.
114a
(0.0
323)
0.15
8 65
6 M
onth
12
-0.7
85
(1.1
858)
-0
.075
(0
.246
3)-0
.210
(0
.207
3)1.
788a
(0.4
429)
0.15
1 (0
.144
0)-0
.670
c (0
.403
7)0.
316c
(0.1
868)
0.03
5 65
5 M
onth
36
1.01
7 (4
.218
8)
0.09
5 (1
.172
3)-0
.636
(0
.730
9)1.
079
(0.6
607)
-0.0
36
(0.4
931)
-0.8
28
(1.3
604)
1.95
5a (0
.704
3)0.
040
389
Mon
th 6
0 2.
556
(1.7
854)
0.
557
(0.4
746)
-0.2
28
(0.2
906)
0.49
7 (0
.364
3)-0
.275
(0
.203
5)0.
102
(0.5
341)
0.28
6 (0
.316
7)0.
073
119
Pane
l C: A
fterm
arke
t Per
form
ance
Cat
egor
ized
by
Size
: Col
d M
arke
ts
Afte
rmar
ket
α S.
E.
1� β
S.E.
2� β
S.
E.
3� β
S.E.
4� β
S.
E.
5� β
S.E.
6� β
S.
E.
R2 N
M
onth
1
0.03
6 (0
.084
7)
0.20
0a (0
.036
1)-0
.036
(0
.015
1)0.
739a
(0.1
657)
-0.0
05
(0.0
106)
-0.0
37
(0.0
294)
0.01
0 (0
.017
9)0.
145
316
Mon
th 3
-0
.097
(0
.126
3)
0.17
6a (0
.053
0)0.
003
(0.0
224)
0.76
6a (0
.129
7)0.
009
(0.0
158)
0.00
5 (0
.043
6)0.
066b
(0.0
270)
0.16
6 31
6 M
onth
12
0.25
5 (0
.422
9)
0.27
1 (0
.178
9)0.
038
(0.0
753)
1.51
5a (0
.255
3)-0
.037
(0
.053
1)-0
.262
c (0
.147
2)0.
304a
(0.0
915)
0.17
9 31
5 M
onth
36
0.51
4 (0
.927
2)
1.04
9a (0
.397
4)-0
.298
c (0
.161
3)1.
423a
(0.1
700)
-0.1
48
(0.1
158)
-0.7
94b
(0.3
214)
0.47
4b (0
.189
9)0.
263
297
Mon
th 6
0 -0
.630
(2
.112
8)
2.43
7a (0
.918
3)0.
272
(0.3
631)
0.98
3a (0
.238
8)0.
024
(0.2
650)
-1.2
96c
(0.7
414)
1.27
9a (0
.430
2)0.
134
262
a,b,
c de
note
stat
istic
al si
gnifi
canc
e at
the
0.01
, 0.0
5, a
nd 0
.10
leve
ls, r
espe
ctiv
ely,
bas
ed o
n a
simpl
e t-t
est.
34
rather low across the measurement periods.30 It is markedly higher for IPOs issued in �cold� than in �hot� markets. The parameter estimates support the conclusions that were obtained earlier. The initial return category is correlated with the aftermarket performance of IPOs issued in �cold� markets, with four out of five measurement horizons being significantly positive. Age is correlated with immediate aftermarket returns for IPOs issued in �hot� markets, with all signs being negative across return windows. The coefficient on the market indicates that the beta for our sample of European IPOs is time-varying. Given the technology-led rise in share prices, particularly throughout the second half of the sample period, the coefficient on the market return of 1.28 over three years is in line with our expectation that IPOs are slightly riskier than the market. There is only weak evidence to support that size is correlated with returns, confirming our finding that value-weighting does not change our findings regarding aftermarket performance. Moreover, during 14 out of the 15 return horizons studied, the coefficient on the public float is negative, supporting the signaling hypothesis. We also find a strong correlation between market sector and raw returns, underlining the substantial impact of the New Economy sectors on the results of overall aftermarket performance.
IV. Summary and Conclusion
The European IPO market has gone through a period of unprecedented change. New
Economy sectors have gradually taken a bigger share of total IPO activity, indicating that money previously flowing into mature industries with lower growth prospects had started to flow into young, technology-oriented companies that focus on growth. This process was facilitated by rising stock markets, the initial success of privatizations fuelling a boom in European share ownership, and the creation of market segments dedictated to young, growth-oriented companies. However, it is unclear whether these developments represent either a structural shift or are just symptoms of a time-varying market condition.
This study has focused on the return performance of a large sample of European IPOs during the period 1988-1998. The analysis has been pursued for the sample as a whole and also under two alternative market conditions: for IPOs issued in �hot� markets, when initial returns are high and the general level of the stock market is increasing; and for IPOs issued in �cold� markets, when initial returns are low and the general stock market level is stable or declining. We have split the research agenda into two units: the examination of initial returns and the examination of aftermarket performance. We find significant autocorrelation, which is higher for the number of offerings than for the initial returns. Not surprisingly, we also find significant underpricing, which is related to ex-ante characteristics of uncertainty. We attribute the large amounts of money left on the table during our sample period to some large privatizations.
While we present evidence of short-term overperformance, the results do not indicate that IPOs offered underperform in the long-run. This result appears to be robust across time periods underlining the most recent literature arguing that the long-run underperformance of IPOs is a time-varying phenomenon. Our results are also sensitive to the benchmark employed and return methodology with IPO outperformance being most magnified when compared against small- and medium- sized company
30 We have also experimented with adjusted R2 s, and do not find qualitatively different results.
35
benchmarks. The long-run positive aftermarket performance, however, is limited to IPOs issued in �hot� markets. In �cold� markets, the broad-market-adjusted equally-weighted performance is strongly negative. Moreover, the results on aftermarket performance worsen substantially when looking at the median picture, with some extreme returns driving the performance.
In order to shed some light on the underlying dynamics of aftermarket performance, we categorize returns according to a set of issuing characteristics. We find a strong impact of the initial return category. Here, companies with higher initial returns fare best, underlining the role of underpricing as a signal of firm quality. The quality of the underpricing signal is best in �cold� markets which are characterised by less �noise�. The evidence also points to a strong signaling role of the size of the public float, in the sense that it is positively related to aftermarket performance across measurement horizons. This is true for IPOs issued in both �hot� and �cold� markets. Moreover, the cross-sectional findings in this study provide definitive testimony of the overriding influence of the New Economy during the 1990s, which had a dramatic impact on the investment world in general and the European IPO market in particular. We show that the relatively good average performance of European IPOs issued between 1988 and 1998 is due to offerings in the New Economy that account for just 28 percent of the sample. While we do not adjust for risk, it is unlikely that beta alone can account for the performance differences. These results extend across all measurement horizons. Through the outburst of IPO activity in the New Economy sectors relative to the Old Economy on the �New Market� segments during the height of the �Internet Bubble� in 1999 and part of 2000, this multi-year pattern ultimately reversed.
REFERENCES Aggarwal, Reena, 2000, Stabilization Activities by Underwriters after Initial Public Offerings, Journal of
Finance 55, 1075-1103. Aggarwal, Reena, and Pietra Rivoli, 1990, Fads in the Initial Public Offering Market?, Financial
Management 1990, 45-57. Akerlof, George A., 1970, The Market for �Lemons�: Quality Uncertainty and the Market Mechanism,
The Quarterly Journal of Economics 84, 488-500. Allen, Franklin, and Gerald R. Faulhaber, 1989, Signaling by underpricing in the IPO market, Journal of
Financial Economics 23, 303-324. Álvarez, Susana and Victor M. Gonzáles, 2001, Long�Run Performance of Initial Public Offerings (IPOs)
In the Spanish Capital Market, Working Paper, University of Oviedo. Amihud, Yakov, Shmuel Hauser, and Amir Kirsh, 2002, Allocations, adverse selection and cascades in
IPOs: Evidence from Israel, Working paper, New York University. Baker, Malcolm P., and Jeffrey Wurgler, 2000, The equity share in new issues and aggregate stock
returns, Journal of Finance 55, 2219-2257. Barry, Christopher B, and Robert H. Jennings, 1992, Information and Diversity of Analyst Opinion,
Journal of Financial and Quantitative Analysis 27, 169-183. Barber, Brad and John Lyon, 1997, Detecting long-horizon abnormal stock returns: the empirical power
and specification of test statistics, Journal of Financial Economics 43, 341-372. Baron, David P., 1982, A model of the demand for investment banking advising and distribution services
of new issues, Journal of Finance 37, 955-976. Beatty, Randolph P., and Ivo Welch, 1996, Issuer expenses and legal liability initial public offerings,
Journal of Law and Economics 39, 545-602. Beneviste, Lawrence M., and Paul A. Spindt, 1989, How investment bankers determine the offer price
and allocation of new issues, Journal of Financial Economics 24, 343-362. Beneviste, Lawrence M., and William J. Wilhelm, 1990, A comparative analysis of IPO proceeds under
alternative regulatory environments, Journal of Financial Economics 28, 173-208.

36
Bradley, Daniel, and Brad Jordan, and Jay R. Ritter, 2002, The quiet period goes out with a bang, Working paper, University of Kentucky.
Bradley, Daniel, Brad Jordan, Ivan Roten, and Ha-Chin Yi, 2001, Venture capital and IPO lockup expirations: An empirical analysis, Journal of Financial Research 24, 465-492.
Brav, Alon and Paul Gompers, 1997, Myth or reality? The long-run underperformance of initial public offerings: Evidence from venture and nonventure capital-backed companies, Journal of Finance 52, 1791-1821.
Brav, Alon, and Paul Gompers, 2002, Insider trading subsequent to initial public offerings: Evidence from the expiration of lockup provisions, Review of Financial Studies, forthcoming.
Brav, Alon, Christopher Geczy, and Paul Gompers, 2000, Is the Abnormal Return Following Equity Issuance Anomalous?, Journal of Financial Economics 56, 209-249.
Brown, Stephen J., and Jerry Warner, 1980, Measuring security price performance, Journal of Financial Economics 8, 205-258.
Carter, Richard B., and Steven Manaster, 1990, Initial public offerings and underwriter reputation, Journal of Finance 45, 1045-1067.
Chalmers, John M. R., Larry Y. Dann, and Jarrad Harford, 2000, Managerial Opportunism? Evidence from Directors� and Officers� Insurance Purchases, Working Paper, University of Oregon.
Chan, Louis K.C. and Josef Lakonishok, 1992, Robust measurement of beta risk, Journal of Financial and Quantitative Analysis 27, 265-282.
Clarkson, Peter and Rex Thompson, 1990, Empirical estimates of beta when investors face estimation risk, Journal of Finance 45, 431-453.
Cooney, John W., Ajai K. Singh, Richard B. Carter, and Frederick H. Dark, 2001, IPO initial returns and underwriter reputation: Has the inverse relationship flipped in the 1900s?, Working paper, University of Kentucky, Case Western Reserve University, and Iowa State University.
Cornelli, Francesca, and David Goldreich, 2001, Bookbuilding and strategic allocation, Journal of Finance 56, 2337-2369.
Derrien, Francois, and Kent L. Womack, K. (2002): Auctions vs. Bookbuilding and the Control of Underpricing in Hot IPO Markets, Review of Financial Studies, forthcoming.
De Bondt, Werner F. M., and Richard Thaler, 1985, Does the Stock Market Overreact?, Journal of Finance 40, 793-805.
Dimson, Elroy and Paul Marsh, 1986, Event study methodologies and the size effect, Journal of Financial Economics 17, 113-142.
D�Souza Juliet, and William L. Megginson, 1999, The Financial and Operating Performance of Pri-vatized Firms during the 1990s, Working Paper, Mercer University and University of Oklahoma.
Drake, Philip D., and Michael R. Vetsuypens, 1993, IPO underpricing and insurance against legal liability, Financial Management 22, 64-73.
Duffie, Darrell, Nicolae Gârleanu and Lasse H. Pederson, 2002, Securities Lending, Shorting and Pricing, Working Paper, Graduate School of Business, Stanford University.
Espenlaub, Susanne and Ian Tonks, 1998, Post-Directors� Sales and Reissuing Activity: An Empirical Test of IPO Signalling Models, Discussion Paper 283, LSE Financial Markets Group.
Espenlaub, Susanne, Alan Gregory and Ian Tonks, 1998, Testing the Robustness of Long-Term Underperformance of UK Initial Public Offerings, Discussion Paper 285, LSE Financial Markets Group.
Fama, Eugene F., 1998, Market efficiency, long-term returns, and behavioural finance, Journal of Financial Economics 49, 283-306.
Field, Laura C., and Gordon Hanka, 2001, The expiration of IPO share lockups, Journal of Finance 56, 471-500.
Geczy, Christopher, C., David K. Musto and Adam V. Reed, 2002, Stocks are Special Too: An Analysis of the Equity Lending Market, Journal of Financial Economics, forthcoming.
Giudici, Giancarlo, and Stefano Paleari, 1999, Underpricing, Price Stabilization and Long Run Performance in Initial Public Offerings: A Study on the Italian Stock Market Between 1985 and 1998, Working Paper, Politecnico di Milano.
Gompers, Paul, and Josh Lerner, 2001, The really long-term performance of initial public offerings: The pre-NASDAQ experience, Working paper, Harvard Business School.
Gordon, Robert J., 2001, Technology and Economic Performance in the American Economy, Working Paper, Northwestern University.
Grinblatt, Mark, and Chuan Yang Hwang, 1989, Signalling and the Pricing of New Issues, The Journal of Finance 44, 393-420.

37
Habib, Michel, and Alexander Ljungqvist, 2001, Underpricing and entrepreneurial wealth losses in IPOs: Theory and evidence, Review of Financial Studies 14, 433-458.
Harrison, J. Michael and David M. Kreps, Speculative Investor Behavior in a Stock Market with Heterogeneous Expectations, Quarterly Journal of Economics 92, 323-336.
Hanley, Kathleen Weiss, 1993, The underpricing of initial public offerings and the partial adjustment phenomenon, Journal of Financial Economics 34, 231-250.
Hanley, Kathleen Weiss, Arun Kumar, and Paul Seguin, 1993, Price stabilization in the market for new issues, Journal of Financial Economics 34, 177-197.
Helwege, Jean and Nellie Liang, 2001, Initial Public Offerings in Hot and Cold Markets, Working Paper, Ohio State University and Board of Governors of the Federal Reserve System.
Ibbotson, Roger G., 1975, Price performance of common stock new issues, Journal of Financial Eco-nomics 2, 235-272.
Ibbotson, Roger G., Jody L. Sindelar, and Jay R. Ritter, 1988, Initial public offerings, Journal of Applied Corporate Finance 1, 37-45.
Ibbotson, Roger G., and Jeffrey F. Jaffe, 1975, �Hot Issue� Markets, Journal of Finance 30, 1027-1042. Jain, Bharat A., and Omesh Kini, 1994, The post-issue operating performance of IPO firms, Journal of
Finance 49, 1699-1726. Jegadeesh, Narasimhan, Mark Weinstein, and Ivo Welch, 1993, An empirical investigation of IPO returns
and subsequent equity offerings, Journal of Financial Economics 34, 153-175. Jensen, Michael and William H. Meckling, 1976, Theory of the firm: Managerial behavior, agency costs
and ownership structure, Journal of Financial Economics 3, 306-360. Jenkinson, Tim, Alexander P. Ljungqvist and William J. Wilhelm, 2000, Has the Introduction of Book-
building Increased the Efficiency of International IPOs?, Working Paper, Oxford University. Jenkinson, Tim, and Alexander Ljungqvist, 2001, Going Public: The Theory and Evidence on How Com-
panies Raise Equity Finance, 2nd edition (Oxford University Press, Oxford, UK). Jones, Steven L., William L. Megginson, Robert C. Nash, and Jeffrey M. Netter, 1999, Share Issue
Privatization as Financial Means to Political and Economic Ends, Journal of Financial Economics, 217-253.
Kahneman, Daniel, and Amos Tversky, 1979, Prospect theory: An analysis of decision under risk, Econometrica 47, 263-291.
Keloharju, Matti, 1993, The winners�s curse, legal liability, and the long-run performance of initial public offerings in Finland, Journal of Financial Economics 34, 251-277.
Koh, Francis, and Terry Walter, 1989, A direct test of Rocks model of the pricing of unseasoned issues, Journal of Financial Economics 23, 251-272.
Kothari, S. P. and Jerry Warner, 1997, Measuring long-horizon security price performance, Journal of Financial Economics 43, 301-339.
Leland, Hayne E., and David H. Pyle, 1977, Informational Asymmetries, Financial Structure, and Financial Intermediation, Journal of Finance 32, 371-387.
Leleux, Benoit and Daniel Muzyka, 1998, European IPO Markets: A Post-Issue Performance Study, in Mike Right and Ken Robie, ed.: Management Buy-Outs and Venture Capital: Into the Next Millenium (Manchester University Press, Manchester, England).
Lerner, Josh, 1994, Venture capitalists and the decision to go public, Journal of Financial Economics 35, 293-316.
Logue, Dennis E., 1973, On the pricing of unseasoned equity issues: 1965-1969, Journal of Financial and Quantitative Analysis 8, 91-103.
Loughran, Tim, and Jay R. Ritter and Kristian Rydqvist, 1994, Initial public offerings: International insights, Pacific-Basin Finance Journal 2, 165-199.
Loughran, Tim, and Jay R. Ritter, 1995, The New Issues Puzzle, Journal of Finance 50, 23-51. Loughran, Tim, and Jay R. Ritter, 2000, Uniformly least powerful tests of market efficiency, Journal of
Financial Economics 55, 361-389. Loughran, Tim, and Jay R. Ritter, 2001, Why has IPO underpricing increased over time?, Working paper,
University of Florida. Loughran, Tim, and Jay R. Ritter, 2002, Why don�t issuers get upset about leaving money on the table in
IPOs?, Review of Financial Studies 15, 413-443. Lowry, Michelle, and G. William Schwert, 2002, IPO Market Cycles: Bubbles or Sequential Learning?,
Journal of Finance 57, 1171-1198. Michaely, Roni, and Wayne H. Shaw, 1994, The pricing of initial public offerings: Tests of adverse-
selection and signaling theories, Review of Financial Studies 7, 279-319. Miller, Edward M., 1977, Risk, uncertainty, and divergence of opinion, Journal of Finance 32, 1151-
1168.

38
Miller, Robert E., and Frank Reilly, 1987, An Examination of Mispricing, Returns and Uncertainty for Initial Public Offerings, Financial Management 16, 33-38.
Morris, Steven, 1996, Speculative Investor Behavior and Learning, Quarterly Journal of Economics 111, 1111-1133.
Muscarella, Chris J., and Michael R. Vetsuypens, 1989, A simple test of Baron�s model of IPO under- pricing, Journal of Financial Economics 24, 125-136.
Perotti, Enrico, 1995, Credible Privatization, American Economic Review 85, 847-859. Perotti, Enrico, and Serhat E. Guney, 1993, Successful privatisation plans: Enhanced credibility through
timing and pricing of sales, Financial Management 22, 84-98. Rajan, Raghuram, and Henri Servaes, 1993, The Effect of Market Conditions on Initial Public Offerings,
Working Paper, University of Chicago. Rock, Kevin, 1986, Why new issues are underpriced, Journal of Financial Economics 15, 187-212. Ritter, Jay R., 1984, The �hot issue� market of 1980, Journal of Business 57, 215-240. Ritter, Jay R., 1991, The Long-Run Performance of Initial Public Offerings, Journal of Finance 46, 3-27. Ritter, Jay R., 2001, Some Factoids about the US IPO market, mimeo, University of Florida. Ritter, Jay R., 2002, Some Factoids about the US IPO market, mimeo, University of Florida. Ritter, Jay R., and Ivo Welch, 2002, A Review of IPO Activity, Pricing, and Allocations, Journal of
Finance, forthcoming. Ruud, Judith S., 1993, Underwriter Price Support and the IPO Underpricing Puzzle, Journal of Financial
Economics 34, 135-151. Scheinkman, José, Wei Xiong, 2002, Overconfidence and Speculative Bubbles, Working Paper, Depart-
ment of Economics and Bendheim Center for Finance, Princeton University. Schultz, Paul H., and Mir Zaman, 1994, Aftermarket support and underpricing of initial public offerings,
Journal of Financial Economics 35, 199-219. Schuster, Josef A., 1996, Underpricing and crises � IPO performance in Germany, Discussion Paper 252,
Financial Markets Group, London School of Economics. Shafik, Nemat, 1996, Selling privatization politically, Columbia Journal of World Business 31, 20-29. Shiller, Robert J., 1990, Speculative Prices and Popular Models, Journal of Economic Perspectives 4, 55-
65. Shleifer, Andrei and Larry Summers, 1990, The Noise Trader Approach to Finance, Journal of Economic
Perspectives 4, 19-33. Spatt, Chester S., and Sanjay Srivastava, 1991, Preplay communication, participation restrictions, and
efficiency in initial public offerings, Review of Financial Studies 4, 709-726. Stehle, Richard, Olaf Erhardt and René Przyborowsky, 1998, Long-run stock performance after initial
public offerings and seasoned equity issues, Working Paper, Humboldt Universität Berlin. Stoll, Hans R., and Anthony J. Curley, 1970, Small Business and the New Issues Market for Equities,
Journal of Financial and Quantitative Analysis 5, 309-322. Teoh, Siew Hong, Ivo Welch and T. J. Wong, 1998, Earnings Management and the Long-Run Market
Performance of Initial Public Offerings, Journal of Finance 53, 1935-1974. Tinic, Seha M., 1988, Anatomy of initial public offerings of common stock, Journal of Finance 43, 789-
822. Vijh, Anand M., 1999, Long-term returns form equity carveouts, Journal of Financial Economics 51,
273-308. Welch, Ivo, 1989, Seasoned offerings, imitation costs, and the underpricing of initial public offerings,
Journal of Finance 44, 421-450. Welch, Ivo, 1992, Sequential sales, learning, and cascades, Journal of Finance 47, 695-732.

39
Table AI
Global Sector Classification Standard31 The Dow Jones STOXX global sector classification standard groups companies that have similar primary revenue sources. There are 10 economic sectors and derived from these � in increasingly finer classifications � are 18 market sectors (used for this study), 51 industry groups and 89 sub-groups. New Economy firms (270) belong to Market Sectors 5, 13, 16 and 17, representing Media [MDI], Healthcare [HCR], Technology [TEC] and Telecommunications [TLS], respectively. For the purpose of this study, all other Market Sectors are defined as belonging to the Old Economy. Europe (EU) = Total Number of IPOs issued between 1988 and 1998 in Germany (BD), France (FR), Italy (IT), the Netherlands (NL), Spain (SP), Sweden (SD) and Switzerland (SW).
Market Sectors Country and Number of IPOs
EU BD FR IT NL SP SD SW
1 Basic Resources [BAS] 46 5 13 3 3 9 11 2 2 Chemicals [CHM] 27 4 10 4 5 1 0 3 3 Automobiles [ATO] 36 10 11 4 4 1 6 0 4 Cyclical Goods and Services [CGS] 124 33 39 21 6 9 10 6 5 Media [MDI] 32 3 18 3 1 2 5 0 6 Retail [RTS] 44 16 19 1 3 1 4 0 7 Food & Beverage [FOB] 51 7 24 2 1 12 3 2 8 Non-Cyclical Goods & Services [NCG] 63 13 26 1 8 9 5 1 9 Energy [ENE] 11 0 4 2 1 2 2 0 10 Banks [BNK] 20 3 2 6 0 6 2 1 11 Financial Services [FSV] 58 12 13 6 4 9 13 1 12 Insurance [INS] 17 4 5 5 0 2 0 1 13 Healthcare [HCR] 54 7 22 1 4 0 14 6 14 Construction [CNS] 47 18 8 2 3 13 3 0 15 Industrial Goods & Services [IGS] 147 32 45 12 7 9 34 8 16 Technology [TEC] 170 43 56 1 24 1 34 11 17 Telecommunications [TLS] 14 4 6 0 1 0 2 1 18 Utilities [UTI] 12 5 2 3 0 2 0 0
Total 973 219 323 77 75 88 148 43
31 For the complete classification standard see: http://www.stoxx.com/indexes/guide/index_guide.pdf
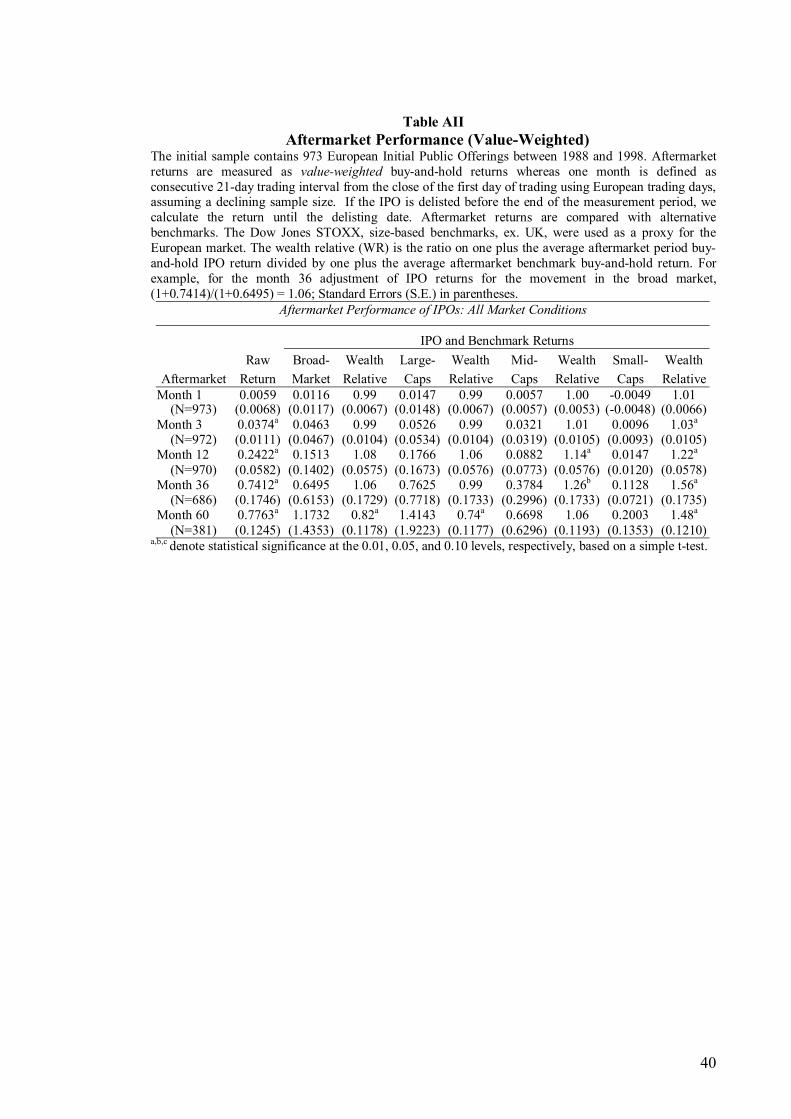
40
Table AII
Aftermarket Performance (Value-Weighted) The initial sample contains 973 European Initial Public Offerings between 1988 and 1998. Aftermarket returns are measured as value-weighted buy-and-hold returns whereas one month is defined as consecutive 21-day trading interval from the close of the first day of trading using European trading days, assuming a declining sample size. If the IPO is delisted before the end of the measurement period, we calculate the return until the delisting date. Aftermarket returns are compared with alternative benchmarks. The Dow Jones STOXX, size-based benchmarks, ex. UK, were used as a proxy for the European market. The wealth relative (WR) is the ratio on one plus the average aftermarket period buy-and-hold IPO return divided by one plus the average aftermarket benchmark buy-and-hold return. For example, for the month 36 adjustment of IPO returns for the movement in the broad market, (1+0.7414)/(1+0.6495) = 1.06; Standard Errors (S.E.) in parentheses.
Aftermarket Performance of IPOs: All Market Conditions
IPO and Benchmark Returns Raw Broad- Wealth Large- Wealth Mid- Wealth Small- Wealth
Aftermarket Return Market Relative Caps Relative Caps Relative Caps RelativeMonth 1 0.0059 0.0116 0.99 0.0147 0.99 0.0057 1.00 -0.0049 1.01
(N=973) (0.0068) (0.0117) (0.0067) (0.0148) (0.0067) (0.0057) (0.0053) (-0.0048) (0.0066)Month 3 0.0374a 0.0463 0.99 0.0526 0.99 0.0321 1.01 0.0096 1.03a
(N=972) (0.0111) (0.0467) (0.0104) (0.0534) (0.0104) (0.0319) (0.0105) (0.0093) (0.0105)Month 12 0.2422a 0.1513 1.08 0.1766 1.06 0.0882 1.14a 0.0147 1.22a
(N=970) (0.0582) (0.1402) (0.0575) (0.1673) (0.0576) (0.0773) (0.0576) (0.0120) (0.0578)Month 36 0.7412a 0.6495 1.06 0.7625 0.99 0.3784 1.26b 0.1128 1.56a
(N=686) (0.1746) (0.6153) (0.1729) (0.7718) (0.1733) (0.2996) (0.1733) (0.0721) (0.1735)Month 60 0.7763a 1.1732 0.82a 1.4143 0.74a 0.6698 1.06 0.2003 1.48a
(N=381) (0.1245) (1.4353) (0.1178) (1.9223) (0.1177) (0.6296) (0.1193) (0.1353) (0.1210)a,b,c denote statistical significance at the 0.01, 0.05, and 0.10 levels, respectively, based on a simple t-test.
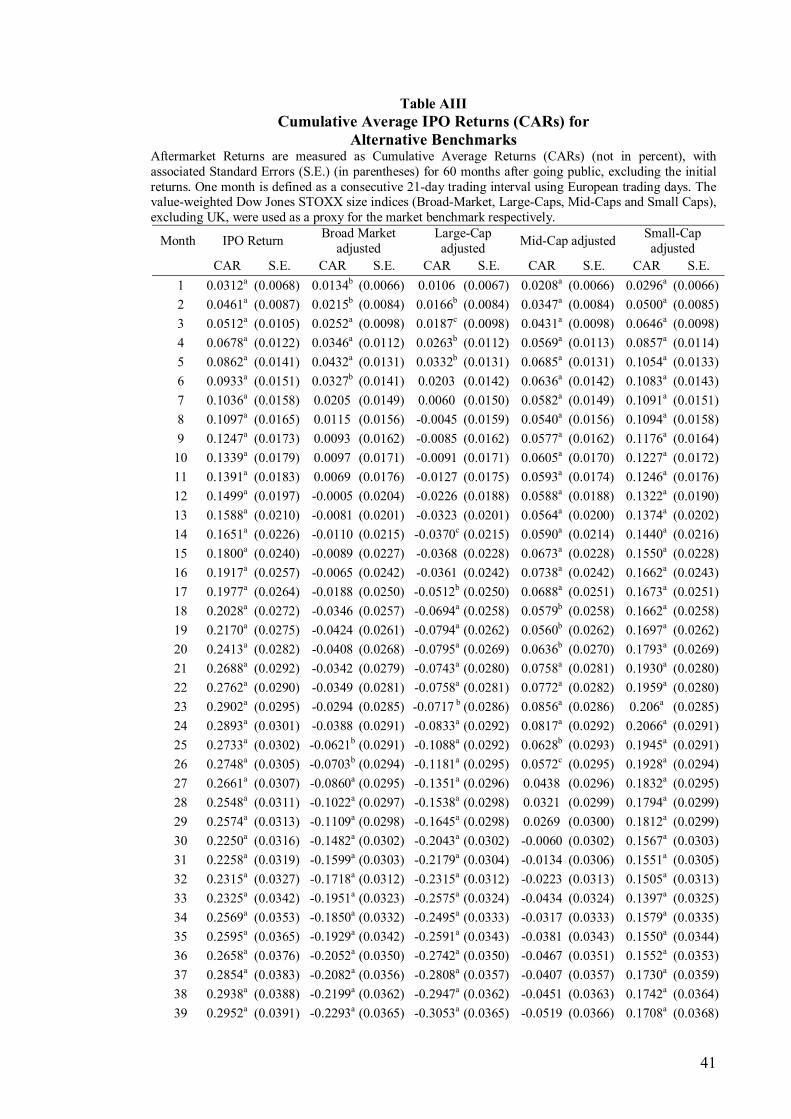
41
Table AIII Cumulative Average IPO Returns (CARs) for
Alternative Benchmarks Aftermarket Returns are measured as Cumulative Average Returns (CARs) (not in percent), with associated Standard Errors (S.E.) (in parentheses) for 60 months after going public, excluding the initial returns. One month is defined as a consecutive 21-day trading interval using European trading days. The value-weighted Dow Jones STOXX size indices (Broad-Market, Large-Caps, Mid-Caps and Small Caps), excluding UK, were used as a proxy for the market benchmark respectively.
Month IPO Return Broad Market adjusted
Large-Cap adjusted Mid-Cap adjusted Small-Cap
adjusted CAR S.E. CAR S.E. CAR S.E. CAR S.E. CAR S.E. 1 0.0312a (0.0068) 0.0134b (0.0066) 0.0106 (0.0067) 0.0208a (0.0066) 0.0296a (0.0066)2 0.0461a (0.0087) 0.0215b (0.0084) 0.0166b (0.0084) 0.0347a (0.0084) 0.0500a (0.0085)3 0.0512a (0.0105) 0.0252a (0.0098) 0.0187c (0.0098) 0.0431a (0.0098) 0.0646a (0.0098)4 0.0678a (0.0122) 0.0346a (0.0112) 0.0263b (0.0112) 0.0569a (0.0113) 0.0857a (0.0114)5 0.0862a (0.0141) 0.0432a (0.0131) 0.0332b (0.0131) 0.0685a (0.0131) 0.1054a (0.0133)6 0.0933a (0.0151) 0.0327b (0.0141) 0.0203 (0.0142) 0.0636a (0.0142) 0.1083a (0.0143)7 0.1036a (0.0158) 0.0205 (0.0149) 0.0060 (0.0150) 0.0582a (0.0149) 0.1091a (0.0151)8 0.1097a (0.0165) 0.0115 (0.0156) -0.0045 (0.0159) 0.0540a (0.0156) 0.1094a (0.0158)9 0.1247a (0.0173) 0.0093 (0.0162) -0.0085 (0.0162) 0.0577a (0.0162) 0.1176a (0.0164)
10 0.1339a (0.0179) 0.0097 (0.0171) -0.0091 (0.0171) 0.0605a (0.0170) 0.1227a (0.0172)11 0.1391a (0.0183) 0.0069 (0.0176) -0.0127 (0.0175) 0.0593a (0.0174) 0.1246a (0.0176)12 0.1499a (0.0197) -0.0005 (0.0204) -0.0226 (0.0188) 0.0588a (0.0188) 0.1322a (0.0190)13 0.1588a (0.0210) -0.0081 (0.0201) -0.0323 (0.0201) 0.0564a (0.0200) 0.1374a (0.0202)14 0.1651a (0.0226) -0.0110 (0.0215) -0.0370c (0.0215) 0.0590a (0.0214) 0.1440a (0.0216)15 0.1800a (0.0240) -0.0089 (0.0227) -0.0368 (0.0228) 0.0673a (0.0228) 0.1550a (0.0228)16 0.1917a (0.0257) -0.0065 (0.0242) -0.0361 (0.0242) 0.0738a (0.0242) 0.1662a (0.0243)17 0.1977a (0.0264) -0.0188 (0.0250) -0.0512b (0.0250) 0.0688a (0.0251) 0.1673a (0.0251)18 0.2028a (0.0272) -0.0346 (0.0257) -0.0694a (0.0258) 0.0579b (0.0258) 0.1662a (0.0258)19 0.2170a (0.0275) -0.0424 (0.0261) -0.0794a (0.0262) 0.0560b (0.0262) 0.1697a (0.0262)20 0.2413a (0.0282) -0.0408 (0.0268) -0.0795a (0.0269) 0.0636b (0.0270) 0.1793a (0.0269)21 0.2688a (0.0292) -0.0342 (0.0279) -0.0743a (0.0280) 0.0758a (0.0281) 0.1930a (0.0280)22 0.2762a (0.0290) -0.0349 (0.0281) -0.0758a (0.0281) 0.0772a (0.0282) 0.1959a (0.0280)23 0.2902a (0.0295) -0.0294 (0.0285) -0.0717 b (0.0286) 0.0856a (0.0286) 0.206a (0.0285)24 0.2893a (0.0301) -0.0388 (0.0291) -0.0833a (0.0292) 0.0817a (0.0292) 0.2066a (0.0291)25 0.2733a (0.0302) -0.0621b (0.0291) -0.1088a (0.0292) 0.0628b (0.0293) 0.1945a (0.0291)26 0.2748a (0.0305) -0.0703b (0.0294) -0.1181a (0.0295) 0.0572c (0.0295) 0.1928a (0.0294)27 0.2661a (0.0307) -0.0860a (0.0295) -0.1351a (0.0296) 0.0438 (0.0296) 0.1832a (0.0295)28 0.2548a (0.0311) -0.1022a (0.0297) -0.1538a (0.0298) 0.0321 (0.0299) 0.1794a (0.0299)29 0.2574a (0.0313) -0.1109a (0.0298) -0.1645a (0.0298) 0.0269 (0.0300) 0.1812a (0.0299)30 0.2250a (0.0316) -0.1482a (0.0302) -0.2043a (0.0302) -0.0060 (0.0302) 0.1567a (0.0303)31 0.2258a (0.0319) -0.1599a (0.0303) -0.2179a (0.0304) -0.0134 (0.0306) 0.1551a (0.0305)32 0.2315a (0.0327) -0.1718a (0.0312) -0.2315a (0.0312) -0.0223 (0.0313) 0.1505a (0.0313)33 0.2325a (0.0342) -0.1951a (0.0323) -0.2575a (0.0324) -0.0434 (0.0324) 0.1397a (0.0325)34 0.2569a (0.0353) -0.1850a (0.0332) -0.2495a (0.0333) -0.0317 (0.0333) 0.1579a (0.0335)35 0.2595a (0.0365) -0.1929a (0.0342) -0.2591a (0.0343) -0.0381 (0.0343) 0.1550a (0.0344)36 0.2658a (0.0376) -0.2052a (0.0350) -0.2742a (0.0350) -0.0467 (0.0351) 0.1552a (0.0353)37 0.2854a (0.0383) -0.2082a (0.0356) -0.2808a (0.0357) -0.0407 (0.0357) 0.1730a (0.0359)38 0.2938a (0.0388) -0.2199a (0.0362) -0.2947a (0.0362) -0.0451 (0.0363) 0.1742a (0.0364)39 0.2952a (0.0391) -0.2293a (0.0365) -0.3053a (0.0365) -0.0519 (0.0366) 0.1708a (0.0368)
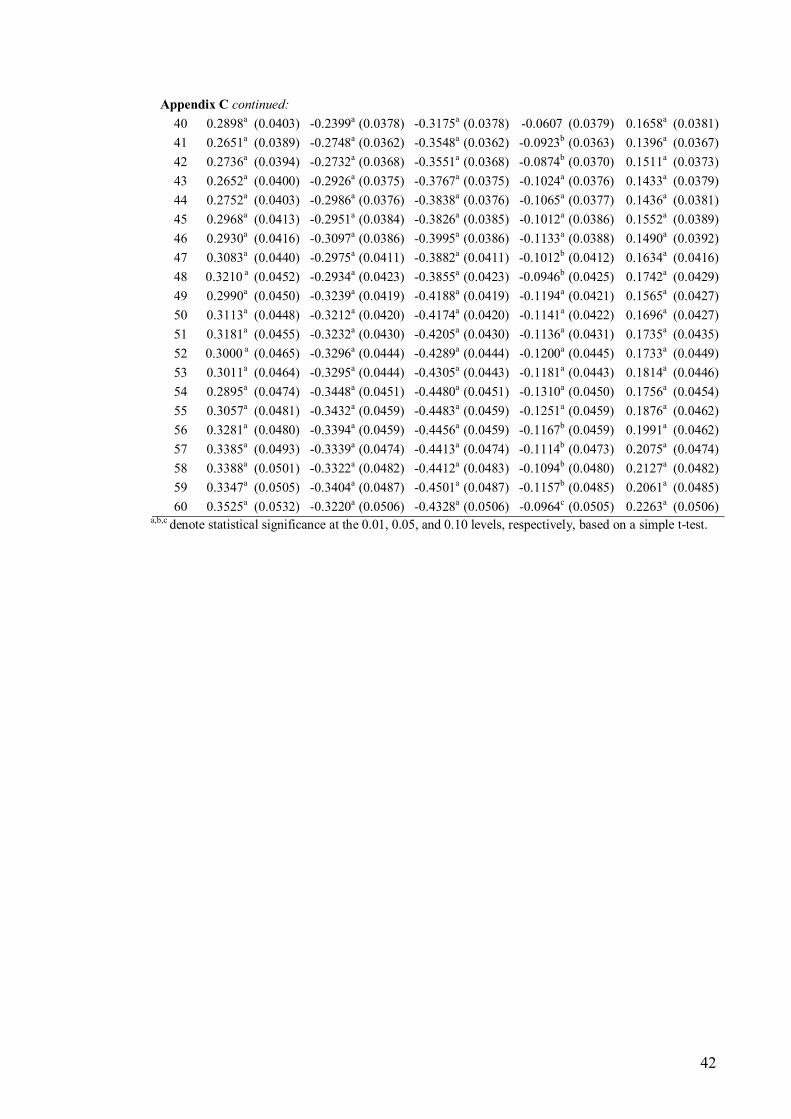
42
Appendix C continued: 40 0.2898a (0.0403) -0.2399a (0.0378) -0.3175a (0.0378) -0.0607 (0.0379) 0.1658a (0.0381)41 0.2651a (0.0389) -0.2748a (0.0362) -0.3548a (0.0362) -0.0923b (0.0363) 0.1396a (0.0367)42 0.2736a (0.0394) -0.2732a (0.0368) -0.3551a (0.0368) -0.0874b (0.0370) 0.1511a (0.0373)43 0.2652a (0.0400) -0.2926a (0.0375) -0.3767a (0.0375) -0.1024a (0.0376) 0.1433a (0.0379)44 0.2752a (0.0403) -0.2986a (0.0376) -0.3838a (0.0376) -0.1065a (0.0377) 0.1436a (0.0381)45 0.2968a (0.0413) -0.2951a (0.0384) -0.3826a (0.0385) -0.1012a (0.0386) 0.1552a (0.0389)46 0.2930a (0.0416) -0.3097a (0.0386) -0.3995a (0.0386) -0.1133a (0.0388) 0.1490a (0.0392)47 0.3083a (0.0440) -0.2975a (0.0411) -0.3882a (0.0411) -0.1012b (0.0412) 0.1634a (0.0416)48 0.3210 a (0.0452) -0.2934a (0.0423) -0.3855a (0.0423) -0.0946b (0.0425) 0.1742a (0.0429)49 0.2990a (0.0450) -0.3239a (0.0419) -0.4188a (0.0419) -0.1194a (0.0421) 0.1565a (0.0427)50 0.3113a (0.0448) -0.3212a (0.0420) -0.4174a (0.0420) -0.1141a (0.0422) 0.1696a (0.0427)51 0.3181a (0.0455) -0.3232a (0.0430) -0.4205a (0.0430) -0.1136a (0.0431) 0.1735a (0.0435)52 0.3000 a (0.0465) -0.3296a (0.0444) -0.4289a (0.0444) -0.1200a (0.0445) 0.1733a (0.0449)53 0.3011a (0.0464) -0.3295a (0.0444) -0.4305a (0.0443) -0.1181a (0.0443) 0.1814a (0.0446)54 0.2895a (0.0474) -0.3448a (0.0451) -0.4480a (0.0451) -0.1310a (0.0450) 0.1756a (0.0454)55 0.3057a (0.0481) -0.3432a (0.0459) -0.4483a (0.0459) -0.1251a (0.0459) 0.1876a (0.0462)56 0.3281a (0.0480) -0.3394a (0.0459) -0.4456a (0.0459) -0.1167b (0.0459) 0.1991a (0.0462)57 0.3385a (0.0493) -0.3339a (0.0474) -0.4413a (0.0474) -0.1114b (0.0473) 0.2075a (0.0474)58 0.3388a (0.0501) -0.3322a (0.0482) -0.4412a (0.0483) -0.1094b (0.0480) 0.2127a (0.0482)59 0.3347a (0.0505) -0.3404a (0.0487) -0.4501a (0.0487) -0.1157b (0.0485) 0.2061a (0.0485)60 0.3525a (0.0532) -0.3220a (0.0506) -0.4328a (0.0506) -0.0964c (0.0505) 0.2263a (0.0506)
a,b,c denote statistical significance at the 0.01, 0.05, and 0.10 levels, respectively, based on a simple t-test.
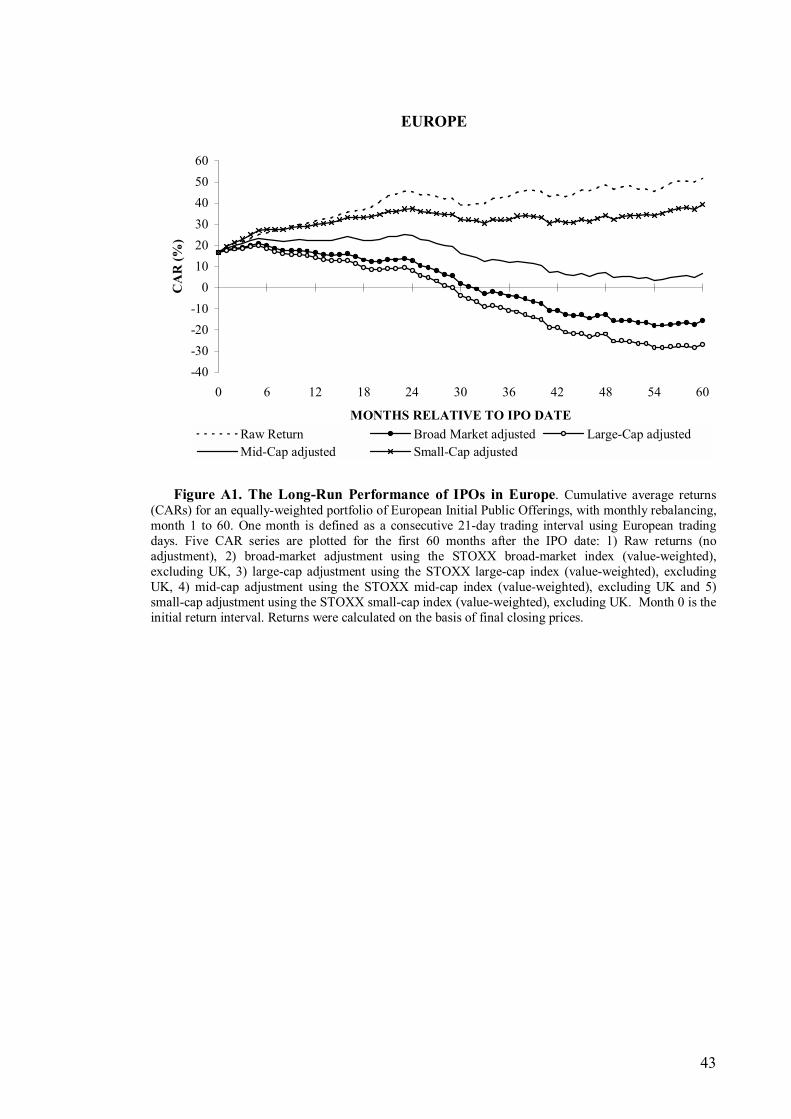
43
EUROPE
-40-30-20-10
0102030405060
0 6 12 18 24 30 36 42 48 54 60
MONTHS RELATIVE TO IPO DATE
CA
R (%
)
Raw Return Broad Market adjusted Large-Cap adjustedMid-Cap adjusted Small-Cap adjusted
Figure A1. The Long-Run Performance of IPOs in Europe. Cumulative average returns
(CARs) for an equally-weighted portfolio of European Initial Public Offerings, with monthly rebalancing, month 1 to 60. One month is defined as a consecutive 21-day trading interval using European trading days. Five CAR series are plotted for the first 60 months after the IPO date: 1) Raw returns (no adjustment), 2) broad-market adjustment using the STOXX broad-market index (value-weighted), excluding UK, 3) large-cap adjustment using the STOXX large-cap index (value-weighted), excluding UK, 4) mid-cap adjustment using the STOXX mid-cap index (value-weighted), excluding UK and 5) small-cap adjustment using the STOXX small-cap index (value-weighted), excluding UK. Month 0 is the initial return interval. Returns were calculated on the basis of final closing prices.